Article

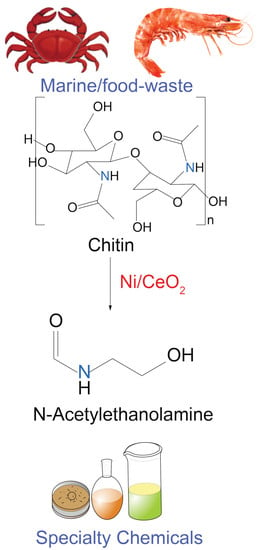
Towards the Efficient Catalytic Valorization of Chitin to N-Acylethanolamine over Ni/CeO2 Catalyst: Exploring the Shape-Selective Reactivity

1
The Institute for Advanced Studies (IAS), Wuhan University, Wuhan 430072, China
2
State Key Laboratory of Magnetic Resonance and Atomic and Molecular Physics, Innovation Academy for Precision Measurement Science and Technology, Chinese Academy of Sciences, Wuhan 430071, China
3
National Research Center for Carbohydrate Synthesis, Jiangxi Normal University, Nanchang 330022, China
*
Authors to whom correspondence should be addressed.
Catalysts 2022, 12(5), 460; https://doi.org/10.3390/catal12050460
Submission received: 14 March 2022 / Revised: 13 April 2022 / Accepted: 13 April 2022 / Published: 20 April 2022
(This article belongs to the Special Issue The Role of Catalysts in Functionalization of C-H and C-C Bonds)

Abstract

:
Global warming and rising waste content collectively accelerate the development of renewable-derived ‘low-carbon’ chemical technologies. Among all abundant renewables, marine-/food-waste-derived chitin, the only nitrogen-containing sustainable biomass, contains the unique N-acetylglucosamine units, which could be synthetically manipulated to a plethora of organonitrogen chemicals. Herein, we report the efficient one-step catalytic valorization of chitin to N-acylethanolamine over cost-effective Ni/CeO2-based materials, which interestingly demonstrate shape-based reactivity based on CeO2 supports. In general, all three catalysts (Ni on cubic-, rod-, and polyhedral-shaped CeO2 supports) were active for this reaction, but they differed in their catalytic efficiency and time-monitored reaction profiles. Herein, Ni on cubic-shaped CeO2 delivered relatively better and stable catalytic performance, along with its rod-shaped counterpart, while the polyhedral CeO2-based material also delivered decent performance. Such interesting catalytic behavior has been corroborated by their physicochemical properties, as revealed by their characterization studies. Herein, to establish an appropriate structure-property-reactivity relationship, multimodal characterization techniques and control mechanistic experiments have been performed. This work demonstrates a concept to reduce the consumption of primary carbon resources and increase the utilization of secondary waste materials to facilitate a smooth transition from a linear economy (cf. cradle-to-grave model) to a circular economy (cf. cradle-to-cradle model).

Graphical Abstract

1. Introduction

Our over-reliance on the linear carbon economy during past decades, i.e., the ‘make-use-dispose’ production model has inevitably led us to a 21st-century problem: waste management [1,2,3]. In particular, food/marine waste valorization has become a challenging task worldwide as a consequence of unprecedented efforts related to alleviating poverty and increasing world population [1,3]. If not appropriately dealt with, food waste would also have a severe environmental impact, since this waste would cause greenhouse gas emissions at the end of its life. Although the Environmental Protection Agency (EPA) has already proposed a hierarchical pyramid model to reduce food waste (Figure 1), the industrial use/recycling of food waste is still extremely scarce. For example, chitin, a popular polysaccharide-based (marine/bio/food) waste, is produced primarily from the shell waste of crabs and shrimps, with an estimated annual production rate of around 1000 billion tons per year [1,4,5,6,7,8]. Such a high (and ever-increasing) amount of waste is indeed impossible to manage as per the EPA protocol without an appropriate recycling plan in the chemical industry (Figure 1a). Therefore, there is an urgent demand to develop an efficient and profitable route to make value-added commodities/chemicals from waste-derived chitin and, hence, to promote the circular carbon economy (i.e., 4Rs model: ‘reduce-reuse-recycle-remove’) [2,4,5].
Chitin is the second most abundant natural polymer after cellulose [8,9]. In addition to the inexpensive and environmentally benign nature of chitin, the existence of nitrogen-containing monomer units in a carbonaceous framework (NAG: N-acetylglucosamine) makes it a potential candidate for high-value valorization in the fine organonitrogen chemical industry [9,10]. Unfortunately, most chitin-based waste is currently being treated or disposed of via composting, landfilling, or incineration (as illustrated in Figure 1a), which carries adverse social, economic, and environmental impacts. To avoid any further damage, we propose in Figure 1a that the chitin-based biowastes must be recycled and transformed into value-added products before the recovery and disposal steps. With this objective, herein, we demonstrate an efficient catalytic valorization strategy: one-step conversion of chitin to N-acylethanolamine (AMEA) over Ni/CeO2-based catalytic materials (Figure 1b). Furthermore, since the current work also addresses the issues related to resource efficiency in waste management and minimizing the environmental impact (via skipping recovery and disposal steps in Figure 1a), the philosophy of the work is fully compatible with the concept of the United Nations’ Circular Carbon Economy, as well as the 2030 Sustainable Development Goals (SDGs) (specifically SDGs 12 and 13) [2].
The research activity towards producing organonitrogen compounds, especially amines, from biomass has been gaining momentum during the last decade [9,10,11]. As displayed in Figure 1b, chitins are constructed by NAG units, which could be utilized as feedstock to produce organonitrogen compounds. Among them, 2-acetamido-2-deoxysorbitol (ADS) and N-acylethanolamine (AMEA) are the two potential target molecules from chitin reported in the literature [9,12,13,14,15,16,17,18]. Herein, ADS resembles a ring-opening product of NAG, while AMEA is an industrially more relevant target molecule due to its potential application in various sectors, including pharmaceuticals, water and fabric treatments, coatings, and gas treatment [9,12,13,14,15,16,17,18]. The transformation to AMEA could be facilitated in the presence of a base under H2 pressure through a retro-aldol reaction. Since the overall reaction from NAG, by default, poses an unselective nature, the employed strategies in the literature contain numerous limitations. Specifically, the catalytic valorization approaches only rely on costly Ru-based catalysts, that too under very high temperature (up to 180 °C) and pressure (up to 40 bar) [9,12,13,14,15,17,19]. Moreover, the obtained yield for the target AMEA product is often low [9,12,13,14,15,17,19]; a maximum 29% N yield is reported using a Ru/C catalyst. In the quest to find a more benign reaction condition using a cheaper heterogeneous catalyst, herein, we report the Ni/CeO2-based material-catalyzed transformation of NAG to AMEA in an aqueous NaHCO3 solution under hydrogen. Herein, we observe that the shape/form of CeO2 has a considerable impact on the efficiency and catalytic profiles, although all three catalysts were active for this reaction. Both rod- (R) and cubic- (C) shaped CeO2 delivered comparable and good results (albeit with different time-dependent catalytic profiles). To understand such an origin of shape-selective reactivity, the multimodal and complementary spectroscopic/analytical techniques have been employed, corroborated by the computational analysis, which collectively revealed that the single-atom/site-type nickel could be installed on the surface of CeO2 by strong coordination interaction. Moreover, this work also sheds light on the mechanistic pathways to establish the structure-property-reactivity relationships of our catalytic system.

2. Results and Discussion

2.1. Catalyst Characterization

The catalyst supports, i.e., rod- (R), cubic- (C), and polyhedral (P)-shaped CeO2, were made via hydrothermal synthesis, and subsequently, supported Ni catalysts were synthesized by the incipient wetness impregnation method [20,21]. Herein, we refer to the experimental section for the detailed synthesis, characterization, and other experimental discussions, as well as Table 1 for the relevant physicochemical and structural properties of the three Ni/CeO2 catalytic materials.
The satisfactory metal loadings were observed in inductively coupled plasma (ICP) studies, and physisorption studies revealed the non-uniform nature of supports (Table 1). Although the BET surface area values of standalone CeO2(R) and CeO2(P) supports were significantly higher than CeO2(C), the BET surface areas of their Ni-impregnated counterparts were comparable to each other. Such a phenomenon is indicative of the fact that both CeO2(R) and CeO2(P) supports plausibly pose a high degree of ‘defects’, where the subsequent loading of metal behaves similarly to ‘doping’ and may reduce the surface area significantly [22]. It also essentially implies that metals could be more exposed to performing catalysis duties over CeO2(C) supports than their counterparts. To shed further light on their individual properties, next, we performed the characterization of all three catalysts using powder X-ray diffraction (PXRD), Raman spectroscopy, and temperature-programmed reduction of hydrogen (H2-TPR) (see Figure 2). The typical cubic fluorite crystal phases (Joint Committee on Powder Diffraction Standards (JCPDS 34-0394) of the CeO2 support could clearly be seen in the PXRD patterns of the Ni/CeO2(R), Ni/CeO2(P), Ni/CeO2(C) (Figure 3a) [23]. The characteristic diffraction peaks at 28.5°, 33.1°, 47.5°, 56.3°, 59.1°, 69.4°, 76.7°, and 79.1° could be attributed to the (1 1 1), (2 0 0), (2 2 0), (3 1 1), (2 2 2), (4 0 0), (3 3 1), and (420) planes of CeO2, respectively [21]. Two additional small peaks at 44.5° and 51.8° belonged to the (111) and (200) crystal planes of Ni with (JCPDS 04-0850), indicating the presence of Ni-based clusters, possibly due to the relatively larger loading of Ni in the resultant catalytic materials. The stronger peak intensity and narrower peak shape in the diffraction of both Ni/CeO2(R) and Ni/CeO2(C), compared to Ni/CeO2(P), implies their higher crystallinity and larger size (Table 1). The XRD-derived average grain sizes of Ni/CeO2(R), Ni/CeO2(P), and Ni/CeO2(C) catalysts were 17.2 nm, 10.8 nm, and 23.9 nm, respectively [24], which were expectedly inversely related to the surface area by BET (see Figure S2 and Table 1): the smaller the grain size, the larger the specific surface area. Herein, Ni/CeO2(P) also had the largest microscopic stress and contained the most defects, while Ni/CeO2(C) had the least defects, plausibly owing to its completely crystalline nature and/or high degree of crystallinity (Table 1). It is worth mentioning that the cubic fluorite structure of CeO2 was well maintained, rather unaffected, upon the addition of Ni onto the CeO2 supports (vide infra for TEM studies, also see Figure 2 and Figure S1). Therefore, the observed small Ni peaks in XRD signify the uneven distribution of Ni in the catalytic materials [25].
Since the oxygen vacancies in CeO2 are always instrumental in catalysis, an effective and non-destructive Raman spectroscopic technique has been performed to characterize oxygen vacancies. As shown in Figure 2b, the CeO2 support has three characteristic peaks: the stronger 462 cm−1 belongs to the F2g vibration of the fluorite CeO2 phase, while 225 cm−1 and 1185 cm−1 are the second-order transverse acoustic mode (2TA bond) and longitudinal optical mode (2LO bond) caused by oxygen vacancies, respectively. Moreover, 600 cm−1 is designated as the defect induction mode, which is caused by oxygen vacancies in the cerium oxide, which indicates the presence of Ce3+ ions in the cerium oxide lattice [21,26,27,28]. After loading of Ni, the intensity of the oxygen vacancy at 1185 cm−1 appears to be decreased due to the strong electron-withdrawing property of Ni, implying the flowing of electrons of the internal oxygen towards the surface [29]. Contrarily, the peak intensity at 600 cm−1 does not change much. However, the Ni/CeO2(P) catalyst poses relatively more oxygen vacancies due to more defects, and thus, the largest peak intensity at 600 cm−1 has been observed. By comparing the intensity ratio of the D and F2g bands (ID/IF2g, see Table 1), we could have an idea about the formation of oxygen vacancies on the catalyst surface because of Ni addition. Both the surface oxygen vacancy and ID/IF2g values are highest on Ni/CeO2(P) and lowest on Ni/CeO2(C), which is indeed consistent with the XRD results. The band attributable to NiO species was not detected, which indicated that metallic Ni dominates over Ni/CeO2 materials [24].
Next, an H2-TPR study was employed to check the reducibility of Ni species over different CeO2 supports to gain an understanding of their suitability during our hydrogenation reaction conditions (Figure 2c). Herein, the H2-TPR response of Ni/CeO2(P) could be deconvolved into four peaks (238.6 °C, 267.2 °C, 270.8 °C, and 420.0 °C), while the other two catalysts could be deconvoluted into three peaks: 213.9 °C, 234.0 °C, and 291.7 °C (Ni/CeO2(C)), as well as 203.1 °C, 218.2 °C, and 256.6 °C (Ni/CeO2(R)) [30,31]. Among the deconvoluted peaks in the Ni/CeO2(R) and Ni/CeO2(C) catalysts, it can be seen that the peak around 203–213 °C is the sharpest with the highest intensity, which is due to the reduction of the adsorbed oxygen species on the catalyst surface and the dissociative adsorption of H2 at the Ni–Ce interface of the catalyst [24]. This is a clear indication that both the Ni/CeO2(R) and Ni/CeO2(C) catalysts could be active options for the catalytic hydrogenation study. Among other deconvoluted peaks, the peaks in the region of around 218–238 °C and 256–292 °C were dedicated to the reduction of surface NiO and larger NiO particles, respectively. The peak at 420.0 °C over the Ni/CeO2(P) material was due to the partial reduction of CeO2, which tends to generate more oxygen vacancies. As also can be further verified in Table 1, oxygen vacancies on the catalyst surface follow the order Ni/CeO2(P) > Ni/CeO2(R) > Ni/CeO2(C) [32] and the BET surface area of standalone CeO2 supports and their Ni-impregnated material follows the order Ni/CeO2(R) ≈ Ni/CeO2(P) > Ni/CeO2(C).
While analyzing the surface properties of the Ni/CeO2(C), Ni/CeO2(P), Ni/CeO2(R) catalysts, X-ray photoelectron spectroscopy (XPS) was employed to investigate the surface chemical components and interactions (Figure 3). The XPS Ce 3d spectra shown in Figure 3a were split into ten peaks, marked as U (U0 − U’’’) and V (V0 − V’’’) for 3d3/2 and 3d5/2 signals, respectively. Since both the Ce 3d3/2 and 3d5/2 responses consist of two Ce ion peaks (Ce3+ and Ce4+), three groups of Ce4+ (marked as u,v; u’’,v’’; and u’’’,v’’’) and two groups of Ce3+ (marked as u0, v0, and u’, v’) could be distinguished. Additionally, the presence of Ce3+ has been also demonstrated to generate oxygen vacancies on the catalyst surface, as also indicated earlier by Raman analysis (Figure 2b). Thus, the concentration of surface oxygen vacancies increases proportionally to the concentration of Ce3+, where trends in the Ce3+ content also follow the order Ni/CeO2(P) > Ni/CeO2(R) > Ni/CeO2(C) (again, consistent with XRD, BET, and Raman results; see Table 1). The peak deconvolution of the O1s XPS spectrum can be fitted to three peaks: the peaks centered at ~529.7 eV (Olat), ~532.6 eV (Osur), and ~533.8 eV (Obon) could be attributed to lattice oxygen species, surface-adsorbed and weakly bonded oxygen species, and chemisorbed species or Ce3+ surface defects on the surface, respectively (Figure 3b) [33,34]. After the metallic doping in Ni/CeO2(R) and Ni/CeO2(P), there is strong chemisorption of oxygen at the interface [35]. In contrast, the nickel in Ni/CeO2(C) interacts weakly with the surface, resulting in the formation of a weaker adsorbed oxygen with nickel at 531.65 eV and a weaker adsorbed oxygen with Ce3+ at 530.12 eV. This is because the oxygen vacancies of the electron-rich structure increase the electron density of lattice oxygen and reduce the binding energy of O1s electrons. Next, there are four peaks in the XPS spectrum of Ni 2p3/2: 852 eV, 854 eV, 856 eV, and 872 eV could be attributed to Ni0, Ni2+, Ni3+, and metallic Ni species, whereas peaks near 861 eV are satellite peaks. According to the integral area, the content of Ni0/Ni2+ and Ni3+ follows the order Ni/CeO2(R) > Ni/CeO2(C) > Ni/CeO2(P), and Ni/CeO2(C) ≈ Ni/CeO2(R) > Ni/CeO2(P), respectively.
Next, (high-resolution) transmission electron microscopy (TEM) was performed to understand the morphological differences among our three catalysts (Figure 4 and Figure 5). Herein, the standalone CeO2(C) displayed uniform cubic characteristics with diameters of 10–30 nm surrounded by (110) crystal planes [21]. Similarly, CeO2(P) and CeO2(R) expectedly demonstrated polyhedron (diameter ca. 10 − 20 nm, mainly the (110) plane of the CeO2 lattice fringe) and highly uniform rod morphology (diameter ca. 8 nm, and a length of 20 − 200 nm, mainly the (100) and (110) planes of the CeO2 lattice fringe), respectively. Upon impregnation of Ni, the edge of the CeO2(C) crystal becomes blurred because metallic Ni is situated/migrated towards the edge of the crystals (green circles in Figure 4h,i) [28,36]. It can be hypothesized that the usual spherical nanoparticles were not formed on cubic crystals, possibly due to their small length, while spherical NiO nanoparticles could rather be observed on longer-length CeO2(R) crystals. Since the content of defects is relatively large on CeO2(R) crystals, the catalytically active sites of spherical metallic Ni nanoparticles could possibly be inaccessible for the catalytic exploration [23]. Since Ni on CeO2(C) was situated at the edge, it can effectively prevent clustering [27]. However, the metallic feature on CeO2(P) crystals is more like edge-earth-shaped nanoparticles, and lacks a three-dimensional structure [37]. The dispersion of Ni on Ni/CeO2(P) is relatively more uniform, which may be because Ni/CeO2(P) contains more oxygen vacancies. However, EDS mapping suggested that Ni-based nanoparticles are not uniformly distributed over CeO2 supports, and there are indications of clustering. Herein, it should be emphasized that Ni-based particles are primarily supported on CeO2 as it can easily be rationalized by their non-identical physicochemical profiles, especially in the H2-TPR, Raman, and XPS characterization studies (Figure 2 and Figure 3). The unique interaction between metal and support can be observed through the applied characterizations in this work. Hence, we can exclude the possibility of physical mixing between metals and supports, at least not pre-dominant in the current study, where metal nanoparticles are primarily supported on CeO2 supports. The electrons of the oxygen vacancies can be transferred to Ni ions [29], which makes the interaction between the metal and support stronger. In addition, the nature of such an interaction is unique over differently shaped/formed CeO2 supports, which has also been reflected in their catalytic performance (vide infra).

2.2. Catalysis: Chitin Valorization

After our in-depth characterizations, we screened all three freshly synthesized materials for the valorization of chitin: degradation of NAG to N-acetylethanolamine under hydrogen pressure. Typically, all three catalysts were active for this reaction, but their efficiency and time-dependent phenomena were non-identical. Herein, our Ni/CeO2(C) catalyst could deliver a relatively higher yield (up to 42% N yield after 8 h) (Figure 6 and Table S1) [38], whereas Ni/CeO2(R) and Ni/CeO2(P) delivered yields up to 34% and 23% after 8 h. As mentioned before, to date, the Ru/C catalyst has shown the best activity in a 29% yield (Table S2) [18,38]. To provide further insight, the time-monitored catalytic data for all three catalysts are presented in Figure 6. Herein, the relatively higher and more stable reactive nature of the Ni/CeO2(C) catalyst could easily be rationalized in terms of its ~40% yield within just two hours prior to its labeling off and reaching its maximum of 42% at 8 h. Next, the Ni/CeO2(R) catalyst had a slow start to the reaction, delivering <15% yield until four hours, before reaching the maximum 42% yield at 6 h. Contrarily, the Ni/CeO2(P) catalyst was the better among all three catalysts during the early phases of the reaction, delivering ~25% yield just after 30 min, before reaching the maximum 38% yield at 6 h. To emphasize the efficiency of our catalytic protocols, the same reaction was screened in the presence of numerous popular heterogeneous catalysts (mostly Ni-based; see Tables S1 and S2). Herein, Ni/CeO2-based materials represent a more suitable catalyst option for this reaction, which prompted us to perform the mechanistic investigation using a few control experiments and computational analysis (see Supplementary Materials, Figure S6).

2.3. Catalysis: Reaction Mechanism

It is worth mentioning that the valorization or degradation of chitin is not a unimolecular reaction; instead, it contains numerous reversible reactions. Therefore, a slight increase/decrease in yield over time could be attributed to such a complex reaction network during the degradation of chitin. This ‘up-and-down’ feature of the target product yield over time is common and has also been reported before [15,17,19]. The analogous time-monitored NAG conversion study performed by Bobbink et al., also revealed a similar ‘up-and-down’ yield nature over time for the formation of N-acylethanolamine and other products over Ru/C catalysts [17]. Therefore, our observation is not unique, and instead supports existing hypotheses in this field. The overall reaction network is indeed complex, sensitive to the applied reaction conditions and the existence of multiple parallel reaction pathways leading to different products, which collectively could be responsible for such ‘up-and-down’ nature of the target product over time [15,17,19]. During the degradation under hydrogen pressure, NAG initially undergoes a retro-aldol condensation reaction to produce 2-acetamidoacetaldehyde and erythrose [15,39,40]; the former is then hydrogenated to N-acetylethanolamine (I) over a Ni catalyst [41,42] (Pathway A in Scheme 1). The formation of the product has also been confirmed by high-resolution mass spectrometry (Figure S3). However, we could not detect the erythritol product in our work by any analytical/spectroscopic tool, which indicates the possibility of a secondary route during the degradation of NAG. During our mass spectrometric analysis, several side products, 2-acetamido-2-deoxysorbitol (ADS) and polyols (II: butane-1,2,3-triol; III: butane-1,2-diol), were also identified (see Figure S3) [15,19]. The formation of ADS indicated the direct transformation of the NAG route (Pathway B in Scheme 1), followed by C–C bond cleavage to give our desired product, N-acetylethanolamine (I). Simultaneously, the existence of polyols indicates the dehydroxylation/ hydrodeoxygenation from ADS along with C–C cleavage, where both nickel and ceria were reported to have a promotional effect [43,44]. Among them, butane-1,2,3-triol (II) was identified by NMR as well (Figure S4). The lack of identification of erythritol is not surprising because such sugar-based alcohol could undergo hydrogenolysis under our reaction conditions to smaller molecular fragments, especially over Ni-based catalytic materials [17,45,46,47]. Moreover, we performed a control reaction, where we used erythritol directly as a substrate under our optimized reaction conditions, which did not deliver any product, indicating that dehydroxylation/hydrodeoxygenation seems feasible only from the ADS fragment under our reaction conditions. Therefore, Pathway B might have a preference over Pathway A over Ni-based catalysts. It is worth mentioning that both Ni and CeO2 were collectively influential for catalysis, as no yield was noted in the absence of a catalyst or solely using a CeO2 support, while Ni on other heterogenous supports led to a lower yield (Table S1).
In this work, shape/form-based reactivity differences have been demonstrated for the valorization of chitin-derived molecules. For the sake of comparison, it is worth noting that such shape-based reactivity of CeO2 supports has previously been reported in different heterogeneous catalysis reactions. For example, Yao et al., utilized three different morphologies of CeO2 (spheres, rods, and cubes) as supports for Cu to utilize them in catalytic water-gas shift reactions [48]. Herein, the CuO/CeO2 (spheres) catalyst was the most active and stable among the three studied catalysts. The activity of CuO/CeO2 (rods) was slightly lower than that of CuO/CeO2 (spheres), but with poor stability, whereas CuO/CeO2 (cubes) have poor activity and moderate stability. Next, Cao et al., explored CeO2 cubes and rods to demonstrate the form-dependent CeO2 catalysis in the acetylene semi-hydrogenation reaction, where the catalytic performance follows the order: rod-CeO2-500 ℃ ≫ cube-CeO2 > rod-CeO2-700 ℃ (cf. 500 ℃/700 ℃ is annealing temperature) [49]. Similarly, Fan et al., synthesized 2 wt% Pd loaded over rod-CeO2, cube-CeO2, and polyhedron-CeO2 for the hydrogenation of CO to formate, where the following order was observed during the catalysis: rods > cubes > polyhedral [50]. Then, Li et al., prepared CeO2 with different morphologies (nanorods, nanopolyhedra, and nanocubes) and then loaded WO3 for the NH3-selective catalytic reduction reaction, where WO3/CeO2 nanorods exhibited the best catalytic performance [51]. It is clear that such shape-selective reactivity is typical for different classes of heterogeneous catalysis reactions involving CeO2 as a catalyst support. However, there is no apparent preference for any particular shape to have superior reactivity; instead, different forms or shapes deliver different reactivity in different reactions. Hence, such shape-based reactivity possibly could be derived from the physicochemical properties of the material during the catalysis. To rationalize our catalysis results, we refer to the characterization sections. For example, the relatively lower first reduction temperature on Ni/CeO2(C) and Ni/CeO2(R) materials (Figure 2c) possibly signifies their higher susceptibility to the hydrogenation reaction conditions compared to Ni/CeO2(P) material, which also has been reflected in their catalytic performance. Similarly, oxygen vacancies on the catalyst surface and ID/IF2g values follow the order Ni/CeO2(P) > Ni/CeO2(R) > Ni/CeO2(C) [32] and the BET surface area of standalone CeO2 supports and their Ni-impregnated material follows the order Ni/CeO2(R) ≈ Ni/CeO2(P) > Ni/CeO2(C) (Table 1). Therefore, this suggests that high susceptibility to reduction, lower oxygen vacancies, and a lower surface area were the three most favorable factors for the Ni/CeO2(C) catalyst to deliver relatively superior and stable catalytic performance.

3. Materials and Methods

3.1. Materials

All chemicals and materials were purchased in the highest purity grade available from commercial suppliers and used without further purification: NAG (N-acetylglucosamine) (Beat, Shanghai, China, 97%), NaOH (Sinopharm, Shanghai, China, 96%), Ce(NO3)3∙6H2O (Innochem, Beijing, China, 99.99%-Ce), Ni(NO3)2∙6H2O (Aladdin, Shanghai, China, 98%-Ni), NaHCO3 (Sinopharm, Shanghai, China, 99.5%), D2O (Innochem, Beijing, China, for NMR, 99.9 atom% D), N-Acetylethanolamine (Alfa Aesar, Shanghai, China, > 90%), meso-erythritol (9 Ding Chemistry, Shanghai, China, 99%), maleic acid (Innochem, Beijing, China, 99.99%), Ir/C catalyst (KaiDa, Shanxi, Ir weight content of 5.0%, purity > 99.9%), Ru/C catalyst (KaiDa, Shanxi, China, Ru weight content of 5.0%), Pd/C catalyst (KaiDa, Shanxi, Pd weight content of 10.0%), and Pt/C catalyst (KaiDa, Shanxi, China, Pt weight content of 5.0%).

3.2. Synthesis of CeO2 Supports

Three different forms of CeO2 supports have been synthesized in this work: Ni/CeO2(R), Ni/CeO2(P), and Ni/CeO2(C) represent that the CeO2 support is rod-shaped, polyhedral, and cubic, respectively. The CeO2(R), CeO2(P), and CeO2(C) supports were synthesized by a hydrothermal method, analogous to literature reports [20,21]. Briefly, 0.868 g of Ce(NO3)3∙6H2O and an appropriate amount of NaOH (0.016–0.96 g) were dissolved in 5 and 35 mL of deionized water, respectively. Then, these two solutions were mixed in a Teflon bottle, and the resultant mixture was stirred for around 30 min until the formation of a milky slurry. Then, the mixture-containing Teflon bottle was inserted into a stainless-steel vessel autoclave, and the autoclave was sealed tightly. Finally, the autoclave was transferred into a static electric oven, and was subjected to hydrothermal treatment at temperatures in the range of 100–180 °C (see Table S3) for 24 h. Afterward, a thorough workup was performed by centrifugation and washing several times with deionized water and ethanol, until a neutral pH was achieved. Finally, the material was dried at 60 °C overnight, which delivered a yellow powder of CeO2.

3.3. Synthesis of Ni/CeO2 Catalysts

Ni/CeO2 catalysts were prepared by the wet impregnation method [52]. Typically, 0.1781 g Ni(NO3)2·6H2O was dissolved in 0.5 mL deionized water and then 0.3594 g CeO2 nanocrystals were added. The mixture was stirred for 6 h, then dried at 100 °C for 4 h, and next calcined in a muffle oven (at 3 °C /min, 450 °C for 4 h). Finally, we placed it in a tube furnace (10 vol.% H2/Ar at 3 °C /min, 450 °C) for 4 h to obtain a brown powder of Ni/CeO2 catalyst.

3.4. Instrumentation and Characterization

The high-pressure batch reactors were purchased from (PARR Instrument Company, St. Moline, IL, USA, 0.3 L). Gas chromatographic analyses were performed on SHIMADZU GC-2014 gas chromatography instrument (Shimadzu Corp., Kyoto, Japan) with an FID detector and biphenyl was added as an internal standard. GC-MS spectra were recorded on a SHIMADZU GC MS-2010. 1H and 13C NMR data were recorded with Bruker Advance III (400 MHz) spectrometers (Bruker, Karlsruhe, Germany) with maleic acid as an internal standard for the quantification. All chemical shifts (δ) are reported in ppm. All chemical shifts are reported relative to tetramethylsilane or D2O peaks, where applicable. Powder X-ray diffraction (XRD) analysis was performed on Bruker’s D8 ADVANCE X diffractometer (Bruker, Karlsruhe, Germany) using a Cu Kα radiation source (λ = 0.154 nm). Diffraction patterns were collected in the 2θ range between 10° and 80° with a step size of 4°/min. The lattice constant and average grain size of the catalyst were analyzed using JADE software (MDI Jade 6, Materials Data Inc., Livermore, CA, USA) to analyze the recorded data. HRTEM images were obtained using Tecnai G3 F30 S-TWIN (USA FEI Company, Hillsboro, OR, USA). Sample preparation: Use a dropper to suck a small amount of solid powder into a centrifuge tube, drop in ethanol for dispersion, sonicate for around 15 min, and then disperse evenly; then, use a dropper to suck a small amount of dispersion liquid and drop it on a 230-mesh ordinary carbon film. It can be air-dried. Take a shot. Place the prepared carbon film on the double-tilted sample rod and insert it into the transmission electron microscope. After the mechanical pump is vacuumed, insert the sample and take a picture. Transmission electron microscope parameters: accelerating voltage—300 kv. Turn on the filament, insert the camera to take a picture, and zoom in to different magnifications to take a picture. EDS mapping: The goniometer is rotated 15°, and the designated area is selected for EDS mapping shooting; after switching to STEM mode, the HAADF probe is inserted, the corresponding shooting position is found, and the shooting is performed, and the corresponding image signal is collected after the energy spectrum is scanned. The area of the single-point Brunauer-Emmett-Teller (BET) curved catalyst is measured by nitrogen physical adsorption (ASAP 2460). Before the measurement, the sample is degassed under vacuum at 200 °C for 4 h. Hydrogen temperature program reduction (H2-TPR) was performed using an AutoChem II 2920 chemical adsorption analyzer (Micromeritics, Norcross, GA, USA). Approximately 100 mg of the powder sample was placed in a U-shaped quartz tube, and then a clean surface was obtained with Ar at 110 °C for 1 h, and the sample was heated from 25 °C to 700 °C at a heating rate of 10 °C/min. Pass 10 vol% H2-90 vol% Ar gas mixture (50 mL/min) through the sample tube. Cu2O was used as a reference standard for calibrating the peak area of the TPR curve. Based on the peak area of the calibrated TPR curve, quantitative H2 was used to calculate the consumption of the catalyst. The Raman test of the catalyst adopted the Raman spectrometer of Renishaw inVia Company (Gloucestershire, UK). Use 532 nm and 325 nm lasers to measure at least 3 different places in each sample. The electron paramagnetic resonance (EPR) of the catalyst was detected by an electron paramagnetic resonance instrument ((Bruker, Karlsruhe, Germany, A300-10/12), and the oxygen vacancy of the material can be detected at low temperatures. ICP-OES analysis was performed on the Agilent ICPOES730 instrument (Santa Clara, CA, USA). Before the test, the sample was dried to achieve constant weight, and then the accurately weighed sample was subjected to the typical acid dissolution method to measure the content of Ni and Ce in the sample. X-ray photoelectron spectroscopy (XPS) was performed using a non-monochromatic Thermo ESCALAB 250Xi X spectrometer (Waltham, MA, USA) to generate Al Kα radiation (hν = 1486.6 eV) (10 – 10 Torr) under ultra-high vacuum. The effect of charging was corrected relative to the carbon peak C 1s (284.8 eV). The deconvolution of the peak spectrum was performed by XPSPEAK41 software [26], using Gaussian-Lorentzian linear and Shirley background subtraction.

3.5. Catalytic Tests

In a typical catalytic screening, NAG (66.1 mg, 0.3 mmol), the catalytic material (e.g., 10 wt% Ni/CeO2 catalyst, 15 mg), magnetic stirrer, NaHCO3 (25.2 mg, 0.3 mmol), and distilled water (5 mL) were taken together into a 20 mL glass reaction tube, and then inserted into a high-pressure batch reactor. After the proper sealing of the batch reactor, H2 gas was flushed slowly 3 times to remove residual air from the inside of the reactor. Next, the batch reactor was subjected to 4 MPa H2, and heated to 393 K. The reaction was carried out for an appropriate time, as mentioned while discussing catalytic results. After the reaction, the autoclave (PARR Instrument Company, St. Moline, IL USA, 0.3 L) was cooled to room temperature and the pressure was released slowly. Finally, the catalyst was separated from the solution via centrifugation. Rotary evaporation of the solution at 60 °C was used to obtain the product, and the product was analyzed and/or quantified by NMR (D2O as solvent), using maleic acid as an internal standard. The same post-reacted solution was also analyzed by GC or MS for the mechanistic studies [15,53].

4. Conclusions

In summary, we have demonstrated the one-step catalytic valorization of chitin to N-acylethanolamine over cheaper Ni/CeO2-based materials, which led to the higher reactivity of this reaction. In addition, we also have explored the impact of the shape-based reactivity of three different CeO2 supports: cubic, rod, and polyhedral. Typically, all three catalysts were active for this reaction, yet their efficiency and time-monitored profile differed due to their inherent physicochemical differences. Herein, Ni on cubic-shaped CeO2 delivered relatively better and stable catalytic performance, whereas its rod-based counterpart was not much behind either. The Ni/CeO2(C) catalyst had its best yield at a longer reaction time (8 h), while Ni/CeO2(R) and Ni/CeO2(P) delivered comparable activities after 6 h. Moreover, an interesting ‘up-and-down’ time-dependent catalysis profile was also noted for all three catalytic systems, implying the complex nature of the reaction network, which is also consistent with the prior literature status for this reaction. The catalysis aspect of this work has been well integrated by the multimodal and complementary spectroscopic/analytical techniques, control experiments, and computational analysis. Therefore, appropriate structure-property-reactivity relationships have been evaluated to rationalize both the pros and cons of the different catalytic materials. This work demonstrates a reliable and efficient way to valorize waste bio-based materials to value-added organic raw material, strengthening the current initiatives on the circular carbon economy.

Supplementary Materials

The following supporting information can be downloaded at: https://www.mdpi.com/article/10.3390/catal12050460/s1, Figure S1: HRTEM images of standalone (a) CeO2(C), (b) CeO2(P), and (c) CeO2(R) supports and TEM images of three catalysts: (d, g) Ni/CeO2(C), (e, h) Ni/CeO2(P), and (f, i) Ni/CeO2(R); Figure S2: The physical adsorption spectrum of the catalyst; Figure S3: MS spectra of crude reaction mixture: (a) N-(1,4,5,6-tetrahydroxyhexan-2-yl)acetamide, (b) N-acetylethanolamine, (c) butane-1,2-diol, and (d) butane-1,2,3-triol; Figure S4: Typical 1H-NMR (top) and 13C-NMR (bottom) spectra of the product after the reaction (reaction conditions: 1 g NAG, 15 mg catalyst, 5 mL H2O solvent, 40 bar H2 pressure, 120 °C temperature, 6 h reaction time). The crude product was not purified. The illustration is 2H-NMR in the inset (reaction conditions: 1 g NAG, 15 mg catalyst, 5 mL D2O solvent, 40 bar H2 pressure, 120 °C temperature, 6 h reaction time); Figure S5: (a) XRD patterns, XPS (b) Ce 3d, (c) O 1s, and (d) Ni 3d spectra of Ni/CeO2(C)-f, Ni/CeO2(C)-r catalytic materials. (e) and (f) EPR spectra of CeO2(R), CeO2(P), CeO2(C), and Ni/CeO2(R), Ni/CeO2(P), and Ni/CeO2(C) catalytic materials; Figure S6: Geometrical structures of (a) CeO2 (110) surface and (b) Ni-assembled CeO2 (110) surface. Electronic Localization Function of (a) CeO2 (110) surface and (b) Ni-assembled CeO2 (110) surface. Atoms in green: Ce, red: O, gray: Ni. Table S1: The catalytic screening: The comparison study; Table S2: The representative comparison of catalytic performance of the conversion of N-acetylglucosamine to different target products over different catalysts [19,54,55,56,57]. Table S3. Several CeO2 sample conditions.

Author Contributions

Conceptualization, A.D.C.; methodology, Y.Z. and L.L.; all experiments, Y.Z.; computational analysis, W.C. and A.Z.; validation, Y.Z.; data analysis, Y.Z. and A.D.C.; writing—original draft preparation, Y.Z., W.C., and A.D.C.; writing—review and editing, Y.Z. and A.D.C.; supervision, reviewing and editing, A.Z., A.L., and A.D.C. All authors have read and agreed to the published version of the manuscript.

Funding

The authors gratefully acknowledge the financial support from the National Natural Science Foundation of China (No. 22050410276 to A.D.C.) and the start-up research grant from Wuhan University (China) (to A.D.C.).

Data Availability Statement

All data generated or analyzed during this study are included in this manuscript and its supplementary material files.

Conflicts of Interest

The authors declare that they have no known competing financial interests or personal relationships that could have appeared to influence the work reported in this paper.

References

  1. Yan, N.; Chen, X. Sustainability: Don’t waste seafood waste. Nature 2015, 524, 155–157. [Google Scholar] [CrossRef] [PubMed]
  2. Stahel, W.R. The circular economy. Nature 2016, 531, 435–438. [Google Scholar] [CrossRef] [PubMed] [Green Version]
  3. Hood, B. Make recycled goods covetable. Nature 2016, 531, 438–440. [Google Scholar] [CrossRef] [PubMed] [Green Version]
  4. Hülsey, M.J. Shell biorefinery: A comprehensive introduction. Green Energy Environ. 2018, 3, 318–327. [Google Scholar] [CrossRef]
  5. Chen, X.; Yang, H.; Yan, N. Shell Biorefinery: Dream or Reality? Chemistry 2016, 22, 13402–13421. [Google Scholar] [CrossRef]
  6. Duan, B.; Huang, Y.; Lu, A.; Zhang, L. Recent advances in chitin based materials constructed via physical methods. Prog. Polym. Sci. 2018, 82, 1–33. [Google Scholar] [CrossRef]
  7. Huang, J.; Zhong, Y.; Zhang, L.; Cai, J. Extremely Strong and Transparent Chitin Films: A High-Efficiency, Energy-Saving, and “Green” Route Using an Aqueous KOH/Urea Solution. Adv. Funct. Mater. 2017, 27, 1701100. [Google Scholar] [CrossRef]
  8. Kurita, K. Chitin and Chitosan: Functional Biopolymers from Marine Crustaceans. Mar. Biotechnol. 2006, 8, 203–226. [Google Scholar] [CrossRef]
  9. Dai, J.; Li, F.; Fu, X. Towards Shell Biorefinery: Advances in Chemical-Catalytic Conversion of Chitin Biomass to Organonitrogen Chemicals. ChemSusChem. 2020, 13, 6498–6508. [Google Scholar] [CrossRef]
  10. Pelckmans, M.; Renders, T.; Van de Vyver, S.; Sels, B.F. Bio-based amines through sustainable heterogeneous catalysis. Green Chem. 2017, 19, 5303–5331. [Google Scholar] [CrossRef]
  11. Maschmeyer, T.; Luque, R.; Selva, M. Upgrading of marine (fish and crustaceans) biowaste for high added-value molecules and bio(nano)-materials. Chem. Soc. Rev. 2020, 49, 4527–4563. [Google Scholar] [CrossRef] [PubMed]
  12. Sagawa, T.; Kobayashi, H.; Murata, C.; Shichibu, Y.; Konishi, K.; Fukuoka, A. Catalytic Conversion of a Chitin-Derived Sugar Alcohol to an Amide-Containing Isosorbide Analog. ACS Sustain. Chem. Eng. 2019, 7, 14883–14888. [Google Scholar] [CrossRef]
  13. Sagawa, T.; Kobayashi, H.A. Fukuoka, Effect of Lewis acid on catalytic dehydration of a chitin-derived sugar alcohol. Mol. Catal. 2020, 498, 111282. [Google Scholar] [CrossRef]
  14. Yabushita, M.; Kobayashi, H.; Kuroki, K.; Ito, S.; Fukuoka, A. Catalytic Depolymerization of Chitin with Retention of N-Acetyl Group. ChemSusChem 2015, 8, 3760–3763. [Google Scholar] [CrossRef] [Green Version]
  15. Kobayashi, H.; Techikawara, K.; Fukuoka, A. Hydrolytic hydrogenation of chitin to amino sugar alcohol. Green Chem. 2020, 19, 3350–3356. [Google Scholar] [CrossRef] [Green Version]
  16. Verduyckt, J.; Coeck, R.; De Vos, D.E. Ru-Catalyzed Hydrogenation–Decarbonylation of Amino Acids to Bio-based Primary Amines. ACS Sustain. Chem. Eng. 2017, 5, 3290–3295. [Google Scholar] [CrossRef]
  17. Bobbink, F.D.; Zhang, J.; Pierson, Y.; Chen, X.; Yan, N. Conversion of chitin derived N-acetyl-d-glucosamine (NAG) into polyols over transition metal catalysts and hydrogen in water. Green Chem. 2015, 17, 1024–1031. [Google Scholar] [CrossRef]
  18. Xie, S.; Jia, C.; Go Ong, S.S.; Wang, Z.; Zhu, M.-j.; Wang, Q.; Yang, Y.; Lin, H. A Shortcut Route to Close Nitrogen Cycle: Bio-Based Amines Production via Selective Deoxygenation of Chitin Monomers over Ru/C in Acidic Solutions. iScience 2020, 23, 101096. [Google Scholar] [CrossRef]
  19. Techikawara, K.; Kobayashi, H.; Fukuoka, A. Conversion of N-Acetylglucosamine to Protected Amino Acid over Ru/C Catalyst. ACS Sustain. Chem. Eng. 2018, 6, 12411–12418. [Google Scholar] [CrossRef]
  20. Mai, H.-X.; Sun, L.-D.; Zhang, Y.-W.; Si, R.; Feng, W.; Zhang, H.-P.; Liu, H.-C.; Yan, C.-H. Shape-Selective Synthesis and Oxygen Storage Behavior of Ceria Nanopolyhedra, Nanorods, and Nanocubes. J. Phys. Chem. B 2005, 109, 24380–24385. [Google Scholar] [CrossRef]
  21. Zhang, X.; You, R.; Li, D.; Cao, T.; Huang, W. Reaction Sensitivity of Ceria Morphology Effect on Ni/CeO2 Catalysis in Propane Oxidation Reactions. ACS Appl. Mater. Interfaces. 2017, 9, 35897–35907. [Google Scholar] [CrossRef] [PubMed]
  22. Ott, J.; Pasanen, T.P.; Gädda, A.; Garín, M.; Rosta, K.; Vähänissi, V.; Savin, H. Impact of doping and silicon substrate resistivity on the blistering of atomic-layer-deposited aluminium oxide. Appl. Surf. Sci. 2020, 522, 146400. [Google Scholar] [CrossRef]
  23. Li, P.; Dong, R.; Jiang, X.; Zhang, S.; Liu, T.; Wang, R.; Yan, F.; Fu, D. The effect of CeO2 morphology on the electrochemical performance of the reversible solid oxide cells. J. Electroanal. Chem. 2020, 873, 114513. [Google Scholar] [CrossRef]
  24. Chen, D.; Ma, Q.; Wei, L.; Li, N.; Shen, Q.; Tian, W.; Zhou, J.; Long, J. Catalytic hydroliquefaction of rice straw for bio-oil production using Ni/CeO2 catalysts. J. Anal. Appl. Pyrolysis 2018, 130, 169–180. [Google Scholar] [CrossRef]
  25. Greluk, M.; Gac, W.; Rotko, M.; Słowik, G.; Turczyniak-Surdacka, S. Co/CeO2 and Ni/CeO2 catalysts for ethanol steam reforming: Effect of the cobalt/nickel dispersion on catalysts properties. J. Catal. 2021, 393, 159–178. [Google Scholar] [CrossRef]
  26. Li, J.; Liu, Z.; Cullen, D.A.; Hu, W.; Huang, J.; Yao, L.; Peng, Z.; Liao, P.; Wang, R. Distribution and Valence State of Ru Species on CeO2 Supports: Support Shape Effect and Its Influence on CO Oxidation. ACS Catal. 2019, 9, 11088–11103. [Google Scholar] [CrossRef]
  27. Rui, N.; Zhang, X.; Zhang, F.; Liu, Z.; Cao, X.; Xie, Z.; Zou, R.; Senanayake, S.D.; Yang, Y.; Rodriguez, J.A.; et al. Highly active Ni/CeO2 catalyst for CO2 methanation: Preparation and characterization. Appl. Catal. B Environ. 2021, 282, 119581. [Google Scholar] [CrossRef]
  28. Zhang, C.; Zhang, W.; Drewett, N.E.; Wang, X.; Yoo, S.J.; Wang, H.; Deng, T.; Kim, J.G.; Chen, H.; Huang, K.; et al. Integrating Catalysis of Methane Decomposition and Electrocatalytic Hydrogen Evolution with Ni/CeO2 for Improved Hydrogen Production Efficiency. ChemSusChem 2019, 12, 1000–1010. [Google Scholar] [CrossRef]
  29. Liu, B.; Yan, Z.; Xu, T.; Wang, J.; Li, C.; Gao, R.; Bai, J. Promoting electron transfer of surface oxygen vacancies in Pd/CeO2-RE via doping engineering for enhancing catalytic activity in Suzuki coupling reaction. J. Catal. 2021, 399, 15–23. [Google Scholar] [CrossRef]
  30. Zhou, G.; Liu, H.; Cui, K.; Jia, A.; Hu, G.; Jiao, Z.; Liu, Y.; Zhang, X. Role of surface Ni and Ce species of Ni/CeO2 catalyst in CO2 methanation. Appl. Surf. Sci. 2016, 383, 248–252. [Google Scholar] [CrossRef]
  31. Sepehri, S.; Rezaei, M.; Wang, Y.; Younesi, A.; Arandiyan, H. The evaluation of autothermal methane reforming for hydrogen production over Ni/CeO2 catalysts. Int. J. Hydrog. Energy. 2018, 43, 22340–22346. [Google Scholar] [CrossRef]
  32. Shafaghat, H.; Tsang, Y.F.; Jeon, J.-K.; Kim, J.M.; Kim, Y.; Kim, S.; Park, Y.-K. In-situ hydrogenation of bio-oil/bio-oil phenolic compounds with secondary alcohols over a synthesized mesoporous Ni/CeO2 catalyst. Chem. Eng. J. 2020, 382, 122912. [Google Scholar] [CrossRef]
  33. Poolwong, J.; Del Gobbo, S.; D’Elia, V. Transesterification of dimethyl carbonate with glycerol by perovskite-based mixed metal oxide nanoparticles for the atom-efficient production of glycerol carbonate. J. Ind. Eng. Chem. 2021, 104, 43–60. [Google Scholar] [CrossRef]
  34. Zhang, X.; Li, K.; Shi, W.; Wei, C.; Song, X.; Yang, S.; Sun, Z. Baize-like CeO2 and NiO/CeO2 nanorod catalysts prepared by dealloying for CO oxidation. Nanotechnology 2016, 28, 045602. [Google Scholar] [CrossRef] [PubMed]
  35. Dong, F.; Meng, Y.; Han, W.; Zhao, H.; Tang, Z. Morphology effects on surface chemical properties and lattice defects of Cu/CeO2 catalysts applied for low-temperature CO oxidation. Sci. Rep. 2019, 9, 12056. [Google Scholar] [CrossRef] [PubMed] [Green Version]
  36. Kimura, T.; Miyazawa, T.; Nishikawa, J.; Kado, S.; Okumura, K.; Miyao, T.; Naito, S.; Kunimori, K.; Tomishige, K. Development of Ni catalysts for tar removal by steam gasification of biomass. Appl. Catal. B Environ. 2006, 68, 160–170. [Google Scholar] [CrossRef]
  37. Florea, I.; Feral-Martin, C.; Majimel, J.; Ihiawakrim, D.; Hirlimann, C.; Ersen, O. Three-Dimensional Tomographic Analyses of CeO2 Nanoparticles. Cryst. Growth Des. 2013, 13, 1110–1121. [Google Scholar] [CrossRef]
  38. Liu, X.; Liu, X.; Xu, G.; Zhang, Y.; Wang, C.; Lu, Q.; Ma, L. Highly efficient catalytic conversion of cellulose into acetol over Ni–Sn supported on nanosilica and the mechanism study. Green Chem. 2019, 21, 5647–5656. [Google Scholar] [CrossRef]
  39. Yan, N.; Wang, Y. Catalyst: Is the Amino Acid a New Frontier for Biorefineries? Chem 2019, 5, 739–741. [Google Scholar] [CrossRef] [Green Version]
  40. Zhang, L.; Shang, N.; Gao, S.; Wang, J.; Meng, T.; Du, C.; Shen, T.; Huang, J.; Wu, Q.; Wang, H.; et al. Atomically Dispersed Co Catalyst for Efficient Hydrodeoxygenation of Lignin-Derived Species and Hydrogenation of Nitroaromatics. ACS Catal. 2020, 10, 8672–8682. [Google Scholar] [CrossRef]
  41. Dai, J.; Gözaydın, G.; Hu, C.; Yan, N. Catalytic Conversion of Chitosan to Glucosaminic Acid by Tandem Hydrolysis and Oxidation. ACS Sustain. Chem. Eng. 2019, 7, 12399–12407. [Google Scholar] [CrossRef]
  42. Ferhan, M.; Tanguy, N.; Yan, N.; Sain, M. Comparison of Enzymatic, Alkaline, and UV/H2O2 Treatments for Extraction of Beetle-Infested Lodgepole Pine (BILP) and Aspen Bark Polyphenolic Extractives. ACS Sustain. Chem. Eng. 2014, 2, 165–172. [Google Scholar] [CrossRef]
  43. Lindfors, C.; Mäki-Arvela, P.; Paturi, P.; Aho, A.; Eränen, K.; Hemming, J.; Peurla, M.; Kubička, D.; Simakova, I.L.; Murzin, D.Y. Hydrodeoxygenation of Isoeugenol over Ni- and Co-Supported Catalysts. ACS Sustain. Chem. Eng. 2019, 7, 14545–14560. [Google Scholar] [CrossRef] [Green Version]
  44. Mukherjee, D.; Singuru, R.; Venkataswamy, P.; Damma, D.; Reddy, B.M. Ceria Promoted Cu-Ni/SiO2 Catalyst for Selective Hydrodeoxygenation of Vanillin. ACS Omega. 2019, 4, 4770–4778. [Google Scholar] [CrossRef] [PubMed] [Green Version]
  45. Ooms, R.; Dusselier, M.; Geboers, J.A.; Op de Beeck, B.; Verhaeven, R.; Gobechiya, E.; Martens, J.A.; Redl, A.; Sels, B.F. Conversion of sugars to ethylene glycol with nickel tungsten carbide in a fed-batch reactor: High productivity and reaction network elucidation. Green Chem. 2014, 16, 695–707. [Google Scholar] [CrossRef] [Green Version]
  46. Rodriguez, B.A.; Stowers, C.C.; Pham, V.; Cox, B.M. The production of propionic acid, propanol and propylene via sugar fermentation: An industrial perspective on the progress, technical challenges and future outlook. Green Chem. 2014, 16, 1066–1076. [Google Scholar] [CrossRef]
  47. Liu, L.; Cao, J.; Nakagawa, Y.; Betchaku, M.; Tamura, M.; Yabushita, M.; Tomishige, K. Hydrodeoxygenation of C4–C6 sugar alcohols to diols or mono-alcohols with the retention of the carbon chain over a silica-supported tungsten oxide-modified platinum catalyst. Green Chem. 2021, 23, 5665–5679. [Google Scholar] [CrossRef]
  48. Yao, S.Y.; Xu, W.Q.; Johnston-Peck, A.C.; Zhao, F.Z.; Liu, Z.Y.; Luo, S.; Senanayake, S.D.; Martínez-Arias, A.; Liu, W.J.; Rodriguez, J.A. Morphological effects of the nanostructured ceria support on the activity and stability of CuO/CeO2 catalysts for the water-gas shift reaction. Phys. Chem. Chem. Phys. 2014, 16, 17183–17195. [Google Scholar] [CrossRef]
  49. Cao, T.; You, R.; Li, Z.; Zhang, X.; Li, D.; Chen, S.; Zhang, Z.; Huang, W. Morphology-dependent CeO2 catalysis in acetylene semihydrogenation reaction. Appl. Surf. Sci. 2020, 501, 144120. [Google Scholar] [CrossRef]
  50. Fan, L.; Zhang, J.; Ma, K.; Zhang, Y.; Hu, Y.-M.; Kong, L.; Jia, A.-p.; Zhang, Z.; Huang, W.; Lu, J.-Q. Ceria morphology-dependent Pd-CeO2 interaction and catalysis in CO2 hydrogenation into formate. J. Catal. 2021, 397, 116–127. [Google Scholar] [CrossRef]
  51. Li, X.; Wang, Z.; Sun, J.; Oh, R.; Feng, J.; Shi, D.; Zhao, W.; Liu, S. Influence of CeO2 morphology on WO3/CeO2 catalyzed NO selective catalytic reduction by NH3. J. Energy Inst. 2020, 93, 1511–1518. [Google Scholar] [CrossRef]
  52. Tada, S.; Shimizu, T.; Kameyama, H.; Haneda, T.; Kikuchi, R. Ni/CeO2 catalysts with high CO2 methanation activity and high CH4 selectivity at low temperatures. Int. J. Hydrogen Energy 2012, 37, 5527–5531. [Google Scholar] [CrossRef]
  53. Wu, J.Y. Research on mechanism of deacetylation of chitin. Rare Metal Mat. Eng. 2008, 37, 718–722. [Google Scholar]
  54. Qi, M.; Chen, X.; Zhong, H.; Wu, J.; Jin, F. Base-Free, Vanadium-Catalyzed Conversion of Chitin into Acetic Acid under Low Oxygen Pressure. ACS Sustain. Chem. Eng. 2020, 8, 18661–18670. [Google Scholar] [CrossRef]
  55. Du, Y.; Zang, H.; Feng, Y.; Wang, K.; Lv, Y.; Liu, Z. Efficient catalytic system for converting N-acetyl-d-glucosamine into valuable chemical 3-acetylamino-5-acetylfuran. J. Mol. Liq. 2022, 347, 117970. [Google Scholar] [CrossRef]
  56. Szabolcs, Á.; Molnár, M.; Dibó, G.; Mika, L.T. Microwave-assisted conversion of carbohydrates to levulinic acid: An essential step in biomass conversion. Green Chem. 2013, 15, 439–445. [Google Scholar] [CrossRef]
  57. Hou, W.; Zhao, Q.; Liu, L. Selective conversion of chitin to levulinic acid catalyzed by ionic liquids: Distinctive effect of N-acetyl groups. Green Chem. 2020, 22, 62–70. [Google Scholar] [CrossRef]
Figure 1. The big picture: (a) Environmental Protection Agency (EPA)’s proposed hierarchical pyramid model on dealing with food waste. To minimize bio-waste, large-scale industrial valorization to valuable chemicals is highly recommended. (b) In this work, we demonstrate inexpensive Ni/CeO2-based catalyst-mediated transformation from chitin to N-acylethanolamine, a water-soluble secondary organic amine compound with high industrial and pharmaceutical relevance. Therefore, chitin could be considered as a renewable feedstock for producing organonitrogen compounds in the specialty chemical industry.
Catalysts 12 00460 g001
Figure 2. (a) XRD patterns (the rhombus and the circle represent the (111) and (200) crystal planes of Ni, respectively). (b) Raman spectra and (c) H2-TPR spectra of Ni/CeO2(R), Ni/CeO2(P), and Ni/CeO2(C) catalysts.
Catalysts 12 00460 g002
Figure 3. XPS (a) Ce 3d, (b) O 1s, and (c) Ni 2p3/2 spectra of Ni/CeO2(R), Ni/CeO2(P), and Ni/CeO2(C) catalytic materials. (u, u’’, u’’’ represent the peak of Ce4+ 3d3/2; v, v’’, v’’’ represent the peak of Ce4+ 3d5/2; u0, u’ represent the peak of Ce3+ 3d3/2; v0, v’ represent the peak of Ce3+ 3d5/2; Obon, Osur, Olat stand for chemisorbed species or Ce 3+ surface defects on the surface, surface-adsorbed, and weakly bonded oxygen species and lattice oxygen, respectively.)
Catalysts 12 00460 g003
Figure 4. Typical TEM images of standalone (a) CeO2(R), (d) CeO2(P), and (g) CeO2(C) supports and high-resolution TEM images of three catalysts: (b,c) Ni/CeO2(R), (e,f) Ni/CeO2(P), and (h,i) Ni/CeO2(C). Green circles indicate the plausible position of metallic Ni on catalytic materials (d represents the (100) crystal plane of CeO2).
Catalysts 12 00460 g004
Figure 5. Typical high-resolution TEM (left column) and EDS mapping images of three catalysts: (a) Ni/CeO2(R), (b) Ni/CeO2(P), and (c) Ni/CeO2(C).
Catalysts 12 00460 g005
Figure 6. Time-monitored degradation of NAG to N-acetylethanolamine over Ni/CeO2(C), Ni/CeO2(R), and Ni/CeO2(P) catalysts. All data in this ‘yield versus time’ graph were generated at 120 °C temperature and 4 MPa H2 pressure. All errors are <5%.
Catalysts 12 00460 g006
Scheme 1. Possible reaction pathways in the degradation of NAG over Ni/CeO2 catalysts. Species identified in blue were experimentally detected in this work.
Catalysts 12 00460 sch001
Table 1. Physicochemical and structural properties of different Ni/CeO2 catalytic materials.
Materialsa SBET
(m2/g)
b Ni
(wt%)
c D
(nm)
d Ƹ
(%)
e L. P. (Å)f Grain (Å)g Crys. (%)h,i [Ce3+]%h,j [Ov]
%
h,k [ID/ IF2g]
Ni/CeO2(R)50.5767
(136.7408)
12.017.20.495.4120254.8821.8425.630.50
Ni/CeO2(P)47.4038
(129.6053)
11.810.80.775.4112754.9630.6035.810.97
Ni/CeO2(C)28.4477
(51.6282)
10.423.90.355.4133555.5220.8824.470.28
a Surface area (SBET) measured by N2 physical adsorption. SBET values of standalone CeO2 supports only given in parenthesis. b Ni loading measured by ICP-OES. c Average grain size of catalyst by XRD. d Microstrain stress calculated along (1 1 1). e Lattice parameters. f Calculated grain size using Scherrer equation due to (1 1 1), (2 0 0), (2 2 0), and (3 1 1) planes. g Crystallinity calculated by Scherrer’ s equation with the diffraction of (111) facets. h Calculated [Ce3+], [Ov] and [ID/IF2g] concentrations from X-ray Photoelectron Spectroscopy (XPS) and Raman spectra. i [Ce3+]% = (ACe3+)/(ACe3+ + ACe4+) ×100% (A = Photoelectron peak areas). j [Ov] = (AOV)/ (AOL+ AOC + AOV) × 100% (A = Photoelectron peak areas). k [ID/IF2g] = Intensity of D band/intensity of F2g band in Raman spectroscopy.
Publisher’s Note: MDPI stays neutral with regard to jurisdictional claims in published maps and institutional affiliations.

