Article

Selective Hydrogenation of 2-Methyl-3-butyn-2-ol in Microcapillary Reactor on Supported Intermetallic PdZn Catalyst, Effect of Support Doping on Stability and Kinetic Parameters

by
Lyudmila Okhlopkova
1,
Igor Prosvirin
1,*,
Mikhail Kerzhentsev
1 and
Zinfer Ismagilov
1,2
1
Boreskov Institute of Catalysis SB RAS, Prospekt Akademika Lavrentieva 5, Novosibirsk 630090, Russia
2
Institute of Coal Chemistry and Material Science, Prospekt Soviet 18, Kemerovo 650000, Russia
*
Author to whom correspondence should be addressed.
Catalysts 2022, 12(12), 1660; https://doi.org/10.3390/catal12121660
Submission received: 17 October 2022 / Revised: 7 December 2022 / Accepted: 14 December 2022 / Published: 17 December 2022

Abstract

:
The development of active, selective, and stable multicrystalline catalytic coatings on the inner surface of microcapillary reactors addresses environmental problems of fine organic synthesis, in particular by reducing the large quantities of reagents and byproducts. Thin-film nanosized bimetallic catalysts based on mesoporous pure titania and doped with zirconia, ceria, and zinc oxide, for use in microreactors, were developed, and the regularities of their formation were studied. The efficiency of PdZn/TixM1−xO2±y (M = Ce, Zr, Zn) in the hydrogenation of 2-methyl-3-butyn 2-ol was studied with an emphasis on the stability of the catalyst during the reaction. The catalytic parameters depend on the adsorption properties and activity of PdZn and Pd(0) active centers. Under reaction conditions, resistance to the decomposition of PdZn is a factor that affects the stability of the catalyst. The zinc-doped coating proved to be the most selective and stable in the reaction of selective hydrogenation of acetylenic alcohols in a microcapillary reactor. This coating retained a high selectivity of 98.2% during long-term testing up to 168 h. Modification of the morphology and electronic structure of the active component, by doping titania with Ce and Zr, is accompanied by a decrease in stability.

Graphical Abstract

1. Introduction

Waste is one of the main modern environmental problems and a potential hazard to human health, as well as a hazard to the natural environment. For fine organic synthesis and pharmaceutical production, the introduction of catalysts eliminates the disadvantages of stoichiometric synthesis, i.e., a large amount of waste (inorganic salts) and the use of toxic and environmentally unsafe aggressive reagents. The use of microcapillary reactors, especially for processes in a continuous flow mode, is a promising direction, as they provide finely adjustable control of contact time and minimize the amount of byproducts [1,2]. In recent studies, the possibilities of liquid-phase selective hydrogenation in microcapillary reactors on Pd/TiO2 and PdM/TiO2 (M = Zn, Bi) coatings were analyzed [3,4,5,6,7]. Higher productivity was achieved, with respect to unsaturated alcohol in the hydrogenation of 2-methyl-3-butyn 2-ol (MBY), in a microcapillary reactor compared with a batch reactor. Semihydrogenation of triple bonds of acetylenic alcohols with the formation of alkenes is one of the most widely used hydrogenation processes for the production of vitamins A, K and E, as well as intermediates for the perfumery industry. The difficulty in controlling the selectivity of such processes in the presence of a catalyst is that the second reaction, hydrogenation of an alkene to an alkane, proceeds at a higher rate; that is, the formation of byproducts—completely saturated alkanes—occurs [4]. Alkene is fully hydrogenated only at high conversion of MBY. When the surface is covered with alkyne, alkene hydrogenation over palladium catalysts is low. A Pd/TiO2 catalytic coating demonstrated an alkene selectivity of 92% at 99.9% alkyne conversion [6]. However, it is still difficult to achieve selectivity close to 100% in the hydrogenation of terminal alkynes. Over the past decade, much attention has been paid to the synthesis of bimetallic selective hydrogenation catalysts, which improves catalyst properties such as activity, selectivity and stability; such catalysts are an alternative to modifiers that contaminate the final product. The properties of Pd can be improved by adding a second metal such as Zn [7,8], Cu [9], In [10], Ag [11], Sn [12], Bi [5], Pb [13], etc. Studies have been conducted to determine the most effective size and shape of Pd nanoparticles in triple bond hydrogenation reactions [14,15].
However, the actual production and use of microcapillary reactors encounters serious limitations associated with the instability of coatings under reaction conditions caused by abrasion processes, changes in the mesoporous structure of the support, and sintering of metal and oxide crystallites. To improve the structural properties and stability of catalytic films in microcapillary technology, the most effective method is the use of multicrystalline mesoporous materials based on titania [16,17,18,19,20], because this oxide exhibits the effect of a strong metal–support interaction, which has a significant effect on catalytic properties. The addition of modifying additives to the oxide support can increase the mechanical strength and chemical and thermal stability of the catalytic coating.
The catalytic properties of nanoparticles depend on their size and shape, which, in turn, are determined by the interaction between the supported metal and the oxide matrix. The support can also change the performance of the catalyst through electronic interactions. It is important to note that the properties of complex oxides based on titania can be purposefully controlled by varying the doping cation. Thus, the possibility of controlling the dispersion and redox properties of the active metal, and accordingly, the catalytic reaction, can be realized. Recently, multicrystalline oxide coatings based on titania (TixM1−xO2±y, M = Ce, Zr) with improved thermal and chemical stability were developed [20,21]. In this study, a Zn-doped coating was developed because the catalyst Pd/ZnO shows high alkene selectivity in batch [22], semibatch [23], structured [24], continuous-flow fixed-bed tubular [25,26,27,28], catalyst-coated tube [28,29,30], and capillary microreactors [31]. Enhanced MBE selectivity and lower activity over the system Pd/ZnO were associated with the formation of PdZn alloy [7,26,27,32], Pd metal encapsulation [26], and the presence of Znδ+ species [22]. The use of intermetallic compounds has been proved to be an effective strategy to tune the geometries of active centers and the adsorption energies of reactants and intermediates, thereby inhibiting side reactions. For example, a PdZn intermetallic compound embedded in titania [7], highly distributed in ZnO/nitrogen-decorated carbon hollow spheres [22], afforded a 2-methyl-3-buten 2-ol (MBE) selectivity of 96% at nearly full conversion. This work is devoted to revealing the mechanism of the influence of support composition on the catalytic parameters (activity, selectivity and stability) and kinetics parameters of PdZn intermetallic nanoparticles in the hydrogenation of 2-methyl-3-butyn-2-ol (MBY). The effects of titania doping TixM1−xO2±y (M = Ce, Zr, Zn) and oxidation-reduction treatments of TixM1−xO2±y coatings on the physicochemical and catalytic properties and kinetic parameters in the MBY selective hydrogenation reaction were studied. MBY was chosen as it is an industrial compound used in the synthesis of vitamins, and as the product of its semihydrogenation, 2-methyl-3- buten-2-ol (MBE), is the desired substance.

2. Results and Discussion

2.1. Structural and Composition Analysis of Catalysts and Coatings

Micrographs and distributions of particle size for the catalysts PdZn/TiO2-H-573, PdZn/Ti0.8Zr0.2O2-H-573, PdZn/Ti0.95Ce0.05O2-H-773, and PdZn/Ti0.8Zn0.2O1.8-H-573 activated at a high temperature in 30 vol.% of H2 in Ar at 573 or 773 K in the form of a powder are shown in Figure 1. We have shown, in earlier work, that the particle size and chemical composition of PdZn nanoparticles embedded in TiO2 and activated in vacuum under a residual pressure of 13 mbar at 573 K were similar in film and powder PdZn/TiO2-V-573 according to X-ray fluorescence spectroscopy and EDS-TEM [33]. The average particle size increases in a series: PdZn/Ti0.95Ce0.05O2-H-773 < PdZn/Ti0.8Zr0.2O2-H-573 < PdZn/TiO2-H-573 < PdZn/Ti0.8Zn0.2O1.8-H-573. The colloidal method allows the synthesis of metal particles with a size of 2 nm and a narrow size distribution [34]. The particle size of PdZn/Ti0.95Ce0.05O2-H-773 remains practically unchanged after high temperature reduction at 773 K, which agrees with the data previously obtained [20]. The results of our study suggest that the mesoporous structure could play a role in decreasing particle migration and coalescence at higher temperature. Resistance to collapse of the mesoporous network and strong interaction of Pd with surface defects on highly defective oxidic supports [35] ensure the high dispersion of particles embedded in Ce-doped titania. The size of PdZn nanoparticles in PdZn/Ti0.8Zn0.2O1.8-H-573 varies widely. In Figure 1D, nanoparticle sizes vary from 7 to 13 nm. The high-resolution images inserted in the upper part of Figure 1D show PdZn nanoparticles with a diameter of 1.7–2.4 nm. Large particles, ranging in size from 13 to 30 nm, are conglomerates (inserted at the bottom of Figure 1D). For all samples, the analysis of interplanar spacings revealed phases of PdZn (PDF # 65-9523) and Pd (PDF # 46-1043), with EDX confirming the uniform distribution of nanoparticles with different stoichiometry. When the active component is introduced into the matrix, a porous system with a larger pore size is formed (Figure 2). Therefore, it can be assumed that the nanoparticles of the active component are located inside the pores of the support. The electron micrographs of Zr- and Ce-doped catalysts show a quasi-hexagonal pore structure. Such a mesoporous structure improves the transport of substrate molecules and hydrogenation products from and to the active site (Figure 3).
The sintering of nanoparticles was observed for undoped and zinc-doped samples (Figure 1). It was shown earlier that the average nanoparticle size increases from a colloid to the final catalyst after embedding to the support matrix and reduction, and with an increase in reduction temperature [7]. As a rule, the mobility of the embedded particles is limited by the pore walls. Sintering of particles can be associated with the partial destruction of the mesoporous structure and weaker metal–support interaction. Surface defects generated by the incorporation of metal dopants can be nucleation sites and stabilize small Pd nanoparticles [36]. We thoroughly investigated the effect of calcining temperature on the porous structure of powders (Table 1). The surface area decreased, and the pore size increased, with an increase in calcination temperature from 673 to 873 K. The thermal stability of the support increases with the introduction of Zr and Ce. Although the structure underwent some changes upon high-temperature annealing, the samples doped with Zr and Ce had a higher specific surface area and pore volume compared with the undoped and zinc-doped samples (Table 1). It has been reported [37,38] that pore volume and surface area decrease, and pore size increases, with increasing calcination temperature due to crystallite growth. This was confirmed by XRD data, which are given in Table 1. Doping with Zr and Ce suppresses the growth of anatase crystals with increasing temperature. For undoped and zinc-doped TiO2, the crystallite size (derived by Scherrer equation) increased from 6 to 22 nm and from the amorphous state to 25 nm, respectively, with an increase in temperature from 673 to 873 K. Samples doped with Zr and Ce were more thermally stable; the crystallite sizes were 15 nm for Ti0.8Zn0.2O1.8 and 9 nm for Ti0.95Ce0.05O2. For a matrix doped with Ce and Zr, PdZn particles practically did not sinter (Figure 1). These results suggest that titania doping with zirconium and cerium is essential for enhancing the thermal stability of the catalysts.

2.2. Hydrogenation of 2-Methyl-3-butyn-2-ol on PdZn/TixM1−xOy Coatings in a Microcapillary Reactor

A comparative study of the catalytic properties (activity and selectivity) and stability of PdZn/TixM1−xO2 (M = Zr, Ce, Zn) coatings in the MBY hydrogenation reaction was conducted. Reduction treatment at 573 K is sufficient for the Pd-Zn alloy to form [7]. Thus, the catalysts were treated appropriately to study the catalytic properties. Figure 4 shows the concentration dependences on time, which consist of two successive stages: the hydrogenation of MBY to MBE, and MBE to 2-methyl-2-butanol (MBA). In the presence of MBY, the rate of the second stage was low on PdZn/TiO2 and PdZn/Ti0.8Zn0.2O1.8 coatings (Figure 4E,H); this is traditionally associated with the strong adsorption of alkyne molecules on the Pd surface [32,39]. It is of note that in the induction period, up to 50% of MBY conversion is probably due to the formation of active centers [40]. In our earlier studies [7,33,41] we showed that the activity and selectivity of the MBY hydrogenation reaction on PdZn/TiO2 coatings increase with an increase in the reaction time as a result of the removal of carbon deposits. The XPS results suggest that the catalyst’s surface is covered by carbon originating from the stabilizer (see below).
Similar patterns were obtained for multicrystalline coatings (Figure 5). With an increase in the reaction time from 1 to 28 h, activity increases from 0.28 to 1.2 gMBE/s/gPd for PdZn/TiO2, from 0.04 to 1.4 gMBE/s/gPd for PdZn/Ti0.8Zr0.2O2, from 0.55 to 1.8 gMBE/s/gPd for PdZn/Ti0.95Ce0.05O2, and from 0.03 to 0.12 gMBE/s/gPd for PdZn/Ti0.8Zn0.2O2. The selectivity of MBE formation also increases from 89.0 to 96.7% for PdZn/TiO2, from 95.4 to 96.8% for PdZn/Ti0.8Zr0.2O2, from 93.0 to 93.7% for PdZn/Ti0.95Ce0.05O2, and from 97.2 to 97.6% for PdZn/Ti0.8Zn0.2O2. The excellent selectivity of 97.6% at nearly full MBY conversion (97%) with the maximum MBE yield of 94.6% achieved in this work is an important result, considering the lower MBY conversion (~10%) [26] and lower selectivity (82%) reported for hydrogenation over Pd/ZnO [28] in a continuous-flow fixed-bed reactor. The capillary reactor wall-coated with a 5 wt% Pd/ZnO catalyst was very efficient in providing high selectivity of 97.8% at a MBY conversion below 90% [30]. Recently, Ye et al. developed a PdZn-ZnO/NCHS catalyst with excellent catalytic performance in a batch reactor, providing a selectivity of 96% at MBY conversion of 99% [22]. Considering the average size of Pd nanoparticles in the catalyst, we recorded an initial turnover frequency (TOF) in the range of 6 to 12 s−1. The catalyst activity is consistent with data in the literature. TOF values of MBY of ~0.9 s−1 over Pd/ZnO catalysts were reported in [22,28], while another report’s high values of 7 s−1 [25] agreed with the TOF values observed in this study.
The initial productivity of the microcapillary reactor (Q) (t ≤ 28 h) increases in the series: PdZn/Ti0.8Zn0.2O1.8 < PdZn/TiO2~PdZn/Ti0.95Ce0.05O2 < PdZn/Ti0.8Zr0.2O2 (Table 2). The high productivity over PdZn/Ti0.8Zr0.2O2 originates from a larger reactor loading. Initial activity increases, and selectivity decreases, in the series: PdZn/Ti0.8Zn0.2O1.8> PdZn/TiO2> PdZn/Ti0.8Zr0.2O2> PdZn/Ti0.95Ce0.05O2 (Figure 5). The observed dependences were explained by comparing the adsorption constants and reaction rate constants obtained from kinetic modeling (Table 3). The lower selectivity for 2-methyl-3-buten-2-ol (MBE) on PdZn nanoparticles embedded in the titania–ceria matrix is due to an increase in the ratio of alkene and alkyne adsorption constants, and an increase in the rate constant of hydrogenation of alkene to alkane. On the contrary, a decrease in the ratio of the adsorption constants of alkene and alkyne increases the selectivity of the coating based on titania–zinc oxides.
Figure 6 presents the XP spectrum of the Pd 3d5/2 region of PdZn/TiO2, PdZn/Ti0.95Ce0.05O2, and PdZn/Ti0.8Zn0.2O1.8 samples after preliminary reduction with 30 vol.% hydrogen in argon for 2 h. We note that the Pd 3d5/2 region is superimposed by the Zr 3p signal at a nominal BE of 335.0 eV. The survey spectra show that the samples’ surfaces contain titanium, zinc, carbon, oxygen, nitrogen and palladium for PdZn/TiO2 and PdZn/Ti0.8Zn0.2O1.8 samples, and additionally, cerium for PdZn/Ti0.95Ce0.05O2 (Figure S1). The XP spectrum of the Ce3d region is shown in Figure S2. The peaks of Ce3d are centered at 886.3 eV and 904.8 eV. They are assigned to Ce3+ [42]. The BE of Zn2p3/2 in PdZn/TiO2 and PdZn/Ti0.95Ce0.05O2 is apparently shifted by approximately 0.2–0.3 eV compared with that in PdZn/Ti0.8Zn0.2O1.8 (Fig.S3a, Table 4), likely owing to the interaction between Pd and Zn that occurred upon reduction thermal treatment with the formation of PdZn phase [32]. No shift appears in PdZn/Ti0.8Zn0.2O1.8; this may be related to the excess of ZnO in the support. The binding energies (BE) of Pd in the 3d5/2 region were slightly higher than those of the Pd(0) state (335.1–335.3 eV), indicating the electron-poor state of Pd (Table 4). Carbon is formed on the surface of the catalyst during the decomposition of the stabilizer and deposition of carbon from the atmosphere. Its amount is expected to decrease after redox treatment (calcination at 573 K in air and reduction at 573 K in hydrogen flow; treatment d). The ratio of surface atomic concentrations in the PdZn/TiO2 and PdZn/Ti0.8Zn0.2O1.8 shows that the particle surface is enriched by zinc. At the same time, an excess of surface palladium over zinc was observed in PdZn/Ti0.95Ce0.05O2. Nanoparticles are embedded in a porous support matrix, as evidenced by the low Pd/Ti atomic ratio. High-resolution spectra of Pd 3d over reduced samples have three peaks at 335.0, 335.7, and 337.1 eV, which correspond to Pd(0), Pd-Zn surface alloy, and Pd(II) [43,44,45] (Figure 6). Surface Pd(II) species can result from surface oxidation during catalyst storage [22] or the calcination step [26]. For PdZn/Ti0.8Zn0.2O1.8, only 10% typical signals for Pd(II) appear. Peaks belonging to Pd-Zn alloy decrease in the series: PdZn/Ti0.8Zn0.2O1.8 > PdZn/TiO2 > PdZn/Ti0.95Ce0.05O2. (Figure 6, Table 5). Peak fitting of the PdZn/Ti0.95Ce0.05O2 revealed an increase in content of Pd(0) (Table 5). This catalyst was exposed to air for a much longer period (24 h) than usual (15 min). The greater activity over PdZn/Ti0.95Ce0.05O2 (vs PdZn/TiO2) can be linked to a higher surface Pd(0) (Table 2). A high Pd(0) on the surface ensures low selectivity of a cerium-doped catalyst. The ability to form nonselective sites of β-hydrides phase makes Pd highly reactive toward MBE hydrogenation [46]. The high stability of Pd oxidation during catalyst storage is probably associated with the presence of a stabilizer on the catalyst’s surface [47,48].
Taking into account the gradual increase in reaction rate in the liquid phase, it is most likely that the strongly decreased activity of Zn-doped catalysts does not originate from the low dispersion of the nanoparticles. The lower activity of Zn-doped catalysts can be associated with the decoration of the palladium surface with zinc oxide [7] (geometric effect) and the formation of Pd-Zn alloy surfaces (electronic effect) [49]. Considering that the total concentration of Pd on the outermost surface decreases in a Zn-doped catalyst (Figure S1, Table 4), we can conclude that the lower activity may originate from a significantly lower Pd surface concentration. The peak shift of PdZn to higher binding energy (335.7 eV) with respect to that of metallic Pd (335.0 eV) was compatible with the electronic modification. The activity of the PdZn/Ti0.8Zn0.2O2 coating increases from 0.12 to 0.41 gMBE/s/gPd with an increase in test time from 28 to 88 h. When the capillary was stored under oxidizing conditions (in air) at room temperature for 10 days, the activity increased from 0.4 to 2.1 gMBE/s/gPd, and the selectivity decreased significantly from 98 to 95%. For the existing increase in reaction rate with reaction time, leaching of zinc oxide from the surface of active particles might be responsible. Selectivity is affected by many factors, such as the composition and sizes of the nanoparticles, subsurface carbon modification and phase segregation in the case of alloys [7,23,50,51]. We did not detect dimer formation in PdZn/Ti0.8Zn0.2O1.8. According to TEM data for powder catalysts, the sintering of nanoparticles is impossible under mild reaction conditions. The selectivity presented relative stability to MBE. This result indicates that no phase segregation or formation of nonselective active sites with low selectivity occurred during the reaction. The PdZn/Ti0.8Zn0.2O2 sample has the largest particle sizes (Figure 1D), and the selectivity is also the highest (Table 2). These results disagree with the size effect. Alkene formation is a structure-sensitive reaction [14], and undesirable full hydrogenation occurs on palladium nanoclusters (< 3 nm) with a low electron density and on palladium nanocrystals (> 5 nm) providing multicoordination of MBY. It is precisely because the PdZn alloy was created that the coating was made more selective. By applying oxidizing conditions at room temperature for 10 days, the increase in activity could be intensified (Figure 5). It can be assumed that oxygen attacks the surface, forming a more Pd-enriched surface embedded in the Pd-Zn alloy, which increases the activity. The alloy surface can be easily restored, even under reducing conditions, in the liquid phase of a solution of MBY in methanol and hydrogen within 24 h, which increases the selectivity. The XPS data suggest that the Zn species of the support inhibit the oxidation of palladium. The activity gradually increases, and selectivity decreases, with increasing reaction time from 28 to 100 h for mixed titania–zirconia coatings. The reaction rate is ~1.9 times higher at 100 h, and the selectivity decreases from 96.8% to 93.4% at 97% conversion. The release of highly active Pd species from the less active Pd-Zn nanoalloy might be responsible for the increase in reaction rate and decrease in selectivity with reaction time for zirconia–titania catalysts. Opposite patterns were obtained for the titania–ceria coating. The decrease in activity and increase in selectivity with increasing reaction time are not due to Pd leaching [40], but are likely to originate from a decrease in the number of nonselective centers of Pd(0).

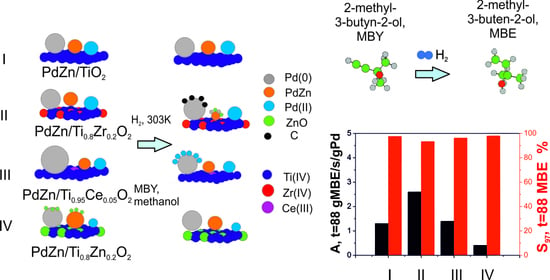
2.3. Hydrogenation of 2-Methyl-3-butyn-2-ol on PdZn/TixM1−xOy Coatings after Different Pretreatments

In a further attempt to study the catalytic properties of the Pd-Zn nanoalloy and kinetics parameters (Figures S4–S7, Tables S1–S4), to select the optimal conditions for catalyst pretreatment, the reaction was performed over the coatings after different redox treatments in turn (Figure 7). The reduction in hydrogen at 573 K (treatment c) caused a decrease in the activity of PdZn/TiO2 (Figure 7A), PdZn/Ti0.8Zn0.2O2 (Figure 7D), and PdZn/Ti0.8Zr0.2O2 (Figure 7B) coatings, which was more pronounced (2.6 times) in the latter case. The loss of activity of PdZn/TiO2 and PdZn/Ti0.8Zn0.2O2 was accompanied by a slight increase in selectivity, while a decrease in selectivity was observed for the PdZn/Ti0.8Zr0.2O2 catalyst. Taking Pd(0) active centers into account, it is most likely that the strongly decreased activity for PdZn/Ti0.8Zr0.2O2 originates from the weakening of bonding of MBY (Figure 8B) and the reduction in the concentration of surface hydrogen [52]. The formation of oligomers or carbonaceous deposits is the most likely reason for the reduced activity for PdZn/Ti0.8Zr0.2O2 [53]. Conclusions on the selectivity of the MBY hydrogenation are difficult, due to a lack of accurate quantification of the possibly formed oligomers. However, a carbon balance of typically 96% or above suggests that oligomer content is very low. In contrast, PdZn/Ti0.95Ce0.05O2 (Figure 7C) reduced in a stream of hydrogen at 573 K showed higher activity, which can be explained by the recovery of the Pd(0) active centers after reduction at 573 K in hydrogen flow. A higher selectivity (Figure 7C) indicates the regeneration of Pd-Zn alloy in reduced PdZn/Ti0.95Ce0.05O2 and metal encapsulation that impacts on the surface of Pdδ−. Different from the results of [26], during the catalyst reduction at 573 K, no Pdδ− appears in our study. This may be related to the catalyst storage at ambient conditions.
Redox treatment (calcination at 573 K in air and reduction at 573 K in hydrogen flow – treatment d) decreased the activity of all coatings; this is associated with sintering of nanoparticles. Along with dispersed particles, TEM images also show agglomerates of particles (Figure S8). Because full hydrogenation occurs on palladium nanocrystals with sizes > 5 nm, the constant k 2 was very high for the oxidized-reduced coatings PdZn/TiO2, PdZn/Ti0.95Ce0.05O2, and PdZn/Ti0.8Zn0.2O2 (Figure 8A,C,D). Note that selectivity increased without major changes in activity after 40 h of continuous flow. It seems likely that this behavior is related to a gradual decomposition of Pd hydrides, with the subsurface hydrogen being highly active in MBE hydrogenation [46]. The ratio of the alkene to alkyne adsorption constants was practically independent of treatments of PdZn/TiO2 and PdZn/Ti0.8Zn0.2O2, and was the smallest for PdZn/Ti0.8Zn0.2O2 (Figure 8D), which led to the highest selectivity (Figure 5B). In contrast to these samples, the ratio of the alkene and alkyne adsorption constants for PdZn/Ti0.8Zr0.2O2 decreased almost two times after pretreatments, which explains increased selectivity (Figure 8B).
In a further attempt to explain the catalytic properties after redox treatment, XPS analysis was performed (Figures S1b, S2 and S3b). The results of peak fitting of Pd3d5/2 core-level spectra, shown in Table 5 and Figure S9, revealed the oxidation of Pd over PdZn/Ti0.95Ce0.05O2 after redox treatment. The selectivity of PdZn/Ti0.95Ce0.05O2 decreased and activity gradually decreased with time after oxidation-reduction treatment, which is apparently associated with the reversible destruction of the Pd-Zn alloy, the oxidation of Pd, and the leaching of Pd during hydrogenation reactions [40]. Peaks belonging to the Pd-Zn alloy were retained for the PdZn/TiO2 and PdZn/Ti0.8Zn0.2O1.8, which explains their high stability. The most selective and resistant to redox treatment was PdZn/Ti0.8Zn0.2O2; selectivity was 98% after calcination at 573 K and reduction at 573 K for 2 h. The atomic ratio of Pd/Zn elements in the surface layer is 1/140, although a large number of Zn species were removed during the redox treatment of PdZn/Ti0.8Zn0.2O1.8 (Table 4). It is possible that the Pd-Zn alloy, which is responsible for the high selectivity of catalysts, is formed with the participation of Zn2+ ions of the support [27]. Ye et al. attributed the high selectivity to the presence of Znδ+ species in PdZn-ZnO/NCHS that alter the adsorption modes of the reactant and product [22]. The selectivity toward MBE is also high if reduced PdZn/TiO2 is used. PdZn/TiO2 displayed high activity (1.4 gMBE/s/gPd) and selectivity (97.6%) even after 88 h on stream. Thus, the PdZn/TiO2 coating can be recommended for use in the selective hydrogenation of acetylenic alcohols in a microcapillary reactor under no solvent conditions as the most active and stable. PdZn/Ti0.8Zn0.2O1.8 showed the highest selectivity and stability. A high Pd loading in Zn-doped coating is required to ensure full MBY conversion under no solvent conditions. At high Pd loading, there are internal diffusion limitations that decrease the selectivity. The optimal zinc content which could provide full hydrogenation of MBY and high MBE selectivity without solvent remains unclear.

3. Materials and Methods

3.1. Synthesis of PdZn/TixM1−xO2 (M = Zr, Ce, Zn) Coatings

Colloidal PdZn nanoparticles (molar ration Pd/Zn = 1/1) were obtained by reducing Pd(CH3COO)2 (46.5% Pd, Aurat, Moscow, Russia) and ZnCl2 (98%, Vekton, Yekaterinburg, Russia) salts in an ethylene glycol solution (99.5%, Soyuzkhimprom, Novocheboksarsk, Russia) [54]; colloidal nanoparticles were stabilized with polyvinylpyrrolidone (PVP), average molecular weight 58,000 (Acros Organics, Geel, Belgium, product number K29-32). Mesoporous titania-based powders with embedded nanoparticles were obtained through one-step synthesis, using a Pluronic F127 (Sigma-Aldrich, St. Louis, MO, USA, product number P2443) as the template [7], followed by evacuation at 573 K for 2 h under a residual pressure of 13 mbar and activation under different conditions. The powder samples are noted according to their activation procedure: the letters denote treatment atmosphere (V–under a residual pressure of 13 mbar, O–air, H–30 vol.% of H2), and numbers denote the temperature of treatment. The amount of colloidal solution of nanoparticles was chosen to obtain 1 wt% Pd. One undoped and three doped coatings TixM1−xO2±y (M = Ce, Zr, Zn) were prepared by dip-coating on the inner surface on a silica fused capillary with an internal diameter of 530 μm and length 10 m (AGILENT, product number 160-2530-10 [55]), with a nominal nanoparticle loading: PdZn/TiO2-1.72 wt% Pd on 1.95 mg of TiO2; PdZn/Ti0.8Zr0.2O2-1.4 wt% Pd on 3.85 mg of Ti0.8Zr0.2O2; PdZn/Ti0.95Ce0.05O2-1.52 wt% Pd on 1.55 mg of Ti0.95Ce0.05O2; PdZn/Ti0.8Zn0.2O1.8-0.48 wt% Pd on 8.5 mg of Ti0.8Zn0.2O1.8. Sol, with support precursors and nanoparticles obtained after aging within 3 h, was applied to the inner surface of the silica microcapillary in an Ar flow at a rate of about 1 cm/s. To create irregularities and roughness inside the capillary, it was pretreated with 1 M NaOH solution at a temperature of 313 K for 1 h. The capillary was then washed alternately with water and ethanol at a temperature of about 298 K. The capillary and the remaining sol were dried for 24 h at 80% relative humidity, and calcined in a vacuum oven at 573 K at a heating rate of 1 K/min and a pressure of 13 mbar for 2 h.
Undoped TiO2 was prepared with the following molar composition: Ti(O–iPr)4:Pluronic F127:C2H5OH:C4H9OH:H2O:HNO3 = 0.009:32:8:1.3:0.13. For multicrystalline coatings, we chose the following synthesis conditions:
Ce-doped coating: TiO2 precursor-Ti (OiPr)4 (98%, Acros Organics, Geel, Belgium), Ce precursor-Ce (NO3)3·6H2O (99%, Reachim, Novosibirsk, Russia) solvent: ethanol (99.99%, N.N. Vorozhtsov Novosibirsk Institute of Organic Chemistry, Novosibirsk, Russia), template: Pluronic F127, hydrolysis agent: water, catalyst: HNO3 (70%, SigmaTech, Moscow, Russia), molar ratio-Ti (OiPr)4:Ce(NO3)3·6H2O:Pluronic F127:C2H5OH:H2O:HNO3 = 0.95:0.05:0.009:40:0.13 [48].
Zr-doped coating: TiO2 precursor-Pluronic F127, Zr precursor-ZrOCl2 8H2O (99%, Vekton, Yekaterinburg, Russia), solvent: ethanol and methanol (99.99%, Boreskov Institute of Catalysis, Novosibirsk, Russia), template: surfactant Pluronic F127, molar ratio and concentration of reagents: Pluronic F127:Ti (OiPr)4:ZrOCl2·8H2O:alcohol = 0.0112:0.8:0.2:34 [21].
Zn-doped coating: TiO2 precursor-Ti (OiPr)4, Zn precursor-Zn(CH3COO)2 2H2O (99.5% Reachim, Russia), solvent: ethanol and methanol (99.99%, Boreskov Institute of Catalysis, Novosibirsk, Russia), template: surfactant Pluronic F127, molar ratio and concentration of reagents: Ti(OiPr)4:Zn(CH3COO)2 2H2O:surfactant: C2H5OH:H2O:HNO3 = 0.8:0.2:0.009:40:0.7:0.17.
The coatings were treated under different conditions. Letters indicate the activation treatment: (a)—after 28 h in continuous flow of the reaction solution and hydrogen; (b)—sample (a) after 88 h in continuous flow; (c)—sample (b) after reduction in H2 at 573 K for 2 h; (d)—sample (c) after oxidation-reduction treatment in air at 573 K for 2 h and in H2 at 573 K for 2 h.

3.2. Investigation of the Physicochemical Properties of TixM1−xO2 Composites (M = Zr, Ce, Zn) and PdZn/Tix Zr1−xO2 Catalysts and Coatings

The phase composition of the samples was studied using X-ray phase analysis (XRD). Powder X-ray pictures were recorded on a diffractometer HZG-4C (“Freiberger Prazisionmechanik”, Freiberg, Germany) using CoKα radiation in the range 4° < 2θ < 50° at a counter speed of 1°/min. The size of the TiO2 particle was estimated, using the Scherrer equation, from the characteristic peaks in the XRD pattern. Transmission electron microscopy (TEM) photomicrographs were obtained on a JEM 2010 instrument (JEOL, Tokyo, Japan) operating at 200 kV with a resolution of 0.14 nm. The local elemental analysis of the samples was performed using energy dispersive spectroscopy, using an EDAX spectrometer equipped with a Si (Li) detector with a resolution of 130 eV. Nitrogen adsorption and desorption isotherms at 78 K were measured using an ASAP 2400 analyzer (Micromeritics, Norcross, GA, USA). The specific surface area was calculated using the Brunauer–Emmett–Teller method. Pore volumes and pore size distributions were obtained using the Barrett–Joyner–Halenda model from the desorption branch of isotherms. The contents of Pd, Zn, Ti, and Zr in powder catalysts were determined using a VRA-30 analyzer (ThermoFisher Scientific, Basel, Switzerland) with an X-ray tube Cr-anode for X-ray fluorescence spectroscopy. The catalyst content in the microcapillary reactor was determined using an OPTIMA 4300 DV instrument (Perkin Elmer, Waltham, MA, USA) to perform inductively coupled plasma atomic emission spectroscopy.
Photoelectron spectra (XPS) were recorded using a SPECS spectrometer with a PHOIBOS-150-MCD-9 hemispherical energy analyzer (AlKα irradiation, hν = 1486.6 eV, 150 W). The binding energy (BE) scale was precalibrated using the positions of the peaks of Au4f7/2 (BE = 84.0 eV) and Cu2p3/2 (BE = 932.67 eV) core levels. The samples, in the form of powder, were loaded onto a conducting double-sided copper scotch. Energies of the peaks were calibrated according to the position of the C1s peak (BE = 284.8 eV) corresponding to the surface hydrocarbon-like deposits (C-C and C-H bonds). In addition to the survey of photoelectron spectra, narrower spectral regions C1s, Pd3d, N1s, Ti2p, O1s, Ce3d, and Zn2p were recorded. The survey spectra were taken at analyzer pass energy of 50 eV and the detailed spectra were registered at 20 eV. Analysis of the individual spectral regions allowed the determination of peak BE, identification of the chemical state of elements, and calculation of atomic concentration ratios of elements on each sample’s surface. The concentration ratios of elements on the catalyst’s surface were calculated from the integral photoelectron peak intensities, which were corrected with theoretical sensitivity factors based on Scofield’s photoionization cross-sections [56].

3.3. Catalytic Tests

The catalytic coating located in the microcapillary was initially reduced in situ in a stream of H2 at the rate of 2 mL/min, at a temperature of 573 K, for 2 h. Quantitative analysis of the reagent and products was performed via gas chromatograph analysis based on previous research. The silica capillary with catalytic coating was placed in a thermostated oven at a temperature of 313 K [7]. Hydrogen and a solution of MBY or 2-methyl-3-buten-2-ol (MBE) in methanol were fed into a T-shaped mixer, with the diameters of the tubes being 250 μm. The flow rate was varied from 5 to 100 μL/min, and the gas flow was 6 mL/min. Samples (3–5 pieces) were taken only after the system had reached a steady state for 20 min, diluted with methanol, and analyzed using a gas chromatograph Cristall 2000M with flame ionization detector (Chromatek, Yoshkar-Ola, Russia) equipped with a capillary column with a stationary phase SKTFT-50X, 0.22 mm in diameter and 30 m in length (BIC SB RAS, Novosibirsk, Russia). The carbon balance for these systems was 100 ± 2%, i.e., the main products were 2-methyl-3-butyn-2-ol (MBY), 2-methyl-3-buten-2-ol (MBE), and 2-methyl-2-butanol (MBA). However, a slight decrease in the carbon balance (close to 96% ± 1%) during hydrogenation over PdZn/Ti0.8Zr0.2O2 was frequently observed. Adsorption, oligomer formation, or formation of carbonaceous deposits may explain this behavior. MBY conversion was defined as X = ( C M B Y , 0 C M B Y ) C M B Y , 0 × 100 ; selectivity was defined as S M B E = C M B E ( C M B Y , 0 C M B Y ) × 100 ; activity was defined as A = ( C M B Y , 0 C M B Y ) × v l m o l P d × 100 ; the yield of MBE was defined as Y = C M B E C M B Y , 0 × 100 ; the productivity was calculated as Q = ( C M B Y , 0 C M B Y , 0   ) × v l × Y × M × 100 , where C M B Y , 0 is the initial concentration of MBY; C M B Y and C M B E are the current concentrations of MBY and MBE, respectively; v l liquid flow rate, and M—molecular weight of MBY.

3.4. Calculations of Kinetic Parameters

In this work, to describe the kinetic data, we used the Langmuir–Hinshelwood model [57,58], which assumes quasi-equilibrium competitive adsorption of organic molecules and hydrogen on the catalyst’s surface, followed by a slow stage of hydrogenation [59,60]. The kinetic model of MBY hydrogenation is shown below [33], taking into consideration the weak hydrogen adsorption on Pd ( K H 2 1 ) [61]. The formation of C10-dimers is suppressed on PdZn/TiO2, PdZn/Ti0.95Ce0.05O2, and PdZn/Ti0.8Zn0.2O2. The formation of C10-dimers is a possible step on PdZn/Ti0.8Zr0.2O2, but selectivity toward dimers is below 4%.
r 1 = k 1 C MBY K MBY ( 1 + K MBY C MBY + K MBE C MBE   + K MBA C MBA ) 2 ,
r 2 = k 2 C MBY K MBY ( 1 + K MBY C MBY + K MBE C MBE   + K MBA C MBA ) 2
r 3 = k 3 C MBY K MBY ( 1 + K MBY C MBY + K MBE C MBE   + K MBA C MBA ) 2
dC MBY d t = ( r 1 + r 3 )
dC MBE d t = ( r 1 r 2 )
dC MBA d t = ( r 2 + r 3 )
k 1 1 = k 1 K MBYH K H 2 C Pd C H 2                   k 2 1 = k 2 K MBEH K H 2 C Pd C H 2
k 3 1 = k 3 K H 2 2 C Pd C H 2 2
where k 1 , k 2 , k 3 —are the apparent rate constants of reactions 1, 2, 3 (Scheme 1); K MBY , K MBE , K MBA are the adsorption constants; C MBY , C MBE , C MBA are the concentrations of alkyne, alkene and alkane, respectively. The hydrogen concentration in the liquid phase is considered equal to its equilibrium value. MATLAB was used to calculate the kinetic parameters. The system of differential equations was solved using the function ode45, and the fminsearch function was used to minimize the sum of square deviations between the experimental and calculated concentrations at the reactor outlet. The proposed model accuracy was estimated using the percentage standard deviations, when the conversions are more than 50%, and calculated as σ i = 100 / ω i i = 1 m ( Y i C i ) 2 m ; ω i = 100 m i = 1 m Y i , where Yi and Ci are the experimental and the calculated concentrations, m is the number of experimental points recorded during each run, and ωi is the weighting factor.

4. Conclusions

In this study, we investigated the activity and stability of PdZn nanoparticles supported on Ti1-xMxOy (M = Zr, Ce, Zn) in the liquid-phase hydrogenation of MBY in a microcapillary reactor. The initial activity increases, and selectivity decreases, in the series: PdZn/Ti0.8Zn0.2O1.8 > PdZn/TiO2 > PdZn/Ti0.8Zr0.2O2 > PdZn/Ti0.95Ce0.05O2. This is caused by an increase in the ratio of adsorption constants of alkene and alkyne, and an increase in the rate constant of the hydrogenation of alkene to alkane. Using Pd(0) species liberated from PdZn alloy leads to high activity, but unfortunately also to lower selectivity. We observed reduced hydrogenation activity for PdZn on Zn doped TiO2 due to the decoration of a part of the active surface of ZnO, as well as high selectivity in agreement with the Pd-Zn alloy formation and electronic modification of Pd. The results obtained during MBY hydrogenation confirm the tendency for oxidative decomposition of Pd-Zn active centers. Under reaction conditions, this oxidation was reversible for Zn-doped titania. In addition to changing the surface during the reaction, decomposition of the active centers occurs during the redox treatment. We found that the selective active center is destroyed in Zr- and Ce-doped titania, and vice versa; Zn-doping of the support protects the Pd-Zn alloy from decomposition in an oxidizing atmosphere at 573 K. The surface and electronic structure of active centers change and are difficult to manage. Thus, the catalytic properties will strongly depend on the support, pretreatment, and reaction conditions. To take practical advantage of this technique, not only the effect of the support on activity and selectivity, but also the stability of the catalytic coatings needs to be carefully investigated.

Supplementary Materials

The following supporting information can be downloaded at: https://www.mdpi.com/article/10.3390/catal12121660/s1, Figure S1: Survey spectra of the catalysts after (A) reduction with 30 vol.% hydrogen in argon at 573 K for 2 h and (B) calcination at 573 K in air and reduction with 30 vol.% hydrogen in argon at 573 K for 2 h. PdZn/TiO2 (1), PdZn/Ti0.95Ce0.05O2 (2), PdZn/Ti0.8Zn0.2O1.8 (3); Figure S2: Ce3d core-level X-ray photoelectron spectra of PdZn/Ti0.95Ce0.05O2 after reduction with 30 vol.% hydrogen in argon at 573 K for 2 h (1) and calcination at 573 K in air and reduction with 30 vol.% hydrogen in argon at 573 K for 2 h (2); Figure S3: Zn 2p3/2 core-level X-ray photoelectron spectra of PdZn/Ti0.95Ce0.05O2 after (A) reduction with 30 vol.% hydrogen in argon at 573 K for 2 h and (B) calcination at 573 K in air and reduction with 30 vol.% hydrogen in argon at 573 K for 2 h. PdZn/TiO2 (1), PdZn/Ti0.95Ce0.05O2 (2), PdZn/Ti0.8Zn0.2O1.8 (3), Figure S4: Dependences of the concentrations of MBY, MBE and MBA on the contact time after different pretreatments on PdZn/TiO2 -a (A), PdZn/TiO2-b (B), PdZn/TiO2-c (C), PdZn/TiO2-d (D), points - experiment, lines - calculation by the Langmuir-Hinshelwood model. Reaction conditions: gas flow rate 6.0 mL / min, = 1 atm, T = 313 K, Figure S5: Dependences of the concentrations of MBY, MBE and MBA on the contact time after different pretreatments on PdZn/Ti0.8Zr0.8O2 -a (A), PdZn/Ti0.8Zr0.8O2 -b (B), PdZn/Ti0.8Zr0.8O2 -c (C), PdZn/Ti0.8Zr0.8O2 -d (D), points - experiment, lines - calculation by the Langmuir-Hinshelwood model. Reaction conditions: gas flow rate 6.0 mL/min, = 1 atm, T = 313 K, Figure S6: Dependences of the concentrations of MBY, MBE and MBA on the contact time after different pretreatments on PdZn/Ti0.95Ce0.05O2 -a (A), PdZn/Ti0.95Ce0.05O2 -b (B), PdZn/ Ti0.95Ce0.05O2 -c (C), PdZn/ Ti0.95Ce0.05O2 -d (D), points - experiment, lines - calculation by the Langmuir-Hinshelwood model. Reaction conditions: gas flow rate 6.0 mL/min, = 1 atm, T = 313 K, Figure S7: Dependences of the concentrations of MBY, MBE and MBA on the contact time after different pretreatments on PdZn/Ti0.8Zn0.2O2 -a (A), PdZn/Ti0.8Zn0.2O2 -b (B), PdZn/Ti0.8Zn0.2O2 -c (C), PdZn/Ti0.8Zn0.2O2 -d (D), points - experiment, lines - calculation by the Langmuir-Hinshelwood model. Reaction conditions: gas flow rate 6.0 mL/min, = 1 atm, T = 313 K, Figure S8: TEM micrographs of the powdered catalysts (A) PdZn/TiO2-d, (B) PdZn/Ti0.95Ce0.05O2-d, Figure S9: Peak fitting of Pd3d5/2 core-level spectra of (A) PdZn/TiO2-d, (B) PdZn/Ti0.95Ce0.05O2-d, and (C) PdZn/Ti0.8Zn0.2O1.8-d after calcination at 573 K in air and reduction with 30 vol.% hydrogen in argon at 573 K for 2 h, Table S1: Kinetic parameters of the hydrogenation reaction of MBY on films PdZn/TiO2 after different pretreatments, Table S2: Kinetic parameters of the hydrogenation reaction of MBY on films PdZn/Ti0.8Zr0.8O2 after different pretreatments, Table S3: Kinetic parameters of the hydrogenation reaction of MBY on films PdZn/Ti0.95Ce0.05O2 after different pretreatments, Table S4: Kinetic parameters of the hydrogenation reaction of MBY on films PdZn/Ti0.8Zn0.2O1.7 after different pretreatments.

Author Contributions

Conceptualization, L.O. and M.K.; methodology, L.O.; software, I.P.; validation, L.O., I.P. and M.K.; formal analysis, L.O.; investigation, I.P.; resources L.O.; data curation, L.O.; writing—original draft preparation, L.O.; writing—review and editing, M.K.; visualization, L.O.; supervision, Z.I.; project administration, Z.I.; funding acquisition, M.K. All authors have read and agreed to the published version of the manuscript.

Funding

This research was funded by the Ministry of Science and Higher Education of the Russian Federation within the governmental order for the Boreskov Institute of Catalysis (grant number project AAAA-A21-121011490008-3).

Data Availability Statement

Data is contained within the article.

Acknowledgments

The authors are grateful to Ushakov V.A., Efimenko T.Ya., Kraevskaya I.L. and Gerasimov E. Yu. for assistance in the study of samples by physicochemical methods.

Conflicts of Interest

The authors declare no conflict of interest.

References

  1. Renken, A.; Kiwi-Minsker, L. Microstructured Catalytic Reactors. Adv. Catal. 2010, 53, 47–122. [Google Scholar] [CrossRef]
  2. Fanelli, F.; Parisi, G.; Degennaro, L.; Luisi, R. Contribution of Microreactor Technology and Flow Chemistry to the Development of Green and Sustainable Synthesis. Beilstein J. Org. Chem. 2017, 13, 520–542. [Google Scholar] [CrossRef] [PubMed] [Green Version]
  3. Rebrov, E.V.; Berenguer-Murcia, A.; Skelton, H.E.; Johnson, B.F.G.; Wheatley, A.E.H.; Schouten, J.C. Capillary Microreactors Wall-Coated with Mesoporous Titania Thin Film Catalyst Supports. Lab Chip 2009, 9, 503–506. [Google Scholar] [CrossRef] [Green Version]
  4. Rebrov, E.V.; Klinger, E.A.; Berenguer-Murcia, A.; Sulman, E.M.; Schouten, J.C. Selective Hydrogenation of 2-Methyl-3-Butyne-2-Ol in a Wall-Coated Capillary Microreactor with a Pd25Zn75/TiO2 Catalyst. Org. Process Res. Dev. 2009, 13, 991–998. [Google Scholar] [CrossRef]
  5. Cherkasov, N.; Ibhadon, A.O.; Rebrov, E.V. Novel Synthesis of Thick Wall Coatings of Titania Supported Bi Poisoned Pd Catalysts and Application in Selective Hydrogenation of Acetylene Alcohols in Capillary Microreactors. Lab Chip 2015, 15, 1952–1960. [Google Scholar] [CrossRef]
  6. Okhlopkova, L.B.; Kerzhentsev, M.A.; Ismagilov, Z.R. Capillary Microreactor with a Catalytic Coating Based on Mesoporous Titanium Dioxide for the Selective Hydrogenation of 2-Methyl-3-Butyn-2-Ol. Kinet. Catal. 2016, 57, 501–507. [Google Scholar] [CrossRef]
  7. Okhlopkova, L.B.; Cherepanova, S.V.; Prosvirin, I.P.; Kerzhentsev, M.A.; Ismagilov, Z.R. Semi-Hydrogenation of 2-Methyl-3-Butyn-2-Ol on Pd-Zn Nanoalloys Prepared by Polyol Method: Effect of Composition and Heterogenization. Appl. Catal. A 2018, 549, 245–253. [Google Scholar] [CrossRef]
  8. Mashkovsky, I.S.; Markov, P.V.; Bragina, G.O.; Baeva, G.N.; Bukhtiyarov, A.V.; Prosvirin, I.P.; Bukhtiyarov, V.I.; Yu Stakheev, A. Formation of Supported Intermetallic Nanoparticles in the Pd–Zn/α-Al2O3 Catalyst. Kinet. Catal. 2017, 58, 499–507. [Google Scholar] [CrossRef]
  9. Markov, P.V.; Bragina, G.O.; Rassolov, A.V.; Baeva, G.N.; Mashkovsky, I.S.; Murzin, V.Y.; Zubavichus, Y.V.; Stakheev, A.Y. Pd–Cu Catalyst Prepared from Heterobimetallic PdCu2(OAc)6: An XRD-EXAFS Study and Activity/Selectivity in the Liquid-Phase Hydrogenation of a C≡C Bond. Mendeleev Commun. 2016, 26, 502–504. [Google Scholar] [CrossRef]
  10. Markov, P.V.; Bragina, G.O.; Rassolov, A.V.; Mashkovsky, I.S.; Baeva, G.N.; Tkachenko, O.P.; Yakushev, I.A.; Vargaftik, M.N.; Stakheev, A.Y. Performance of a Bimetallic Pd–In Catalyst in the Selective Liquid-Phase Hydrogenation of Internal and Terminal Alkynes. Mendeleev Commun. 2016, 26, 494–496. [Google Scholar] [CrossRef]
  11. Khan, N.A.; Shaikhutdinov, S.; Freund, H.J. Acetylene and Ethylene Hydrogenation on Alumina Supported Pd-Ag Model Catalysts. Catal. Letters 2006, 108, 159–164. [Google Scholar] [CrossRef] [Green Version]
  12. Johnston, S.K.; Cherkasov, N.; Pérez-Barrado, E.; Aho, A.; Murzin, D.Y.; Ibhadon, A.O.; Francesconi, M.G. Pd 3 Sn Nanoparticles on TiO 2 and ZnO Supports as Catalysts for Semi-Hydrogenation: Synthesis and Catalytic Performance. Appl. Catal. A Gen. 2017, 544, 40–45. [Google Scholar] [CrossRef]
  13. Niu, W.; Gao, Y.; Zhang, W.; Yan, N.; Lu, X. Pd-Pb Alloy Nanocrystals with Tailored Composition for Semihydrogenation: Taking Advantage of Catalyst Poisoning. Angew. Chemie - Int. Ed. 2015, 54, 8271–8274. [Google Scholar] [CrossRef]
  14. Crespo-Quesada, M.; Yarulin, A.; Jin, M.; Xia, Y.; Kiwi-Minsker, L. Structure Sensitivity of Alkynol Hydrogenation on Shape- and Size-Controlled Palladium Nanocrystals: Which Sites Are Most Active and Selective? J. Am. Chem. Soc. 2011, 133, 12787–12794. [Google Scholar] [CrossRef]
  15. Yarulin, A.E.; Crespo-Quesada, R.M.; Egorova, E.V.; Kiwi-Minsker, L.L. Structure Sensitivity of Selective Acetylene Hydrogenation over the Catalysts with Shape-Controlled Palladium Nanoparticles. Kinet. Catal. 2012, 53, 253–261. [Google Scholar] [CrossRef] [Green Version]
  16. Protasova, L.N.; Rebrov, E.V.; Glazneva, T.S.; Berenguer-Murcia, A.; Ismagilov, Z.R.; Schouten, J.C. Control of the Thickness of Mesoporous Titania Films for Application in Multiphase Catalytic Microreactors. J. Catal. 2010, 271, 161–169. [Google Scholar] [CrossRef]
  17. Muraza, O.; Rebrov, E.V.; de Croon, M.H.J.M.; Schouten, J.C. Enhancement of the Stability of Microporous Silica Films in Non-Aqueous Solvents at Elevated Temperature. Microporous Mesoporous Mater. 2009, 124, 20–29. [Google Scholar] [CrossRef]
  18. Muraza, O.; Rebrov, E.V.; Berenguer-Murcia, A.; de Croon, M.H.J.M.; Schouten, J.C. Selectivity Control in Hydrogenation Reactions by Nanoconfinement of Polymetallic Nanoparticles in Mesoporous Thin Films. Appl. Catal. A Gen. 2009, 368, 87–96. [Google Scholar] [CrossRef]
  19. Protasova, L.N.; Rebrov, E.V.; Skelton, H.E.; Wheatley, A.E.H.; Schouten, J.C. A Kinetic Study of the Liquid-Phase Hydrogenation of Citral on Au/TiO2 and Pt–Sn/TiO2 Thin Films in Capillary Microreactors. Appl. Catal. A Gen. 2011, 399, 12–21. [Google Scholar] [CrossRef]
  20. Okhlopkova, L.B.; Kerzhentsev, M.A.; Ismagilov, Z.R. Improved Thermal Stability of PdZn/TiO2coating by Ce Doping. Surf. Eng. 2015, 31, 78–83. [Google Scholar] [CrossRef]
  21. Okhlopkova, L.B.; Kerzhentsev, M.A.; Ismagilov, Z.R. Development, Synthesis, and Study of Sanomaterials of Titania Doped by Zirconium for Selective Hydrogenation of 2-Methyl-3-Butyn-2-Ol in a Microcapillary Reactor. Kinet. Catal. 2019, 60, 474–483. [Google Scholar] [CrossRef]
  22. Ye, C.; Chen, X.; Li, S.; Feng, B.; Fu, Y.; Zhang, F.; Chen, D.L.; Zhu, W. PdZn Intermetallic Compound Stabilized on ZnO/Nitrogen-Decorated Carbon Hollow Spheres for Catalytic Semihydrogenation of Alkynols. Nano Res. 2022, 15, 3090–3098. [Google Scholar] [CrossRef]
  23. Vernuccio, S.; Goy, R.; Rudolf Von Rohr, P.; Medlock, J.; Bonrath, W. Hydrogenation of 2-Methyl-3-Butyn-2-Ol over a Pd/ZnO Catalyst: Kinetic Model and Selectivity Study. React. Chem. Eng. 2016, 1, 445–453. [Google Scholar] [CrossRef]
  24. Vernuccio, S.; Goy, R.; Meier, A.; Rudolf von Rohr, P.; Medlock, J. Kinetics and Mass Transfer of the Hydrogenation of 2-Methyl-3-Butyn-2-Ol in a Structured Pd/ZnO/Al2O3 Reactor. Chem. Eng. J. 2017. [Google Scholar] [CrossRef]
  25. Chen, X.; Shi, C.; Wang, X.B.; Li, W.Y.; Liang, C. Intermetallic PdZn Nanoparticles Catalyze the Continuous-Flow Hydrogenation of Alkynols to Cis-Enols. Commun. Chem. 2021, 4, 175. [Google Scholar] [CrossRef]
  26. González-Fernández, A.; Pischetola, C.; Kiwi-Minsker, L.; Cárdenas-Lizana, F. Partial Hydrogenation of 2-Methyl-3-Butyn-2-Ol over Pd/ZnO: Effect of Reduction Temperature on Alloy Formation and Catalytic Response. J. Phys. Chem. C 2020, 124, 3681–3691. [Google Scholar] [CrossRef]
  27. Tew, M.W.; Emerich, H.; Van Bokhoven, J.A. Formation and Characterization of PdZn Alloy: A Very Selective Catalyst for Alkyne Semihydrogenation. J. Phys. Chem. C 2011, 115, 8457–8465. [Google Scholar] [CrossRef]
  28. Cherkasov, N.; Denissenko, P.; Deshmukh, S.; Rebrov, E.V. Gas-Liquid Hydrogenation in Continuous Flow – The Effect of Mass Transfer and Residence Time in Powder Packed-Bed and Catalyst-Coated Reactors. Chem. Eng. J. 2020, 379, 122292. [Google Scholar] [CrossRef]
  29. Asano, S.; Adams, S.J.; Tsuji, Y.; Yoshizawa, K.; Tahara, A.; Hayashi, J.I.; Cherkasov, N. Homogeneous Catalyst Modifier for Alkyne Semi-Hydrogenation: Systematic Screening in an Automated Flow Reactor and Computational Study on Mechanisms. React. Chem. Eng. 2022, 7, 1818–1826. [Google Scholar] [CrossRef]
  30. Cherkasov, N.; Bai, Y.; Rebrov, E. Process Intensification of Alkynol Semihydrogenation in a Tube Reactor Coated with a Pd/ZnO Catalyst. Catalyst. 2017, 7, 358. [Google Scholar] [CrossRef]
  31. Cherkasov, N.; Al-Rawashdeh, M.; Ibhadon, A.O.; Rebrov, E.V. Scale up Study of Capillary Microreactors in Solvent-Free Semihydrogenation of 2-Methyl-3-Butyn-2-Ol. Catal. Today 2016, 273, 205–212. [Google Scholar] [CrossRef] [Green Version]
  32. Semagina, N.; Grasemann, M.; Xanthopoulos, N.; Renken, A.; Kiwi-Minsker, L. Structured Catalyst of Pd/ZnO on Sintered Metal Fibers for 2-Methyl-3-Butyn-2-Ol Selective Hydrogenation. J. Catal. 2007, 251, 213–222. [Google Scholar] [CrossRef]
  33. Okhlopkova, L.B.; Kerzhentsev, M.A.; Ismagilov, Z.R. Coating the Internal Surface of a Capillary Microreactor for the Selective Hydrogenation of 2-Methyl-3-Butyn-2-Ol by PdxZn1 – x/TiO2 Catalysts. A Kinetic Study. Kinet. Catal. 2018, 59, 450–458. [Google Scholar] [CrossRef]
  34. Okhlopkova, L.B.; Kerzhentsev, M.A.; Tuzikov, F.V.; Larichev, Y.V.; Ismagilov, Z.R. Palladium-Zinc Catalysts on Mesoporous Titania Prepared by Colloid Synthesis. II. Synthesis and Characterization of PdZn/TiO2 Coating on Inner Surface of Fused Silica Capillary. J. Nanoparticle Res. 2012, 14, 1088. [Google Scholar] [CrossRef]
  35. Carter, J.H.; Shah, P.M.; Nowicka, E.; Freakley, S.J.; Morgan, D.J.; Golunski, S.; Hutchings, G.J. Enhanced Activity and Stability of Gold/Ceria-Titania for the Low-Temperature Water-Gas Shift Reaction. Front. Chem. 2019, 7, 443. [Google Scholar] [CrossRef] [PubMed] [Green Version]
  36. Cao, Y.; Ran, R.; Wu, X.; Si, Z.; Kang, F.; Weng, D. Progress on Metal-Support Interactions in Pd-Based Catalysts for Automobile Emission Control. J. Environ. Sci. (China) 2023, 125, 401–426. [Google Scholar] [CrossRef]
  37. Wessels, K.; Minnermann, M.; Rathousky, J.; Wark, M.; Oekermann, T. Influence of Calcination Temperature on the Photoelectrochemical and Photocatarytic Properties of Porous TiO2 Films Electrodeposited from Ti(IV)-Alkoxide Solution. J. Phys. Chem. C 2008, 112, 15122–15128. [Google Scholar] [CrossRef]
  38. Juliet, S.S.; Ramalingom, S.; Ravidhas, C.; Raj, A.M.E. Effect of Calcination Temperature on Titanium Oxide Nanocrystallites in the Anatase Phase Synthesized By Sol-Gel Route. IOSR J. Appl. Phys. 2017, 9, 32–39. [Google Scholar] [CrossRef]
  39. Nikoshvili, L.Z.; Makarova, A.S.; Lyubimova, N.A.; Bykov, A.V.; Sidorov, A.I.; Tyamina, I.Y.; Matveeva, V.G.; Sulman, E.M. Kinetic Study of Selective Hydrogenation of 2-Methyl-3-Butyn-2-Ol over Pd-Containing Hypercrosslinked Polystyrene. Catal. Today 2015, 256, 231–240. [Google Scholar] [CrossRef]
  40. Okhlopkova, L.B.; Prosvirin, I.P.; Kerzhentsev, M.A.; Ismagilov, Z.R. Capillary Microreactor with PdZn/(Ti, Ce)O2 Coating for Selective Hydrogenation of 2-Methyl-3-Butyn-2-Ol. Chem. Eng. Process. - Process Intensif. 2021, 159, 108240. [Google Scholar] [CrossRef]
  41. Okhlopkova, L.B.; Kerzhentsev, M.A.; Ismagilov, Z.R. Internal Surface Coating of a Capillary Microreactor for the Selective Hydrogenation of 2-Methyl-3-Butyn-2-Ol Using a PdZn/TiO2 Catalyst. The Effect of the Catalyst’s Activation Conditions on Its Catalytic Properties. Kinet. Catal. 2018, 59, 347–356. [Google Scholar] [CrossRef]
  42. Naganuma, T.; Traversa, E. Stability of the Ce 3+ Valence State in Cerium Oxide Nanoparticle Layers. Nanoscale 2012, 4, 4950–4953. [Google Scholar] [CrossRef] [PubMed]
  43. Rameshan, C.; Stadlmayr, W.; Weilach, C.; Penner, S.; Lorenz, H.; Hävecker, M.; Blume, R.; Rocha, T.; Teschner, D.; Knop-Gericke, A.; et al. Subsurface-Controlled CO2 Selectivity of PdZn near-Surface Alloys in H2 Generation by Methanol Steam Reforming. Angew. Chemie - Int. Ed. 2010, 49, 3224–3227. [Google Scholar] [CrossRef] [PubMed]
  44. Engels, V.; Jefferson, D.; Benaskar, F.; Thune, P.; Berenguer-Murcia, A.; Johnson, B.; Wheatley, A. Nanoparticulate PdZn - Pathways towards the Synthetic Control of Nanosurface Properties. Nanotechnology 2011, 22, 205701. [Google Scholar] [CrossRef]
  45. Holzapfel, H.H.; Wolfbeisser, A.; Rameshan, C.; Weilach, C.; Rupprechter, G. PdZn Surface Alloys as Models of Methanol Steam Reforming Catalysts: Molecular Studies by LEED, XPS, TPD and PM-IRAS. Top. Catal. 2014, 57, 1218–1228. [Google Scholar] [CrossRef]
  46. Doyle, A.M.; Shaikhutdinov, S.K.; Jackson, S.D.; Freund, H.J. Hydrogenation on Metal Surfaces: Why Are Nanoparticles More Active than Single Crystals? Angew. Chemie Int. Ed. 2003, 42, 5240–5243. [Google Scholar] [CrossRef]
  47. Crespo-Quesada, M.; Andanson, J.M.; Yarulin, A.; Lim, B.; Xia, Y.; Kiwi-Minsker, L. UV-Ozone Cleaning of Supported Poly(Vinylpyrrolidone)-Stabilized Palladium Nanocubes: Effect of Stabilizer Removal on Morphology and Catalytic Behavior. Langmuir 2011, 27, 7909–7916. [Google Scholar] [CrossRef]
  48. Okhlopkova, L.B.; Matus, E.V.; Prosvirin, I.P.; Kerzhentsev, M.A.; Ismagilov, Z.R. Selective Hydrogenation of 2-Methyl-3-Butyn-2-Ol Catalyzed by Embedded Polymer-Protected PdZn Nanoparticles. J. Nanoparticle Res. 2015, 17, 475. [Google Scholar] [CrossRef]
  49. Wowsnick, G.; Teschner, D.; Armbrüster, M.; Kasatkin, I.; Girgsdies, F.; Grin, Y.; Schlögl, R.; Behrens, M. Surface Dynamics of the Intermetallic Catalyst Pd2Ga, Part II - Reactivity and Stability in Liquid-Phase Hydrogenation of Phenylacetylene. J. Catal. 2014, 309, 221–230. [Google Scholar] [CrossRef] [Green Version]
  50. Shen, L.; Mao, S.; Li, J.; Li, M.; Chen, P.; Li, H.; Chen, Z.; Wang, Y. PdZn Intermetallic on a CN@ZnO Hybrid as an Efficient Catalyst for the Semihydrogenation of Alkynols. J. Catal. 2017, 350, 13–20. [Google Scholar] [CrossRef]
  51. Armbruster, M.; Behrens, M.; Cinquini, F.; Fottinger, K.; Grin, Y.; Haghofer, A.; Klotzer, B.; Knop-Gericke, A.; Lorenz, H.; Ota, A.; et al. How to Control the Selectivity of Palladium-Based Catalysts in Hydrogenation Reactions: The Role of Subsurface Chemistry. ChemCatChem 2012, 4, 1048–1063. [Google Scholar] [CrossRef]
  52. Jackson, S.D.; Shaw, L.A. The Liquid-Phase Hydrogenation of Phenyl Acetylene and Styrene on a Salladium /Carbon Catalyst. Appl. Catal. A, Gen. 1996, 134, 91–99. [Google Scholar] [CrossRef]
  53. Jackson, S.D.; Casey, N.J.; Huntington, I.J.; Ts, C. Characterization of the Carboneceous Deposit Formed during the Selective Hydrogenation of Propyne over Palladium/Zirconia. Stud. Surf. Sci. Catal. 1994, 88, 313–318. [Google Scholar] [CrossRef]
  54. Dominguez-Dominguez, S.; Berenguer-Murcia, A.; Cazorla-Amoros, D.; Linares-Solano, A. Semihydrogenation of Phenylacetylene Catalyzed by Metallic Nanoparticles Containing Noble Metals. J. Catal. 2006, 243, 74–81. [Google Scholar] [CrossRef]
  55. AGILENT. Available online: https://www.agilent.com/search/?Ntt=160-2530-10 (accessed on 15 January 2020).
  56. Scofield, J.H. Hartree-Slater Subshell Photoionization Cross-Sections at 1254 and 1487 EV. J. Electron Spectros. Relat. Phenomena 1976, 8, 129–137. [Google Scholar] [CrossRef]
  57. Semagina, N.; Joannet, E.; Parra, S.; Sulman, E.; Renken, A.; Kiwi-Minsker, L. Palladium Nanoparticles Stabilized in Block-Copolymer Micelles for Highly Selective 2-Butyne-1,4-Diol Partial Hydrogenation. Appl. Catal. A Gen. 2005, 280, 141–147. [Google Scholar] [CrossRef] [Green Version]
  58. Kashid, M.N.; Renken, A.; Kiwi-Minsker, L. (Eds.) Microstructured Devices for Chemical Processing; Wiley-VCH Verlag GmbH & Co. KGaA: Weinheim, Germany, 2014; ISBN 9783527685226. [Google Scholar]
  59. Duca, D.; Liotta, L.F.; Deganello, G. Selective Hydrogenation of Phenylacetylene on Pumice-Supported Palladium Catalysts. J. Catal. 1995, 154, 69–79. [Google Scholar] [CrossRef]
  60. Cherkasov, N.; Ibhadon, A.O.; McCue, A.J.; Anderson, J.A.; Johnston, S.K. Palladium-Bismuth Intermetallic and Surface-Poisoned Catalysts for the Semi-Hydrogenation of 2-Methyl-3-Butyn-2-Ol. Appl. Catal. A Gen. 2015, 497, 22–30. [Google Scholar] [CrossRef]
  61. Singh, U.K.; Albert Vannice, M. Liquid-Phase Hydrogenation of Citral over Pt/SiO2 Catalysts: I. Temperature Effects on Activity and Selectivity. J. Catal. 2000, 191, 165–180. [Google Scholar] [CrossRef]
Figure 1. TEM micrographs and histograms of the particle size distribution (inserted) of the powdered catalysts (A) PdZn/TiO2-H-573, (B) PdZn/Ti0.8Zr0.2O2-H-573, (C) PdZn/Ti0.95Ce0.05O2 H-773, (D) PdZn/Ti0.8Zn0.2O1.8-H-573. The white square indicates the size of diffraction area.
Catalysts 12 01660 g001
Figure 2. (A) Pore size distribution of TixM1-xO2±y and (B) pore size distribution of the powdered catalysts PdZn/TixM1-xO2±y (M = Ce, Zr, Zn) calcined in vacuum at 13 mbar, 573 K.
Catalysts 12 01660 g002
Figure 3. TEM and HRTEM (inserted) micrographs of the powdered catalysts (A) PdZn/TiO2-H-573, (B) PdZn/Ti0.8Zr0.2O2-H-573, (C) PdZn/Ti0.95Ce0.05O2-H-773, (D) PdZn/Ti0.8Zn0.2O1.8-H-573.
Catalysts 12 01660 g003
Figure 4. Dependences of the concentrations of MBY, MBE and MBA on the contact time after 28 h of continuous flow on PdZn/TiO2 (A), PdZn/Ti0.8Zr0.2O2 (B), PdZn/Ti0.95Ce0.05O2 (C), PdZn/Ti0.8Zn0.2O1.8 (D), points-experiment, lines-calculation by the Langmuir–Hinshelwood model; also the dependence of the reaction rate on the contact time after 28 h of continuous flow on the PdZn/TiO2 (E), PdZn/Ti0.8Zr0.2O2 (F), PdZn/Ti0.95Ce0.05O2 (G), PdZn/Ti0.8Zn0.2O1.8 (H). Reaction conditions: gas flow rate 6.0 mL/min, = 1 atm, T = 313 K.
Catalysts 12 01660 g004
Figure 5. (A) Activity and (B) MBE selectivity vs. time on stream. *—air, 293 K, 240 h.
Catalysts 12 01660 g005
Figure 6. Peak fitting of Pd3d5/2 core-level spectra of (A) PdZn/TiO2, (B) PdZn/Ti0.95Ce0.05O2 and (C) PdZn/Ti0.8Zn0.2O1.8 after reduction with 30 vol.% hydrogen in argon at 573 K for 2 h.
Catalysts 12 01660 g006
Figure 7. The effect of time on stream and activation conditions on activity and selectivity in the hydrogenation of MBY on coatings (A) PdZn/TiO2, (B) PdZn/Ti0.8Zr0.2O2, (C) PdZn/Ti0.95Ce0.05O2, (D) PdZn/Ti0.8Zn0.2O1.8. Black rectangle—activity (A) and red rectangle—MBE selectivity (SMBE).
Catalysts 12 01660 g007
Figure 8. The effect of time on stream and activation conditions on kinetic constants in the hydrogenation of MBY on coatings (A) PdZn/TiO2, (B) PdZn/Ti0.8Zr0.2O2, (C) PdZn/Ti0.95Ce0.05O2, (D) PdZn/Ti0.8Zn0.2O1.8. Black rectangle—KMBE/KMBY and red rectangle—k2’.
Catalysts 12 01660 g008
Scheme 1. Complete reaction scheme.
Catalysts 12 01660 sch001
Table 1. Physicochemical properties of TixM1−xOy (M = Zr, Ce, Zn) mesoporous supports obtained by varying the calcination temperature.
SupportsCalcination
Temperature, K
Specific Surface Area, m2/gPore Size, nmPore Volume, cm3/gCrystallite Size, nm
TiO2673151.83.80.1326
TiO287323.410.20.06122
Ti0.95Ce0.05O2673261.44.00.22amorphous
Ti0.95Ce0.05O287357.58.90.1449
Ti0.80Zr0.20O2
Ti0.80Zr0.20O2
673185.53.60.0849
873128.65.90.23615
Ti0.80Zn0.20O1.8
Ti0.80Zn0.20O1.8
673250.94.20.253amorphous
8735113.50.21725
Table 2. Influence of catalyst and continuous flow time on reactor productivity, activity, and selectivity in hydrogenation of MBY 1..
SampleMBY Concentration, t=28, mol/LQ, t = 28,
gMBE/day
A, t = 28,
gMBE/s/gPd
S97, t = 28 %MBY Concentration, t = 88, mol/LQ, t = 88,
gMBE/day
A, t = 88,
gMBE/s/gPd
S97, t = 88 %
PdZn/TiO20.83.61.596.72.24.11.397.6
PdZn/Ti0.8Zr0.2O21.06.31.496.82.012.02.693.4
PdZn/Ti0.95Ce0.05O21.03.61.893.72.02.91.496.3
PdZn/Ti0.8Zn0.2O20.40.430.1297.61.01.560.4198.0
1. H2 flow rate—6.00 mL/min, 1 atm H2, 313 K.
Table 3. Kinetic parameters of the hydrogenation reaction of MBY on films PdZn/TixM1-xO2 (M = Zr, Ce, Zn) at 28 h on stream.
ParameterPdZn/TiO2PdZn/Ti0.8Zr0.2O2PdZn/Ti0.95Ce0.05O2.08PdZn/Ti0.8Zn0.2O1.8
k1’/mol/L/s/gPd7147881258186
k2’mol/L/s/gPd13217694114
k3’/mol/L/s/gPd20410.00015
KMBY/L/mol61433056
KMBE/L/mol0.80.610.3
KMBA/L/mol80.010.0011
KMBE/KMBY0.0130.0140.0310.005
KMBA/KMBE100.0170.0013.3
KMBA/KMBY0.132.3 × 10−43.3 × 10−50.02
σMBY, %25.07.524.03.3
σMBE, %5.33.73.90.8
σMBA, %13.08.011.620.7
Q, gMBE/day3.66.33.60.42
S97,%96.796.893.797.5
Table 4. XPS analysis of PdZn/TiO2, PdZn/Ti0.95Ce0.05O2, and PdZn/Ti0.8Zn0.2O1.8 after different pretreatments.
CatalystPretreatmentPd3d5/2Zn2p3/2Ce3d5/2Pd/TiPd/ZnAt. Conc. C, %At. Conc. Zn,%
PdZn/TiO2H2/Ar, 573 K, 2 h335.11022-0.0050.1752.40.31
PdZn/TiO2Air, 573 K, 2 h, H2/Ar, 573 K, 2 h335.31022.3-0.0060.2126.10.53
PdZn/Ti0.95Ce0.05O2H2/Ar, 573 K, 2 h335.11022882.30.0062.050.90.04
PdZn/Ti0.95Ce0.05O2Air, 573 K, 2 h, H2/Ar, 573 K, 2 h335.31022.2882.20.0092.332.10.07
PdZn/Ti0.8Zn0.2O1.8H2/Ar, 573 K, 2 h335.11022.3-0.0030.00543.35.84
PdZn/Ti0.8Zn0.2O1.8Air, 573 K, 2 h, H2/Ar, 573 K, 2 h335.21022.3-0.0040.00726.37.2
Table 5. XPS analysis of Pd 3d5/2 PdZn/TiO2, PdZn/Ti0.95Ce0.05O2, and PdZn/Ti0.8Zn0.2O1.8 after different pretreatments.
CatalystPretreatmentPd(0) (%)PdZn (%)Pd(II) (%)
PdZn/TiO2H2/Ar, 573 K, 2 h48.923.627.5
PdZn/TiO2Air, 573 K, 2 h, H2/Ar, 573 K, 2 h50.527.621.9
PdZn/Ti0.95Ce0.05O2H2/Ar, 573 K, 2 h60.319.520.2
PdZn/Ti0.95Ce0.05O2Air, 573 K, 2 h, H2/Ar, 573 K, 2 h46.118.135.8
PdZn/Ti0.8Zn0.2O1.8H2/Ar, 573 K, 2 h52.636.011.4
PdZn/Ti0.8Zn0.2O1.8Air, 573 K, 2 h, H2/Ar, 573 K, 2 h58.131.810.1
Publisher’s Note: MDPI stays neutral with regard to jurisdictional claims in published maps and institutional affiliations.

