

Research on a New Drag Force Model for Cylindrical Particles in Fixed Bed Reactors


1
Institute of Combustion and Thermal System, School of Mechanical, Electronic, and Control Engineering, Beijing Jiaotong University, Beijing 100044, China
2
School of Energy and Power Engineering, Shandong University, Jinan 250061, China
3
Department of Chemical and Biological Engineering, University of British Columbia, 2360 East Mall, Vancouver, BC V6T 1Z3, Canada
*
Authors to whom correspondence should be addressed.
Catalysts 2022, 12(10), 1120; https://doi.org/10.3390/catal12101120
Submission received: 30 August 2022
/
Revised: 15 September 2022
/
Accepted: 23 September 2022
/
Published: 27 September 2022
(This article belongs to the Special Issue Catalysts: Reactor Modeling Using Computational Fluid Dynamics)
Abstract
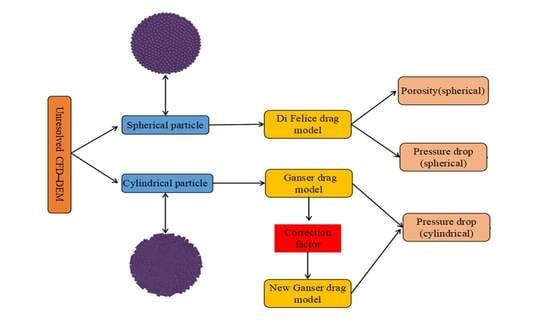
:Fixed bed reactors play an important role in converting solid wastes to high-quality products. The solid wastes, as well as the corresponding catalysts, are often made into cylindrical particles. However, research on the drag force for cylindrical particles is still rarely reported. In this work, the fixed bed porosity was firstly predicted with the unresolved CFD-DEM method and validated against experimental data. Then, the Ergun model, Di Felice model, and Ganser model were evaluated against the reported pressure drop data for both the spherical and cylindrical particles, so that a more solid drag force theory could be selected as a candidate for cylindrical particles. Finally, a new Ganser model was proposed for cylindrical particle drag force prediction based on the reported experimental results and validated by other experimental data. It was found that, for the spherical particle bed, the relative prediction errors of the Di Felice model are approximately 10%, while those of the Ergun model are approximately 15%. For the cylindrical particle bed, the relative prediction errors of the Ganser model are approximately 10%, while those of the Di Felice model are much higher than 10%. With the new Ganser model proposed in this work, the maximum error between the predicted pressure drop and the experimental data can be lowered to approximately 5%. The research is of reference value for drag force model selection when simulating similar FBRs with cylindrical particles.
1. Introduction
Fixed bed reactors (FBRs) can be used for converting solid wastes to high-quality products [1]. Compared with other kinds of reactors, like entrained bed and fluidized bed reactors [2,3], FBRs have the advantages of lower cost and higher feasibility. In terms of bed materials in FBRs, solid waste and the corresponding catalysts are easily made into cylindrical particles [4]. Although FBRs have many advantages, they also suffer from the disadvantage of nonuniform field distribution. It is therefore necessary to deeply study the FBR hydrodynamics so as to mitigate or avoid such a defect. Up to now, many methods have been developed to study the FBR operating property. However, specific reports on the drag force for cylindrical particles in FBR are still rarely seen, hindering the deep understanding of the hydrodynamics in FBR filled with cylindrical particles.
The research methods for FBRs typically include experiments, empirical correlations [5,6,7], and computational fluid dynamics (CFD) simulation [8,9,10,11,12]. Experiments are usually time consuming and cost expensive, while the empirical correlations are usually one- or zero-dimensional and cannot reflect the detailed process in FBRs. In comparison, CFD simulation is very promising because this method can not only predict the detailed physicochemical processes in FBRs but can also be cost effective.
The Eulerian–Eulerian method and the four-way coupling Eulerian–Lagrangian method are usually chosen to simulate dense particle bed in FBRs. For the former method, both the carrier phase and particle phase are considered as fluid, and the particle phase is modeled with the granular kinetic theory [13]. For the latter, the carrier phase is considered as fluid while the particles are tracked in the Lagrangian coordinate with the Discrete Element Method (DEM) [14], known as the CFD-DEM method, which can be further classified into the resolved method [8,15,16] and unresolved method [17,18,19]. Compared with the resolved method, the unresolved method does not require integration along the boundary of particles and works well with coarse mesh. For FBRs with a large number of particles, the unresolved method can be more effective.
For any of the above-mentioned FBR simulation methods, the gas–particle drag model is essential. So far, many models for gas–particle drag force prediction have been developed. The Ergun model [5] is only valid for dense particle flow, while the Wen-Yu [20] model is only valid for dilute particle flow. Gidaspow [21] combined the two models, by using the Ergun equation for bed porosity of less than 0.8 and the Wen-Yu equation for bed porosity greater than 0.8. The Di Felice [22] model determines the drag force as the function of particle Reynolds numbers and porosity and is applicable to the full range of particle Reynolds numbers and porosity. Besides the models originally developed for spherical particles, drag force models for non-spherical particles have also been widely researched. Haider [23] proposed an expression for the drag coefficient of isolated non-spherical particles, which mainly consists of four functions to consider the particle sphericity. Ganser [24] considered the shape and projected area of the particles with the Stokes’ shape factor and Newton’s shape factor and summarized the expression for the drag coefficient of non-spherical particles by dimensionless analysis and similarity criterion. Holzer [25] proposed the expressions for the drag coefficient of non-spherical particles in the full range of Reynolds number based on Ganser’s results. Zhang [26] studied the fluidization behavior of the cylindrical particles with the multi-sphere and bond-sphere models, and the drag force was calculated with the Di Felice model. Gao [27] developed the Super DEM-CFD coupled model for non-spherical particle fluidization and found that the Di Felice-Holzer/Sommerfeld drag force model performed well for particles with different shapes.
It can be seen from the literature review that, although many efforts have made regarding fixed bed simulation, specific research on the drag force model for a cylindrical particle bed in FBRs is still rarely reported. The present study first evaluates both the Ergun model and Di Felice model when predicting the drag force for a packed bed with spherical particles. Then, the Di Felice model and Ganser model are evaluated when predicting the drag force for packed bed with cylindrical particles, and the Ganser model is proved be more advanced. Finally, the Ganser model is further modified so that it can predict the drag force for cylindrical particles more accurately.
2. Mathematical Model and Numerical Solution
The commercial software Fluent and EDEM are coupled by a user defined interface. Fluent calculates the porosity and the fluid dynamics in a given time step. Then, EDEM calculates and transmits the particle position and velocity information to Fluent in the same time step. Finally, the drag force is calculated and transferred to EDEM through the user defined interface to solve the particle motion, and the new drag force is fed back to Fluent through the source term of the momentum equation. The volume averaging method is adopted to obtain the porosity in the governing equations [28]. The unresolved CFD-DEM method mainly includes the governing equations for fluid phase, particles, and the drag force model that calculates the interphase momentum exchange [29,30].
Before the final simulation, three meshes with 3560, 4900, and 6848 cells were tested for the independence analysis. In the independence analysis, the particle diameter was 0.005 m, the porosity was 0.388 and the inlet Reynolds number was 141. The pressure drop values from the three meshes were close, and approximately 850 Pa. In addition, for CFD-DEM simulation, it is required that the mesh should be at least three times the size of the particles. Therefore, the mesh size cannot be too small in the simulation. Then, the mesh with 4900 cells was chosen for the simulation.
2.1. Governing Equations for Fluid Phase
The mass conservation equation is defined as:
where ɛf is the local porosity, ρf is the density of the fluid, t is time and uf is the velocity of fluid. The momentum conservation equation is defined as:
where p is the pressure, g is the gravitational acceleration vector, Fdrag is the drag force between phases, which will be discussed later, and τf is the viscous stress tensor that can be calculated from Equation (3). The porosity and interphase momentum term are calculated by a coupling routine and communicated to Fluent at each calculation step.
where δ is the unit tensor with components, μf is dynamic viscosity of fluid, μt is turbulence viscosity calculated with the k-epsilon equations.
2.2. Governing Equations for Particle Phase
The DEM method is based on the Cundall and Strack theory [31]. The complex behavior of particle–particle collisions is simplified to be a spring–dashpot interaction [32]. The motion of the particle is calculated by Newton’s law of motion. The linear velocity of the particle is given as:
where up is the linear velocity of particle, mp is the mass of particle, Fp-p and Fp-w are the particle–particle and particle–wall contact forces. In this work, Fp-f is the particle–fluid interaction force which is defined as Equation (5).
where di is the diameter of spherical particle, and Vi is the volume of particle. The first term on the right side of Equation (5) is associated with the fluid kinetic force, which contains the relative velocity Ur = uf − up, referred to as Stokes–Einstein drag force. The second term is the force exerted by the fluid even if it was stationary, referred to as the pressure gradient force. The interaction forces between the fluid and the particles also include the Bassett force, the added-mass force, the Saffman force and Magnus lift force, but they are negligible in the fixed bed reactor where particles move very slowly. The rotation of the particle is defined as:
where Mc is the contact force and torque acting on the particle, Mp-f is the fluid rotational resistance torque on the particle, Ip is the rotational inertia of particle, and ωp is the angular velocity of particle.
2.3. Drag Force Model
The drag force on the sphere particle is calculated by:
where A denotes the projection area of the particle, χ is an empirical value, and Cd denotes the drag coefficient. For different drag models, the expressions of the drag coefficients are different. Di Felice [22] obtained the drag coefficient by fitting the FBR experimental data. The drag force model is valid for both dense and dilute particle flows. In Di Felice, the drag model, χ and Cd are defined as:
where Rei is the particle Reynolds number. It should be noted that all particles are assumed to be spherical here. For particles of different shapes, the drag coefficient needs to be redefined.
2.4. Porosity Calculation
Besides the drag force model, the local porosity is also contained in the fluid governing equations [32]. Therefore, this parameter can significantly affect the CFD-DEM simulation results. EDEM can calculate the porosity of each computational cell based on the number of particles and particle position. This method does not rely on the correlation of the porosity distribution and can predict the properties of the fluid more accurately.
To overcome the calculation error when the particles are at the boundary of the computational cell, the sub-element method [33] is adopted in this paper. With this method, each particle is divided into N equal parts, and each part has a center point Pi,j. For each particle, if the center of these sub-elements is in the computational cell, the volume of the sub-element will be counted.
3. Results and Discussion
3.1. Packing Porosity with Spherical Particles
The model is first validated against reported FBR experimental data [34]. The experiment is carried out in a FBR filled with spherical particles, the inner diameter of the FBR is 0.1 m, and the effective filling height of the FBR is 0.7 m. The simulated object is shown in Figure 1. For FBR with spherical particles, the mean porosity could be expressed as:
where N is the number of spherical particles in FBR, di is the diameter of the spherical particles, D is the inner diameter of the FBR, and H is the effective filling height (particles accumulation height) of the FBR.
First, the number of particles are calculated according to the experimental mean porosity and Equation (11). Then, the virtual particles of different sizes are dynamically packed in EDEM software to form a dense particle fixed bed. Finally, a coupled CFD-DEM program solves the pressure drop of FBR at different superficial velocity. Air is injected from the bottom of FBR at Reynolds number from 20 to 170. Table 1 lists the characteristics of the simulated particle beds, and the simulated mean porosity agrees well with the experimental data.
Figure 1.
Three cases based on experimental study of Park et al. [34]: (a) case (A) di = 0.005 m; (b) case (B) di = 0.0035 m; and (c) case (C) di = 0.002 m.
Figure 1.
Three cases based on experimental study of Park et al. [34]: (a) case (A) di = 0.005 m; (b) case (B) di = 0.0035 m; and (c) case (C) di = 0.002 m.

In order to further study the effect of porosity in FBR, the porosity distribution in FBR was first studied. Particles of different sizes were filled into the FBR with an effective height of 0.7 m, and the porosity was then calculated based on the position of the particles in the computational cell. The distributions of average axial porosity for different particle sizes are shown in Figure 2a. The average axial porosity decreases sharply as the height increases, then becomes flat in the middle, and finally increases sharply as the height increases. The average axial porosity at the middle part is mostly between 0.37 and 0.4, and the fluctuation is small. The height of 0 m and 0.7 m correspond to the bottom and top of the particle bed. Because there are no particles below the bottom or above the top, the voids on the horizontal plane of the bottom and top will be very large, so the average axial porosity in these two places is much larger than those in the middle.
Research on the average radial porosity of FBR has always been a hot topic. Figure 2b shows the average radial porosity distribution (ɛ(r)) for different particle sizes. It can be seen that the porosity is larger near the wall and remains basically unchanged when the radius is less than 0.025. The average radial porosity of case (c) is obviously larger than that of the other two groups, mainly because the mean porosity of case (c) is larger than that of the other two groups.
Klerk et al. [35] provided experimental data for different pipe–particle diameter ratios and concluded Equation (12) for the average radial porosity.
where ɛb is the average bulk porosity for unconfined packing (Usually the value is 0.36–0.4), r is radial position relative to the FBR center line (the abscissa in Figure 2b), R is the radius of the FBR and di is the particle di
Figure 3 shows that the average radial porosity calculated by the empirical formula (Equation (12)) oscillates with the increase of the abscissa. Near the wall of FBR, both the average radial porosity and the oscillation amplitude are big. After about five particle diameters’ length, the oscillation amplitude of the average radial porosity becomes insignificant and closes to 0.36. Because the ratio of the mesh size to the particle diameter is greater than 3, the grid near the wall is sparse, and the predicted average radial porosity near the FBR wall is not accurate. After 4–5 particle diameters’ length, the EDEM prediction result matches the experimental value well.
Figure 3.
Comparison of the average radial porosity between simulation and experimental data of Klerk et al. [35].
Figure 3.
Comparison of the average radial porosity between simulation and experimental data of Klerk et al. [35].

3.2. Pressure Drop for Packed Bed with Spherical Particles
The porosity and particle diameter play a leading role in the pressure drop of FBR. Therefore, three kinds of spherical particles with different diameters of 0.002, 0.0035 and 0.005 m, are numerically simulated. Figure 4a–c, respectively, show the pressure drop data of the FBRs with three different-sized spherical particles. The simulation results are compared with the corresponding experimental data and the Ergun equation’s prediction. The Ergun equation expressed as Equation (13) is mainly composed of two terms including the turbulent flow term (S1) and the laminar flow term (S2).
where P0 is inlet pressure of FBR, H is the height of FBR, G is the mass flux, Rg is gas constant, T is the temperature, MW is the molecular weight of gas through FBR, S1 = 1.75, and S2 = 150.
The overall change trends of the three cases are the same. As the particle Reynolds number increases, the pressure drop gradually increases. The prediction results from both the Ergun equation and the simulation are slightly lower than the experimental data. Compared to the Ergun equation, the predicted pressure drop is closer to the experimental data.
The maximum relative error between the simulated data and the experimental data is less than 13%. The deviation between simulated data and experimental data is mainly caused by two aspects. First, although EDEM has excellently presented the dynamic packing process of particles in FBR and the mean porosity is in good agreement with the experiment, the established fixed bed model cannot be exactly the same as the experimental one. Second, the particle–wall and particle–particle friction also affects the simulation results, which is not fully reflected in the numerical model. But it must be admitted that the Di Felice drag model is effective for predicting the pressure drop in FBR with spherical particles.
3.3. New Drag Coefficient Model for Cylindrical Particles
Figure 5 sketches a FBR filled with two cylindrical particles of different sizes. The process of simulating the pressure drop characteristics of a FBR filled with cylindrical particles is roughly the same as that of a FBR filled with spherical particles. However, there are two main differences between the two simulations in terms of methodologies on the particle diameter and the mean porosity. For the cylindrical particles, the Di Felice model uses an equivalent diameter proposed by Li and Ma [36] like:
where the Sauter mean diameter (dsd) [36] and sphericity (φ) [37] are determined by:
where Vp is the volume of the cylindrical particle and Ap is the surface area of the cylindrical particle. The sphericity is the ratio of the surface area of an ideal sphere with identical volume to the surface area of the cylindrical particle. According to the Di Felice model, the cylindrical particle Reynolds number and the drag force are calculated by:
Different from the Di Felice model, the Ganser [24] model calculates the particle Reynolds number based on the equivalent volume particle size and introduces the Stokes’ shape factor and Newton’s shape factor to calculate the drag coefficient. The expressions of the Stokes’ shape factor and Newton’s shape factor are given by dimensionless analysis and similarity criterion, and the drag coefficient is organized as a function of a generalized Reynolds number (ReiK1K2). For cylindrical particles, the Ganser model calculates the particle Reynolds number and drag coefficient with:
where the Stokes’ shape factor and Newton’s shape factor are calculated by:
where dA is the diameter of sphere with equivalent projected area, dV is the diameter of sphere with equivalent volume. For cylindrical particles, the Ganser model calculates the drag force with:
For FBR with cylindrical particles, the mean porosity [38] can be expressed as:
where N is the number of cylindrical particles in the particle fixed bed, d and L are the diameter and length of the cylindrical particle, respectively. The characteristics of cylindrical particle the simulation and experiment are listed in Table 2 [34].
Figure 6a,b show the pressure drop data of the FBRs with two different sized cylindrical particles. The relative errors between the Ganser prediction, the Di Felice prediction, the Wu [39] calculation results and the experimental data are sorted out. It can be seen that the Ganser drag model can give more accurate pressure drop prediction for cylindrical particles than the Di Felice model. The maximum relative error between the simulated Ganser pressure drop and experimental pressure drop does not exceed 13%. This is because the Ganser drag coefficient (Cd′) with shape factors such as Stokes’ shape factor, Newton’s shape factor, and sphericity can calculate the drag force of non-spherical particles better.
To further improve the Ganser model so that it can give more accurate drag force prediction for cylindrical particles, a correction factor K′ is added in the Ganser drag coefficient as shown in Equation (25). The fitting method is used to find the relationship between K′ and the particle Reynolds number. The expression of the cylindrical particle drag coefficient (Cdc′) is:
The correction factor (K′) can be expressed as follows:
Note that the new Ganser model is built based on cylindrical particles with a diameter of 0.00498 m and a length of 0.0139 m. The experimental pressure drop data for cylindrical particles with diameter of 0.00198 m and length of 0.00495 m are then used to verify the accuracy of this model. It is seen from Figure 7 that the new Ganser model can reduce the relative error to below 10%. The comparison indicates that the correction factor can be proper for cylindrical particles with different sizes. The choice of experimental data may affect the coefficients of the correction factor, but the effects can be small. This has been proved by comparing the predictions of the drag force model from one set of experimental data with another set of experimental data.
4. Conclusions
Accurate prediction of drag force is essential for pressure drop prediction in FBR with spherical or non-spherical particles. In this work, particle porosity prediction with the particle-unresolved CFD-DEM method was firstly validated. Then, the Di Felice model and Ergun model were compared for the drag force prediction of spherical particle bed, and the Di Felice model and Ganser model were compared for drag force prediction of the cylindrical particle bed base. Finally, a new Ganser model was put forward to specifically deal with the drag force between the gas and cylindrical particles. From this work, important conclusions can be drawn as follows:
- (1)
- The unsolved CFD-DEM model can accurately predict the porosity distribution in FBR;
- (2)
- For the spherical particle bed, the Di Felice model is more advanced than the Ergun model. The relative prediction errors of the Di Felice model are approximately 10%, while those of the Ergun model are approximately 15%. For the cylindrical particle bed, the Ganser model is more advanced than the Di Felice model. The relative prediction errors of the Ganser model are approximately 10%, while those of the Di Felice model are greater than 10%;
- (3)
- The new Ganser model can provide more accurate predictions for pressure drop of a packed bed with cylindrical particles. The maximum relative error between the simulated pressure drop and the experimental data is approximately 5%.
Author Contributions
Conceptualization, L.Y. and L.W.; methodology, L.Y. and L.W.; software, L.Y. and L.W.; validation, L.Y. and L.W.; formal analysis, L.Y. and L.W.; investigation, L.W.; resources, L.Y.; data curation, L.Y. and L.W.; writing—original draft preparation, L.Y., L.W., Z.W., C.G., B.H. and B.F.; writing—review and editing, L.Y. and B.F.; visualization, L.Y. and B.F.; supervision, L.Y.; project administration, L.Y.; funding acquisition, L.Y. All authors have read and agreed to the published version of the manuscript.
Funding
This research was funded by [National Natural Science Foundation of China] grant number [51706012].
Informed Consent Statement
Informed consent was obtained from all subjects.
Data Availability Statement
Data will be made available upon request from the corresponding authors.
Acknowledgments
The authors gratefully acknowledge financial support from the National Natural Science Foundation of China (NSFC, 51706012) for this work.
Conflicts of Interest
The authors declare no conflict of interest.
Nomenclature
| A | projection area of spherical particle, [m2] |
| Ap | surface area of cylindrical particle, [m2] |
| Cd | drag coefficient, [-] |
| Cd’ | ganser model drag coefficient, [-] |
| Cdc’ | new drag coefficient for cylindrical particle, [-] |
| D | inner diameter of the FBR, [m] |
| d | diameter of cylindrical particle, [m] |
| dA | diameter of sphere with equivalent projected area, [m] |
| dV | diameter of sphere with equivalent volume, [m] |
| di | diameter of spherical particle, [m] |
| deq | equivalent diameter, [m] |
| dsd | Sauter mean diameter, [m] |
| Fdrag | drag force, [N] |
| F∇p | pressure gradient force on particle, [N] |
| Fp-f | Particle–fluid interaction force, [N] |
| Fp-p | Particle–particle contact force, [N] |
| Fp-w | Particle–wall contact force, [N] |
| G | mass flux of gas through FBR, [kg/m2·s] |
| g | gravitational acceleration vector, [m/s2] |
| H | effective filling height of the FBR, [m] |
| Ip | rotational inertia of particle, [kg·m2] |
| K1 | Stokes’ shape factor, [-] |
| K2 | Newton’s shape factor, [-] |
| K | correction factor, [-] |
| KC | number of particles that their centers are located within computational cell, [-] |
| KV | number of particles partially located within computational cell, [-] |
| L | height of cylindrical particle, [m] |
| Mc | contact torque acting on particle, [N·m] |
| Mw | molecular weight of gas through FBR, [g/mol] |
| Mp-f | fluid rotational resistance torque on particle, [N·m] |
| mp | mass of particle, [kg] |
| N | number of particles in FBR, [-] |
| Pi,j | center point of each part, [-] |
| P0 | inlet pressure of FBR, [Pa] |
| p | pressure, [Pa] |
| ΔP | bed pressure drop, [Pa] |
| Rei | particle Reynolds number, [-] |
| Rg | gas constant, [8.314 J/(K · mol)] |
| R | radius of the FBR, [m] |
| r | radial position relative to the FBR center line, [m] |
| S1, S2 | Ergun’s constant, [-] |
| T | temperature, [K] |
| t | time, [s] |
| Ur | relative velocity between particle and fluid, [m/s] |
| uf | velocity of fluid, [m/s] |
| up | velocity of particle, [m/s] |
| Vcell | volume of fluid computational cell, [m3] |
| Vi | volume of particle, [m3] |
| Vp | volume of cylindrical particle, [m3] |
| Greek symbols | |
| ∂ | differential operator, [-] |
| ∇ | nabla operator, [-] |
| εf | local porosity, [-] |
| ε | mean porosity of FBR, [-] |
| ε(h) | average axial porosity of FBR, [-] |
| ε(r) | average radial porosity of FBR, [-] |
| εb | average bulk porosity for unconfined packing, [-] |
| ρf | density of fluid, [kg/m3] |
| τf | viscous stress tensor, [N/m2] |
| δ | unit tensor with components, [-] |
| μf | fluid dynamic viscosity, [m2/s] |
| μt | turbulent viscosity, [m2/s] |
| ωp | angular velocity of particle, [rad/s] |
| χ | empirical coefficient, [-] |
| φi | volume fraction of particle i that belongs to the computational cell, [-] |
| φ | sphericity, [-] |
| Superscripts and Subscripts | |
| f | fluid |
| p | particle |
| cell | computational cell |
| Abbreviations | |
| CFD | computational fluid dynamics |
| DEM | descrete element method |
| FBR | fixed bed reactor |
References
- Tacuri, D.; Andrade, C.; Álvarez, P.; Abril-González, M.; Zalamea, S.; Pinos-Vélez, V.; Jara, L.; Montero-Izquierdo, A. Design and development of a catalytic fixed-bed reactor for gasification of banana biomass in hydrogen production. Catalysts 2022, 12, 395. [Google Scholar] [CrossRef]
- Mao, H.; Jiang, H.; Sang, L.; Li, S.; Chen, F.; Zhao, Z. An integrated ionic liquid hybrid polymeric fixed-bed reactor with a porous sponge-like structure for biomass hydrolysis. Chem. Eng. Sci. 2022, 253, 117562. [Google Scholar] [CrossRef]
- Petrazzuoli, V.; Rolland, M.; Sassanis, V.; Ngu, V.; Schuurman, Y.; Gamet, L. Numerical prediction of Péclet number in small-sized fixed bed reactors of spheres. Chem. Eng. Sci. 2021, 240, 116667. [Google Scholar] [CrossRef]
- Steffen, F.; Gregor, D.W. Synthetic Packed-Bed Generation for CFD Simulations: Blender vs. STAR-CCM+. ChemEngineering 2019, 3, 52. [Google Scholar]
- Ergun, S. Fluid flow through packed columns. Chem. Eng. Prog. 1952, 48, 89. [Google Scholar]
- Gai, J.; Wu, Z.; Gao, N.; Xu, H.; Wang, D.; Zhou, F.; Nie, Y. Novel packed bed reactor designed for Prileschajew epoxidation of fatty acid methyl ester: Intensification of mass/heat transfer. Chem. Eng. Process.-Process Intensif. 2022, 176, 108960. [Google Scholar]
- Bester, P.; du Toit, C.G. A methodology to analyse the angular, radial and regional porosities of a cylindrical packed bed of spheres. Nucl. Eng. Des. 2022, 66, 111766. [Google Scholar] [CrossRef]
- Zhang, M.; He, D.; Geng, Z. A particle-resolved CFD model coupling reaction-diffusion inside fixed-bed reactor. Adv. Powder Technol. 2019, 30, 1226–1238. [Google Scholar]
- Daymo, E.A.; Hettel, M.; Deutschmann, O.; Wehinger, G.D. Accelerating particle-resolved CFD simulations of catalytic fixed-bed reactors with DUO. Chem. Eng. Sci. 2022, 250, 117408. [Google Scholar] [CrossRef]
- Dixon, A.G. Particle-resolved CFD simulation of fixed bed pressure drop at moderate to high Reynolds number. Powder Technol. 2021, 358, 69–82. [Google Scholar] [CrossRef]
- Kutscherauer, M.; Böcklein, S.; Mestl, G.; Turek, T.; Wehinger, G.D. An improved contact modification routine for a computationally efficient CFD simulation of packed beds. Chem. Eng. J. Adv. 2022, 9, 100197. [Google Scholar] [CrossRef]
- Walayat, K.; Wang, Z.; Usman, K. An efficient multi-grid finite element fictitious boundary method for particulate flows with thermal convection. Int. J. Heat Mass Transf. 2018, 126, 452–465. [Google Scholar] [CrossRef]
- Rabiee, R.; Monzavi, M.; Shabanian, J.; Shams, A.; Golshan, S.; Jafari, R.; Blais, B.; Chaouki, J. Two-Phase flow characterization of a rotating packed bed through CFD simulation in OpenFOAM. Chem. Eng. Sci. 2022, 253, 117589. [Google Scholar] [CrossRef]
- Vångö, M.; Pirker, S.; Lichtenegger, T. Unresolved CFD–DEM modeling of multiphase flow in densely packed particle beds. Appl. Math. Model. 2018, 56, 501–516. [Google Scholar] [CrossRef]
- Kravets, B.; Schulz, D.; Jasevičius, R.; Reinecke, S.R.; Rosemann, T.; Kruggel-Emden, H. Comparison of particle-resolved DNS (PR-DNS) and non-resolved DEM/CFD simulations of flow through homogenous ensembles of fixed spherical and non-spherical particles. Adv. Powder Technol. 2021, 32, 1170–1195. [Google Scholar] [CrossRef]
- Tabib, M.V.; Johansen, S.T.; Amini, S. A 3D CFD-DEM methodology for simulating industrial scale packed bed chemical looping combustion reactors. Ind. Eng. Chem. Res. 2013, 52, 12041–12058. [Google Scholar] [CrossRef]
- Baniasadi, M.; Peters, B. Resolving multiphase flow through packed bed of solid particles using extended discrete element method with porosity calculation. Ind. Eng. Chem. Res. 2017, 56, 11996–12008. [Google Scholar] [CrossRef]
- Wang, Z.; Teng, Y.; Liu, M. A semi-resolved CFD-DEM approach for particulate flows with kernel based approximation and Hilbert curve based searching strategy. J. Comput. Phys. 2019, 384, 151–169. [Google Scholar] [CrossRef]
- Nijssen, T.M.J.; Kuipers, H.A.M.; Stel, J.; Adema, A.T.; Buist, K.A. Complete liquid-solid momentum coupling for unresolved CFD-DEM simulations. Int. J. Multiph. Flow 2020, 132, 103425. [Google Scholar] [CrossRef]
- Wen, C.Y.; Yu, Y.H. Mechanics of fluidization. Chem. Eng. Prog. Symp. Ser. 1966, 62, 100–111. [Google Scholar]
- Gidaspow, D. Multiphase Flow and Fluidization: Continuum and Kinetic Theory Description; Academic Press: San Diego, CA, USA, 1994. [Google Scholar]
- Felice, R.D. The voidage function for fluid-particle interaction systems. Int. J. Multiph. Flow 1994, 20, 153–159. [Google Scholar] [CrossRef]
- Haider, A.; Levenspiel, O. Drag coefficient and terminal velocity of spherical and nonspherical particles. Powder Technol. 1989, 58, 63–70. [Google Scholar] [CrossRef]
- Ganser, G.H. A rational approach to drag prediction of spherical and non-spherical particles. Powder Technol. 1993, 77, 143–152. [Google Scholar] [CrossRef]
- Hölzer, A.; Sommerfeld, M. New simple correlation formula for the drag coefficient of non-spherical particles. Powder Technol. 2008, 184, 361–365. [Google Scholar] [CrossRef]
- Zhou, Z.Y.; Kuang, S.B.; Chu, K.W. Discrete particle simulation of particle–fluid flow: Model formulations and their applicability. J. Fluid Mech. 2010, 661, 482–510. [Google Scholar] [CrossRef]
- Gao, X.; Yu, J.; Lu, L.; Li, C.; Rogers, W.A. Development and validation of SuperDEM-CFD coupled model for simulating non-spherical particles hydrodynamics in fluidized beds. Chem. Eng. J. 2021, 420, 127654. [Google Scholar] [CrossRef]
- Zhang, R.; Ku, X.; Lin, J. Fluidization of the spherocylindrical particles: Comparison of multi-sphere and bond-sphere models. Chem. Eng. Sci. 2022, 253, 117540. [Google Scholar] [CrossRef]
- Volk, A.; Ghia, U.; Stoltz, C. Effect of grid type and refinement method on CFD-DEM solution trend with grid size. Powder Technol. 2017, 311, 137–146. [Google Scholar] [CrossRef]
- Saidi, M.; Tabrizi, H.B.; Grace, J.R. Hydrodynamic investigation of gas-solid flow in rectangular spout-fluid bed using CFD-DEM modeling. Powder Technol. 2015, 284, 355–364. [Google Scholar] [CrossRef]
- Tsuji, Y.; Tanaka, T.; Ishida, T. Lagrangian numerical simulation of plug flow of cohesionless particles in a horizontal pipe. Powder Technol. 1992, 71, 238–250. [Google Scholar] [CrossRef]
- Bester, P.M.; Toit, C.G.D.; Potgieter, M.C. A numerical analysis of the porosity of the HTR-10 packed pebble bed. Nucl. Eng. Des. 2021, 383, 111438. [Google Scholar] [CrossRef]
- Hilton, J.E.; Mason, L.R.; Cleary, P.W. Dynamics of gas-solid fluidised beds with non-spherical particle geometry. Chem. Eng. Sci. 2010, 65, 1584–1596. [Google Scholar] [CrossRef]
- Park, J.H.; Lee, M.; Moriyama, K. Influence of particle morphology on pressure gradients of single-phase air flow in the mono-size non-spherical particle beds. Ann. Nucl. Energy 2018, 115, 1–8. [Google Scholar] [CrossRef]
- Klerk, A.D. Voidage variation in packed beds at small column to particle diameter ratio. AIChE J. 2003, 49, 2022–2079. [Google Scholar] [CrossRef]
- Li, L.; Ma, W. Experimental characterization of the effective particle diameter of a particulate bed packed with multi-diameter spheres. Ann. Nucl. Energy 2011, 241, 1736–1745. [Google Scholar] [CrossRef]
- Pozzobon, V.; Colin, J.; Perré, P. Hydrodynamics of a packed bed of non-spherical polydisperse particles: A fully virtual approach validated by experiments. Chem. Eng. J. 2018, 354, 126–136. [Google Scholar] [CrossRef]
- Zhang, M.; He, D.; Geng, Z. Computational study of flow and heat transfer in fixed beds with cylindrical particles for low tube to particle diameter ratios. Chem. Eng. Res. Des. 2018, 132, 149–161. [Google Scholar] [CrossRef]
- Wu, J.; Yu, B.; Yun, M. A resistance model for flow through porous media. Transp. Porous Media 2008, 71, 331–343. [Google Scholar] [CrossRef]
Figure 2.
Average porosity distribution of three cases: (a) distribution of average axial porosity, and (b) distribution of average radial porosity.
Figure 2.
Average porosity distribution of three cases: (a) distribution of average axial porosity, and (b) distribution of average radial porosity.

Figure 4.
Comparison of pressure drop for three spherical particles: (a) 0.005 m in diameter; (b) 0.0035 m in diameter; and (c) 0.002 m in diameter.
Figure 4.
Comparison of pressure drop for three spherical particles: (a) 0.005 m in diameter; (b) 0.0035 m in diameter; and (c) 0.002 m in diameter.


Figure 5.
Two cases based on experimental study of Park et al. [34]: (D) d = 0.00498 m L = 0.0139 m; and (E) d = 0.00198 m L = 0.00495 m.
Figure 5.
Two cases based on experimental study of Park et al. [34]: (D) d = 0.00498 m L = 0.0139 m; and (E) d = 0.00198 m L = 0.00495 m.

Figure 6.
Comparison of pressure drop for two cylindrical particles with the Di Felice model and Ganser model: (a) 0.00498d and 0.0139L; and (b) 0.00198d and 0.00495L.
Figure 6.
Comparison of pressure drop for two cylindrical particles with the Di Felice model and Ganser model: (a) 0.00498d and 0.0139L; and (b) 0.00198d and 0.00495L.

Figure 7.
Comparison of pressure drop for two cylindrical particles with New Ganser model: (a) 0.00498d and 0.0139L; and (b) 0.00198d and 0.00495L.
Figure 7.
Comparison of pressure drop for two cylindrical particles with New Ganser model: (a) 0.00498d and 0.0139L; and (b) 0.00198d and 0.00495L.


Table 2.
Characteristics of cylindrical particle beds.
| Case | Particle Shape | Particle Size (m) | Particle Number | Simulated Mean Porosity | Experimental Mean Porosity |
|---|---|---|---|---|---|
| case (D) | cylindrical | 0.00498d × 0.0139L | 12,285 | 0.395 | 0.395 |
| case (E) | cylindrical | 0.00198d × 0.00495L | 220,396 | 0.389 | 0.389 |
Table 1.
Characteristics of case sphere particle beds.
| Case | Particle Shape | Particle Diameter (m) | Particle Number | Simulated Mean Porosity | Experimental Mean Porosity |
|---|---|---|---|---|---|
| case (A) | sphere | 0.005 | 51,408 | 0.388 | 0.388 |
| case (B) | sphere | 0.0035 | 151,347 | 0.382 | 0.382 |
| case (C) | sphere | 0.002 | 784,875 | 0.402 | 0.402 |
Publisher’s Note: MDPI stays neutral with regard to jurisdictional claims in published maps and institutional affiliations. |
© 2022 by the authors. Licensee MDPI, Basel, Switzerland. This article is an open access article distributed under the terms and conditions of the Creative Commons Attribution (CC BY) license (https://creativecommons.org/licenses/by/4.0/).
Share and Cite
MDPI and ACS Style
Yan, L.; Wang, L.; Wang, Z.; Geng, C.; He, B.; Fang, B. Research on a New Drag Force Model for Cylindrical Particles in Fixed Bed Reactors. Catalysts 2022, 12, 1120. https://doi.org/10.3390/catal12101120
AMA Style
Yan L, Wang L, Wang Z, Geng C, He B, Fang B. Research on a New Drag Force Model for Cylindrical Particles in Fixed Bed Reactors. Catalysts. 2022; 12(10):1120. https://doi.org/10.3390/catal12101120
Chicago/Turabian StyleYan, Linbo, Luchao Wang, Ziliang Wang, Cong Geng, Boshu He, and Baizeng Fang. 2022. "Research on a New Drag Force Model for Cylindrical Particles in Fixed Bed Reactors" Catalysts 12, no. 10: 1120. https://doi.org/10.3390/catal12101120
Note that from the first issue of 2016, this journal uses article numbers instead of page numbers. See further details here.