
V2O5-Activated Graphite Felt with Enhanced Activity for Vanadium Redox Flow Battery

1
Department of Chemical Engineering and Materials Science, Yuan Ze University, Yuan-Tung Road, Chung-Li, Taiwan 32003, Taiwan
2
Hierarchical Green-Energy Materials (Hi-GEM) Research Center, National Cheng Kung University, Tainan 70101, Taiwan
3
Taipower Research Institute, Taiwan Power Company, No. 84, Da-an Road, Shulin Dist, New Taipei City 238, Taiwan
*
Author to whom correspondence should be addressed.
Catalysts 2021, 11(7), 800; https://doi.org/10.3390/catal11070800
Submission received: 28 May 2021
/
Revised: 25 June 2021
/
Accepted: 29 June 2021
/
Published: 30 June 2021
(This article belongs to the Special Issue Catalysts and Electrode Functionalization for Redox Flow Battery)
Abstract
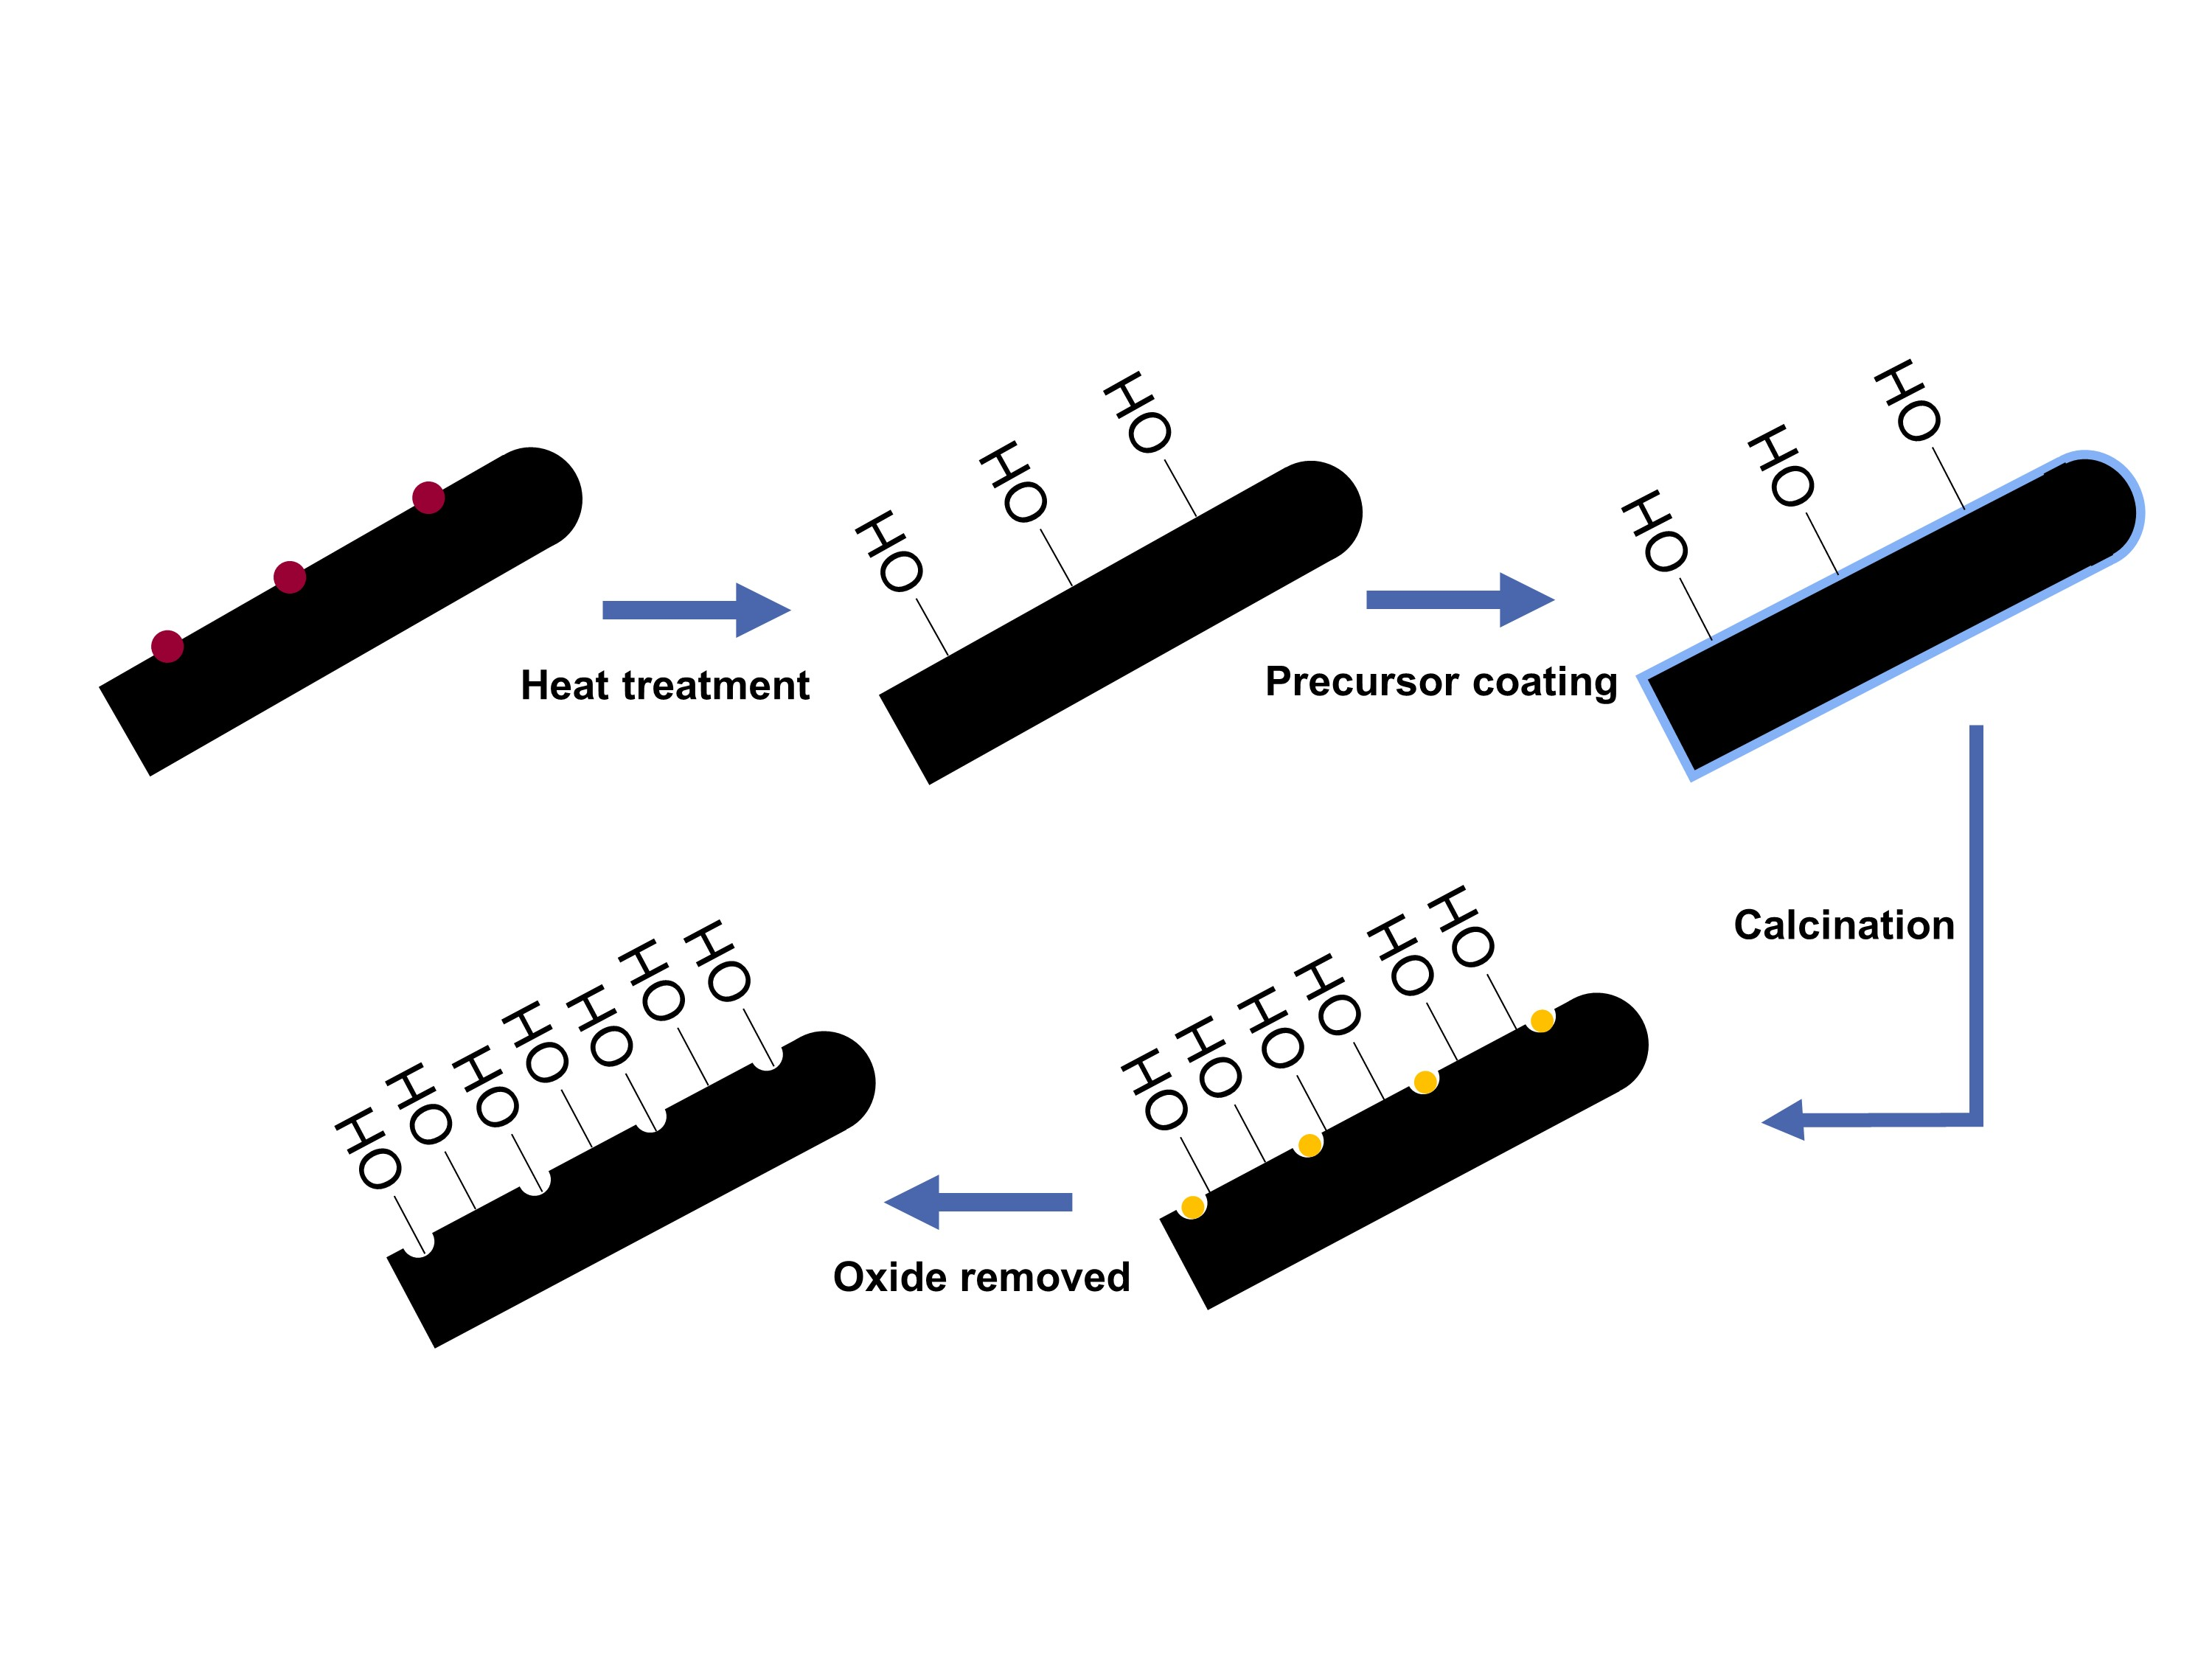
:In this study, a simple and environment-friendly method of preparing activated graphite felt (GF) for a vanadium redox flow battery (VRFB) by depositing the vanadium precursor on the GF surface and calcining vanadium oxide was explored. The intermediate material, VO2, generated carbon oxidation during the calcination. In contrast to the normal etching method, this method was simple and without a pickling process. On the surface of the activated GF, multiple pores and increased roughness were noted after the calcination temperature and surface area of the activated GF reached 350 °C to 400 °C and 17.11 m2/g, respectively. Additionally, the polarization of the activated GF decreased with resistance to the charge transfer at 0.27 Ω. After a single-cell test at current density of 150 mA/cm2 was performed, the capacity utilization and the capacity retention after 50 cycles reached 70% and 84%, respectively. These results indicated the potential use of activated GF as an VRFB electrode.

1. Introduction
The demand for electric power is growing rapidly as a result of the development of technology fueled by nonrenewable energy. Because of the pollution and global environment problems associated with nonrenewable energy sources such as coal, natural gas, and petroleum, green energy such as wind power and solar energy have attracted attention, and green energy development has increased [1,2,3,4,5]. Large-scale electrical energy storage (ESS) also has attracted attention because wind and sunlight generate energy intermittently. ESS not only balances intermittent energy but also stabilizes the electrical grid and rapidly responds to electricity demand. Redox flow batteries are suitable candidates for ESS use because of their extended life, safety, design flexibility, and rapid response [6,7].
The all-vanadium redox flow battery (VRFB), which uses vanadium ion in different oxidation states on negative (V2+/V3+) and positive (VO2+/VO2+) sides, has potential uses for ESS. The VRFB reduces cross-contamination between the two sides, thereby extending battery life and decreasing maintain costs. The redox reaction of the VO2+/VO2+ and V2+/V3+ redox couples is described as follows [8].
Catholyte: VO2+ + 2H+ + e− ↔ VO2+ + H2O E = 1.004 V
Anolyte: V2+ ↔ V3+ + e− E = 0.255 V
With the increased development of ESS, research on VRFB electrolytes, electrodes, and membranes has expanded. Providing an active site for redox reaction, electrodes are the core component of the VRFB [8]. Because the electrolyte contains sulfuric acid, the electrode has a high level of chemical resistance and excellent electrical conductivity. Consequently, carbon is the ideal material for use as a VRFB electrode. Graphite felt (GF) is the most widely used electrode material for VRFBs because of the three-dimensional network structure, large surface area, and high electrical conductivity of GF [8,9,10,11]. However, the poor electrochemical activity and hydrophobic properties of GF electrodes result in low kineticism in the redox reaction. Various GF electrode surface modification strategies, such as etching [12,13,14,15,16,17,18,19,20,21,22,23], functional group grafting [24,25,26,27,28,29,30], and depositing the electrocatalyst on the electrode surface [31,32,33,34,35,36,37,38], improve the performance of GF as an electrode.
Compared with functional group grafting and depositing the electrocatalyst on the electrode surface, etching the GF surface provide more pores and additional surface area for the active site and electrolyte flow. Y. Li et al. investigated the functions of different sizes of pores; for example, micro pores (~20 µm) stimulate electrolyte flow, mesopores (~0.5 µm) aid in the diffusion of active materials, and nanoscale pores (~20 µm) provide an active site for electrochemical reaction [21,22]. Accordingly, Y. Li et al. developed etching methods using a carbothermic reaction in various atmospheres (CO2 [15], N2 [15], and water [16]). The carbothermic reaction reduces metal oxides to metal in an inert gas atmosphere, and carbon is the sacrificial reagent (e.g., KOH etching [13], Fe2O3 [18,19], NiO [14], Co3O4 [17], and ZnO [21]). However, the pickling process occurs because the metal oxide dissolves in the electrolyte while the VRFB is active, which affects cell performance. Additionally, the pickling process produces a waste solution, such as HCl, H2SO4, and HNO3, that damages the environment and increases costs. Pickling and waste solutions are crucial problems related to the etching method.
In this study, we developed an environment-friendly and simple method of etching the GF electrode surface that uses the same element (V) as that in the VRFB electrolyte. The intermediate phase, VO2, is formed during vanadium oxide formation, which potentially facilitates carbon oxidation. X. Li et al. employed the hydrothermal method and calcination to fabricate an rGO-V2O5 composite material for lithium ion batteries [39]. J. Kim et al. produced a carbon-coated V2O5 nanoparticle by calcining carbon foam and using a precursor, (NH4)2[VO(C2O4)2)], and they controlled the particle shape through controlling the calcination temperature [40]. In this study, vanadium oxide was used for GF electrode modification. The concentration of the vanadium precursor was controlled to create pores and active sites on the GF electrode surface. The material characteristics and electrochemical performance of the surface area of etched-GFs (EGFs) were explored in detail.
2. Results and Discussion
Thermal gravimetric analysis (TGA) was conducted to determine the calcination temperature. Figure 1 reports the TGA curves of various GFs, which were analyzed in an air atmosphere from room temperature to 800 °C. The TGA profile of the GF after heat treatment (TGF) decreased abruptly at temperatures above 600 °C because of carbon oxidation. Additionally, the TGA profile of the vanadium precursor powder (VP) indicated four steps of weight, namely, water evaporation and three steps of (NH4)2[VO(C2O4)2] thermal decomposition [41]. After the proposed NH4VO3 thermal decomposition, the VP formed to V2O5 at temperatures above 350 °C [42].
2NH4VO3 → V2O5⋅1/2NH3⋅1/3H2O + 3/2NH3 + 2/3H2O
V2O5⋅1/2NH3⋅1/3H2O → V2O5⋅1/6NH3⋅1/9H2O + 1/3NH3 + 2/9H2O
V2O5⋅1/6NH3⋅1/9H2O → V2O5 + 1/6NH3 + 1/9H2O
Following the formation of VO2 in the intermediate step and transfer to V2O5, the curves of the TGA profile of the VP-loaded TGF shifted to low temperature curves. Therefore, the GF surface was oxidized during VO2 transfer to V2O5 [39]. Through the control of the precursor solution concentration, the loadings of V3-TGF and V10-TGF were 1.12 wt% and 5.93 wt%, respectively.
To investigate the surface morphology of the GFs, field-emission scanning electron microscopy (FE-SEM) was conducted. As reported in Figure 2, the TGF surface morphology was rougher than was the GF morphology because of the etching effect in heat treatment. However, the surface of the V0-EGF exhibited no observable change after calcination or pickling, suggesting that the GF electrode could not be etched without the VP.
The FE-SEM (Field-emission scanning electron microscope) micrographs of the V3-EGF and V10-EGF are reported in Figure 2e–f. Compared with the TGF, more pores were observed on the surface of the V3-EGF and V10-EGF. Moreover, the pores on the V10-EGF surface were larger and clearer than those on the surface of the V3-EGF, which indicated that the concentration of the VP was a critical factor influencing the formation and shape of pores. To observe the distribution of vanadium oxides, the GF electrodes were prepared without pickling, as reported in Figure 2c. The particles clustered in the gap on the GF surface, which caused pore formation after the vanadium oxide was removed.
The quantity of active sites strongly depends on the surface area of the electrode. The surface areas of the TGF and V0-EGF were 6.31 and 6.44 m2/g, respectively, which indicated that calcination and pickling would not damage the GF surface. The surface areas of the V3-EGF and V10-EGF after etching were 18.28 and 17.11 m2/g, respectively. These BET (Brunauerq–Emmett–Teller) data contributed to the findings represented by SEM micrographs, which revealed pores on the GF surface. These results indicated that etching was improved as the vanadium precursor concentration increased.
Because the electrode was immersed in the electrolyte, wettability was a critical GF electrode parameter related to this VRFB. A contact angle instrument was used to investigate the wettability of the GF electrodes (Supporting Information). Figure 3 reports that the GF, TGF, and V0-EGF were hydrophobic with contact angles of 141.3°, 133.2°, and 132.3°, respectively. The contact angles of the TGF and V0-EGF were lower than that of the GF because the oxygen concentration increased after heat treatment. The water was rapidly absorbed by the V3-EGF and V10-EGF because hydroxyl groups formed on the GF surface in the process of becoming hydrophilic. To investigate the electrolyte accessibility of the GF electrode, the GF samples were placed inside a bottle of vanadium electrolyte (0.1 M VOSO4 + 20 wt% H2SO4). Figure 3f reports that the GF, TGF, and V0-EGF floated in the electrolyte because the hydrophobic properties of the conductive electrolyte could not be readily absorbed. Conversely, the V3-EGF, V10-EGF, and V30-EGF were saturated in the electrolyte, which indicated that they had higher electrolyte accessibility than the TGF and V0-EGF.
X-ray photoelectron spectroscopy (XPS) was conducted to investigate the chemical composition and functional group concentrations on the GF electrode surface. The XPS spectra of each GF sample are reported in Figure 4a. Two peaks represented the C1s (280–295 eV) and O1s (525–545 eV) orbitals without other signals detected. The oxygen concentrations of the GF, TGF, V0-EGF, V3-EGF, and V10-EGF were 7.34%, 12.34%, 11.36%, 16.94%, and 19.64%, respectively. The oxygen/carbon (O/C) ratio can be used as an indicator of the oxygen concentration on the electrode surface (Table 1). The oxygen concentration of the TGF was higher than that of the GF because the GF reacted with oxygen during heat treatment. However, the O/C ratios of the TGF and V0-EGF were similar, which indicated that the GF electrode was stable during calcination without the VP. Conversely, the O/C ratios of the V3-EGF and V10-EGF were 1.43 and 1.71 times higher, respectively, than that of the TGF, which indicated that the carbon oxidation reaction occurred during calcination because the intermediate phase of VO2 was formed. Figure 4b–f indicates that the core-level spectra of each electrode de-convoluted at approximately 531.5, 532.5, 533.8, and 534.6 eV for the C=O, C–OH, COOH, and H–OH bonds, respectively. The chemical bond concentrations are reported in Table 1. Although the hydroxyl bond concentration of the GF electrode was higher than that of other samples, the GF electrode exhibited a lower oxygen concentration than that of the other electrodes, indicating the presence of fewer active sites on the GF than the other electrodes. The total concentration of the V10-EGF hydroxyl and carboxyl groups (52.99%) was higher than that of the TGF (41.25%), indicating the presence of numerous active sites on the V10-EGF electrode surface. These results indicated good agreement with wettability because the oxygen-containing bond concentration on the electrode surface increased, which provided active sites for the VO2+/VO2+ redox reaction [8,12,13,14,15,16,17,18,19,20,21,22,23].
Because of the electrochemical properties of the GF, TGF, and EGFs, cyclic voltammetry was conducted. Figure 5 presents the cyclic voltammetry (CV) curves of the various GF electrode samples as the lead electrode of 0.1 M VOSO4 in 20 wt% H2SO4 solution for positive reaction at a scan rate of 30 mVs−1. The peak potential separation (ΔE), current density, and redox onset potential values were critical evaluation criteria for the electrode’s electrochemical activity [12] (Table 2). The GF exhibited a higher peak potential separation (1.12 V) for the VO2+/VO2+ redox reaction than did the TGF and EGFs, and the anodic peak current (VO2+ to VO2+) appeared after 1.35 V because of hydrophobic properties and high electrochemical polarization. Moreover, the anodic and cathodic peak current density (Ipa/−Ipc) ratio for the VO2+/VO2+ redox reaction of the GF was higher than that of the TGF and EGFs, which indicated poor GF electrode reversibility. Compared with the other GFs, the V10-EGF exhibited lower peak separation (0.63 V) and excellent reversibility (1.001). Additionally, the V10-EGF exhibited high anodic (294.23 mA cm−2) and cathodic (293.98 mA cm−2) currents, indicating the more active sites on the V10-EGF surface and an improved VO2+/VO2+ redox reaction.
The GF electrode CV curves for the VO2+/VO2+ redox reaction under various scan rates are provided in Figure 6a–e. As Figure 6f indicates, the peak current exhibited a linear relationship with the square root of the scan rate, and the slope of the V10-EGF was larger than those of the other GFs, which indicated that the mass transport of vanadium ions was superior for V10-EGF. Additionally, the slope was used in the Randle–Sevick equation to estimate the electrodes’ electrochemical active surface area (ESCA). The Randle–Sevick equation assumes that the mass transport occurs only through the diffusion process and relates the peak current to the square root of the scan rate at room temperature [17].
Ip = 2.99 × 10⁵ A × D 1/2 n 3/2 υ 1/2 Co
The equation involves calculations related to the anodic peak current (Ip, A) of the VO2+ oxidation peaks, the ESCA (A, cm2), the diffusion coefficient (D, cm2 s−1), the number of electron transferred in the electrochemical reaction, the initial concentration of the electroactive species (Co, mol cm−3), and the scan rate (υ, V s−1). The values of n and D were 1 and 10−6, respectively. The Randle–Sevick equation estimated that the ESCAs of the GF, TGF V0-EGF, V3-EGF, and V10-EGF were 95.1, 105.6, 95.0, 108.9, and 116.7 cm2 g−1, respectively. Compared with the GF, the active sites of the electroactive species on the V10-EGF surface increased by approximately 22.7%.
To further evaluate the electrode electrochemical properties, the electrochemical impedance spectra results are reported in Figure 7. The equivalent circuit involved the ohmic resistance (Rs), charge transfer resistance (Rct), constant phase element (CPE), and infinite Warburg impedance (W) [15]. The semicircle in a range of high to medium frequencies represented the charge transfer resistance. The CPE represented the double-layer capacitance of the electrode–electrolyte interface, with α being the CPE exponent [15]. Compared with the Rct of the GF electrodes, the Rs was negligible; it was reduced to zero in this study. The Rct of the TGF and V0-EGF was 0.74 Ω and 0.98 Ω, respectively, and these values are lower than for the GF electrode (8.02 Ω). Compared with the other GFs, the V3-EGF and V10-EGF exhibited substantially lower Rct values of 0.27 Ω and 0.18 Ω, respectively, because of the numerous active sites on the electrode surface. Consequently, the CPE of the V3-EGF and V10-EGF was higher than those of the other GF electrodes.
The performance of the GF electrode for a VRFB was evaluated in a single cell assembled with the GF, TGF, and EGFs as both-side electrodes at current densities between 1.7 and 0.8 V. Figure 8 reports the results of the cell test at a high current density (150 mA cm−2). The GF electrode exhibited high charge and low discharge potential, which indicated high overpotential and inner resistance. As a result, the GF electrode discharge capacity was 199.59 mAh, which was approximately 20% of theoretical capacities (1072 mAh). Compared with the TGF (590.59 mAh), the V3-EGF and V10-EGF exhibited higher discharge capacities of 689.13 mAh and 678.35 mAh, respectively, and the electrolyte utilization of theoretical capacities reached 70%. These results indicated that GF electrode surface modification enhanced cell performance owing to high surface areas and numerous functional groups.
Voltage (VE), columbic (CE), and energy (EE) efficiencies were calculated using charge–discharge curves at 150 mA cm−2, and the result are reported in Table 3 and Figure 9. The CE values for various GFs ranged from 95.74% to 96.72% because the CE depended primarily on the cell membrane. The VE values of the GF, TGF, V3-EGF, and V10-EGF were 57.57%, 64.51%, 66.96%, and 65.94%, respectively. The VE of the GF was lower than that of the other GF samples, which indicated poor electrochemical properties in the GF. The VE and EE of the TGF and EGFs were similar to those of the GF electrode and increased by approximately 8%, which indicated that these treatments substantially enhanced the active site on the GF electrode surface. Figure 9 presents the EE values of various GF electrodes at different current densities. Various GFs performed similarly at a low current density of 30 mA cm−2, but the EE value decreased as the current densities increased to 150 mA cm−2 because of increased polarization at high current densities. After various current densities were tested, the GF electrode EE value returned to 30 mA cm−2, which indicated that the electrode was not damaged by the the high current density cell test. The capacity retention of the TGF, V3-EGF, and V10-EGF at 150 mA cm−2 for 50 cycles is shown in Figure 10. The capacity retention of the V10-EGF was 89.12%, which is much higher than that of V3-EGF (84.44%) and the TGF (77.35%). The capacity retention of the TGF with the electrolyte was unstable because of hydrophobic properties. Compared with the V3-EGF, the capacity retention of the V10-EGF was better because of the rich functional groups on the V10-EGF electrode surface. The V10-EGF has high potential as a VRFB electrode due to its high electrolyte accessibility, numerous active sites, and excellent stability.
3. Materials and Methods
3.1. Material
Ryan-based GFs (GFA6) were purchased from SGL Carbon. Oxalic acid (H2C2O4, 98 %), ammonium metavanadate (NH4VO3, 99.0%), and vanadium(IV) sulfate oxide (VOSO4·xH2O, 99%) were purchased from Alfa Aesar (Heysham, UK). Sulfuric acid (H2SO4, 95–97%) was purchased from Fluka (Charlotte, NC, USA). The DuPont (Wilmington, NC, USA) Nafion-115 membrane was used.
3.2. Preparation of Vanadium Precursor (VP) Solution
The oxalic acid powder was dissolved in 40 mL of deionized (DI) water under stirring. Subsequently, the NH4VO3 powder was added to the solution and, after being dissolved, heated to 80 °C. The oxalic acid to NH4VO3 molar ratio was 2:1, and the NH4VO3 concentration was 0, 3, and 10 mM. Heating was terminated when the solution changed from orange to dark blue. After being cooled, the solution was diluted to 100 mL with DI water.
3.3. Preparation of GF Electrodes
The GFs were cut into square pieces (6 cm × 6 cm), washed using 70% ethanol solution, and dried at 80 °C overnight. The GFs were heated at 500 °C for 3 h in an air atmosphere. The TGF was submerged in precursor solution (0, 3, and 10 mM), ultrasonified for 30 min, and dried in a vacuum oven at 80 °C overnight. The VP-coated TGF was calcined in air at 350 °C for 1 h to form the vanadium oxide on the GF electrode surface (V0, V3, and V10-TGF). The vanadium oxide was removed using 0.1 M H2SO4 solution and the corresponding electrodes were designated the V0-EGF, V3-EGF, and V10-EGF.
3.4. Material Characterization
TGA (Q50, TA, New Castle, DE, USA) was conducted to measure the decomposition temperature and vanadium oxide concentration. FE-SEM (JSM-6701F, JEOL, Tokyo, Japan) was used to observe the GF morphology. Contact angle measurement of the GFs was performed (Model 100SB, Sindatek, New Taipei City, Taiwan). The Brunauerq–Emmett–Teller (BET, ASAP2020, Micromeritics, Norcross, GA, USA) method was employed to measure the surface area. The surface chemistry of the GFs was analyzed using XPS (K-Alpha, Thermo Fisher Scientific Inc., East Grinstead, UK).
3.5. Electrochemical Measurement
CV and electrochemical impendence spectroscopy (EIS, VSP-300, BioLogic, Claix, France) were performed in a typical three-electrode cell at room temperature. The GF, Ag/AgCl, and a platinum plate were the working electrode, reference electrode, and counter electrode, respectively. The CV test was conducted using an electrochemical workstation (ECW-5000, Jiehan, Taichung, Taiwan) with a scan range of 0.25 to 1.35 V at various scan rates (1 to 30 mVs−1). EIS was conducted in a frequency range from 106 to 10−1 Hz by applying a 10 mV AC amplitude at 0.85V to generate a positive reaction. The electrolyte solution was a 0.1 M VOSO4 + 20 wt% H2SO4 solution.
3.6. Single Cell Performance
A single VRFB cell was assembled by sandwiching the Nafion 115 membrane between two pieces of GF with dimensions of 5 × 5 × 0.6 cm3, which served as the electrodes. The initial electrolyte solution was 50 mL of 1.6 M V3.5+/4 M H2SO4 (Sumitomo Electric, Osaka, Japan) for both sides. The charge–discharge cycle of the single cell was executed using an electrochemical workstation (BTS-5V6A, Neware, Shenzhen, China) with various constant current densities from 30 to 150 mA cm−2 in the potential range of 0.80 to 1.70 V. The single cell and electrolyte were purged by N2 gas for 30 min before the cell test. Finally, the cell was connected to the peristaltic pump (JT400-CT1, Ritai, Taipei, Taiwan), which controlled the electrolyte flow rate at 60 mL min−1.
4. Conclusions
In this study, the activated GF was prepared using a simple and environment-friendly method. The concentration of the vanadium precursor solution was optimized to 10 mM, and the calcination temperature was approximately 350 °C. The V10-EGF exhibited a high surface area (17.11 m2/g), favorable electrolyte accessibility, and numerous oxygen functional groups on its surface. Therefore, the polarization and charge transfer resistance for the VO2+/VO2+ redox reaction of the V10-EGF were reduced due to rich surface ESCAs. In the cell test, the V10-EGF had the highest capacity at 678.35 mAh with a capacity retention of 89.12% at a current density of 150 mA cm−2 after 50 cycles. These results indicated that the vanadium oxide assisted in the oxidation of carbon at low temperatures and increased the GF electrode surface area. For these reasons, activated GF electrodes have promising potential for use in VRFBs.
Supplementary Materials
The following are available online at https://www.mdpi.com/article/10.3390/catal11070800/s1, Video S1: UGF; Video S2: TGF; Video S3: V0-EGF; Video S4: V3-EGF; Video S5: V10-EGF.
Author Contributions
Conceptualization: I.-M.H. and Y.-H.W.; Methodology: Y.-H.W.; Validation: Y.-H.W., I.-M.H. and C.-Y.W.; Formal analysis: Y.-H.W.; Investigation, Y.-H.W.; Resources: I.-M.H. and C.-Y.W.; Data curation: Y.-H.W.; Writing—original draft preparation, Y.-H.W.; Writing—review and editing, I.-M.H.; Supervision, I.-M.H.; Project administration: I.-M.H.; Funding acquisition: I.-M.H. All authors have read and agreed to the published version of the manuscript.
Funding
Financial support for this work was provided by the Ministry of Science and Technology of Taiwan under contract MOST 107-2221-E-155-018-MY2.
Conflicts of Interest
The authors declare no conflict of interest.
References
- Yang, Z.; Zhang, J.; Kintner-Meyer, M.C.W.; Lu, X.; Choi, D.; Lemmon, J.P.; Liu, J. Electrochemical Energy Storage for Green Grid. Chem. Rev. 2011, 111, 3577–3613. [Google Scholar] [CrossRef] [PubMed]
- Dunn, B.; Kamath, H.; Tarascon, J.-M. Electrical Energy Storage for the Grid: A Battery of Choices. Science 2011, 334, 928–935. [Google Scholar] [CrossRef] [Green Version]
- Han, X.; Zhao, G.; Xu, C.; Ju, X.; Du, X.; Yang, Y. Parametric analysis of a hybrid solar concentrating photovoltaic/concentrating solar power (CPV/CSP) system. Appl. Energy 2017, 189, 520–533. [Google Scholar] [CrossRef]
- Ager, J.W.; Lapkin, A.A. Chemical storage of renewable energy. Science 2018, 360, 707–708. [Google Scholar] [CrossRef] [Green Version]
- Sun, X.; Li, Y. Understanding mass and charge transports to create anion-ionomer-free high-performance alkaline direct formate fuel cells. Int. J. Hydrogen Energy 2019, 44, 7538–7543. [Google Scholar] [CrossRef]
- Noack, J.; Roznyatovskaya, N.; Herr, T.; Fischer, P. The Chemistry of Redox-Flow Batteries. Angew. Chem. Int. Ed. 2015, 54, 9776–9809. [Google Scholar] [CrossRef]
- Skyllas-Kazacos, M.; Chakrabarti, M.H.; Hajimolana, S.A.; Mjalli, F.S.; Saleemd, M. Progress in flow battery research and de-velopment. J. Electrochem. Soc. 2011, 158, 55–79. [Google Scholar] [CrossRef]
- Kim, K.J.; Park, M.-S.; Kim, Y.-J.; Kim, J.H.; Dou, S.X.; Skyllas-Kazacos, M. A technology review of electrodes and reaction mechanisms in vanadium redox flow batteries. J. Mater. Chem. A 2015, 3, 16913–16933. [Google Scholar] [CrossRef]
- Zhang, W.; Xi, J.; Li, Z.; Zhou, H.; Liu, L.; Wu, Z.; Qiu, X. Electrochemical activation of graphite felt electrode for VO2+/VO2+ redox couple application. Electrochim. Acta 2013, 89, 429–435. [Google Scholar] [CrossRef]
- Davies, T.J.; Tummino, J.J. High-Performance Vanadium Redox Flow Batteries with Graphite Felt Electrodes. C J. Carbon Res. 2018, 4, 8. [Google Scholar] [CrossRef] [Green Version]
- Hsieh, C.-L.; Tsai, P.-H.; Hsu, N.-Y.; Chen, Y.-S. Effect of Compression Ratio of Graphite Felts on the Performance of an All-Vanadium Redox Flow Battery. Energies 2019, 12, 313. [Google Scholar] [CrossRef] [Green Version]
- Sun, B.; Skyllas-Kazacos, M. Modification of graphite electrode materials for vanadium redox flow battery application-I. Thermal treatment. Electrochim. Acta 1992, 37, 1253–1260. [Google Scholar] [CrossRef]
- Zhang, Z.; Xi, J.; Zhou, H.; Qiu, X. KOH etched graphite felt with improved wettability and activity for vanadium flow bat-teries. Electrochim. Acta 2016, 218, 15–23. [Google Scholar] [CrossRef]
- Park, J.J.; Park, J.H.; Park, O.O.; Yang, J.H. Highly porous graphenated graphite felt electrodes with catalytic defects for high-performance vanadium redox flow batteries produced via NiO/Ni redox reactions. Carbon 2016, 110, 17–26. [Google Scholar] [CrossRef]
- Chang, Y.-C.; Chen, J.-Y.; Kabtamu, D.M.; Lin, G.-Y.; Hsu, N.-Y.; Chou, Y.-S.; Wei, H.-J.; Wang, C.-H. High efficiency of CO2-activated graphite felt as electrode for vanadium redox flow battery application. J. Power Sources 2017, 364, 1–8. [Google Scholar] [CrossRef]
- Kabtamu, D.M.; Chen, J.Y.; Chang, Y.C.; Wang, C.H. Water-activated graphite felt as a high-performance electrode for vana-dium redox flow batteries. J. Power Sources 2017, 341, 270–279. [Google Scholar] [CrossRef]
- Abbas, S.; Lee, H.; Hwang, J.; Mehmood, A.; Shin, H.-J.; Mehboob, S.; Lee, J.-Y.; Ha, H.Y. A novel approach for forming carbon nanorods on the surface of carbon felt electrode by catalytic etching for high-performance vanadium redox flow battery. Carbon 2018, 128, 31–37. [Google Scholar] [CrossRef]
- Liu, Y.; Shen, Y.; Yu, L.; Liu, L.; Liang, F.; Qiu, X.; Xi, J. Holey-engineered electrodes for advanced vanadium flow batteries. Nano Energy 2018, 43, 55–62. [Google Scholar] [CrossRef]
- Jiang, H.; Shyy, W.; Wu, M.; Zhang, R.; Zhao, T. A bi-porous graphite felt electrode with enhanced surface area and catalytic activity for vanadium redox flow batteries. Appl. Energy 2019, 233–234, 105–113. [Google Scholar] [CrossRef]
- Zhou, X.; Zhang, X.; Lv, Y.; Lin, L.; Wu, Q. Nano-catalytic layer engraved carbon felt via copper oxide etching for vanadium redox flow batteries. Carbon 2019, 153, 674–681. [Google Scholar] [CrossRef]
- Wu, Q.; Zhang, X.; Lv, Y.; Lin, L.; Liu, Y.; Zhou, X. Bio-inspired multiscale-pore-network structured carbon felt with enhanced mass transfer and activity for vanadium redox flow batteries. J. Mater. Chem. A 2018, 6, 20347–20355. [Google Scholar] [CrossRef]
- Wang, R.; Li, Y.; He, Y.-L. Achieving gradient-pore-oriented graphite felt for vanadium redox flow batteries: Meeting improved electrochemical activity and enhanced mass transport from nano- to micro-scale. J. Mater. Chem. A 2019, 7, 10962–10970. [Google Scholar] [CrossRef]
- Zhang, L.; Yue, J.; Deng, Q.; Ling, W.; Zhou, C.-J.; Zeng, X.-X.; Zhou, C.; Wu, X.-W.; Wu, Y. Preparation of a porous graphite felt electrode for advance vanadium redox flow batteries. RSC Adv. 2020, 10, 13374–13378. [Google Scholar] [CrossRef]
- Gao, C.; Wang, N.F.; Peng, S.; Lei, Y.; Liang, X.X.; Zeng, S.S.; Zi, H.F. Influence of Fenton’s reagent treatment on electrochem-ical properties of graphite felt for all vanadium redox flow battery. Electrochim. Acta 2013, 88, 193–202. [Google Scholar] [CrossRef]
- Wu, X.; Xu, H.; Shen, Y.; Xu, P.; Lu, L.; Fu, J.; Zhao, H. Treatment of graphite felt by modified Hummers method for the posi-tive electrode of vanadium redox flow battery. Electrochim. Acta 2014, 138, 264–269. [Google Scholar] [CrossRef]
- Kim, J.; Lim, H.; Jyoung, J.-Y.; Lee, E.-S.; Yi, J.S.; Lee, D. High electrocatalytic performance of N and O atomic co-functionalized carbon electrodes for vanadium redox flow battery. Carbon 2017, 111, 592–601. [Google Scholar] [CrossRef]
- Chen, J.-Z.; Liao, W.-Y.; Hsieh, W.-Y.; Hsu, J.C.-C.; Chen, Y.-S. All-vanadium redox flow batteries with graphite felt electrodes treated by atmospheric pressure plasma jets. J. Power Sources 2015, 274, 894–898. [Google Scholar] [CrossRef]
- Shah, A.B.; Wu, Y.; Joo, Y.L. Direct addition of sulfur and nitrogen functional groups to graphite felt electrodes for improving all-vanadium redox flow battery performance. Electrochim. Acta 2019, 297, 905–915. [Google Scholar] [CrossRef]
- Chung, Y.; Noh, C.; Kwon, Y. Role of borate functionalized carbon nanotube catalyst for the performance improvement of vanadium redox flow battery. J. Power Sources 2019, 438, 227063. [Google Scholar] [CrossRef]
- Lin, C.-H.; Zhuang, Y.-D.; Tsai, D.-G.; Wei, H.-J.; Liu, T.-Y. Performance Enhancement of Vanadium Redox Flow Battery by Treated Carbon Felt Electrodes of Polyacrylonitrile using Atmospheric Pressure Plasma. Polymers 2020, 12, 1372. [Google Scholar] [CrossRef]
- Shen, Y.; Xu, H.; Xu, P.; Wu, X.; Dong, Y.; Lu, L. Electrochemical catalytic activity of tungsten trioxide- modified graphite felt toward VO2+/VO2+ redox reaction. Electrochim. Acta 2014, 132, 37–41. [Google Scholar] [CrossRef]
- Kabtamu, D.M.; Chang, Y.-C.; Lin, G.-Y.; Bayeh, A.W.; Chen, J.-Y.; Wondimu, T.H.; Wang, C.-H. Three-dimensional annealed WO3 nanowire/graphene foam as an electrocatalytic material for all vanadium redox flow batteries. Sustain. Energy Fuels 2017, 1, 2091–2100. [Google Scholar] [CrossRef]
- Bayeh, A.W.; Kabtamu, D.M.; Chang, Y.C.; Chen, G.C.; Chen, H.Y.; Liu, T.R.; Wondimu, T.H.; Wang, K.C.; Wang, C.H. Hy-drogen-Treated Defect-Rich W18O49 Nanowire-Modified Graphite Felt as High-Performance Electrode for Vanadium Redox Flow Battery. ACS Appl. Energy Mater. 2019, 2, 2541–2551. [Google Scholar]
- Raghu, S.C.; Ulaganathan, M.; Lim, T.M.; Skyllas-Kazacos, M. Electrochemical behaviour of titanium/iridium(IV) oxide: Tan-talum pentoxide and graphite for application in vanadium redox flow battery. J. Power Sources 2013, 238, 103–108. [Google Scholar] [CrossRef]
- Liu, T.; Li, X.; Nie, H.; Xu, C.; Zhang, H. Investigation on the effect of catalyst on the electrochemical performance of carbon felt and graphite felt for vanadium flow batteries. J. Power Sources 2015, 286, 73–81. [Google Scholar] [CrossRef]
- He, Z.; Li, M.; Li, Y.; Li, C.; Yi, Z.; Zhu, J.; Dai, L.; Meng, W.; Zhou, H.; Wang, L. ZrO2 nanoparticle embedded carbon nano-fibers by electrospinning technique as advanced negative electrode materials for vanadium redox flow battery. Electrochim. Acta 2019, 309, 166–176. [Google Scholar] [CrossRef]
- Mousavihashemi, S.; Murcia-López, S.; Hosseini, M.G.; Morante, J.R.; Flox, C. Towards Production of a Highly Catalytic and Stable Graphene-Wrapped Graphite Felt Electrode for Vanadium Redox Flow Batteries. Batteries 2018, 4, 63. [Google Scholar] [CrossRef] [Green Version]
- Schneider, J.; Bulczak, E.; El-Nagar, G.A.; Gebhard, M.; Kubella, P.; Schnucklake, M.; Fetyan, A.; Derr, I.; Roth, C. Degradation Phenomena of Bismuth-Modified Felt Electrodes in VRFB Studied by Electrochemical Impedance Spectroscopy. Batteries 2019, 5, 16. [Google Scholar] [CrossRef] [Green Version]
- Yan, B.; Li, X.; Bai, Z.; Zhao, Y.; Dong, L.; Song, X.; Li, D.; Langford, C.; Sun, X. Crumpled reduced graphene oxide conformally encapsulated hollow V2O5 nano/microsphere achieving brilliant lithium storage performance. Nano Energy 2016, 24, 32–44. [Google Scholar] [CrossRef]
- Shin, J.; Jung, H.; Kim, Y.; Kim, J. Carbon-coated V2O5 nanoparticles with enhanced electrochemical performance as a cathode material for lithium ion batteries. J. Alloys Compd. 2014, 589, 322–329. [Google Scholar] [CrossRef]
- Liu, B.-G.; Peng, J.-H.; Wan, R.-D.; Zhang, L.-B.; Guo, S.-H.; Zhang, S.-M. Optimization of preparing V2O5 by calcination from ammonium metavanadate using response surface methodology. Trans. Nonferrous Met. Soc. China 2011, 21, 673–678. [Google Scholar] [CrossRef]
- Pan, A.; Zhang, J.G.; Nie, Z.; Cao, G.Z.; Arey, B.W.; Li, G.S.; Liang, S.Q.; Liu, J. Facile synthesized nanorod structured vana-dium pentoxide for high-rate lithium batteries. J. Mater. Chem. C 2010, 20, 9193–9199. [Google Scholar] [CrossRef]
Figure 1.
TGA profile of VP and graphite felt electrodes.

Figure 2.
The SEM micrographs of the graphite felt: (a) GF, (b) TGF, (c) V10-TGF, (d) V0-EGF, (e) V3-EGF, and (f) V10-EGF.
Figure 2.
The SEM micrographs of the graphite felt: (a) GF, (b) TGF, (c) V10-TGF, (d) V0-EGF, (e) V3-EGF, and (f) V10-EGF.

Figure 3.
The contact angle of the graphite felt: (a) GF, (b) TGF, (c) V0-EGF, (d) V3-EGF, (e) V10-EGF, and (f) digital photos of electrolyte accessibility test of GFs.
Figure 3.
The contact angle of the graphite felt: (a) GF, (b) TGF, (c) V0-EGF, (d) V3-EGF, (e) V10-EGF, and (f) digital photos of electrolyte accessibility test of GFs.

Figure 4.
(a) XPS survey spectra, and O1s core-level spectra of (b) GF, (c) TGF, (d) V0-EGF, (e) V3-EGF, and (f) V10-EGF.
Figure 4.
(a) XPS survey spectra, and O1s core-level spectra of (b) GF, (c) TGF, (d) V0-EGF, (e) V3-EGF, and (f) V10-EGF.

Figure 5.
The CV curves of the graphite felt recorded at 30 mVs−1 scan rates in 0.1 M VOSO4 + 20 wt% H2SO4 solution.
Figure 5.
The CV curves of the graphite felt recorded at 30 mVs−1 scan rates in 0.1 M VOSO4 + 20 wt% H2SO4 solution.

Figure 6.
(a–e) GF, TGF, V0-EGF, V3-EGF, and V10-EGF at various scan rates in positive electrolyte. (f) plots of the redox peak current density versus the square root of GFs.
Figure 6.
(a–e) GF, TGF, V0-EGF, V3-EGF, and V10-EGF at various scan rates in positive electrolyte. (f) plots of the redox peak current density versus the square root of GFs.

Figure 7.
Nyquist plot of GFs at the polarization potential of 0.85 V.

Figure 8.
Charge–discharge curves at 150 mA cm−2 (3rd cycle) of (a) GF, (b) TGF, (c) V3-EGF, and (d) V10-EGF.
Figure 8.
Charge–discharge curves at 150 mA cm−2 (3rd cycle) of (a) GF, (b) TGF, (c) V3-EGF, and (d) V10-EGF.

Figure 9.
Energy efficiency of VRFBs with GF electrodes at various current densities.

Figure 10.
Capacity retention of VRFB with different GF electrodes at 150 mA cm−2 during 50 cycles.


Table 1.
XPS O1s spectra fitting results from Figure 4.
Table 1.
XPS O1s spectra fitting results from Figure 4.
| Sample | C 1s (%) | O 1s (%) | O/C Ratio | C=O (%) (531.5 eV) | C–OH (%) (532.5 eV) | COOH (%) (533.8 eV) | H–O–H (%) (534.6 eV) |
|---|---|---|---|---|---|---|---|
| GF | 92.66 | 7.34 | 0.08 | 40.10 | 46.37 | 11.28 | 2.26 |
| TGF | 87.66 | 12.34 | 0.14 | 58.75 | 25.25 | 16.00 | 0.00 |
| V0-EGF | 88.64 | 11.36 | 0.13 | 54.57 | 35.34 | 10.09 | 0.00 |
| V3-EGF | 83.06 | 16.94 | 0.20 | 43.14 | 41.99 | 14.87 | 0.00 |
| V10-EGF | 92.66 | 7.34 | 0.24 | 46.94 | 39.36 | 13.63 | 0.07 |
Table 2.
Summary of CV result when scan rates 30 mVs−1 were used.
| Sample | Ipa (mA/cm2) | Ipc (mA/cm2) | Epa(V) | Epc(V) | Ipa/−Ipc | ΔE(V) |
|---|---|---|---|---|---|---|
| GF | 269.88 | −179.95 | 1.42 | 0.30 | 1.500 | 1.12 |
| TGF | 271.09 | −265.61 | 1.26 | 0.51 | 1.021 | 0.75 |
| V0-EGF | 256.49 | −247.95 | 1.26 | 0.54 | 1.034 | 0.72 |
| V3-EGF | 272.90 | −261.11 | 1.26 | 0.57 | 1.045 | 0.69 |
| V10-EGF | 294.23 | −293.98 | 1.20 | 0.57 | 1.001 | 0.63 |
Table 3.
Capacity and efficiency values of GF electrode at current density of 150 mA cm−2.
| Sample | Charge Capacity (mAh) | Discharge Capacity (mAh) | EE (%) | CE (%) | VE (%) |
|---|---|---|---|---|---|
| GF | 201.42 | 199.59 | 55.57 | 96.53 | 57.57 |
| TGF | 610.60 | 590.59 | 62.39 | 96.72 | 64.51 |
| V3-EGF | 716.92 | 689.18 | 64.37 | 96.13 | 66.96 |
| V10-EGF | 708.50 | 678.35 | 63.13 | 95.74 | 65.94 |
Publisher’s Note: MDPI stays neutral with regard to jurisdictional claims in published maps and institutional affiliations. |
© 2021 by the authors. Licensee MDPI, Basel, Switzerland. This article is an open access article distributed under the terms and conditions of the Creative Commons Attribution (CC BY) license (https://creativecommons.org/licenses/by/4.0/).
Share and Cite
MDPI and ACS Style
Wang, Y.-H.; Hung, I.-M.; Wu, C.-Y. V2O5-Activated Graphite Felt with Enhanced Activity for Vanadium Redox Flow Battery. Catalysts 2021, 11, 800. https://doi.org/10.3390/catal11070800
AMA Style
Wang Y-H, Hung I-M, Wu C-Y. V2O5-Activated Graphite Felt with Enhanced Activity for Vanadium Redox Flow Battery. Catalysts. 2021; 11(7):800. https://doi.org/10.3390/catal11070800
Chicago/Turabian StyleWang, Yi-Hung, I-Ming Hung, and Cheng-Yeou Wu. 2021. "V2O5-Activated Graphite Felt with Enhanced Activity for Vanadium Redox Flow Battery" Catalysts 11, no. 7: 800. https://doi.org/10.3390/catal11070800
Note that from the first issue of 2016, this journal uses article numbers instead of page numbers. See further details here.