
Kinetics of n-Hexane Cracking over Mesoporous HY Zeolites Based on Catalyst Descriptors


IRCELYON, Univ Lyon, Université Claude Bernard Lyon 1, CNRS, 2 Avenue Albert Einstein, 69626 Villeurbanne, France
*
Author to whom correspondence should be addressed.
Catalysts 2021, 11(6), 652; https://doi.org/10.3390/catal11060652
Submission received: 6 May 2021
/
Revised: 18 May 2021
/
Accepted: 19 May 2021
/
Published: 21 May 2021
(This article belongs to the Special Issue Catalysis on Zeolites and Zeolite-Like Materials)
Abstract
:A simple kinetic model based on the zeolite acid strength, the number of Brønsted acid sites, and the catalyst efficiency was developed for the cracking of n-hexane. A series of HY zeolites with a mesopore volume from 0.04 to 0.32 cm3/g was synthesized and characterized by various physical-chemical methods and tested for n-hexane cracking. The generation of mesoporosity influenced several other important parameters, such as acidity and extra-framework aluminum. Zero-length column diffusion measurements for mesitylene showed a large decrease in the characteristic diffusion time upon the introduction of mesoporosity, which changed only slightly with a further increase in mesoporosity. Similar n-hexane physisorption enthalpies were measured for all samples. The highest initial activity for n-hexane cracking per catalyst volume was observed for the sample with an intermediate mesopore volume of 0.15 cm3/g. The three mesoporous H-USY zeolites showed the same value of the intrinsic rate constant and the same activation energy. The difference in initial activity of the mesoporous zeolites was caused by the difference in the number of Brønsted acid sites. The increase in initial activity for the mesoporous zeolites compared to a microporous zeolite was caused by an increase in the acid strength.
1. Introduction
Zeolites are widely used in catalytic and separation processes due to their unique properties. They are used for their solid acid properties but also for their highly ordered micropore structures that enable shape and size selectivity [1,2]. Zeolites are made of three-dimensional crystalline networks containing channels and cages with sizes on the order of nanometers. Whereas these nanosized confinements provide the zeolite its unique properties, for certain applications, the transport of reactants and products through these channels can be the rate-limiting step. In order to improve access to the active sites, research on improving the zeolite pore network has been conducted during the last decades, an area referred to as hierarchical zeolites [3,4]. It generally consists of reducing the size of the microporous domains to shorten the mean diffusion path length. Many different approaches have been proposed to achieve this goal [5,6,7,8], but other important zeolite properties, such as the surface area, Brønsted acidity, Lewis acidity, and site density, are changed as well. It is therefore not always clear if the improved performance is specifically due to improved site accessibility, and this remains a challenging task [9].
Therefore, the use of a well-defined model reaction that is impacted by the porosity and acid strength of the zeolite might aid in the rational development of mesoporous zeolites. Different model reactions have been used to characterize the acidity and/or porosity of zeolites [9,10]. Weisz et al. [11,12,13] suggested the cracking of n-hexane at certain conditions (temperature, contact time) to assess the acidity and rank solid acid catalysts according to their relative activity. This α-test can measure the rate constant for n-hexane cracking over four orders of magnitude. However, it does not differentiate between the number of acid sites and the acid strength, nor does the test provide information on possible pore diffusion limitations.
Several studies report the use of n-hexane cracking to characterize the performance of mesoporous HZSM-5 catalysts, analyzing the data in terms of turnover frequency, coke formation rate and/or diffusion limitations [14,15,16,17]. Only a few studies for zeolite catalyzed reactions use models that are quantitatively based on zeolite properties such as acid strength and porosity [18,19,20,21,22,23,24,25]. Yaluris et al. developed a detailed microkinetic model for the cracking of 2-methyl-hexane over 6 USY FCC catalysts with increasing steaming severity. The activity and selectivity could be correctly described over the six catalysts with the acid strength as a key parameter [18]. Thybaut et al. described alkane hydroconversion over Pt/H–(US)Y zeolites with a kinetic model that included alkene protonation enthalpy to account for varying acid strength [19]. Borges et al. studied n-hexane cracking over a series of HZSM-5 catalysts with different acid strength distributions. They quantified their data by a Polanyi linear energy relationship [20]. Iglesia and colleagues developed a theoretical framework linking the activation energy for acid-catalyzed reactions to the deprotonation energy (DPE), which is a descriptor of the Brønsted acid strength, and applied this to several reactions [21,22,23]. More recently, they extended the model by including the Thiele modulus to account for transport by diffusion [24,25].
This paper focuses on developing a detailed but simple kinetic analysis based on three catalyst descriptors: the number of Brønsted acid sites, the porosity, and the acid strength in order to predict the conversion of n-hexane cracking over different mesoporous HY zeolites. The rate equation is based on the fundamental reaction mechanism for protolytic alkane cracking over porous solid acid catalysts, accounting for physisorption, diffusion, protonation, and cracking. Several mesoporous HY zeolites were synthesized and characterized by well-established protocols for this purpose.
2. Results
2.1. TEM Analysis
Mesopores were observed within the H-USY-0 structure by TEM (Figure 1). These mesopores were irregular shaped and were not present in the material treated by CTAB in TMAOH (H-USY-1) or NH4OH (H-USY-2). They were visible by HR-TEM of the H-USY-2 sample (Figure S5). According to Garcia-Martinez et al. [6], these irregular mesopores are due to the dissolution-reorganization process that occurs during the treatment. Si–O–Si bond breaking can occur in alkaline solutions, creating negative charges in the zeolite framework. Positively charged surfactants are transported through the zeolite by electrostatic forces. The crystal rearrangements that take place around the micelles formed by self-assembled surfactant cations create regular-shaped mesopores at the expense of the irregular ones.
2.2. Textural Properties
Figure 2a shows the N2 adsorption-desorption isotherms for H-USY-0, H-USY-1, H-USY-2, and H-Y. H-Y exhibits a type-I isotherm, typical for microporous solids. The H-USY-0 sample combines type-I and IV isotherms [26]. The adsorption branch reflects adsorption in the micropores at the lowest pressures but also adsorption in small mesopores, as indicated by the uptake between 0.01 < p/p0 < 0.2.
The desorption branch presents an IUPAC H4 type, with a parallel flat desorption branch and a closure at p/p0 = 0.45. This type of isotherms is typically found in “mesoporous” zeolites (zeolites that possess a secondary mesoporous network) [26].
The dealumination process carried out by Zeolyst lead to the formation of these mesopores. H-USY-1 and H-USY-2 show type-IV(b) isotherms with uptakes at low pressure in microporous domains and at p/p0 = 0.3–0.4 due to the creation of an additional mesoporous network. The absence of hysteresis loops on these two isotherms indicates that capillary condensation does not occur and by consequence that mesopore sizes are below 4 nm. The steepest uptake of N2 for H-USY-2 indicates the presence of more uniform mesopores in this material [7]. The larger uptake suggests that the mesopore volume is higher for H-USY-2. The mesopore volumes were obtained by the difference between the total and microporous volumes and correspond to 0.22 and 0.32 cm3/g for H-USY-1 and H-USY-2, respectively (Table 1).
The pore volumes of H-USY-1 and H-USY-2 (0.50 cm3/g and 0.55 cm3/g) are larger than for the parent H-USY-0 (0.45 cm3/g, see Table 1). The increase in the total pore volumes for hierarchical materials goes in hand with the lower microporous volumes. As expected, the addition of the mesoporous network is at the expense of the initial microporous volume due to the framework reconstruction at the post-treatment step using a surfactant-templated crystal rearrangement approach. The presence of a porous domain with pore sizes of 1–2 nm is visible in the pore size distribution (NLDFT), corresponding to the faujasite micropores.
The pore size distribution of the materials was determined on the adsorption branch of N2 isotherms by NLDFT (non-local density functional theory method) of the four materials (Figure 2b). The NLDFT method is a molecular modeling approach accounting for adsorbate-adsorbent interactions and/or pore geometry [27,28]. The comparison between the fitted theoretical isotherms with the experimental ones is shown in Figure S6. The mesopores are observed at 5 nm in diameter, in the expected range of the 4 to 6 nm diameter for CTAB micelles as a structural agent [6]. This peak is broader for H-USY-1 than for H-USY-2.
2.3. XRD Analysis
The powder XRD (X-ray diffraction) patterns at low and wide angles of H-Y, H-USY-0, H-USY-1, and H-USY-2 are shown in Figure 3. The characteristic Y zeolite framework peaks are observed for all samples at wide angles. The peak intensities of H-USY-1 and H-USY-2 decrease with respect to the parent H-USY-0. This is due to a loss of crystallinity, which can be (semi-)quantified, and the values are given in Table 2. The exact positions of the XRD peak depend on the unit cell parameters a0, which are also listed in Table 2. A slight shift to higher angles is observed for the mesoporous samples. According to the Fichtner-Schmittler equation, this leads to an increased framework Si/Al ratio. This might be due to localized hydrolysis of Al–O bonds, leading to the removal of aluminum from the framework [28]. This phenomenon is less significant on H-USY-1 than on H-USY-2.
An intense peak at 1.9° 2θ appears for the mesoporous zeolites in the low angles XRD patterns in Figure 3a, typical of a vermicular mesoporous structure [8]. The spatial pore arrangement is likely hexagonal because of the weak broad peak observed around 4° 2θ. The corresponding d spacing is 4.65 nm, as calculated from the position of the (100) peak at 1.9° 2θ by Bragg’s law. This corresponds to lattice constant a0 of 5.37 nm. This value corresponds well to the mesopore diameter of 4–5 nm observed on the pore size distribution obtained via NLDFT plus the wall thickness between the pores (1–1.5 nm).
2.4. ICP-OES Analysis
Table 3 reports the chemical compositions of H-USY-0, H-USY-1, H-USY-2, and H-Y by ICP-OES. Table 3 also compares the Si/Al ratios from XRD analysis to those by ICP-OES. H-USY-1 and H-USY-2 show a slightly lower silica concentration compared to H-USY-0. This is due to the alkaline treatment used for desilication. However, silica loss is rather limited, and a similar Si/Al ratio for three H-USY-0, H-USY-1, and H-USY-2 samples are found. The Si/Al ratio by XRD differs from the one by elementary analysis, indicating the presence of EFAL (extra-framework aluminum).
2.5. NMR Analysis
27Al MAS-NMR analysis shown in Figure 4a indicated the presence of FAL (framework aluminum) and hexacoordinated EFAL at 60 ppm and 0 ppm, respectively, for H-USY-0 and H-USY-1. The shoulder at 52 ppm was assigned to non-framework tetrahedral aluminum [29]. The H-USY-2 sample exhibits a different 27Al MAS-NMR signal that shows ill-defined peaks in the 0–60 ppm range, suggesting the presence of three aluminum species: hexa- (0 ppm) and penta-coordinated (30 ppm) EFAL and tetra-coordinated FAL (60 ppm). The presence of EFAL agrees with the framework Si/Al ratio obtained from XRD analyses, where higher structural Si/Al ratios were identified for the mesoporous materials (Table 3). The H-Y sample also showed the presence of extra-framework aluminum.
The 29Si MAS-NMR analysis of H-USY-0 in Figure 4b shows three signals. The strongest signal at −107 ppm is assigned to the Si(0Al) environment, while the signal at −102 ppm is due to Si(1Al). The latter signal also includes a contribution of Si-OH groups formed by dealumination and/or desilication. It is therefore not possible to estimate an accurate value of the Si/Al framework ratio from the 29Si NMR spectra. The third, rather weak, signal at −111 ppm is assigned to amorphous silica. A higher intensity of this signal is observed for H-USY-1 and H-USY-2. It indicates a loss of crystallinity, as also observed by XRD. H-Y exhibits an additional peak at −97 ppm, corresponding to the Si(2Al) environment. This is due to the high aluminum content compared to the other samples.
2.6. Acidity
Adsorbed pyridine IR spectra were recorded at different temperatures for the four samples. The adsorption bands observed at 1455 and 1545 cm−1 are assigned to adsorbed pyridine and pyridinium ion, respectively. The number of Lewis (LAS) and Brønsted (BAS) acid sites was estimated from the integration of these two bands. They are listed in Table 4 for the IR spectra at 150 °C. The mesoporous H-USY-1 and H-USY-2 samples exhibit lower concentrations of BAS and higher concentrations of LAS than H-USY-0. A possible explanation is the formation of EFAL species during preparation. This has been confirmed with 27Al NMR previously, but also by the differences between bulk and structural Si/Al ratios. The H-Y sample contains a high number of LAS. This sample has a number of BAS similar to H-USY-1, which is lower than H-USY-0.
The relative decrease in the number of LAS and BAS with an increase in the desorption temperature is a measure of the acid strength. Figure S9 shows the relative number of acid sites in the temperature range between 150 and 450 °C. At 450 °C, nearly all pyridinium ions have desorbed. However, the residual number of BAS at 250 and 350 °C differs between the H-USY and the H-Y sample. The BAS acid strength of H-Y seems weaker than the other samples.
2.7. Diffusion Measurements
The diffusion of n-hexane is too fast in the mesoporous zeolites to be measured by zero-length column (ZLC) experiments; therefore, mesitylene has been used to assess the transport properties of the micro/mesoporous materials. To avoid the mesitylene cracking during diffusion measurements, the proton form of the materials was exchanged for the sodium form. ZLC experiments have been carried out at temperatures of 60, 80, and 100 °C over Na-USY-0, Na-USY-1, Na-USY-2, and Na-Y. A detailed analysis of the sodium exchanged samples is given in the SI. Although the pore volume of the sodium samples is lower than the protonated samples (Table S2), a similar Vmicro/Vmeso ratio was found for both series of samples, which allows comparing the transport properties of the different samples.
The characteristic diffusion time, (LD)2/D, is reported in Table 5. This value is obtained from the slopes of the long-time asymptote of a plot of the relative concentration C/C0 of mesitylene at the outlet of the ZLC reactor against the time of desorption (Figure S3). The characteristic diffusion times for the Na-USY samples are rather similar, although the diffusion in Na-USY-1 and Na-USY-2 is slightly faster than in Na-USY-0. For the Na-USY samples, consistent values as a function of temperature were measured, corresponding to activation energies in the range of 15–17 kJ/mol. These values are rather low compared to literature data [30], which might indicate that resistance to diffusion not only occurs in the micropores but also in the mesopores or that surface barriers might play a role. For the Na-Y sample, the ZLC slopes did not change with temperature (Figure S3), suggesting that mesitylene did not diffuse through the entire Na-Y crystals. This was confirmed by the small amount of mesitylene that desorbed from the sample (Figure S4, Table S1). This amount was much smaller than the amount expected from the adsorption isotherm at an equivalent pressure (Table S1). The characteristic diffusion time for the microporous zeolite Na-Y appears to be much longer than the run time of the ZLC experiment and cannot be determined accurately by this method.
2.8. n-Hexane Physisorption
n-Hexane physisorption was studied in the TAP reactor between 200 and 280 °C. The TAP reactor is well suited for sorption studies for zeolites as there are no temperature gradients across the catalyst bed, concentration gradients are fully accounted for by Knudsen diffusion, and due to the very low pulse intensities (1–10 nmol) compared to the number of adsorption sites (~10 µmol), the surface coverages are very low [31,32]. The TAP response curves at all temperatures are fitted simultaneously by a model that accounts for reversible physisorption and intrapore diffusion. Details can be found in [32,33]. An adequate model fit was observed for all samples at all temperatures, as shown in Figure S11. n-Hexane diffusion was too fast to be measured at this temperature interval, evidenced by the fact that the model response fit did not change when the value of the diffusion coefficient was increased. Table 4 lists the values of the n-hexane sorption enthalpies with their 95% confidence intervals for the 4 samples. Only small differences are observed between the values of the sorption enthalpies, indicating that the physisorption strength is mainly governed by the micropores. The values are in line with Thybaut et al. [19], who reported values for the heat of n-hexane physisorption of −43 ± 1.2 kJ/mol over a series of similar zeolite samples (micro and mesoporous) as used here. A value of -42.6 kJ/mol for n-hexane physisorption over FCC catalysts containing H-USY zeolite by TAP experiments has been reported [34].
2.9. Catalytic Performance
In order to characterize the acidity of the micro- and mesoporous catalysts, n-hexane cracking was studied as a model reaction. A first test was carried out at 650 °C, followed by the catalyst regeneration at the same temperature, before the cracking results at temperatures of 550, 575, 600, and 650 °C. To monitor deactivation during the tests, runs were carried out with a time on stream of more than 60 min. A GC analysis was performed every four minutes to determine the effluent composition. Figure 5 shows the n-hexane conversion as a function of time. For the H-USY catalysts, a decrease in the n-hexane conversion at 650 °C indicates deactivation of the catalyst. For the tests performed at 575 °C, the conversion appears rather constant for the duration of the tests. Regarding the microporous H-Y material, an increase in the n-hexane conversion was observed at 575, 600, and 650 °C, which dropped at a much longer time on stream at 650 °C (not shown). At 550 °C, the catalysts seem stable, although some scattering of the data can be observed. Therefore, to better compare the samples, only the initial conversions of the tests were used in the kinetic analysis.
3. Discussion
n-Hexane cracking can proceed via a monomolecular or bimolecular reaction mechanism. Babitz et al. [35] showed that the n-hexane conversion was first-order over H-USY, following monomolecular cracking. Figure S10 shows the product selectivity as a function of the conversion for all four samples. The product distribution as a function of the conversion is very similar for all four samples and is similar to those reported by Babitz et al. [35]. This shows that n-hexane cracking proceeds by monomolecular cracking. The protonation of n-hexane leads to the formation of an alkylcarbonium ion that is transformed by protolytic cracking into a smaller alkylcarbenium ion and a smaller alkane or hydrogen. The alkylcarbenium ion can deprotonate into an alkene or undergo consecutive reactions (isomerization, hydride transfer, or cracking).
In the case of monomolecular cracking, a first comparison of the catalytic activities of the four samples can be performed based on the α-test. This consists of calculating the volumetric rate constants (s−1) for n-hexane cracking at 811 K (1000 °F, which is the temperature defined for the α-test [11]), for contact times that lead to conversion levels between 5% and 20% and normalizing them with respect to the value of the rate constant for n-hexane cracking over amorphous silica-alumina [11].
The volumetric rate constant at 811 K is calculated from the integrated first-order rate equation as:
where: Xn−C6 is the n-hexane conversion at 811 K, and τs the superficial contact time (s), calculated as the ratio of the catalyst volume and the volumetric flow rate of n-hexane.
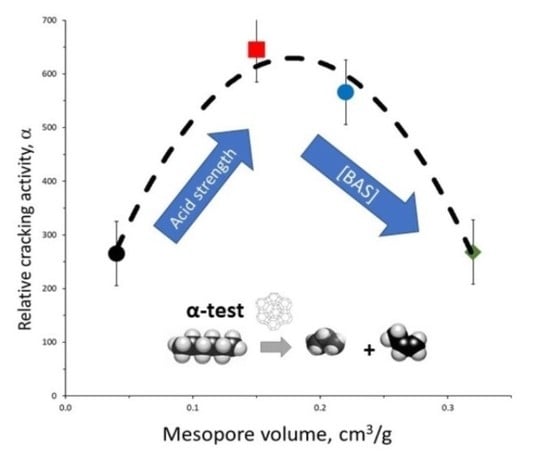
To calculate the relative cracking activity α of the H-Y and H-USY zeolites, a value of 0.012 s−1 for the rate constant for n-hexane cracking over an amorphous silica-alumina was estimated, according to the reaction conditions reported in [11]. The conversion data were extrapolated to 811 K with the corresponding activation energies. Figure 6 shows the relative cracking activity as a function of the mesopore volume. A volcano-like curve is observed. An optimum activity appears around a mesoporosity of 0.15, corresponding to the H-USY-0 sample. This is likely due to a trade-off between the increasing acidity and/or rate of molecular transport in the mesoporous materials and the decrease in the number of Brønsted sites with increasing mesoporosity.
Protolytic cracking only occurs over Brønsted acid sites, as the first step consists of the transfer of a proton to form the penta-coordinated carbenium ion. Linear correlations between the cracking activity and the number of framework aluminum sites have been observed for conventional and dealuminated faujasite zeolites [36]. LAS does not seem to have a significant impact on the activity in our case either, as the catalyst with the highest activity contains the lowest number of LAS (H-USY-0, Table 4). Thus, the activity per acid site can be calculated from the volumetric rate constant corrected for the number of Brønsted acid sites, NBAS (mol/m3), determined by pyridine FT-IR and reported in Table 5.
Note that kV is not an intrinsic cracking rate constant but is lumped with the n-hexane physisorption equilibrium constant. De Moor et al. provide a theoretical value of the n-hexane physisorption equilibrium constant at 500 °C of 0.9 MPa−1 for faujasite, which agreed well with various experimental values [37]. Using a Langmuir isotherm, coverages of adsorbed n-hexane of less than 0.01 for all samples ≥ 500 °C can be estimated (Henry regime). As very similar values of the physisorption enthalpy were measured for all samples (Table 4), the lumped rate coefficient, kV, and associated with the apparent activation energy are used for the kinetic analysis.
The values of kV are shown as an Arrhenius plot in Figure 7. The data obey Arrhenius law, indicating that no significant change in mechanism occurs in this temperature range. The values of the rate constants for H-USY-0, H-USY-1, H-USY-2 are very similar, as well as the values of the apparent activation energy (129.7 ± 2 kJ/mol). Note that due to the lumping with the physisorption constant, the values of intrinsic activation energies will be approximately 40 kJ/mol higher. The values of the apparent activation energies range between 129 and 132 kJ/mol, in suitable agreement with the values of 123–128 kJ/mol reported by Konno et al. [15] for H-ZSM-5, but lower than the value of 177 kJ/mol reported by Babitz et al. [35] for n-hexane cracking over H-USY. The values of the rate constant at 923 K are also close to the values reported by Konno et al. (6 × 10⁻³ vs. 1 × 10⁻² m3/kg/s) [15].
The similar values of the rate constants normalized per Brønsted acid site and activation energies for the H-USY zeolites indicate that the drop in relative activity for n-hexane cracking per catalyst volume with increasing mesopore volume from 0.15 to 0.32 cm3/g, Figure 6, is due to the decreasing concentration of Brønsted acid sites (Table 4).
The value of the rate constant for the microporous H-Y sample, on the other hand, is approximately two times smaller, and the activation energy is significantly lower (123.7 vs. 129.7 ± 2 kJ/mol) than for the H-USY samples. There can be several reasons for the lower activity of H-Y compared to the H-USY samples.
The lower activity of the H-Y sample could be due to internal diffusion limitations, as the H-Y has much larger microporous domains than the H-USY samples and, therefore, a longer diffusion time ((LD)2/D). Assuming that no diffusion limitation occurs over H-USY-1 due to the small microporous domains, then the ratio of the rate constants, kV, between H-Y and H-USY-1 corresponds to the effectiveness factor of the H-Y sample. This yields a value of the effectiveness factor of 0.5 at 550 °C, which, for spherical H-Y particles, corresponds to a Thiele modulus of 4.6 [38]. By repeating this calculation at different temperatures, the activation energy for the internal diffusion coefficient of approximately 120 kJ/mol can be estimated. This value is much higher than the values of the n-hexane physisorption enthalpy of ~−40 kJ/mol on H-Y and H-USY (Table 4). Activation energies for diffusion (Ea,dif) are usually smaller than the value for the physisorption enthalpy, as the physisorption enthalpy corresponds to the energy required to completely remove the molecule from the zeolite force field. In the diffusion-limited regime, the observed activation energy is given by [38]:
Ea,obs = ½*(Ea,app + Ea,dif)
This equation yields, with a more realistic value of the activation energy for diffusion (~20 kJ/mol), a much lower value of the apparent activation energy (~75 kJ/mol) for n-hexane cracking than measured experimentally. Thus, the lower activity is not (only) due to internal diffusion limitations.
The lower strength of acid sites might be responsible for the lower value of the rate constant. Figure SI-9 shows that pyridine desorption on the Brønsted sites as a function of temperature was faster over the H-Y sample than over the H-USY samples. This implies a lower adsorption enthalpy for pyridine adsorption on Brønsted sites for the H-Y sample than for the H-USY samples, indicating a lower acid strength. The effect of the acid strength on the cracking rate of small paraffin molecules has been studied extensively in the literature [18,19,20,21,22,23,24,25,39,40,41], with contradicting viewpoints. Some studies show that there is no effect of the acid strength on the cracking rate [16,17]. In fact, several experimental and modeling studies show similar activation energies for very different zeolites, ruling out any effect of acid strength on the cracking rate.
Theoretical calculations show that the acid strength, expressed as the deprotonation energy (DPE), for Y zeolites (1161–1166 kJ mol−1) is independent of the Al framework location and increases only in the case of next-nearest-neighbor Al locations (1177–1247 kJ mol−1) [42]. It is admitted that Y zeolites with Si/Al > 5 are mainly constituted of isolated Al ions [40]. Note that the Si/Al of the H-Y sample is 2.5, while the H-USY samples are around 15. The H-Y zeolite likely contains next-nearest-neighbor Al ions with lower acid strength. However, if the low activity of the H-Y sample is fully attributed to the acid strength, a value of the activation energy higher than that of the H-USY samples would be expected on the basis of the results in [18,19,20,21,22,23,24,25], while the opposite has been observed here (Figure 8, 123.7 < 129.7 ± 2 kJ/mol).
Several studies show that mild steaming of cracking catalysts lead to an increase in its activity [13,36,41]. Steaming removes Al ions from the framework, accompanied by a stability increase and the formation of extra-framework aluminum species (EFAL) [40]. Different explanations have been provided on the enhanced activity; the increase in the activity has been correlated with the number of paired Al sites or by an inductive influence of the Lewis acidity created by EFAL species on the hydroxyl groups [40]. Even when the acid strength is lowered by interaction with EFAL species, an increase in the activation energy would be expected.
The relation between the apparent activation energy and the deprotonation energy (DPE), which is a descriptor of the Brønsted acid strength, can be visualized by constructing a Born-Haber thermochemical cycle for n-hexane cracking as an energy diagram, as shown in Figure 8 [19,21]. Figure 8 shows the enthalpy levels of the different reactants and intermediates for alkane cracking over Brønsted acid sites. The reaction path consists of the physisorption of the alkane, R(g), from the gas phase to the physisorbed state, R(z), followed by the protonation of R(z) to an alkylcarbonium ion, R-H+(z), shown as a transition state. The alkylcarbonium ion will then crack into a smaller alkylcarbenium ion and a smaller alkane or hydrogen. The diagram shows that the intrinsic barrier (Ea) is equal to the sum of the physisorption enthalpy (ΔHphys) and the apparent activation energy (Ea,app).
A different independent path can be chosen to reach the same transition state since the diagram concerns thermodynamical quantities. This path involves the DPE, the proton affinity (ΔHPA), and the stabilization energy (Estab) [19,21,22,23]. It follows from the diagram in Figure 8 that the sum of the apparent activation energy (Ea,app), the stabilization energy, and the proton affinity is equal to the DPE. Thus, an increase in the DPE, which corresponds to a weaker acid strength (DPEweak), and assuming constant stabilization energy, will lead to an increase in the apparent activation energy (as well as the intrinsic barrier). This is indicated by the red dotted lines in Figure 8.
Generally, the stabilization energy will also change with changing acid strength, resulting in a less than one to one dependence of the apparent activation energy on the DPE [21]. The sum of the DPE and the stabilization energy is sometimes taken as an indicator of the acid strength [18].
As explained above, a lower acid strength will lead to an increase, while diffusion limitations will lead to a decrease in the activation energy. Thus, the small change in the value of the activation energy for n-hexane cracking over H-Y compared to the H-USY samples might be due to both a lower acid strength and internal diffusion limitations. To further verify this assumption, the H-Y conversion data at different temperatures were fitted to the integrated first-order equation, including the effectiveness factor:
kV is given as a function of the temperature by:
Both Ea,app and (LD)2/D can be estimated by regression analysis of Equations (5–10) with the experimental conversion data for the HY zeolite. The value of NBAS (376 mol/m3) of the H-Y zeolite was used. For the pre-exponential factor, k0V, the value for the H-USY-1 zeolite (7.3 106 s−1) was used, as this data was considered as the intrinsic rate. Macht et al. [21] reported that the acid strength does affect the activation energy, but not the pre-exponential factor. Furthermore, it was assumed that the value of the diffusion coefficient, D is constant over the temperature interval (Ea,dif = 0), as it was found that the value of Ea,dif did not impact the estimated Ea,app value. The estimated values of Ea,app, and (LD)2/D are listed in Table 6. The value for Ea,app (138.7 kJ/mol) is now indeed higher than that of H-USY-1 due to the lower acid strength of the H-Y sample.
Macht et al. [21] found for n-hexane isomerization over Keggin-type tungsten polyoxometalates and H-BEA zeolite the following relation between the change in DPE and the apparent activation energy:
Assuming that this relation also holds for n-hexane cracking over Y zeolites and taking the H-USY-1 zeolite as the reference, the following relation for the apparent activation energy can be derived:
where ∆DPE corresponds to the difference in protonation energy between the HY and H-USY-1 samples. This equation gives a value of ∆DPE of 23 kJ/mol. The value of 23 kJ/mol for ∆DPE is well within the range of 86 kJ/mol of the DPE variation reported for the next-nearest-neighbor Al atoms [42] in Y zeolites. Yaluris et al. [18] found a variation in the protonation energy of 26 kJ/mol for FCC catalysts that underwent different severities of steaming, while Thybaut et al. found a change of 20 kJ/mol for the ∆DPE between microporous HY and mesoporous H-USY for n-octane hydroisomerization [19].
The effectiveness factors over the H-Y sample at 550, 575, 600, and 650 °C were 0.98, 0.96, 0.95, and 0.84, respectively, indicating that some diffusion limitation (η < 0.95) occurs only at the highest temperature of 650 °C.
Thus, the introduction of the mesoporosity from H-Y to H-USY-0 leads to a higher cracking rate mainly due to the change in acid strength. The change in acid strength can be due either to site isolation or the effect of the increasing EFAL concentration on the Brønsted sites.
4. Materials and Methods
4.1. Zeolite Synthesis
The hierarchical zeolites were prepared by post-synthesis modification of Y zeolite. CBV720 from Zeolyst was the base Y zeolite. This is a USY (Ultra Stable) zeolite with an overall Si/Al ratio of 15 due to a steaming treatment. This sample is referred to as H-USY-0.
A first sample was prepared on the basis of the work by Garcia-Martinez et al. [6]. A total of 4.38 g of CetylTrimethylAmmonium Bromide (CTAB) was dissolved into 400 mL of a 0.37 M NH4OH solution. After homogenization, 6.25 g of CBV720 was added and followed by 20 min of stirring. The mixture was heated for 10 h at 150 °C under autogenous pressure. The sample was washed with deionized water, after cooling down to room temperature, dried overnight at 90 °C, and calcined for 10 h at 550 °C. This sample is referred to as H-USY-1.
A second sample was prepared on the basis of the same surfactant-templated mechanism and published by Chal et al. [7]. To prepare a 0.09 M TMAOH solution, 9.50 g of TetraMethylAmmonium hydroxide (TMAOH) was dissolved into 290 mL of water. A total of 5 g of CTAB was added, and the solution was stirred. After a homogeneous solution was obtained, 10 g of CBV720 was added, followed by 20 min of stirring. The mixture was treated for 20 h at 150 °C in a Teflon-lined stainless-steel autoclave. The sample was washed with deionized water after cooling down to room temperature, dried overnight at 90 °C, and calcined for 10 h at 550 °C. This sample is referred to as H-USY-2. The applied treatment for this sample was rather harsh, causing some damage to the zeolite structure. This treatment will change the porosity and number of acid sites, which are parameters included in the kinetic model.
CBV400 from Zeolyst has been used as a benchmark microporous zeolite without chemical nor steaming treatment and is referred to as H-Y. Because this sample has not been treated or steamed, its characteristics are very different from the H-USY samples. Therefore, the catalytic properties will also be very different. This makes it an interesting material to be used next to the H-USY samples to test the kinetic model that is based on catalyst descriptors such as porosity, the number of acid sites, and acid site strength.
4.2. Characterization Techniques
4.2.1. ICP-OES
Inductively coupled plasma-optical emission spectrometry (ICP-OES) (Horiba Jobin Yvon, Longjumeau, France) was used for the elementary composition of the zeolites.
4.2.2. X-ray Diffraction (XRD)
X-ray diffraction patterns were recorded on a Bruker D8 advance diffractometer (Wissembourg, France) using Cu Kα1 radiation at λ = 1.5406 Å. X-ray diffractograms were recorded over the 2θ angle range of 4–80°, with steps of 0.02°. When necessary, characterization of the low 2θ angle range of 0.45–7° with steps of 0.01°, was also performed.
4.2.3. Nitrogen Adsorption-Desorption Isotherms
Measurements were performed at 77 K on a BELSORP-mini apparatus (BEL Inc., Osaka, Japan). Prior to the measurement, around 50 mg of sample was outgassed overnight at 250 °C under vacuum. To determine the surface area, the BET plot was applied in a relative pressure range below 0.1.
4.2.4. Transmission Electronic Microscopy (TEM)
TEM images of the samples were performed on a JEOL 2010 microscope (Tokyo, Japan). The microscope is operated at 200 kV, and a LaB6 single crystal was used as an electron source.
4.2.5. Solid-State 27Al and 29Si Nuclear Magnetic Resonance (NMR)
Measurements were carried out on a Bruker Avance III 500 WB spectrometer (Wissembourg, France) at 11.7 T. The samples were packed into a 4 mm-diameter zirconia rotor, and spectra were collected at a spinning rate of 10 kHz. Al(NO3)3 and Q8M8 were the standard references for 27Al and 29Si, respectively. Pulse lengths of 0.5 and 4 µs and recycle delay of 1 and 100 s were used for 27Al and 29Si signals, respectively.
4.2.6. FT-IR Spectroscopy of Pyridine Adsorption
The IR spectra were collected using a Nicolet Magna-550 FT-IR instrument (France). An IR background was recorded of an empty cell under vacuum. The sample holder was placed inside the IR cell and evacuated at 450 °C overnight. Then, an IR spectrum of the sample was recorded at room temperature. Pyridine adsorption on the wafer was carried out for 15 min at room temperature. Pyridine desorption of was performed at 150 °C (2 h), 250 °C (1 h), 350 °C (1 h), and 450 °C (1 h). IR analysis was performed for each desorption step at room temperature. Details on the data analysis and typical IR spectra are presented in the supporting information.
4.2.7. Zero-Length Column
Diffusion measurements were performed by the zero-length column (ZLC) method. The experimental setup was composed of 3 mass flow controllers (Brooks), a G/L saturator, a stainless-steel 1/8” Swagelok tube union to hold the sample inside a GC oven, a 4-way valve (VICI), and a flame ionization detector (FID). All lines were heat-traced. A total of 1–2 mg of zeolite (100–250 µm) was used. The sample was activated overnight at 300 °C under a helium flow. To avoid cracking reactions during diffusion measurements, the zeolite samples are exchanged to the sodium form. The ion exchanges are carried out three times with NaCl solution at 80 °C for 1 h. Details can be found in the supporting information. The mesitylene adsorption experiments over the 4 samples are given in Figure SI-1.
4.2.8. Temporal Analysis of Products
n-Hexane physisorption experiments were carried out in a Temporal Analysis of Products TAP-2 setup (Mithra Technologies, Missouri, USA). A total of 11 mg of sample was loaded into the microreactor sandwiched between 2 zones of quartz particles (200–300 µm). The sample was heated to 400 °C with a temperature ramp of 20 °C/min and kept at 400 °C for one h. The temperature was then ramped down to 200 °C. Pulses of 50% n-hexane and 50% Ar were introduced at 200, 220, 240, 260, and 280 °C. These experiments were repeated several times to check the stability of the catalyst. No significant differences between the series were observed for all samples. Two batches of H-USY-2 zeolite were measured, yielding the same results, thus showing the suitable reproducibility of the TAP experiments. Inspection of the argon pulse showed that transport through the reactor occurred by Knudsen diffusion.
4.2.9. Catalytic Tests
The cracking of n-hexane was performed in a 24 cm-length U-shaped quartz reactor (6 mm OD and 4 mm ID) heated by a furnace. A total of 100 mg of zeolite sample with a sieve fraction between 100 and 250 µm was used. The gas flow of nitrogen was regulated by a mass flow controller (Brooks), and liquid n-hexane was controlled by a Coriolis mass flow meter (Brooks Quantim). The effluents were analyzed online by a micro-GC (SRA Instrument, Lyon France) containing a Molsieve 5A column, a PoraPLOT Q column, and an OV-1 column. The n-hexane conversion was calculated as follow:
where X is the n-hexane fractional conversion, FnC6,0 is the n-hexane flow (0.43 mmol/min) at the reactor inlet, and Fn-C6 is the n-hexane outlet flow.
5. Conclusions
A series of faujasite zeolites with increasing mesopore volume was synthesized, characterized by various physical-chemical methods, and tested for n-hexane cracking. The samples included commercial CBV400 Y zeolite, steamed ultra-stable CBV720, of which the mesopore volume was further increased by two different top-down approaches based on surfactant-templated crystal rearrangement. The mesopore volume varied from 0.04 to 0.32 cm3/g, but the simultaneous variation of several other important parameters (Si/Al, (BAS), (LAS), (EFAL)) could not be avoided.
Mesitylene diffusion measurements showed a large decrease in the characteristic diffusion time upon the introduction of mesoporosity. This is due to the reduction in the size of the microporous domains and thus a reduction in the diffusion path length, largely improving the transport in the mesoporous zeolites compared to the original microporous sample. The characteristic diffusion time did not change significantly with a further increase in the mesoporosity. n-Hexane physisorption enthalpies were very similar for all samples.
The catalytic activity of the zeolites was studied through the cracking of n-hexane between 550 and 650 °C. Whereas the α-test ranks the zeolites according to their relative activity per catalyst volume, a more detailed kinetic analysis allowed explaining the origin of the optimum catalyst initial activity.
The three mesoporous H-USY zeolites showed the same value of the intrinsic rate constant and the same activation energies. The relative initial activity decreased with increasing mesopore volume from 0.15 to 0.32 cm3/g due to the decrease in the number of Brønsted acid sites. The increase in the initial activity by steaming of the microporous zeolite was caused by an increase in the acid strength. Slightly improved transport properties were observed for the mesoporous zeolites only at a reaction temperature of 650 °C. The increased acid strength of the mesoporous zeolites lowered the activation energy barrier for n-hexane cracking by 7 kJ/mol. The increase in the acid strength is probably due to the increase in the number of isolated Al atoms upon steaming, although the effect of EFAL cannot be excluded.
The catalytic cracking of n-hexane at different temperatures coupled with a kinetic analysis proved to be a valuable tool to study the acidity of zeolites. The fact that n-hexane cracking proceeds through protolytic cracking over a wide range of operating conditions allows using the analytical form of the first-order rate equation. The rate equation contains three catalytic descriptors: the change in acid strength (∆DPE), the number of acid sites, NBAS, and the porosity through the effectiveness factor η.
Supplementary Materials
The following are available online at https://www.mdpi.com/article/10.3390/catal11060652/s1, Figure S1: Mesitylene adsorption isotherms, Figure S2: Experimental F*t-plot of Na-USY-0, Figure S3: ZLC response curves for mesitylene, Figure S4: Flow of mesitylene desorbed, Figure S5: HR-TEM image of H-USY-2, Figure S6: Application of NLDFT method, Figure S7: N2 adsorption-desorption isotherm, Figure S8: Comparison of the XRD patterns, Figure S9: Relative concentration of acid sites, Figure S10: Product distribution of n-hexane cracking, Figure S11: TAP n-hexane pulse responses modeling. Table S1: Comparison between ZLC and isotherm measurements, Table S2: BET surface area, micropore volume, and total pore volume, Table S3: Elemental composition, Table S4: Assignation of the vibration bands observed in the range of 4000–3300 cm−1, Table S5: Assignation of the vibration bands observed in the range of 1700–1400 cm−1.
Author Contributions
Conceptualization, A.T., D.F., and Y.S.; methodology, D.F. and Y.S.; software, Y.S. and C.D.; validation, A.T., D.F., and Y.C.; formal analysis, Y.C.; investigation, Y.C. and C.D.; resources, A.T. and Y.C.; data curation, Y.C. and Y.S.; writing—original draft preparation, Y.C.; writing—review and editing, A.T., D.F., and Y.S.; supervision, A.T., D.F., and Y.S.; project administration, D.F. and Y.S.; funding acquisition, D.F. and Y.S. All authors have read and agreed to the published version of the manuscript.
Funding
This project has received funding from the European Union’s Horizon 2020 research and innovation program under Grant Agreement No. 727531 (“4REFINERY”).
Data Availability Statement
Not relevant.
Conflicts of Interest
The authors declare no conflict of interest. The funders had no role in the design of the study; in the collection, analyses; or interpretation of data; in the writing of the manuscript, or in the decision to publish the results.
References
- Yilmaz, B.; Müller, U. Catalytic Applications of Zeolites in Chemical Industry. Top. Catal. 2009, 52, 888–895. [Google Scholar] [CrossRef] [Green Version]
- Vermeiren, W.; Gilson, J.-P. Impact of Zeolites on the Petroleum and Petrochemical Industry. Top. Catal. 2009, 52, 1131–1161. [Google Scholar] [CrossRef]
- Verboekend, D.; Nuttens, N.; Locus, R.; van Aelst, J.; Verolme, P.; Groen, J.C.; Pérez-Ramírez, J.; Sels, B.F. Synthesis, characterisation, and catalytic evaluation of hierarchical faujasite zeolites: Milestones, challenges, and future directions. Chem. Soc. Rev. 2016, 45, 3331–3352. [Google Scholar] [CrossRef] [PubMed] [Green Version]
- Holm, M.S.; Taarning, E.; Egeblad, K.; Christensen, C.H. Catalysis with hierarchical zeolites. Catal. Today 2011, 168, 3–16. [Google Scholar] [CrossRef]
- Silaghi, M.-C.; Chizallet, C.; Raybaud, P. Challenges on molecular aspects of dealumination and desilication of zeolites. Microporous Mesoporous Mat. 2014, 191, 82–96. [Google Scholar] [CrossRef]
- Garcia-Martinez, J.; Johnson, M.; Valla, J.; Li, K.; Ying, J.Y. Mesostructured zeolite Y—high hydrothermal stability and superior FCC catalytic performance. Catal. Sci. Technol. 2012, 2, 987–994. [Google Scholar] [CrossRef]
- Chal, R.; Cacciaguerra, T.; van Donk, S.; Gérardin, C. Pseudomorphic synthesis of mesoporous zeolite Y crystals. Chem. Commun. 2010, 46, 7840–7842. [Google Scholar] [CrossRef] [PubMed]
- Van Donk, S.; Janssen, A.H.; Bitter, J.H.; de Jong, K.P. Generation, Characterization, and Impact of Mesopores in Zeolite Catalysts. Catal. Rev. 2003, 45, 297–319. [Google Scholar] [CrossRef] [Green Version]
- Hartmann, M.; Machoke, A.G.; Schwieger, W. Catalytic Test Reactions for the Evaluation of Hierarchical Zeolites. Chem. Soc. Rev. 2016, 45, 3313–3330. [Google Scholar] [CrossRef] [Green Version]
- Guisnet, E.; Pinard, L. Characterization of acid-base catalysts through model reactions. Catal. Rev. 2018, 60, 1–100. [Google Scholar] [CrossRef]
- Weisz, P.B.; Miale, J.N. Superactive Crystalline Aluminosilicate Hydrocarbon Catalysts. J. Catal. 1965, 4, 527–529. [Google Scholar] [CrossRef]
- Miale, J.N.; Chen, N.Y.; Weisz, P.B. Catalysis by Crystalline Aluminosilicates IV. Attainable Catalytic Cracking Rate Constants and Superactivity. J. Catal. 1966, 6, 278–287. [Google Scholar] [CrossRef]
- Haag, W.O.; Dessau, R.M.; Lago, R.M. Kinetics and Mechanisms of Paraffin Cracking with Zeolite Catalysts. Stud. Surf. Sci. Catal. 1991, 60, 255–265. [Google Scholar]
- Milina, M.; Mitchell, S.; Michels, N.L.; Kenvin, J.; Perez-Ramirez, J. Interdependence between porosity, acidity, and catalytic performance in hierarchical ZSM-5 zeolites prepared by post-synthetic modification. J. Catal. 2013, 308, 398–407. [Google Scholar] [CrossRef]
- Konno, H.; Okamura, T.; Kawahara, T.; Nakasaka, Y.; Tago, T.; Masuda, T. Kinetics of n-hexane cracking over ZSM-5 zeolites—Effect of crystal size on effectiveness factor and catalyst lifetime. Chem. Eng. J. 2012, 207, 490–496. [Google Scholar] [CrossRef] [Green Version]
- Mochizuki, H.; Yokoi, T.; Imai, H.; Namba, S.; Kondo, J.N.; Tatsumi, T. Effect of desilication of H-ZSM-5 by alkali treatment on catalytic performance in hexane cracking. Appl. Catal. A Gen. 2012, 449, 188–197. [Google Scholar] [CrossRef]
- Mochizuki, H.; Yokoi, T.; Imai, H.; Watanabe, R.; Namba, S.; Kondo, J.N.; Tatsumi, T. Facile control of crystallite size of ZSM-5 catalyst for cracking of hexane. Microporous Mesoporous Mat. 2011, 145, 165–171. [Google Scholar] [CrossRef]
- Yaluris, G.; Madon, R.J.; Dumesic, J.A. Catalytic Ramifications of Steam Deactivation of Y Zeolites: An Analysis Using 2-Methylhexane Cracking. J. Catal. 1999, 186, 134–146. [Google Scholar] [CrossRef]
- Thybaut, J.W.; Marin, G.B.; Baron, G.V.; Jacobs, P.A.; Martens, J.A. Alkene Protonation Enthalpy Determination from Fundamental Kinetic Modeling of Alkane Hydroconversion on Pt/H–(US)Y-Zeolite. J. Catal. 2001, 202, 324–339. [Google Scholar] [CrossRef]
- Borges, P.; Pinto, R.R.; Lemos, M.A.N.D.A.; Lemos, F.; Vedrine, J.C. Activity–acidity relationship for alkane cracking over zeolites: N-hexane cracking over HZSM-5. J. Mol. Catal. A Chem. 2005, 229, 127–135. [Google Scholar] [CrossRef]
- Macht, J.; Carr, R.T.; Iglesia, E. Consequences of Acid Strength for Isomerization and Elimination Catalysis on Solid Acids. J. Am. Chem. Soc. 2009, 131, 6554–6565. [Google Scholar] [CrossRef] [PubMed]
- Knaeble, W.; Carr, R.T.; Iglesia, E. Mechanistic interpretation of the effects of acid strength on alkane isomerization turnover rates and selectivity. J. Catal. 2014, 319, 283–296. [Google Scholar] [CrossRef] [Green Version]
- Noh, G.; Zones, S.I.; Iglesia, E. Consequences of Acid Strength and Diffusional Constraints for Alkane Isomerization and β-Scission Turnover Rates and Selectivities on Bifunctional Metal-Acid Catalysts. J. Phys. Chem. C 2018, 122, 25475–25497. [Google Scholar] [CrossRef]
- Knaeble, W.; Iglesia, E. Acid strength and metal-acid proximity effects on methylcyclohexane ring contraction turnover rates and selectivities. J. Catal. 2016, 344, 817–830. [Google Scholar] [CrossRef] [Green Version]
- Noh, G.; Shi, Z.; Zones, S.I.; Iglesia, E. Isomerization and b-scission reactions of alkanes on bifunctional metal-acid catalysts: Consequences of confinement and diffusional constraints on reactivity and selectivity. J. Catal. 2018, 368, 389–410. [Google Scholar] [CrossRef]
- Thommes, M.; Kaneko, K.; Neimark, A.V.; Olivier, J.P.; Rodriguez-Reinoso, F.; Rouquerol, J.; Sing, K.S.W. Physisorption of gases, with special reference to the evaluation of surface area and pore size distribution (IUPAC Technical Report). Pure Appl. Chem. 2015, 87, 1051–1069. [Google Scholar] [CrossRef] [Green Version]
- Landers, J.; Gor, G.Y.; Neimark, A.V. Density functional theory methods for characterization of porous materials, Colloids Surfaces a Physicochem. Eng. Asp. 2013, 437, 3–32. [Google Scholar] [CrossRef]
- Mitchell, S.; Milina, M.; Verel, R.; Hernández-Rodríguez, M.; Pinar, A.B.; McCusker, L.B.; Pérez-Ramírez, J. Aluminum Redistribution during the Preparation of Hierarchical Zeolites by Desilication. Chem. A Eur. J. 2015, 21, 14156–14164. [Google Scholar] [CrossRef]
- Sotomayor, F.J.; Cychosz, K.A.; Thommes, M. Characterization of Micro/Mesoporous Materials by Physisorption: Concepts and Case Studies. Acc. Mater. Surf. Res. 2018, 3, 34–50. [Google Scholar]
- Kortunov, P.; Vasenkov, S.; Kärger, J.; Valiullin, R.; Gottschalk, P.; Elıa, M.F.; Perez, M.; Stöcker, M.; Drescher, B.; McElhiney, G.; et al. The Role of Mesopores in Intracrystalline Transport in USY Zeolite: PFG NMR Diffusion Study on Various Length Scales. J. Am. Chem. Soc. 2005, 127, 13055–13059. [Google Scholar] [CrossRef]
- Morgan, K.; Maguire, N.; Fushimi, R.; Gleaves, J.T.; Goguet, A.; Harold, M.P.; Kondratenko, E.V.; Menon, U.; Schuurman, Y.; Yablonsky, G.S. Forty years of temporal analysis of products. Catal. Sci. Technol. 2017, 7, 2416–2439. [Google Scholar] [CrossRef] [Green Version]
- Schuurman, Y. Assessment of kinetic modeling procedures of TAP experiments. Cat. Today 2007, 121, 187–196. [Google Scholar] [CrossRef]
- Schuurman, Y.; Pantazidis, A.; Mirodatos, C. The TAP-2 Reactor as an Alternative Tool for Investigating FCC Catalysts. Chem. Eng. Sci. 1999, 54, 3619–3625. [Google Scholar] [CrossRef]
- Fierro, V.; Schuurman, Y.; Mirodatos, C.; Duplan, J.L.; Verstraete, J. Study of the cracking reaction of linear and branched hexanes under protolytic conditions by non-stationary kinetics. Chem. Eng. J. 2002, 90, 139–147. [Google Scholar] [CrossRef]
- Babitz, S.M.; Williams, B.A.; Miller, J.T.; Snurr, R.Q.; Haag, W.O.; Kung, H.H. Monomolecular cracking of n-hexane on Y, MOR, and ZSM-5 zeolites. Appl. Catal. A Gen. 1999, 179, 71–86. [Google Scholar] [CrossRef]
- Beyerlein, R.A.; McVicker, G.B.; Yacullo, L.N.; Ziemiak, J.J. The influence of framework and nonframework aluminum on the acidity of high-silica, proton-exchanged FAU-framework zeolites. J. Phys. Chem. 1988, 92, 1967–1970. [Google Scholar] [CrossRef]
- Moor, D.; Reyniers, M.F.; Gobin, O.C.; Lercher, J.A.; Marin, G.B. Adsorption of C2-C8 n-Alkanes in Zeolites. J. Phys. Chem. C 2011, 115, 1204–1219. [Google Scholar] [CrossRef]
- Froment, G.F.; Bischoff, K. Chemical Reactor Analysis and Design, 2nd ed.; John Wiley and Sons: New York, NY, USA, 1990. [Google Scholar]
- Wang, Q.L.; Giannetto, G.; Guisnet, M. Dealumination of Zeolites III. Effect of Extra-Framework Aluminum Species on the Activity, Selectivity and Stability of Y Zeolites in n-Heptane Cracking. J. Catal. 1991, 13, 471–482. [Google Scholar] [CrossRef]
- Xu, B.; Bordiga, S.; Prins, R.; Bokhoven, J.A. Effect of Framework Si/Al Ratio and Extra-Framework Aluminum on the Catalytic Activity of Y Zeolite. Appl. Catal. A Gen. 2007, 333, 245–253. [Google Scholar] [CrossRef]
- Kung, H.H.; Williams, B.A.; Babitz, S.M.; Miller, J.T.; Haag, W.O.; Snurr, R.Q. Enhanced Hydrocarbon Cracking Activity of Y Zeolites. Top. Catal. 2000, 10, 59–64. [Google Scholar] [CrossRef]
- Sierka, M.; Eichler, U.; Datka, J.; Sauer, J. Heterogeneity of Brønsted Acidic Sites in Faujasite Type Zeolites due to Aluminum Content and Framework Structure. J. Phys. Chem. B 1998, 102, 6397–6404. [Google Scholar] [CrossRef]
Figure 1.
TEM images of the samples (a) H-Y, (b) H-USY-0, (c) H-USY-1, and (d) H-USY-2.

Figure 2.
(a) N2 adsorption-desorption isotherm at 77 K. (b) The pore size distribution derived from the NLDFT method applied to the nitrogen adsorption isotherms.
Figure 2.
(a) N2 adsorption-desorption isotherm at 77 K. (b) The pore size distribution derived from the NLDFT method applied to the nitrogen adsorption isotherms.

Figure 3.
(a) Small angles XRD patterns. (b) Wide angles XRD patterns.

Figure 4.
(a) 27Al MAS-NMR and (b) 29Si MAS-NMR of H-USY-0, H-USY-1, H-USY-2, and H-Y samples.

Figure 5.
Conversion of n-hexane on (a) H-USY-0, (b) H-USY-1, (c) H-USY-2, and (d) H-Y at 550 (▼), 575 (▲), 600 (●), and 650 °C (■). Reaction conditions: catalyst 0.1 g; Pn-hexane = 9 kPa; W/FnC6,0 = 3.9 gcat h/molnC6; temperature 550–650 °C.
Figure 5.
Conversion of n-hexane on (a) H-USY-0, (b) H-USY-1, (c) H-USY-2, and (d) H-Y at 550 (▼), 575 (▲), 600 (●), and 650 °C (■). Reaction conditions: catalyst 0.1 g; Pn-hexane = 9 kPa; W/FnC6,0 = 3.9 gcat h/molnC6; temperature 550–650 °C.

Figure 6.
Relative cracking activity, α = kV′/0.012 at 811 K, as a function of the mesopore volume.

Figure 7.
Arrhenius plot of the first-order rate constant, kV, for the catalytic cracking of n-hexane over H-Y and H-USY zeolites.
Figure 7.
Arrhenius plot of the first-order rate constant, kV, for the catalytic cracking of n-hexane over H-Y and H-USY zeolites.

Figure 8.
Thermochemical cycle showing the relation between the DPE and the apparent activation energy for alkane cracking over H-Z. Note that the cycle is not to scale as the DPE is much larger than the activation energy. An order of magnitude estimation of the different enthalpies/energies are (kJ/mol): ∆Hphys~45, Ea~200, DPE~1200, ∆HPA~700.


Table 1.
BET surface area, micropore, total pore, and mesopore volume obtained from N2 isotherm shown in Figure 2.
Table 1.
BET surface area, micropore, total pore, and mesopore volume obtained from N2 isotherm shown in Figure 2.
| Catalyst | SBET (m2/g) 1 | Vmicro (cm3/g) 2 | Vtotal (cm3/g) 3 | Vmeso (cm3/g) 4 |
|---|---|---|---|---|
| H-USY-0 | 869 ± 17 | 0.30 ± 0.03 | 0.45 ± 0.05 | 0.15 ± 0.02 |
| H-USY-1 | 827 ± 16 | 0.28 ± 0.03 | 0.50 ± 0.05 | 0.22 ± 0.02 |
| H-USY-2 | 709 ± 14 | 0.23 ± 0.02 | 0.55 ± 0.06 | 0.32 ± 0.03 |
| H-Y | 721 ± 15 | 0.26 ± 0.02 | 0.30 ± 0.04 | 0.04 ± 0.005 |
1 BET method (constant C positive and p/p0 < 0.1). 2 T-plot method. 3 Volume of N2 adsorbed at p/p0 = 0.90. 4 Difference between total and micropore volume.
Table 2.
Unit cell parameter, framework Si/Al ratio, and crystallinity obtained from XRD measurements.
Table 2.
Unit cell parameter, framework Si/Al ratio, and crystallinity obtained from XRD measurements.
| Catalyst | A0 (Å) | Si/Al 1 | Crystallinity (%) |
|---|---|---|---|
| H-USY-0 | 24.35 ± 0.02 | 13.6 | 100 |
| H-USY-1 | 24.32 ± 0.02 | 18.6 | 71 |
| H-USY-2 | 24.29 ± 0.02 | 29.0 | 25 |
| H-Y | 24.53 ± 0.02 | 2.9 | - |
1 Calculated with the Fichtner-Schmittler equation.
Table 3.
Elemental composition by ICP-OES and Si/Al ratio.
| Catalyst | Si (wt.%) | Al (wt.%) | Na (wt.%) | Si/Al 1 |
|---|---|---|---|---|
| H-USY-0 | 38.5 | 2.5 | 0.02 | 14.8 |
| H-USY-1 | 36.9 | 2.5 | 0.05 | 14.2 |
| H-USY-2 | 36.7 | 2.5 | 0.02 | 14.1 |
| H-Y | 25.1 | 9.7 | 1.60 | 2.5 |
1 Molar ratio from ICP-OES.
Table 4.
Pellet density, number of acid sites according to FT-IR study of adsorbed pyridine and enthalpy of physisorption by TAP.
Table 4.
Pellet density, number of acid sites according to FT-IR study of adsorbed pyridine and enthalpy of physisorption by TAP.
| Catalyst | Pellet Density (kg/m3) 1 | BAS (mol/m3) ((mmol/g)) | LAS (mol/m3) ((mmol/g)) | ΔHphys (kJ/mol) |
|---|---|---|---|---|
| H-USY-0 | 1311 | 367 (0.28) | 131 (0.10) | −39.3 ± 2 |
| H-USY-1 | 1231 | 283 (0.23) | 197 (0.16) | −39.3 ± 2 |
| H-USY-2 | 1159 | 151 (0.13) | 209 (0.18) | −42.2 ± 2 |
| H-Y | 1633 | 376 (0.23) | 294 (0.18) | −40.3 ± 2 |
1.
Table 5.
Characteristic mesitylene diffusion times from ZLC experiments.
| Catalyst | Temperature (°C) | (LD)2/D (ks) | Edif (kJ/mol) |
|---|---|---|---|
| 60 | 20 ± 4 | ||
| Na-USY-0 | 80 | 15 ± 3 | 17 ± 11 |
| 100 | 10 ± 2 | ||
| 60 | 14 ± 3 | ||
| Na-USY-1 | 80 | 9 ± 2 | 15 ± 9 |
| 100 | 8 ± 2 | ||
| 60 | 14 ± 3 | ||
| Na-USY-2 | 80 | 11 ± 3 | 15 ± 9 |
| 100 | 8 ± 2 | ||
| Na-Y | 60, 80, 100 | >100 | n.d. |
Table 6.
Estimated parameters with their 95% confidence interval for the regression of the conversion data for n-hexane cracking over H-Y.
Table 6.
Estimated parameters with their 95% confidence interval for the regression of the conversion data for n-hexane cracking over H-Y.
| Estimated Parameter | Value |
|---|---|
| Ea,app (kJ/mol) | 138.7 ± 5 |
| (LD)2/D (s) | 12.6 ± 10 |
Publisher’s Note: MDPI stays neutral with regard to jurisdictional claims in published maps and institutional affiliations. |
© 2021 by the authors. Licensee MDPI, Basel, Switzerland. This article is an open access article distributed under the terms and conditions of the Creative Commons Attribution (CC BY) license (https://creativecommons.org/licenses/by/4.0/).
Share and Cite
MDPI and ACS Style
Chapellière, Y.; Daniel, C.; Tuel, A.; Farrusseng, D.; Schuurman, Y. Kinetics of n-Hexane Cracking over Mesoporous HY Zeolites Based on Catalyst Descriptors. Catalysts 2021, 11, 652. https://doi.org/10.3390/catal11060652
AMA Style
Chapellière Y, Daniel C, Tuel A, Farrusseng D, Schuurman Y. Kinetics of n-Hexane Cracking over Mesoporous HY Zeolites Based on Catalyst Descriptors. Catalysts. 2021; 11(6):652. https://doi.org/10.3390/catal11060652
Chicago/Turabian StyleChapellière, Yann, Cécile Daniel, Alain Tuel, David Farrusseng, and Yves Schuurman. 2021. "Kinetics of n-Hexane Cracking over Mesoporous HY Zeolites Based on Catalyst Descriptors" Catalysts 11, no. 6: 652. https://doi.org/10.3390/catal11060652
Note that from the first issue of 2016, this journal uses article numbers instead of page numbers. See further details here.