
Synthesis of Novel Heteroleptic Oxothiolate Ni(II) Complexes and Evaluation of Their Catalytic Activity for Hydrogen Evolution


1
Inorganic Chemistry Laboratory, Department of Chemistry, National and Kapodistrian University of Athens, Panepistimiopolis, 15771 Zografou, Greece
2
Physics Laboratory, Department of Biotechnology, Agricultural University of Athens, 11855 Athens, Greece
*
Author to whom correspondence should be addressed.
Catalysts 2021, 11(3), 401; https://doi.org/10.3390/catal11030401
Submission received: 16 February 2021
/
Revised: 17 March 2021
/
Accepted: 18 March 2021
/
Published: 22 March 2021
(This article belongs to the Special Issue Catalytic Hydrogen Production, Storage and Application)
Abstract
:Two heteroleptic nickel oxothiolate complexes, namely [Ni(bpy)(mp)] (1) and [Ni(dmbpy)(mp)] (2), where mp = 2-hydroxythiophenol, bpy = 2,2′-bipyridine and dmbpy = 4,4′-dimethyl-2,2′-bipyridine were synthesized and characterized with various physical and spectroscopic methods. Complex 2 was further characterized by single crystal X-ray diffraction data. The complex crystallizes in the monoclinic P 21/c system and in its neutral form. The catalytic properties of both complexes for proton reduction were evaluated with photochemical and electrochemical studies. Two different in their nature photosensitizers, namely fluorescein and CdTe-TGA-coated quantum dots, were tested under various conditions. The role of the electron donating character of the methyl substituents was revealed in the light of the studies. Thus, catalyst 2 performs better than 1, reaching 39.1 TONs vs. 4.63 TONs in 3 h, respectively, in electrochemical experiments. In contrast, complex 1 is more photocatalytically active than 2, achieving a TON of over 6700 in 120 h of irradiation. This observed reverse catalytic activity suggests that HER mechanism follows different pathways in electrocatalysis and photocatalysis.
1. Introduction
Hydrogen is considered to be the cleanest and most sustainable fuel which does not emit CO2 upon combustion and is considered widely as the energy carrier of the future [1,2,3,4,5,6,7]. From the investigators’ point of view two tasks are of importance: firstly the fuel-to-electricity conversion efficiency in fuel cells [8], and secondly the synthesis of highly active solar-driven or electrochemically driven systems for hydrogen production from water [2,3,4,5,6,7,9,10]. The latter is driven by the bioinspired synthetic catalysts that mimic the hydrogenases [11,12,13] and nitrogenases [14,15] which are involved in reductive processes and are known to be rich with sulfur atoms coordinated to the metal centers [16]. The latter is the active site of [NiFe] hydrogenases as deduced from crystallographic studies consisting of a heterobimetallic (Scys)2-Ni(μ-Scys)2(μ-Χ)Fe(CO)(CN)2 (X = O2−, HO2−, OH−) [17,18,19,20,21,22,23]. Nickel’s coordination number and structure in hydrogenases depends on its oxidative state, from pseudotetrahedral in the reduced state to pseudosquare pyramidal in the oxidized state [24]. Moreover, the redox activity happens on the nickel site from Ni(III) to Ni(II), as far as no changes were observed in the oxidation state of Fe(II) [17,18,19,20,21,22,23]. Although many [NiII-Fe] biomimetic complexes were investigated and provided the scientific community with significant results [25,26,27,28,29,30], none was an efficient and spontaneous catalyst mainly because the catalytic center was located on Fe metal ion. Recently, Brazzolotto et al. reported a novel heterodinuclear NiFe complex that models the active site of [NiFe] hydrogenase. This complex indicates high catalytic rate of hydrogen evolution and is Ni-centered [31]. On the other hand, to enlarge scientists’ apprehension, a diversity of transition metal-based systems has been investigated [1,8,32,33,34,35]. In this context, a series of complexes with abundant [36,37] metal centers such as Fe [34], Ni [38,39], Cu [40,41] and Co [42,43] has been synthesized in order to replace expensive metals such as rhodium [44] and palladium as the metal center to well-known catalysts for hydrogen evolution [45,46,47]. The necessity for active, environmentally friendly and inexpensive catalysts has led scientists to engage various nickel complexes carrying non-innocent ligands as catalysts, as for example dithiolenes [9,39,48] and thiolates [48,49] complexes. Recently, some Fe—thiolate complexes were employed as hydrogen-evolving catalysts [50,51,52], whereas our group has published some heteroleptic and homoleptic Ni(II) [53] and Cu(I) [54] complexes carrying non-innocent ligand with S and N donor atoms. The latter plays a crucial role in the reduction of H+. To further exploit these results but also to investigate the role of electron-donating groups of the ligands in the catalytic activity of the complexes, we report, herein, the synthesis and characterization of two novel nickel complexes, namely [Ni(bpy)(mp)] (1) and [Ni(dmbpy)(mp)] (2), where mp = 2-hydroxythiophenol, bpy = 2,2′-bipyridine and dmbpy = 4,4′-dimethyl-2,2′-bipyridine (Figure 1). Their hydrogen-evolving activity was examined both by means of photochemical and electrochemical studies, with the latter to shed light on the mechanism of hydrogen evolution. In the photochemical systems, two different photosensitizers, namely fluorescein (Fl) and CdΤe quantum dots (QDs), were tested, both in a basic and acid environment.
2. Results and Discussion
2.1. Synthesis and Characterization
The synthesis of 1 and 2 was performed according to literature procedures for the mononuclear heteroleptic Ni(II) complexes with slight modifications and isolated as sole products [53,55,56,57,58,59]. The samples’ purities were confirmed by elemental analyses and high-resolution mass spectroscopy. The molecular structure of 2 was resolved by X-ray diffraction.
The IR spectra of 1 and 2 (Figure S1) display sharp bands at 630 cm−1 and 635 cm−1, respectively, corresponding to ρ (rocking out of plane) of the mp ligand [60]. The typical νC-S stretching frequencies are observed at 1048 and 762 cm−1 for 1 [39], and at 1074 and 758 cm−1 for 2 Ref [39,61]; whereas the torsion frequencies of C-C and C-N of the bipyridine ligands are displayed at 722 cm−1 and 731 cm−1 for 1 and 2, respectively [62]. The strong peaks in the region between 1650 cm−1 and 1300 cm−1 are due to the νC-C and νC-H of diimine ligands, suggesting their complexation to metal ion. The νNi-S and νNi-O stretching frequencies are usually observed under 450 cm−1; thus they are not displayed in the given IR spectra. The νC = C at 1438 cm−1 and 1460 cm−1 for complexes 1 and 2, respectively, are in accordance with the dianionic form of the mp ligand [60]. The IR spectra fully support the molecular structures given in Figure 1. The high resolution QToF electrospray mass spectra in positive mode in CH3CN show ion peaks at m/z 339,010 and at 367,011 for 1 and 2, respectively, and isotope distribution patterns (Figure S2a,b) which are in accordance with the proposed structure of both complexes. Figure 2 illustrates UV-Vis spectra of both complexes in DMF indicating three transitions for 1 and two for 2. The transition bands at 532 nm (ε = 2178 M−1cm−1) and 519 nm (ε = 4698 M−1cm−1) for compounds 1 and 2, respectively, are assigned as ligand-to-metal charge transfer (LMCT) indicating a rather high molar absorptivity compared to the homoleptic complexes. On the other hand, the absorption band at 920 nm (152 M−1cm−1) for 1 and at 1020 nm (87 M−1cm−1) for 2 is attributed to a ligand-to-ligand charge transfer (LLCT) transition, namely from mp ligand to bpy one [63,64]. Moreover, the CH3 substituents on bpy ligand cause a red shift to these LLCT bands (2 vs. 1), as has already been observed in dithiolene complexes [9,65,66]. A third band appeared at 1008 nm for complex 1 with ε = 77 M−1cm−1. The low molar absorptivity values of the LLCT bands further support the dianionic form of the mp ligand [48,67,68].
Interestingly, both complexes are stable under air conditions in DMF solutions for at least a period of 24 h, as shown by no changes in absorption spectra (Figures S3 and S4), in contrast to the homoleptic mononuclear [Ni(mp)2]− [48,69].
Single purple crystals of 2, suitable for X-ray structure characterization were grown by layering n-hexane onto a concentrated CH2Cl2 solution of the complex (Figure 3). Complex 2 crystallizes in the monoclinic P 21/c system. Selected bond lengths and bond angles of 2 are given below in Table 1.
The crystal structure of 2 displays the presence of neutral mononuclear moiety with square planar geometry around the metal center. The Ni1-O1 and Ni1-S1 bond distances are 1.834(4) Å and 2.1588(16) Å, respectively, and differ from the anionic forms of the homoleptic [Ni(mp)2] [48,70,71]. The C-C distances in oxothiophenolate (mp ligand) show a long-short alternation that was previously mentioned in thioquinone ligands [48,70,71]. Moreover, the 1.410 (7) Å C-C bond length is indicative of the dianion form of the 2-hydroxythiophenol ligand, in accordance with the neutral charge of the complex 2. Furthermore, the C13-S1 bond distance is longer than the corresponding one in the homoleptic [Ni(2-hydroxythiophenol)2] anion and dianion [48,70,71].
The two complexes are obtained in their neutral forms and their 1H NMR spectra in d6-DMSO exhibit sharp signals in the diamagnetic area (Figures S5 and S6). The observed downfield shift of the chemical signals of the complexes compared to the free ligands in the aromatic area of the spectra is in accordance with their coordination and the structure of complexes 1 and 2 (Table S1). Moreover, after complexation the 1H of methyl groups of ligand 4,4′-dimethyl-2,2′-bipyridine is upfield-shifted and observed at 2.47 ppm. On the free ligand this band is overlapped by DMSO one (at 2.6 ppm) [72]. On the contrary, the homoleptic monoanionic complex, namely [Ni(mp)2]− has been reported to be paramagnetic [48,56,57].
The electrochemical behavior of 1 and 2 was explored with cyclic voltammetry in dry DMF and CH3CN in the presence of n-Bu4NPF6 (0.1 M) as supporting electrolyte. Both complexes exhibit similar electrochemical behavior (Figure 4a,b), indicating a semi-reversible wave. This wave corresponds to the reduction of Ni(II)/Ni(I) and appeared at E1/2 = −1.82 V vs. Fc/Fc+ and E1/2 = −2.04 V vs. Fc/Fc+ in DMF and at E1/2 = −1.93 V vs. Fc/Fc+ and E1/2 = −2.21 V vs. Fc/Fc+ in CH3CN for 1 and 2, respectively [48]. The more negative values for this reduction of 1 (200 mV) and 2 (400 mV) relative to the homoleptic monoanionic complex, [Ni(mp)2]− reflect a higher electron density at the metal center and implies that complexes 1 and 2 are harder to be reduced than the corresponding homoleptic [48,73,74]. The subsequent oxidative waves that occur during the anodic scan are most likely due to byproducts of the 2-hydroxythiophenol ligand produced during the cathodic scan, as observed in the literature [75,76,77]. To further support that these byproducts only occur when going to very negative potentials, cyclic voltammograms from −2.17 V to 0 V for 1 and from −2.25 V to 0.10 V for 2 (vs. Fc/Fc+) (just after Ni(II)/Ni(I) potential) were obtained for both complexes. No anodic peaks appeared (Figure S7) except one at −0.8 V for complex 2. This peak also disappeared when cyclic voltammogram was obtained from −0.5 V to −1.7 V (just on the reduction process Ni(II)/Ni(I)).
Moreover, for elucidating if a second reduction process occurs for both complexes at −0.22 V, we performed square wave voltammetry in DMF (Figure S8) and only one main reduction process was observed attributed to Ni(II)/Ni(I) reduction. The hardly observed peak at −0.22 V (if true) can be attributed to the reduction of mp ligand [75] or the [Ni(bpy)(mp)]o/[Ni(bpy)(mp)]−1 reduction centered in mp ligand since the non-innocent character of mp ligand cannot be excluded and the diimine ligand can act as an electron reservoir [78].
2.2. Electrocatalytic Proton Reduction
Complexes 1 and 2 were examined with respect to their electrocatalytic activity towards proton reduction (Figure 5 and Figures S9–S16). Cyclic voltammograms were obtained in DMF solutions using 0.1 M n-Bu4NPF6 as supporting electrolyte, a glassy carbon as a working electrode, platinum wire as a counter electrode and Ag/Ag+ as a reference electrode. All the potentials in this study were given vs. Fc/Fc+ and trifluoroacetic acid was used as the proton source (pKa = 6.0 in DMF) [79].
For complex 1, continuous addition of 0 to 8 equivalents of trifluoroacetic acid resulted in the appearance and growth of a catalytic H2 wave. For both complexes, with low TFA concentrations, the catalytic wave appears on the top of the Ni(II)/Ni(I) couple (Figure 5a,b) with a Ecat/2 to be equal to −1.52 Vand −1.66 V for 1 and 2, respectively, indicating a proton-coupled electron transfer (PCET) process [80]. The Ecat/2 was measured at the middle of the catalytic waves for 1 mM TFA concentration. At higher TFA concentrations, the original catalytic waves shifted to more negative potentials, −2.02 V and −2.20 V for 1 and 2, respectively. In fact, in the case of complex 1, the catalytic wave grew after the reduction Ni(II)/Ni(I) process in high TFA concentration; a phenomenon that was not observed for catalyst 2. These differences indicate either an ECEC process for 1 (where E stands for an electron transfer and C for a chemical reaction) [9,39,81] or the new catalytic wave can be attributed to electrocatalytic hydrogen evolution by Ni(I)-H species; which is the catalyst and where 1 is a pro-catalyst [82]. Of course, physicochemical factors that affect the CVs, as already has been referred to by others, cannot be excluded [80]. Additionally, the reversibility of the (NiI/NiII) couple was lost upon addition of TFA, supporting the hypothesis that protonation takes place after the reduction of catalyst [64,83], especially at high TFA concentrations.
The observed inversion of currents (Figure 5) when going beyond −2.7 V could indicate the formation of a more active catalytic species for proton reduction. In fact, the second reduction process at about −2.5 V for 1 and −2.8 V for 2 could be attributed to Ni(I)/Ni(0) or more likely to a ligand-based reduction [(bpy•−)NiI(mp)]2− since mp ligand is already in its dianion form and Ni-bpy complexes are reduced at about −2.5 V. This current inversion was not observed when early return potentials were applied (Figure S10), indicating that the observed catalytic wave was not due to the formation of [(bpy•−)NiI(mp)]2− [84].
Bulk electrolysis experiments were performed to confirm the hydrogen evolution using a graphite rod as a working electrode at 1.66 V and at −1.74 V for catalyst 1 and 2, respectively. The evolved hydrogen was quantified by GC analysis and data are given in Table 2. The faradaic efficiencies at 58% and 73% for 1 and 2, respectively, were determined at the beginning and at the end of each experiment, indicating that the catalysts were rather stable during the electrocatalytic process. The overpotential of catalysts 1 and 2 was calculated at 0.58 V and 0.72 V, respectively, based on the formula η = |(Eref-Ecat/2)| [85], where Eref stands for the reduction potential of TFA in DMF and equals to −0.94 V [39]. Moreover, the linearity in the coulometry experiment that was performed vs. Fc/Fc+ in DMF solution with 10 mM TFA indicated that catalysts were stable (Figure S9).
To evaluate the catalytic activity of 1 and 2, analogous bulk electrolysis experiments were performed with solutions of the homoleptic [Ni(mp)2]−1 complex (Table 2). From these data, it is obvious that 2 is a better electrocatalyst, supporting the hypothesis that the electron density on the metal ion can be modulated by the electron donor affinity of the ligands.
Bulk electrolysis was performed for a 3 h period with catalyst concentrations [1] = 0.4 mM at −1.66 V, [2] = 0.2 mM at −1.74 V and [[Ni(mp2)]−] = 0.2 mM at −1.7 V. TONS and TOF were determined by bulk electrolysis experiments at a DMF solution (80 mL) containing 0.1 M n-Bu4NPF6.
To further elucidate the mechanism that takes place during electrocatalysis, cyclic voltammograms were conducted, keeping the TFA concentration constant at 40 mM in a solution of DMF with 0.1 n-Bu4NPF6 and at 100 mV/s scan rate. Addition of 0.6 to 2.4 mM of catalyst resulted in different action of the catalysts (Figures S10 and S11). The catalytic wave shifted at more positive potential for complex 1 and more negative for 2. Although their ic/ip were different (8.5 for 1 and 11.9 for 2), both depended linearly on the catalyst concentration, suggesting a first order dependence (Figures S10 and S11-inset) [86].
Moreover, scan rate dependent cyclic voltammograms of 1 and 2 recorded from 0.1 V/s to 1.2 V/s in DMF and Cottrell plots of peak currents versus the square root of scan rate (jc vs. v1/2) showed the linearity between ic/ip with v1/2 (Figures S12 and S13) [87], indicating the molecular nature of the catalysts [54,88,89]. The molecular structure of both catalysts was further documented by rinse tests (Figures S6 and S14) [39]. Thus, 3-step rinse test experiments were performed with the following procedure [39]: initially, a cyclic voltammogram was obtained in the presence of 12 mM TFA and the complex (black). Next, a linear sweep voltammetry experiment was performed from 0 V to −2.5 V because it had been reported that it can reveal the deposition of NiS in the glassy carbon electrode [90]. After that, the working electrode was rinsed with DMF and immersed again in a solution of TFA with no catalyst. Cyclic voltammetry was then conducted in order to examine whether the catalysis was due to the complexes in solution (red). Thus, the working electrode was poised for 3 min at a constant potential of −2 V vs. Fc/Fc+ and cyclic voltammetry was conducted (blue). The received cyclic voltammograms (Figure 6 and Figure S14) indicated a little enhancement of the catalytic wave in the absence of the catalysts. All the above results support the hypothesis that homogeneous catalysis occurs at the surface of the electrode, under the applied experimental conditions in this work. In addition, UV-Vis spectroscopy in the absence of applied current was used to monitor the stability of 1 and 2 upon increasing amounts of TFA. (Figures S15 and S16). As observed, the stability of LLCT absorption at ~1000 nm suggests that a ligand protonation is rather improbable, whilst the decrease of the MLCT band could be attributed to a protonation on the metal sites of 1 (or 2) in the ground state, supporting a CEC mechanism [9,39,80]. Moreover, as [(bpy•−)NiI(mp)]2− reduction takes place in more negative potentials than the catalytic wave for both complexes (vide supra) protonation on bpy moiety has to be excluded.
2.3. Photocatalytic Hydrogen Evolution
As both complexes were found to be active electrocatalysts, they were also tested for their catalytic action in light-driven hydrogen evolution photosystems. Thus, two different photosensitizers (PS) were used, namely CdTe quantum dots (QDs) coated by thioglycolic acid (TGA) in an aqueous medium (TGA-CdTe QDs) and fluorescein (Fl), in mixed solvent DMF:H2O and were illuminated with white LEDs (λ > 400 nm). Five well-known TGA-CdTe QDs were synthesized following literature methods [91], namely, QDs-A, QDs-B, QDs-C, QDs-D and QDs-E by controlling the reaction time of the synthetic route at 15 min, 30 min, 1 h, 3 h and 13 h, respectively. Their size was from 35 nm to 70 nm and their characterization was performed by comparing their UV-Vis and emission spectra with the literature ones [91]. The emission peaks of QDs shifted from 497 nm to 631 nm. Their absorption maxima in DMF: H2O are given in Table S2 and their emission spectra in Figure S17.
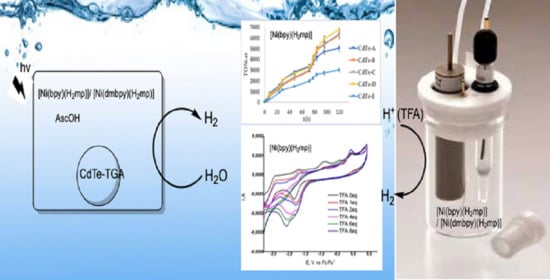
In the first set of the photocatalytic experiments containing TGA-QDs as PS and 1, 2 as catalysts with a solvent system of DMF:H2O (1:2), two different electron donors were added, triethanolamine (TEOA) at pH = 10.55 and ascorbic acid (AscOH) at pH = 4.5 and the obtained data are given in Tables S3 and S4, respectively. The given pHs refer to the final pH of the solution after the dissolution of the corresponding electron donor. The absorbance and emission spectra of QDs-TGA were also obtained after the addition of the TEOA or AscOH (Figures S18 and S19). As can be noticed, an increase in the fluorescence intensity of quantum dots with the addition of ascorbic acid took place, which may be due to its interaction with the coat of the QDs, namely, the thiolyglycolic acid. The differently sized CdTe-QDs were evaluated, keeping the ratio of the solvents and the concentrations of QDs and catalysts unchanged. When TEOA was used as electron donor, the highest TONCat was 967 obtained for QDs-A for complex 1 and 103 obtained for QDs-E for complex 2 (Tables S3 and S4, Figures S20 and S21). Replacing TEOA by AscOH, the amount of evolved hydrogen was impressively increased for both complexes under the same conditions with 6781 and 4057 TONcat for complex 1 and 2, respectively (Figure 7 and Figure 8). Moreover, the QDs with the smallest size except for QDs-E, in a system with catalyst 1, had the lowest catalytic activity revealing the catalytic activity and size relation due to a reduced surface charge density [92,93]. It is worth noticing that in all cases, when QDs are used as photosensitizer, there is an increase of the catalytic activity at around 24 and 80 h. This observation, if it is not a systematic error, is difficult to be explained, especially since the received UV-Vis spectra indicate that the system is rather stable after 120 h of irradiation (Figures S22 and S23).
The TGA CdTe-QDs system was evaluated in terms of the catalysts’ concentration from 10−4 to 10−6 with the best results to be taken for 5 × 10⁻⁶ M of both the catalysts. Unfortunately, higher concentrations could not be used for solubility reasons. Furthermore, the electron donor’s concentrations (AscOH and TEOA) seemed not to affect the catalytic activity of the systems (Tables S3 and S4).
For comparing the catalytic performance of 1 and 2 with the similar homoleptic Ni complexes [48], a second set of photocatalytic experiments were conducted. This time, fluorescein (Fl) was used as PS and TEOA as a sacrificial electron donor at pH = 10.55. The optimized concentrations of 1 and 2, PS and TEOA, together with the mixed solvent ratios, TONs and TOFs, are summarized in Tables S5–S8. Under optimal conditions, H2 was efficiently evolved, achieving a maximum of 4697 TONcat and 195.7 h−1 TOF for complex 1 and 1705.3 TONcat and 71 h−1 TOF for 2 after 24 h of irradiation (Tables S5–S8). Under the same conditions, the homoleptic complex of [Ni(mp)2]− achieved about 1450 TON in 24 h when Fl was used as photosensitizer and TEOA as electron donor. Further, when QDs-TGA-B were used as PS, the homoleptic complex [Ni(mp)2]− as catalyst and AscOH as electron donor, about 3841 TONs were achieved in 120 h (Table S9). These data fully support the hypothesis that the heteroleptic complexes 1 and 2 are more efficient catalysts for the light-driven HER. Furthermore, 1 and 2 are more active catalysts compared to the neutral heteroleptic [Ni(2-amnt)(3,4-daba)], where 3,4-daba = 3,4-diamino benzoic acid and 2-amnt = o-aminobenzenethiolate (2-amnt)) that acts as a molecular homogeneous catalyst reaching at 834 TONs in a similar system [53]. A series of controlled experiments were performed in order to confirm that light-driven evolved hydrogen is due to the presence of the catalysts 1 and 2. Thus, under the same experimental conditions as above, a series of solutions in DMF/H2O with no catalyst were illuminated (λ > 400 nm). These solutions were: (i) NiCl2 hexahydrate in the presence of fluorescein with TEOA, (ii) CdTe QDs with TEOA and (iii) CdTe QDs with AscOH. The same experiments were also performed in the dark (Table S10). In neither experiment was evolved hydrogen identified by used GC methods.
The long-term stability of the catalytic systems was tested not only by the produced hydrogen but also by receiving the UV-Vis spectra of the photocatalytic systems before and after illumination for 120 h (Figures S22 and S23) The MLCT bands were almost the same, indicating the stability of the catalyst under the experimental conditions.
Additionally, mercury poisoning test was engaged to check whether colloidal Ni was formed during irradiation and acted as the catalyst for hydrogen evolution [33]. Addition of Hg had no upshot on the catalytic systems (Table S8 entries 5,6,11,12) designating that the complexes acted as molecular catalysts.
Although complex 2 is a better electrocatalyst than 1, not only by means of more TOFs but also for the higher Faradaic efficiency, it is obvious from the obtained data that 1 is the best catalyst in the light-driven reactions. Probably this is due to the electron-donating methyl groups that drew electron density towards Ni atom and as a consequence incommoded its reduction by Fl. In addition, this difference in catalytic activity between electrocatalysis and photocatalysis may be stressed by kinetic factors as the duration of the catalytic experiments differ [94].
The quenching of the excited Fl* by both catalysts and the received quenching constants by Stern–Volmer analysis (equals to 4.04 × 10² M−1 and 2.87 × 10² M−1 for 1 and 2, respectively) indicate that the excited chromophore provides the potential needed for their reduction (Figures S24 and S25). In fact, the Ksv values indicate that this reduction is more favorable for complex 1. However, as the electron donors concentration is 5 orders of magnitude higher than the concentration of the catalysts, the reductive quenching must predominate. This is in accordance with previous studies [95].
From all the above-given data, it seems that the photocatalytic process follows an electron–chemical mechanism (ECEC), where C corresponds to protonation. Thus, protonation takes place after catalyst’s reduction from Fl−, a path that is thermodynamically more favorable for catalyst 1, since it owns the less negative potential. At this point, the role of the non-innocent character of the mp ligand has to be taken into consideration as well as the capability of bpy ligand to act as an electron reservoir. This could suggest a ligand protonation process. To get more insight into the electrocatalytic and photocatalytic mechanisms, DFT calculations are under investigation for the heteroleptic complexes 1 and 2 and the homoleptic analogous complexes.
3. Materials and Methods
3.1. General Information
Standard Schlenk techniques under argon were used, unless indicated otherwise. All starting materials and solvents were commercially available (Sigma Aldrich (Darmstadt, Germany), Merck (Darmstadt, Germany), Alfa Aesar (Heysham, Lancashire, UK) and Panreac Applichem (Barcelona, Spain)) at analytical grade and of spectroscopic grade for absorption and emission spectra; N,N-dimethyl formamide was purified and dried for the electrochemical techniques [96]. Water was of Milli-Q grade. TGA-CdTe QDs were prepared as reported previously [91] and the A-E notation in Table S3 refers to the refluxing time.
A double beam Shimadzu UV1900 UV-Vis Spectrometer (Shimadzu, Hesse, Germany) at 25 °C was used for absorption spectra. IR spectra in KBr pellets were recorded with a 2.0 cm−1 resolution using a Shimadzu IR Affinity-1 (Shimadzu, Hesse, Germany). Elemental analyses were conducted on a Perkin-Elmer model 240 C elemental analyzer (Instabul, Turkey). 1H NMR spectra were measured on a Bruker 400 NMR (Leipzig, Germany). High-resolution mass spectrometry were received in Q-ToF electrospray (Maxis Impact, Bruker Daltonics) (Leipzig, Germany) and were analyzed with mass accuracy of <5 mDa and identification with the theoretical isotopic profile <200 mSigma.
3.2. Synthesis
Synthesis of complex 1: The synthesis is a modification for the homoleptic complexes [59,97]. A warmed ethanolic solution of NiCl2.6H2O (2.37 g, 10 mmol) was added dropwise to a 50 mL ethanolic solution of 2,2′-bipyridine (1.56 g, 10 mmol). The color of the mixture turned to light blue after an hour of stirring, and a microcrystalline solid precipitate emerged. The latter was filtered, washed with ethanol (20 mL), and dried under vacuum. A suspension of the obtained [Ni(2,2′-bipyridine)]Cl2 (0.57 g, 2 mmol) in 120 mL sonicated ethanolic solution was mixed with an aqua solution of 2-hydroxythiophenol (0.25 g, 2 mmol) and KOH (0.22 g, 4 mmol), and was stirred for 3 h. The resulting reddish-brown precipitate was filtered and washed with 10 mL of ethanol. The yield was 72%. Anal. Calcd for C16 H12 N2 Ni O S: C, 56.68%; H, 3.57%; N, 8.26%; S, 9.46%. Found: C, 56.34%; H, 3.52%; N, 8.41%; S, 9.32%. FT-IR peaks KBr: 1048 (s, νC-S), 762 (s, νC-S), 722 (φ, C-C and C-N), 630 (ρ, mp ring). NMR peaks DMSO-d6: δ(multiplicity, coupling constants, integral), ppm 6.27 (t, 3JH-H = 7.17 Hz, 1 H), 6.35 (d, 3JH-H = 7.89 Hz, 1 H), 6.56 (t, 3JH-H= 7.26 Hz, 1 H), 6.91 (d, 3JH-H = 7.34 Hz, 1 H), 7.45 (t, 3JH-H = 5.80 Hz, 1 H), 7.69 (t, 3JH-H = 6.29 Hz, 1 H), 7.95 (t, 3JH-H = 7.40 Hz, 1 H), 8.24 (t, 3JH-H = 7.59 Hz, 1 H), 8.41 (m, 3JH-H = 7.78 Hz, 2 H), 8.55 (d, 3JH-H = 4.55 Hz, 1 H), 8.70 (d, 3JH-H = 3.79 Hz, 1 H). ESI, positive in CH3CN, m/z: theoretically calculated: 339.009, found: 339.0109.
Synthesis of complex 2: The synthetic route is the same as above. The ethanolic solution of NiCl2.6H2O (2.37 g, 10 mmol) was mixed and stirred with a 50 mL ethanolic solution of 4,4′-dimethyl-2,2′-bipyridine (1.84 g, 10 mmol). The obtained [Ni(4,4′-dimethyl-2,2′-bipyridine)]Cl2 (0.73 g, 2 mmol) was mixed with an aqueous solution of 2-hydroxythiophenol (0.25 g, 2 mmol) and KOH (0.22 g, 4 mmol), and was stirred for 3 h. The resulting purple precipitate was filtered and washed with 20 mL of ethanol. Crystals of 2 suitable for X-ray crystallography were grown by layering a dichloromethane solution with n-hexane. The yield was 78%. Anal. Calcd for C18 H16 N2 Ni O S: C, 58.89%; H, 4.39%; N, 7.63%; S, 8.73%. Found: C, 58.74%; H, 4.12%; N, 7.64%; S, 8.78%. FT-IR peaks KBr: 1050 (s, νC-S), 758 (s, νC-S), 731 (φ, C-C and C-N), 635 (ρ, mp ring) NMR peaks DMSO-d6: δ(multiplicity, coupling constants, integral), ppm 2.47 (s, 6 H), 6.25 (t, 3JH-H = 7.31 Hz, 1 H), 6.31 (d, 3JH-H = 7.95 Hz, 1 H), 6.54 (t, 3JH-H = 7.53 Hz, 1 H), 6.88 (d, 3JH-H = 7.42 Hz, 1 H), 7.51 (d, 3JH-H = 7.54 Hz, 2 H), 8.26 (d, 3JH-H = 8.18 Hz, 2 H), 8.31 (s, 2H). ESI, positive in CH3CN, m/z m/z: theoretically calculated: 367.0409, found: 367.0425.
Synthesis of TGA-coated CdTe QD’s [91]: Ιn a stand-up flask, a molar ratio of Cd2+/TGA/TeO32− 1:1:0.2 in pH = 10.5. (0.2 mmol, 0.53 g) Cd(CH3COO)2*2H2O was dissolved into 50 mL distilled water. After adding TGA (0.2 mmol, 15 μL), the pH was adjusted to 10.5 with 1 M NaOH. The resulting solution was stirred for 5 min before the addition of K2TeO3 (0.04 mmol, 0.15 g) dissolved in 50 mL distilled water. Next, 80 mg NaBH4 was added and the solution was stirred for 5 min more, before starting to reflux at 100 °C under air. Through controlling the reaction time, CdTe QDs with desired PL emission spectra can be obtained. A = 15 min, B = 30 min, C= 1 h, D = 3 h, E = 13 h. The synthesized QD’s were controlled by their emission spectra which compare well with the literature with no further measurements.
3.3. Cyclic Voltammetry
A VersaSTAT 3 Potentiostat Galvanostat (Houten, Netherlands) and the VersaSTAT software were used for the cyclic voltammetry (CV) measurements. The CV measurements were received using a three-electrode single-compartment cell with a glassy carbon working electrode, Ag/AgCl reference electrode and Pt counter-electrode at room temperature and under N2. The used solvent was N, N-dimethylformamide (DMF) in the presence of 0.1 M tetrabutylammonium hexafluorophosphate (n-Bu4NPF6) as a supporting electrolyte. Ferrocenium/ferrocene (Fc+/Fc) redox couple was used as an internal potential reference. A 12.85 M stock solution of TFA was prepared in DMF with 0.1 M n-Bu4NPF6 for the acid concentration dependence studies. The latter were performed using a stirred and degassed solution of 1 mM catalyst and 3–10 μL aliquots of the stock solution. Bulk electrolysis and chronocoulometry experiments were conducted in a gastight 140 mL flask using the same potentiostat as before. Complex 1 (C = 0.4 mM) was added to 80 mL of 0.1 M n-Bu4NPF6 and 10 mM TFA in DMF. A graphite rod was used as working electrode, Ag/AgCl as a reference electrode and Pt as a counter-electrode at room temperature. The latter was separated from the working electrode by a glass frit. The flask was degassed by Ar for 20 min. Using a Hamilton gas tight syringe, an amount of the gas mixture in the headspace was removed in certain periods and injected into the GC (Bruker, Karlsruhe, Germany). The produced hydrogen was quantified through the curve fitted to the H2 volume vs. the area of GS peak.
3.4. X-ray Crystallography
A purple prism specimen was used for single-crystal X-ray diffraction data collection. The crystal, mounted on a cryoloop, was cryoprotected in paraffin oil, and an Oxford Cryosystems low-temperature device (Cryostream 800) was used for flash-freezing it in a nitrogen gas stream at 120(2) K. Intensity data were collected on a Bruker D8-VENTURE diffractometer (Leipzig, Germany), using a Cu Kα radiation (λ = 1.54178 Å). The SAINT program (Madison, WI, USA) [98] was used for data collection and integration and absorption effects were corrected using the Multi-Scan method (SADABS) [99] within the Bruker APEX 3 suite. SHELXT [100] was used for solving the structure by the intrinsic phasing method and it was refined by full-matrix least-squares against F2 using SHELXL-2014/7 [101] through the SHELXLE GUI [102]. Details are given in Table 3. The crystallographic information file with embedded structure factors has been deposited into the Cambridge Structural Database (CSD) under the deposition number CCDC: 2024839.
3.5. Photocatalysis
A typical photocatalytic experiment was performed as follows: a mixture of a photosensitizer, TEOA and the catalyst was dissolved in various analogies of DMF: H2O of 10 mL total volume. The solution was in a 15 mL vial and after being degassed by argon bubbling for 20 min, was sealed with an airtight rubber septum. Two VT 4922 visible-light LEDs (λ > 400 nm) at 20 mV, each one of them was used for the irradiation of the solution. The latter was magnetically stirred and maintained at 25 °C during irradiation for at least 72 h (unless otherwise stated). A HAMILTON gas tight syringes 1700 series was used for the collection of the gas in the top-space of the vessels. The produced hydrogen was analyzed into a Bruker’s 430-GC gas chromatograph carrying a thermal conductivity detector (TCD) and a 5 Å molecular sieves column. The GC was operated under the following conditions: carrier gas: nitrogen, oven temperature 70 °C, detector temperature 150 °C, injector temperature 80 °C. Varian’s Galaxie software was used for the analysis of the chromatograms whereas the quantitative analysis of the evolved hydrogen was performed by an external standard method, described before from our Lab [95]. In brief, calibration for quantitative analysis of hydrogen was performed by diluting known volumes of pure hydrogen in a vial used in our photosystems, which contained the same volume of DMF:H2O as in photocatalytic experiments. The calculation of the produced hydrogen was performed through the curve fitted to the H2 volume vs. the area of GS peak.
4. Conclusions
In this study, we presented the synthesis and characterization of two nickel heteroleptic complexes, namely [Ni(bpy)(mp)] (1) and [Ni(dmbpy)(mp)] (2), by modifying literature procedure. Complex 2 was characterized by X-ray diffraction studies. Both compounds were employed as electrocatalysts in DMF media with TFA resulting in 1.5 h−1 TOF and 13.1 h−1 TOF for 1 and 2, respectively. Electrochemical studies showed that a possible PCET process took place for hydrogen evolution for both complexes at least in low concentration of TFA. In higher TFA concentration the two catalysts behaved in a different way, with complex 1 preferring an ECEC mechanism. Both complexes 1 and 2 acted as homogeneous molecular catalysts for light-driven hydrogen evolution. Their activity depended on the used photosensitizers and electron donors. Their highest efficiency was achieved by using TGA-coated CdTe QDs as PS, reaching 6781 TONs. The methyl substituents on the bpy moiety affected the catalytic activity of the complexes, with the non-substituent complex (1) the most active catalyst in the photocatalytic systems. The latter suggests a different mechanism, namely ECEC, for the photocatalytic process for both complexes. For comparison reasons, the homoleptic [Ni(mp)2]− was synthesized and tested under the same experimental conditions. The received data reveal that this complex was a less active catalyst for light-driven hydrogen evolution reaction. The experiments indicated that heteroleptic complexes are a promising group of compounds, acting as molecular catalysts for photocatalytic and electrocatalytic hydrogen evolution. An extensive DFT study is underway in order to fully understand the mechanistic pathway for HER both for electrocatalysis and photocatalysis for these complexes as well as for the homoleptic [Ni(mp)2]− complex. The role of the donating ability of the ligands has to be revealed for a rational design of new catalysts for HER.
Supplementary Materials
The following are available online at https://www.mdpi.com/2073-4344/11/3/401/s1; Figure S1: IR spectra of complexes 1 and 2; Figure S2: a. HRMS of the Complex 1. b. Compass IsotopePattern window of Complex 1. Figure S2a,b display the mass spectrum of the ions on which the identification of 1 was performed. Also, the theoretical mass spectrum (in green color) of the desired m/z and its isotopes were depicted (Figure S2b). At the Compass Isotope Pattern window, the theoretical mass spectrum and isotope profile of that compound. c. HRMS of the Complex 2. d. Compass IsotopePattern window of Complex 2. Figure S2c,d display the mass spectrum of the ions on which the identification of 2 was performed. Also, the theoretical mass spectrum (in green color) of the desired m/z and its isotopes were depicted (Figure S2d). At the Compass Isotope Pattern window, the theoretical mass spectrum and isotope profile of that compound.; Figure S3: Spectroscopical study of complex 1 in DMF via the use of UV-Vis spectra without irradiation; Figure S4: Spectroscopical study of complex 2 in DMF via the use of UV-Vis spectra without irradiation; Figure S5: 1H-NMR spectrum of complex 1 in Dimethyl Sulphoxide-d6; Figure S6: 1H-NMR spectrum of complex 2 in Dimethyl Sulphoxide-d6; Figure S7: Cyclic voltammograms of a. 1 (10−3 M) in DMF (black) and b. 2 (10−3 M) in DMF (red), 0.1 M n-Bu4NPF6, a glassy carbon as a working electrode, an Ag/AgCl as a reference electrode and a Pt wire as a counter electrode. The scan rate was 100 mV/s.; Figure S8: Square wave Voltammetry in DMF of complex 1 (black) and complex 2 (red), with 0.1 M n-Bu4NPF6, a glassy carbon as a working electrode, an Ag/AgCl as a reference electrode and a Pt wire as a counter electrode. Pulse amplitude 50 mV, step potential 20 mV; Figure S9: Chronocoulometry for bulk electrolysis vs. Fc/Fc+ of DMF solution with 10 mM TFA, with complex 1 at −1.66 V (black), with complex 2 at −1.74 V (blue) and with the absence of catalysts at −1.74 V (red). 0.1 M n-Bu4NPF6, a graphite rod as a working electrode, an Ag/AgCl as a reference electrode and a Pt wire as a counter electrode was used; Figure S10: CVs in DMF with 0.1 M n-Bu4NPF6 containing 40 mM TFA with 0.6 mM 1 (black), 1.2 mM 1 (red), 1.8 mM 1 (blue), and 2.4 mM 1 (pink) at u = 100 mV/s. Inset ic/ip = f[1]; Figure S11: CVs in DMF with 0.1 M n-Bu4NPF6 containing 40 mM TFA with 0.6 mM 2 (black), 1.2 mM 2 (red), 1.8 mM 2 (blue), and 2.4 mM 2 (pink) at u = 100 mV/s. Inset ic/ip = f[2]; Figure S12: Scan rate dependent cyclic voltammograms of catalyst 1 recorded from 0.1 V/s to 1.2 V/s in DMF and Cottrell plots of peak current versus the square root of scan rate. CVs were collected in DMF with 0.1 M n-Bu4NPF6 as supp. electrolyte using a glassy carbon (work elec.), platinum wire (count elec.) and Ag/Ag+ (ref. elec.). All the potentials were referenced vs. Fc/Fc+; Figure S13: Scan rate dependent cyclic voltammograms of catalyst 2 recorded from 0.1 V/s to 1.2 V/s in DMF and Cottrell plots of peak current versus the square root of scan rate. CVs were collected in DMF with 0.1 M n-Bu4NPF6 as supp. electrolyte using a glassy carbon (work elec.), platinum wire (count elec.) and Ag/Ag+ (ref. elec.). All the potentials were referenced vs. Fc/Fc+; Figure S14: Rinse tests for 2 in the presence of 12 mM of TFA: (black) cyclic voltammogram in the presence of catalyst (10−3 M) (red) cyclic voltammogram in the absence of catalyst vs. Fc/Fc+ after linear sweep voltammetry, (blue) cyclic voltammogram in the absence of catalyst vs. Fc/Fc+ after 3 min potential application (glassy carbon working electrode); Figure S15: UV-Vis spectrum of the complex 1 (10−3 M) in DMF with addition of TFA 0–1eq; Figure S16: UV-Vis spectrum of the complex 2 (10−3 M) in DMF with addition of TFA 0–0.8 eq.; Figure S17: Emmision spectra of CdTe-QDs TGA coated in H2O. QD-A (black), QD-B (red), QD-C (blue), QD-D (pink), QD-E (deep blue); Figure S18: UV-Vis spectra of CdTe-QD A in DMF/H2O 1:2 without an electron donor (black), with AscOH 0.5 M (red), with TEOA 0.5 M (blue); Figure S19: Emission spectra of CdTe-QD C in DMF/H2O 1:2 without an electron donor (black), with TEOA 0.5 M (red), with AscOH 0.5 M (blue); Figure S20: Light-driven hydrogen production from a system containing complex 1 at 5 × 10⁻⁶ M, TEOA (0.5 M) in DMF: H2O 1:2 at pH 4.5 with different sized TGA-coated CdTe QDs at 40.0 μM A (blue), B (red), C (green), D (purple), Ε (light blue), F (orange) upon irradiation for 120 h at 25 °C and 1 atm; Figure S21: Light-driven hydrogen production from a system containing complex 1 at 5 × 10⁻⁶ M, TEOA (0.5 M) in DMF: H2O 1:2 at pH 4.5 with different sized TGA-coated CdTe QDs at 40.0 μM A (blue), B (red), C (green), D (purple), Ε (light blue), F (orange) upon irradiation for 120 h at 25 °C and 1 atm; Figure S22: UV-Vis spectra of complex 1 (10−4 M) in DMF: H2O 1:2 with CdTe QDs-C 40 μM and AscOH 0.1 M, t = 0 h (black), t = 48 h (red), t = 120 h (purple); Figure S23: UV-Vis spectra of complex 2 (10−4 M) in DMF: H2O 1:2 with CdTe QDs-C 40 μM and AscOH 0.1 M, t = 0 h (black), t = 48 h (red), t = 120 h (purple); Figure S24: Emmision spectra of Fluorescein (0.3 mM) in DMF/H2O 1:2 (black)and with the addition of 1–8 eq. of complex 1; Figure S25: Emmision spectra of Fluorescein (0.3 mM) in DMF/H2O 1:2 (black) and with the addition of 1–10 eq. of complex 2; Figure S26. Cyclic voltammograms of 2 (10−3 M) in DMF (black) with the Multiple Cycle scan method and 2 (10−3 M) in DMF (red) with the Single Scan method, with 0.1 M n-Bu4NPF6, a glassy carbon as a working electrode, an Ag/AgCl as a reference electrode and a Pt wire as a counter electrode. The scan rate was 100 mV/s; Table S1: 1H-NMR shift sin ppm for 1, 2 and the free ligands; Table S2: Absorption maxima of CdTe-QDs TGA coated in DMF: H2O 1:2; Table S3: Study of the photocatalytic hydrogen production via the use of Complex 1 with CdTe QDs TGA coated as PS, TEOA and AscOH as electron donor, in a solvent system DMF: H2O; Table S4: Study of the photocatalytic hydrogen production via the use of Complex 2 with CdTe QDs TGA coated as PS, TEOA and AscOH as electron donor, in a solvent system DMF: H2O; Table S5: Study of the photocatalytic hydrogen production via the use of Complex 1 and 2 with different concentrations of the complexes with fluorescein as PS, TEOA as electron donor in a solvent system DMF: H2O; Table S6: Study of the photocatalytic hydrogen production via the use of Complex 1 and 2 with fluorescein as PS with different concentrations of Fl, TEOA as electron donor in a solvent system DMF: H2O; Table S7: Study of the photocatalytic hydrogen production via the use of Complex 1 and 2 with fluorescein as PS, TEOA as electron donor with different concentrations of TEOA, in a solvent system DMF:H2O; Table S8: Study of the photocatalytic hydrogen production via the use of Complex 1 and 2 with fluorescein as PS, TEOA as electron donor, in a solvent system DMF: H2O with different solvent ratios and with additions to the photocatalytic system; Table S9: Study of the photocatalytic hydrogen production via the use of Complex [Ni(mp2)]−; Table S10: Control Experiments.
Author Contributions
Conceptualization, C.A.M.; methodology, F.K., C.A.M.; synthesis, F.K.; photocatalytic experiments, F.K.; electrocatalytic experiments, F.K.; Single crystal X-ray crystallography, K.B.; data curation, F.K.; writing—review and editing, F.K., C.A.M.; supervision, C.A.M.; project administration, C.A.M. All authors have read and agreed to the published version of the manuscript.
Funding
Special Research Account of NKUA (No: 16672), Operational Programme «Human Resources Development, Education and Lifelong Learning» in the context of the project “Strengthening Human Resources Research Potential via Doctorate Research” (MIS-5000432), implemented by the State Scholarships Foundation (IKΥ).
Acknowledgments
We gratefully acknowledge financial support from the Special Research Account of NKUA (No: 16672). F.K. thanks the co-funding by Greece and the European Union (European Social Fund—ESF) through the Operational Programme «Human Resources Development, Education and Lifelong Learning» in the context of the project “Strengthening Human Resources Research Potential via Doctorate Research” (MIS-5000432), implemented by the State Scholarships Foundation (IKΥ). The authors would also like to thank the Laboratory of Analytical Chemistry, Chemistry Department of NKUA, candidate Georgios O. Gkotsis and Nikolaos Thomaidis for their contribution to the HRMS techniques.
Conflicts of Interest
The authors declare no conflict of interest.
References
- Koshiba, K.; Yamauchi, K.; Sakai, K. Ligand-Based PCET Reduction in a Heteroleptic Ni(bpy)(dithiolene) Electrocatalyst Giving Rise to Higher Metal Basicity Required for Hydrogen Evolution. ChemElectroChem 2019, 6, 2273–2281. [Google Scholar] [CrossRef]
- Kudo, A.; Miseki, Y. Heterogeneous Photocatalyst Materials for Water Splitting. Chem. Soc. Rev. 2009, 38, 253–278. [Google Scholar] [CrossRef]
- Reece, S.Y.; Hamel, J.A.; Sung, K.; Jarvi, T.D.; Esswein, A.J.; Pijpers, J.J.; Nocera, D.G. Wireless Solar Water Splitting Using Silicon-Based Semiconductors and Earth-Abundant Catalysts. Science 2011, 334, 645–648. [Google Scholar] [CrossRef] [Green Version]
- Hisatomi, T.; Kubota, J.; Domen, K. Recent advances in semiconductors for photocatalytic and photoelectrochemical water splitting. Chem. Soc. Rev. 2014, 43, 7520–7535. [Google Scholar] [CrossRef]
- Swierk, J.R.; Mallouk, T.E. Design and development of photoanodes for water-splitting dye-sensitized photoelectrochemical cells. Chem. Soc. Rev. 2013, 42, 2357–2387. [Google Scholar] [CrossRef]
- Esswein, A.J.; Nocera, D.G. Hydrogen Production by Molecular Photocatalysis. Chem. Rev. 2007, 107, 4022–4047. [Google Scholar] [CrossRef] [PubMed]
- Brudvig, G.W.; Reek, J.N.H.; Sakai, K.; Spiccia, L.; Sun, L. Catalytic Systems for Water Splitting. ChemPlusChem 2016, 81, 1017–1019. [Google Scholar] [CrossRef] [PubMed] [Green Version]
- Wang, Y.; Chen, K.S.; Mishler, J.; Cho, S.C.; Adroher, X.C. A review of polymer electrolyte membrane fuel cells: Technology, applications, and needs on fundamental research. Appl. Energy 2011, 88, 981–1007. [Google Scholar] [CrossRef] [Green Version]
- Drosou, M.; Kamatsos, F.; Mitsopoulou, C.A. Recent advances in the mechanisms of the hydrogen evolution reaction by non-innocent sulfur-coordinating metal complexes. Inorg. Chem. Front. 2019, 7, 37–71. [Google Scholar] [CrossRef] [Green Version]
- Zarkadoulas, A.; Koutsouri, E.; Mitsopoulou, C.A. A perspective on solar energy conversion and water photosplitting by dithiolene complexes. Coord. Chem. Rev. 2012, 256, 2424–2434. [Google Scholar] [CrossRef]
- Frey, M. Hydrogenases: Hydrogen-Activating Enzymes. ChemBioChem 2002, 3, 153–160. [Google Scholar] [CrossRef]
- Vincent, K.A.; Parkin, A.; Armstrong, F.A. Investigating and Exploiting the Electrocatalytic Properties of Hydrogenases. Chem. Rev. 2007, 107, 4366–4413. [Google Scholar] [CrossRef] [PubMed]
- Lubitz, W.; Ogata, H.; Rüdiger, O.; Reijerse, E. Hydrogenases. Chem. Rev. 2014, 114, 4081–4148. [Google Scholar] [CrossRef]
- Kaiser, J.T.; Hu, Y.; Wiig, J.A.; Rees, D.C.; Ribbe, M.W. Structure of Precursor-Bound NifEN: A Nitrogenase FeMo Cofactor Maturase/Insertase. Science 2011, 331, 91–94. [Google Scholar] [CrossRef] [PubMed] [Green Version]
- Spatzal, T.; Aksoyoglu, M.; Zhang, L.; Andrade, S.L.A.; Schleicher, E.; Weber, S.; Rees, D.C.; Einsle, O. Evidence for Interstitial Carbon in Nitrogenase FeMo Cofactor. Science 2011, 334, 940. [Google Scholar] [CrossRef] [Green Version]
- Lu, Y.; Koo, J. O2 sensitivity and H2 production activity of hydrogenases—A review. Biotechnol. Bioeng. 2019, 116, 3124–3135. [Google Scholar] [CrossRef]
- Volbeda, A.; Garcin, E.; Piras, C.; De Lacey, A.L.; Fernandez, V.M.; Hatchikian, E.C.; Frey, M.; Fontecilla-Camps, J.C. Structure of the [NiFe] Hydrogenase Active Site: Evidence for Biologically Uncommon Fe Ligands. J. Am. Chem. Soc. 1996, 118, 12989–12996. [Google Scholar] [CrossRef]
- Volbeda, A.; Charon, M.-H.; Piras, C.; Hatchikian, E.C.; Frey, M.; Fontecilla-Camps, J.C. Crystal structure of the nickel-iron hydrogenase from Desulfovibrio gigas. Nature 1995, 373, 580–587. [Google Scholar] [CrossRef]
- Higuchi, Y.; Yagi, T.; Yasuoka, N. Unusual ligand structure in Ni–Fe active center and an additional Mg site in hydrogenase revealed by high resolution X-ray structure analysis. Structure 1997, 5, 1671–1680. [Google Scholar] [CrossRef] [Green Version]
- Higuchi, Y.; Ogata, H.; Miki, K.; Yasuoka, N.; Yagi, T. Removal of the bridging ligand atom at the Ni-Fe active site of [NiFe] hydrogenase upon reduction with H2, as revealed by X-ray structure analysis at 1.4 Å resolution. Structure 1999, 7, 549–556. [Google Scholar] [CrossRef]
- Rousset, M.; Montet, Y.; Guigliarelli, B.; Forget, N.; Asso, M.; Bertrand, P.; Fontecilla-Camps, J.C.; Hatchikian, E.C. [3Fe-4S] to [4Fe-4S] Cluster Conversion in Desulfovibrio Fructosovorans [NiFe] Hydrogenase by Site-Directed Mutagenesis. Proc. Natl. Acad. Sci. USA 1998, 95, 11625. [Google Scholar] [CrossRef] [PubMed] [Green Version]
- Matias, P.M.; Soares, C.M.; Saraiva, L.M.; Coelho, R.; Morais, J.; Le Gall, J.; Carrondo, M.A. [NiFe] hydrogenase from Desulfovibrio desulfuricans ATCC 27774: Gene sequencing, three-dimensional structure determination and refinement at 1.8 Å and modelling studies of its interaction with the tetrahaem cytochrome C3. JBIC J. Biol. Inorg. Chem. 2001, 6, 63–81. [Google Scholar] [CrossRef] [PubMed]
- Lamle, S.E.; Albracht, S.P.J.; Armstrong, F.A. The Mechanism of Activation of a [NiFe]-Hydrogenase by Electrons, Hydrogen, and Carbon Monoxide. J. Am. Chem. Soc. 2005, 127, 6595–6604. [Google Scholar] [CrossRef] [PubMed]
- Lee, C.-M.; Chiou, T.-W.; Chen, H.-H.; Chiang, C.-Y.; Kuo, T.-S.; Liaw, W.-F. Mononuclear Ni(II)-Thiolate Complexes with Pendant Thiol and Dinuclear Ni(III/II)-Thiolate Complexes with Ni···Ni Interaction Regulated by the Oxidation Levels of Nickels and the Coordinated Ligands. Inorg. Chem. 2007, 46, 8913–8923. [Google Scholar] [CrossRef]
- Peng, S.-M.; Goedken, V.L. Cofacial Dimer of a Dihydrooctaaza[14]Annulene Complex Containing a Nickel-Nickel Bond and Related Monomeric Complexes. J. Am. Chem. Soc. 1976, 98, 8500–8510. [Google Scholar] [CrossRef]
- Li, C.-H.; Chuang, H.-J.; Li, C.-Y.; Ko, B.-T.; Lin, C.-H. Bimetallic nickel and cobalt complexes as high-performance catalysts for copolymerization of carbon dioxide with cyclohexene oxide. Polym. Chem. 2014, 5, 4875–4878. [Google Scholar] [CrossRef] [Green Version]
- Barclay, T.M.; Hicks, R.G.; Lemaire, M.T.; Thompson, L.K. Synthesis, structure, and magnetism of bimetallic manganese or nickel complexes of a bridging verdazyl radical. Inorg. Chem. 2001, 40, 5581–5584. [Google Scholar] [CrossRef] [PubMed]
- Lin, P.-M.; Chang, C.-H.; Chuang, H.-J.; Liu, C.-T.; Ko, B.-T.; Lin, C.-C. Bimetallic Nickel Complexes that Bear Diamine-Bis(Benzotriazole Phenolate) Derivatives as Efficient Catalysts for the Copolymerization of Carbon Dioxide with Epoxides. ChemCatChem 2016, 8, 984–991. [Google Scholar] [CrossRef]
- Möller, F.; Merz, K.; Herrmann, C.; Apfel, U.-P. Bimetallic nickel complexes for selective CO2 carbon capture and sequestration. Dalton Trans. 2016, 45, 904–907. [Google Scholar] [CrossRef] [Green Version]
- Caris, R.; Peoples, B.C.; Valderrama, M.; Wu, G.; Rojas, R. Mono and bimetallic nickel bromide complexes bearing azolate-imine ligands: Synthesis, structural characterization and ethylene polymerization studies. J. Organomet. Chem. 2009, 694, 1795–1801. [Google Scholar] [CrossRef]
- Brazzolotto, D.; Gennari, M.; Queyriaux, N.; Simmons, T.R.; Pécaut, J.; Demeshko, S.; Meyer, F.; Orio, M.; Artero, V.; Duboc, C. Nickel-centred proton reduction catalysis in a model of [NiFe] hydrogenase. Nat. Chem. 2016, 8, 1054–1060. [Google Scholar] [CrossRef] [PubMed] [Green Version]
- Thoi, V.S.; Sun, Y.; Long, J.R.; Chang, C.J. Complexes of earth-abundant metals for catalytic electrochemical hydrogen generation under aqueous conditions. Chem. Soc. Rev. 2013, 42, 2388–2400. [Google Scholar] [CrossRef] [PubMed]
- Artero, V.; Fontecave, M. Solar fuels generation and molecular systems: Is it homogeneous or heterogeneous catalysis? Chem. Soc. Rev. 2013, 42, 2338–2356. [Google Scholar] [CrossRef] [PubMed]
- McKone, J.R.; Marinescu, S.C.; Brunschwig, B.S.; Winkler, J.R.; Gray, H.B. Earth-abundant hydrogen evolution electrocatalysts. Chem. Sci. 2014, 5, 865–878. [Google Scholar] [CrossRef] [Green Version]
- Artero, V.; Saveant, J.-M. Toward the rational benchmarking of homogeneous H2-evolving catalysts. Energy Environ. Sci. 2014, 7, 3808–3814. [Google Scholar] [CrossRef] [PubMed] [Green Version]
- Sutra, P.; Igau, A. Emerging Earth-abundant (Fe, Co, Ni, Cu) molecular complexes for solar fuel catalysis. Curr. Opin. Green Sustain. Chem. 2018, 10, 60–67. [Google Scholar] [CrossRef]
- Bhugun, I.; Lexa, D.; Savéant, J.-M. Homogeneous Catalysis of Electrochemical Hydrogen Evolution by Iron(0) Porphyrins. J. Am. Chem. Soc. 1996, 118, 3982–3983. [Google Scholar] [CrossRef]
- Xu, Y.; Xu, R. Nickel-based cocatalysts for photocatalytic hydrogen production. Appl. Surf. Sci. 2015, 351, 779–793. [Google Scholar] [CrossRef]
- Zarkadoulas, A.; Field, M.J.; Papatriantafyllopoulou, C.; Fize, J.; Artero, V.; Mitsopoulou, C.A. Experimental and Theoretical Insight into Electrocatalytic Hydrogen Evolution with Nickel Bis(Aryldithiolene) Complexes as Catalysts. Inorg. Chem. 2016, 55, 432–444. [Google Scholar] [CrossRef] [Green Version]
- Zhang, P.; Wang, M.; Yang, Y.; Yao, T.; Sun, L. A Molecular Copper Catalyst for Electrochemical Water Reduction with a Large Hydrogen-Generation Rate Constant in Aqueous Solution. Angew. Chem. Int. Ed. 2014, 53, 13803–13807. [Google Scholar] [CrossRef]
- Lei, H.; Fang, H.; Han, Y.; Lai, W.; Fu, X.; Cao, R. Reactivity and Mechanism Studies of Hydrogen Evolution Catalyzed by Copper Corroles. ACS Catal. 2015, 5, 5145–5153. [Google Scholar] [CrossRef]
- Stubbert, B.D.; Peters, J.C.; Gray, H.B. Rapid Water Reduction to H2 Catalyzed by a Cobalt Bis (Iminopyridine) Complex. J. Am. Chem. Soc. 2011, 133, 18070–18073. [Google Scholar] [CrossRef] [PubMed]
- Aroua, S.; Todorova, T.K.; Mougel, V.; Hommes, P.; Reissig, H.-U.; Fontecave, M. New Cobalt-Bisterpyridyl Catalysts for Hydrogen Evolution Reaction. ChemCatChem 2017, 9, 2099–2105. [Google Scholar] [CrossRef]
- Manbeck, G.F.; Canterbury, T.; Zhou, R.; King, S.; Nam, G.; Brewer, K.J. Electrocatalytic H2 Evolution by Supramolecular RuII–RhIII–RuII Complexes: Importance of Ligands as Electron Reservoirs and Speciation upon Reduction. Inorg. Chem. 2015, 54, 8148–8157. [Google Scholar] [CrossRef]
- Bindra, G.S.; Schulz, M.; Paul, A.; Groarke, R.; Soman, S.; Inglis, J.L.; Browne, W.R.; Pfeffer, M.G.; Rau, S.; MacLean, B.J.; et al. The role of bridging ligand in hydrogen generation by photocatalytic Ru/Pd assemblies. Dalton Trans. 2012, 41, 13050–13059. [Google Scholar] [CrossRef] [Green Version]
- Kowacs, T.; O’Reilly, L.; Pan, Q.; Huijser, A.; Lang, P.; Rau, S.; Browne, W.R.; Pryce, M.T.; Vos, J.G. Subtle Changes to Peripheral Ligands Enable High Turnover Numbers for Photocatalytic Hydrogen Generation with Supramolecular Photocatalysts. Inorg. Chem. 2016, 55, 2685–2690. [Google Scholar] [CrossRef] [PubMed]
- Karnahl, M.; Kuhnt, C.; Ma, F.; Yartsev, A.; Schmitt, M.; Dietzek, B.; Rau, S.; Popp, J. Tuning of Photocatalytic Hydrogen Production and Photoinduced Intramolecular Electron Transfer Rates by Regioselective Bridging Ligand Substitution. ChemPhysChem 2011, 12, 2101–2109. [Google Scholar] [CrossRef]
- Das, A.; Han, Z.; Brennessel, W.W.; Holland, P.L.; Eisenberg, R. Nickel Complexes for Robust Light-Driven and Electrocatalytic Hydrogen Production from Water. ACS Catal. 2015, 5, 1397–1406. [Google Scholar] [CrossRef]
- Jain, R.; Al Mamun, A.; Buchanan, R.M.; Kozlowski, P.M.; Grapperhaus, C.A. Ligand-Assisted Metal-Centered Electrocatalytic Hydrogen Evolution upon Reduction of a Bis(thiosemicarbazonato) Ni(II) Complex. Inorg. Chem. 2018, 57, 13486–13493. [Google Scholar] [CrossRef]
- Abul-Futouh, H.; Zagranyarski, Y.; Müller, C.; Schulz, M.; Kupfer, S.; Görls, H.; El-Khateeb, M.; Gräfe, S.; Dietzek, B.; Peneva, K. [FeFe]-Hydrogenase H-Cluster Mimics Mediated by Naphthalene Monoimide Derivatives of Peri-Substituted Dichalcogenides. Dalton Trans. 2017, 46, 11180–11191. [Google Scholar] [CrossRef]
- Gao, W.; Liu, J.; Jiang, W.; Wang, M.; Weng, L.; Åkermark, B.; Sun, L. An Azadithiolate Bridged Fe2S2 Complex as Active Site Model of FeFe-Hydrogenase Covalently Linked to a Re (CO)3 (Bpy)(Py) Photosensitizer Aiming for Light-Driven Hydrogen Production. Comptes Rendus Chim. 2008, 11, 915–921. [Google Scholar] [CrossRef]
- Felton, G.A.N.; Vannucci, A.K.; Chen, J.; Lockett, L.T.; Okumura, N.; Petro, B.J.; Zakai, U.I.; Evans, D.H.; Glass, R.S.; Lichtenberger, D.L. Hydrogen Generation from Weak Acids: Electrochemical and Computational Studies of a Diiron Hydrogenase Mimic. J. Am. Chem. Soc. 2007, 129, 12521–12530. [Google Scholar] [CrossRef]
- Kamatsos, F.; Drosou, M.; Mitsopoulou, C.A. Heteroleptic thiolate diamine nickel complexes: Noble-free-metal catalysts in electrocatalytic and light-driven hydrogen evolution reaction. Int. J. Hydrogen Energy 2021, in press. [Google Scholar] [CrossRef]
- Drosou, M.; Kamatsos, F.; Ioannidis, G.; Zarkadoulas, A.; Mitsopoulou, C.A.; Papatriantafyllopoulou, C.; Tzeli, D. Reactivity and Mechanism of Photo- and Electrocatalytic Hydrogen Evolution by a Diimine Copper(I) Complex. Catalysts 2020, 10, 1302. [Google Scholar] [CrossRef]
- Makedonas, C.; Mitsopoulou, C.A.; Lahoz, F.J.; Balana, A.I. Synthesis, Characterization, and Crystal Structure of the Pd(phen)(bdt) Complex. A DFT and TDDFT Study of Its Ground Electronic and Excited States Compared to Those of Analogous Complexes. Inorg. Chem. 2003, 42, 8853–8865. [Google Scholar] [CrossRef]
- Baker-Hawkes, M.J.; Billig, E.; Gray, H.B. Characterization and Electronic Structures of Metal Complexes Containing Benzene-1,2-dithiolate and Related Ligands. J. Am. Chem. Soc. 1966, 88, 4870–4875. [Google Scholar] [CrossRef]
- Balch, A.L. Electron-transfer series of the [M-O2S2] type. Complexes derived from o-mercaptophenol, 1-mercapto-2-naphthol, and 1-hydroxy-2-pyridinethione. J. Am. Chem. Soc. 1969, 91, 1948–1953. [Google Scholar] [CrossRef]
- Robinson, F.V.; Topp, N.E. The extraction of rare earth nitrates with tri-n-butyl phosphate (TBP). J. Inorg. Nucl. Chem. 1964, 26, 473–476. [Google Scholar] [CrossRef]
- Holm, R.H.; Balch, A.L.; Davison, A.; Maki, A.H.; Berry, T.E. Electron-transfer complexes of the [M-N2S2] type. The existence of cation-stabilized free-radical complexes. J. Am. Chem. Soc. 1967, 89, 2866–2874. [Google Scholar] [CrossRef]
- Makedonas, C.; Mitsopoulou, C.A. A vibrational and DFT study of M(diimine)(dithiolate) complexes and their complexation route. Spectrochim. Acta Part A Mol. Biomol. Spectrosc. 2006, 64, 918–930. [Google Scholar] [CrossRef]
- De Mello, M.T.S.; Ribeiro, M.C.; Santos, P.S. Resonance Raman Spectroscopy of Benzenedithiolate Complexes: Evidences of Extensive Delocalization of the Chromophore. J. Mol. Struct. 1995, 372, 1–7. [Google Scholar]
- Gerasimova, T.P.; Katsyuba, S.A. Bipyridine and phenanthroline IR-spectral bands as indicators of metal spin state in hexacoordinated complexes of Fe(ii), Ni(ii) and Co(ii). Dalton Trans. 2013, 42, 1787–1797. [Google Scholar] [CrossRef] [PubMed]
- Makedonas, C.; Mitsopoulou, C.A. Tuning the properties of M(diimine)(dithiolate) complexes—The role of the metal and solvent effect. A combined experimental, DFT and TDDFT study. Inorg. Chim. Acta 2007, 360, 3997–4009. [Google Scholar] [CrossRef]
- Makedonas, C.; Mitsopoulou, C.A. An Investigation of the Reactivity of [(diimine)(dithiolato)M] Complexes Using the Fukui Functions Concept. Eur. J. Inorg. Chem. 2006, 2006, 590–598. [Google Scholar] [CrossRef]
- Zarkadoulas, A.; Koutsouri, E.; Semidalas, E.; Psycharis, V.; Raptopoulou, C.P.; Mitsopoulou, C.A. Photocatalytic hydrogen production with alkylated nickel bis-dithiolene complexes. Polyhedron 2018, 152, 138–146. [Google Scholar] [CrossRef]
- Eckenhoff, W.T. Molecular catalysts of Co, Ni, Fe, and Mo for hydrogen generation in artificial photosynthetic systems. Coord. Chem. Rev. 2018, 373, 295–316. [Google Scholar] [CrossRef]
- Herebian, D.; Bothe, E.; Bill, E.; Weyhermüller, T.; Wieghardt, K. Experimental Evidence for the Noninnocence of O-Aminothiophenolates: Coordination Chemistry of o-Iminothionebenzosemiquinonate(1-) π-Radicals with Ni(II), Pd(II), Pt(II). J. Am. Chem. Soc. 2001, 123, 10012–10023. [Google Scholar] [CrossRef] [PubMed]
- Bachler, V.; Olbrich, G.; Neese, F.; Wieghardt, K. Theoretical Evidence for the Singlet Diradical Character of Square Planar Nickel Complexes Containing Two O-Semiquinonato Type Ligands. Inorg. Chem. 2002, 41, 4179–4193. [Google Scholar] [CrossRef]
- Holyer, R.H.; Hubbard, C.D.; Kettle, S.F.A.; Wilkins, R.G. The Kinetics of Replacement Reactions of Complexes of the Transition Metals with 1,10-Phenanthroline and 2,2′-Bipyridine. Inorg. Chem. 1965, 4, 929–935. [Google Scholar] [CrossRef]
- Bhattacharya, S.; Gupta, P.; Basuli, F.; Pierpont, C.G. Structural Systematics for O-C6H4XY Ligands with X, Y = O, NH, and S Donor Atoms. o-Iminoquinone and o-Iminothioquinone Complexes of Ruthenium and Osmium. Inorg. Chem. 2002, 41, 5810–5816. [Google Scholar] [CrossRef]
- Köckerling, M.; Henkel, G. Einkernige Nickel-Thiolato-Komplexe mit Nickel-Zentren in unterschiedlichen Oxidationszuständen: Molekularer Aufbau von [Ni(SC6H4O)2]2− und [Ni(SC6H4O)2]. Chem. Ber. 1993, 126, 951–953. [Google Scholar] [CrossRef]
- Ghiasi, Z.; Amani, V.; Mirzaei, P.; Safari, N.; Abedi, A. Trichloridothallium(III) Complexes with Bipyridine Derivatives: From Structure to Luminescence Properties. Aust. J. Chem. 2013, 66, 676–684. [Google Scholar] [CrossRef]
- Goss, C.A.; Abruna, H.D. Spectral, electrochemical and electrocatalytic properties of 1,10-phenanthroline-5,6-dione complexes of transition metals. Inorg. Chem. 1985, 24, 4263–4267. [Google Scholar] [CrossRef]
- Jacques, P.-A.; Artero, V.; Pecaut, J.; Fontecave, M. Cobalt and Nickel Diimine-Dioxime Complexes as Molecular Electrocatalysts for Hydrogen Evolution with Low Overvoltages. Proc. Natl. Acad. Sci. USA 2009, 106, 20627–20632. [Google Scholar] [CrossRef] [Green Version]
- Hawley, M.; Tatawawadi, S.; Piekarski, S.; Adams, R.N. Electrochemical Studies of the Oxidation Pathways of Catecholamines. J. Am. Chem. Soc. 1967, 89, 447–450. [Google Scholar] [CrossRef]
- Engstrom, R.C. Electrochemical pretreatment of glassy carbon electrodes. Anal. Chem. 1982, 54, 2310–2314. [Google Scholar] [CrossRef]
- Fortier, S.; Le Roy, J.J.; Chen, C.-H.; Vieru, V.; Murugesu, M.; Chibotaru, L.F.; Mindiola, D.J.; Caulton, K.G. A Dinuclear Cobalt Complex Featuring Unprecedented Anodic and Cathodic Redox Switches for Single-Molecule Magnet Activity. J. Am. Chem. Soc. 2013, 135, 14670–14678. [Google Scholar] [CrossRef]
- Banerjee, S.; Sheet, D.; Sarkar, S.; Halder, P.; Paine, T.K. Nickel complexes of ligands derived from (o-hydroxyphenyl) dichalcogenide: Delocalised redox states of nickel and o-chalcogenophenolate ligands. Dalton Trans. 2019, 48, 17355–17363. [Google Scholar] [CrossRef]
- Fourmond, V.; Canaguier, S.; Golly, B.; Field, M.J.; Fontecave, M.; Artero, V. A nickel–manganese catalyst as a biomimic of the active site of NiFe hydrogenases: A combined electrocatalytical and DFT mechanistic study. Energy Environ. Sci. 2011, 4, 2417–2427. [Google Scholar] [CrossRef]
- Elgrishi, N.; McCarthy, B.D.; Rountree, E.S.; Dempsey, J.L. Reaction Pathways of Hydrogen-Evolving Electrocatalysts: Electrochemical and Spectroscopic Studies of Proton-Coupled Electron Transfer Processes. ACS Catal. 2016, 6, 3644–3659. [Google Scholar] [CrossRef]
- Costentin, C.; Passard, G.; Robert, M.; Savéant, J.-M. Concertedness in proton-coupled electron transfer cleavages of carbon-metal bonds illustrated by the reduction of an alkyl cobalt porphyrin. Chem. Sci. 2013, 4, 819–823. [Google Scholar] [CrossRef]
- Hu, X.; Brunschwig, B.S.; Peters, J.C. Electrocatalytic Hydrogen Evolution at Low Overpotentials by Cobalt Macrocyclic Glyoxime and Tetraimine Complexes. J. Am. Chem. Soc. 2007, 129, 8988–8998. [Google Scholar] [CrossRef] [PubMed] [Green Version]
- Letko, C.S.; Panetier, J.A.; Head-Gordon, M.; Tilley, T.D. Mechanism of the Electrocatalytic Reduction of Protons with Diaryldithiolene Cobalt Complexes. J. Am. Chem. Soc. 2014, 136, 9364–9376. [Google Scholar] [CrossRef]
- Derien, S.; Dunach, E.; Perichon, J. From stoichiometry to catalysis: Electroreductive coupling of alkynes and carbon dioxide with nickel-bipyridine complexes. Magnesium ions as the key for catalysis. J. Am. Chem. Soc. 1991, 113, 8447–8454. [Google Scholar] [CrossRef]
- Appel, A.M.; Helm, M.L. Determining the Overpotential for a Molecular Electrocatalyst. ACS Catal. 2014, 4, 630–633. [Google Scholar] [CrossRef]
- Cavell, A.C.; Hartley, C.L.; Liu, D.; Tribble, C.S.; McNamara, W.R. Sulfinato Iron(III) Complex for Electrocatalytic Proton Reduction. Inorg. Chem. 2015, 54, 3325–3330. [Google Scholar] [CrossRef] [PubMed]
- Gomez-Mingot, M.; Porcher, J.-P.; Todorova, T.K.; Fogeron, T.; Mellot-Draznieks, C.; Li, Y.; Fontecave, M. Bioinspired Tungsten Dithiolene Catalysts for Hydrogen Evolution: A Combined Electrochemical, Photochemical, and Computational Study. J. Phys. Chem. B 2015, 119, 13524–13533. [Google Scholar] [CrossRef] [PubMed]
- Rountree, E.S.; McCarthy, B.D.; Eisenhart, T.T.; Dempsey, J.L. Evaluation of Homogeneous Electrocatalysts by Cyclic Voltammetry. Inorg. Chem. 2014, 53, 9983–10002. [Google Scholar] [CrossRef]
- Zhao, P.-H.; Li, J.-R.; Gu, X.-L.; Jing, X.-B.; Liu, X.-F. Diiron and trinuclear NiFe2 dithiolate complexes chelating by PCNCP ligands: Synthetic models of [FeFe]- and [NiFe]-hydrogenases. J. Inorg. Biochem. 2020, 210, 111126. [Google Scholar] [CrossRef] [PubMed]
- Fang, M.; Engelhard, M.H.; Zhu, Z.; Helm, M.L.; Roberts, J.A.S. Electrodeposition from Acidic Solutions of Nickel Bis(benzenedithiolate) Produces a Hydrogen-Evolving Ni–S Film on Glassy Carbon. ACS Catal. 2014, 4, 90–98. [Google Scholar] [CrossRef]
- Wu, S.; Dou, J.; Zhang, J.; Zhang, S. A simple and economical one-pot method to synthesize high-quality water soluble CdTe QDs. J. Mater. Chem. 2012, 22, 14573–14578. [Google Scholar] [CrossRef]
- Yin, J.; Cogan, N.M.B.; Burke, R.; Hou, Z.; Sowers, K.L.; Krauss, T.D. Size dependence of photocatalytic hydrogen generation for CdTe quantum dots. J. Chem. Phys. 2019, 151, 174707. [Google Scholar] [CrossRef] [PubMed]
- Benazzi, E.; Coni, V.C.; Boni, M.; Mazzaro, R.; Morandi, V.; Natali, M. The role of the capping agent and nanocrystal size in photoinduced hydrogen evolution using CdTe/CdS quantum dot sensitizers. Dalton Trans. 2020, 49, 10212–10223. [Google Scholar] [CrossRef] [PubMed]
- Huo, P.; Uyeda, C.; Goodpaster, J.D.; Peters, J.C.; Miller, T.F. Breaking the Correlation between Energy Costs and Kinetic Barriers in Hydrogen Evolution via a Cobalt Pyridine-Diimine-Dioxime Catalyst. ACS Catal. 2016, 6, 6114–6123. [Google Scholar] [CrossRef]
- Koutsouri, E.; Mitsopoulou, C.A. Photocatalytic Hydrogen Evolution by tris-dithiolene tungsten complexes. Open Chem. 2016, 14, 393–403. [Google Scholar] [CrossRef] [Green Version]
- Armarego, W.L. Purification of Laboratory Chemicals; Butterworth-Heinemann: Oxford, UK, 2017; ISBN 0-12-805456-5. [Google Scholar]
- Arounaguiri, S.; Maiya, B.G. Dipyridophenazine Complexes of Cobalt(III) and Nickel(II): DNA-Binding and Photocleavage Studies. Inorg. Chem. 1996, 35, 4267–4270. [Google Scholar] [CrossRef] [PubMed]
- Bruker, S. V8. 32A; Bruker AXS, Inc.: Madison, WI, USA, 2013. [Google Scholar]
- Sheldrick, G. SADABS—Area Detector Scaling and Adsorption Correction; Bruker AXS: Madison, WI, USA, 2012. [Google Scholar]
- Bruker, A.; Saint, B. AXS, Inc.: Madison, WI, USA, 2004; Search PubMed;(b) Sheldrick, G.M. Acta Crystallogr. Sect. C Cryst. Struct. Commun. 2015, 71, 3–8. [Google Scholar]
- Sheldrick, G.M. Crystal structure refinement with SHELXL. Acta Cryst. 2015, 71, 3–8. [Google Scholar] [CrossRef]
- Thorn, A.; Dittrich, B.; Sheldrick, G.M. Enhanced rigid-bond restraints. Acta Crystallogr. Sect. A Found. Crystallogr. 2012, 68, 448–451. [Google Scholar] [CrossRef] [Green Version]
Figure 1.
Structures of the complexes 1 and 2.

Figure 2.
UV-Vis spectra of complexes 1 (black) and 2 (red) in DMF.

Figure 3.
ORTEP of 2. Thermal ellipsoids are drawn from 50% probability. Hydrogen atoms omitted for clarity.
Figure 3.
ORTEP of 2. Thermal ellipsoids are drawn from 50% probability. Hydrogen atoms omitted for clarity.

Figure 4.
Cyclic voltammograms of (a) 1 (10−3 M) in DMF (black) and in CH3CN (red), (b) 2 (10−3 M) in DMF (black) and in CH3CN (red), 0.1 M n-Bu4NPF6, a glassy carbon as a working electrode, an Ag/AgCl as a reference electrode and a Pt wire as a counter electrode. The scan rate was 100 mV/s.
Figure 4.
Cyclic voltammograms of (a) 1 (10−3 M) in DMF (black) and in CH3CN (red), (b) 2 (10−3 M) in DMF (black) and in CH3CN (red), 0.1 M n-Bu4NPF6, a glassy carbon as a working electrode, an Ag/AgCl as a reference electrode and a Pt wire as a counter electrode. The scan rate was 100 mV/s.

Figure 5.
Electrocatalytic hydrogen production of the complex (a) 1 (10−3 M), (b) 2 (10−3 M) in DMF with TFA as a proton donor, 0.1 M n-Bu4NPF6, a glassy carbon as a working electrode, an Ag/AgCl as a reference electrode and a Pt wire as a counter electrode. The scan rate was 100 mV/s under Ar.
Figure 5.
Electrocatalytic hydrogen production of the complex (a) 1 (10−3 M), (b) 2 (10−3 M) in DMF with TFA as a proton donor, 0.1 M n-Bu4NPF6, a glassy carbon as a working electrode, an Ag/AgCl as a reference electrode and a Pt wire as a counter electrode. The scan rate was 100 mV/s under Ar.

Figure 6.
Rinse tests for 1 in the presence of 12 mM of TFA: (black) cyclic voltammogram in the presence of catalyst (10−3 M); (red) cyclic voltammogram in the absence of catalyst vs. Fc/Fc+ after linear sweep voltammetry; (blue) cyclic voltammogram in the absence of catalyst vs. Fc/Fc+ after 3 min potential application (glassy carbon working electrode).

Figure 7.
Light-driven hydrogen production from a system containing complex 1 at 5 × 10⁻⁶ M, ascorbic acid (AscOH) (0.1 M) in DMF: H2O 1:2 at pH 4.5 with differently sized thioglycolic acid (TGA)-coated CdTe quantum dots (QDs) at 40.0 μM A (blue), B (orange), C (grey), D (yellow), Ε (light blue) upon irradiation for 120 h at 25 °C and 1 atm.

Figure 8.
Light-driven hydrogen production from a system containing complex 2 at 5 × 10⁻⁶ M, AscOH (0.1 M) in DMF: H2O 1:2 at pH 4.5 with differently sized TGA-coated CdTe QDs at 40.0 μM A (blue), B (orange), C (grey), D (yellow), Ε (light blue) upon irradiation for 120 h at 25 °C and 1 atm.
Figure 8.
Light-driven hydrogen production from a system containing complex 2 at 5 × 10⁻⁶ M, AscOH (0.1 M) in DMF: H2O 1:2 at pH 4.5 with differently sized TGA-coated CdTe QDs at 40.0 μM A (blue), B (orange), C (grey), D (yellow), Ε (light blue) upon irradiation for 120 h at 25 °C and 1 atm.


Table 1.
Selected bond lengths (Å) and bond angles (deg) of complex 2.
| Bond | Å | Angle | Deg | Angle | Deg |
|---|---|---|---|---|---|
| Ni1-O1 | 1.834(4) | O1-Ni1-S1 | 90.09(12) | Ni1-O1-C14 | 119.2(3) |
| Ni1-S1 | 2.1588(16) | O1-Ni1-N1 | 172.69(19) | Ni1-S1-C13 | 96.19(18) |
| Ni1-N1 | 1.904(5) | O1-Ni1-N2 | 90.13(18) | Ni1-N1-C1 | 114.8(4) |
| Ni1-N2 | 1.908(5) | S1-Ni1-N1 | 96.38(15) | Ni1-N1-C15 | 127.4(4) |
| O1-C14 | 1.339(6) | S1-Ni1-N2 | 176.02(14) | Ni1-N2-C7 | 115.4(4) |
| S1-C13 | 1.767(5) | N1-Ni1-N2 | 83.6(2) | Ni1-N2-C8 | 126.3(4) |
| N1-C1 | 1.364(7) | ||||
| N2-C7 | 1.358(7) | ||||
| C13-C14 | 1.410 (7) |
Table 2.
Bulk electrolysis experiments for H2 evolution for complexes 1, 2, [Ni(mp2)]−.
| Complex | Overpotential (mV) | Faradaic Efficiency | TON/3 h | TOF (h−1) |
|---|---|---|---|---|
| 1 | 580 | 58% | 4.63 | 1.54 |
| 2 | 720 | 73% | 39.17 | 13.1 |
| [Ni(mp2)]− | 690 | 59% | 14.3 | 4.76 |
Table 3.
Crystal data and structure refinement details for complex 2.
| Empirical Formula | C19 H18 Cl2 N2 Ni O S |
|---|---|
| Formula weight | 452.02 |
| Temperature | 120(2) Κ |
| Wavelength | 1.54178 Å |
| Crystal system | Monoclinic |
| Space Group | P21/c |
| Unit cell dimensions | a = 8.2538(18) Å b = 18.097(4) Å, β = 96.238(7)° c = 12.863(3) Å |
| Volume | 1909.9(7) Å3 |
| Z | 4 |
| Density (calculated) | 1.572 Mg/m3 |
| Absorption coefficient | 5.148 mm−1 |
| F(000) | 928 |
| Crystal size | 0.320 × 0.200 × 0.100 mm3 |
| Theta range for data collection | 4.233 to 66.592°. |
| Index ranges | −9 < =h < = 9, −21 < = k < = 21, −15 < = l < = 15 |
| Reflections collected | 22,231 |
| Independent reflections | 3313 [R(int) = 0.1037] |
| Completeness to theta = 66.592o | 98.3% |
| Refinement method | Full-matrix least-squares on F2 |
| Data/Restraints/Parameters | 3313/180/291 |
| Goodness-of-fit on F2 | 1.061 |
| Final R indices [I >2σ(I)] | R1 = 0.0852, wR2 = 0.2529 |
| R indices (all data) | R1 = 0.0994, wR2 = 0.2701 |
| Largest diff. peak and hole | 0.593 and −0.773 e·Å−3 |
Publisher’s Note: MDPI stays neutral with regard to jurisdictional claims in published maps and institutional affiliations. |
© 2021 by the authors. Licensee MDPI, Basel, Switzerland. This article is an open access article distributed under the terms and conditions of the Creative Commons Attribution (CC BY) license (http://creativecommons.org/licenses/by/4.0/).
Share and Cite
MDPI and ACS Style
Kamatsos, F.; Bethanis, K.; Mitsopoulou, C.A. Synthesis of Novel Heteroleptic Oxothiolate Ni(II) Complexes and Evaluation of Their Catalytic Activity for Hydrogen Evolution. Catalysts 2021, 11, 401. https://doi.org/10.3390/catal11030401
AMA Style
Kamatsos F, Bethanis K, Mitsopoulou CA. Synthesis of Novel Heteroleptic Oxothiolate Ni(II) Complexes and Evaluation of Their Catalytic Activity for Hydrogen Evolution. Catalysts. 2021; 11(3):401. https://doi.org/10.3390/catal11030401
Chicago/Turabian StyleKamatsos, Fotios, Kostas Bethanis, and Christiana A. Mitsopoulou. 2021. "Synthesis of Novel Heteroleptic Oxothiolate Ni(II) Complexes and Evaluation of Their Catalytic Activity for Hydrogen Evolution" Catalysts 11, no. 3: 401. https://doi.org/10.3390/catal11030401
Note that from the first issue of 2016, this journal uses article numbers instead of page numbers. See further details here.