Article

Solid-State Synthesis of Direct Z-Scheme Cu2O/WO3 Nanocomposites with Enhanced Visible-Light Photocatalytic Performance

1
Centre of Polymer Systems, Tomas Bata University in Zlin, Tr. T. Bati 5678, 760 01 Zlin, Czech Republic
2
Centre for Functional and Surface Functionalized Glass, Alexander Dubček University of Trenčín, 911 50 Trenčín, Slovakia
*
Author to whom correspondence should be addressed.
Catalysts 2021, 11(2), 293; https://doi.org/10.3390/catal11020293
Submission received: 7 January 2021 / Revised: 15 February 2021 / Accepted: 18 February 2021 / Published: 23 February 2021
(This article belongs to the Special Issue Direct Z-Scheme Photocatalysts)

Abstract

:
In this paper, we report the preparation of visible-light active direct Z-scheme Cu2O/WO3 nanocomposite photocatalyst by a solid-state reaction avoiding the otherwise inevitable formation of CuWO4 phase in wet syntheses. Structure, morphology, and thermal and optical properties of prepared WO3 nanoplatelets decorated by Cu2O were investigated by XRD, Raman spectroscopy, SEM/TEM, combined thermogravimetric (TG)/differential scanning calorimetry (DSC) analysis, and UV–VIS spectroscopy. The photocatalytic performance of the prepared samples under UV and visible light was studied through monitoring discoloration of methylene blue under illumination by selected wavelengths, allowing for the distinguishing between the contributions of the two semiconductive components. Experimental results showed that the decoration of WO3 nanoplates by Cu2O nanoparticles led to an improvement in photocatalytic performance, regardless of used LED (Light-Emitting Diode) wavelength, even at low concentrations. By using scavengers selectively blocking reactive species involved in the discoloration reaction, we determined that the Cu2O/WO3 nanocomposite exhibited the characteristics of direct Z-scheme-type photocatalyst.

Graphical Abstract

1. Introduction

Nowadays, fossil fuel energy and environmental pollutants are of great concern to scientists and the public alike. Intensive efforts have been undertaken to find a viable sustainable energy solution and environmental remediation. In this regard, photocatalysis based on semiconductors has emerged as a promising solution. Semiconductor photocatalysts can be excited by photons of energy equal or larger than their band gap, resulting in the generation of an excited electron in the conduction band (CB) leaving a hole in the valence band (VB). The photogenerated electrons and holes can migrate to the surface of the semiconductor phase and trigger the formation of reactive species from molecules adsorbed on the interface. Predominantly, reactive oxygen species (ROS) are formed [1,2]. Among them, the two main ROS responsible for the degradation of organic pollutants in photocatalytic redox reactions are OH and O2•− radicals. The required minimum standard reduction potential for generation of OH and O2•− radicals is +2.40 V (vs. normal hydrogen electrode (NHE)) or more positive and −0.33 V (vs. NHE) or more negative, respectively, depending on pH [3,4]. Either of OH or O2•− can degrade organic pollutants completely, but for optimal photocatalytic efficiency, production of both OH and O2•− radicals is desirable in a photocatalytic system. Various metal oxide semiconductors such as TiO2, WO3, ZnO, and Fe2O3 have been investigated and explored [5,6,7,8]. However, all single metal oxide semiconductor photocatalysts have the intrinsic drawback of poor visible light harvesting and/or low quantum efficiency, mainly due to rapid charge recombination rate of photogenerated electron–hole pairs, which limits their practical applications [9].
Therefore, extensive efforts have been made to date for optimizing the photocatalytic systems by extending the visible light absorption range and improving separation of charge carriers. Heterostructures are synthesized by joining two different semiconductors to create a heterojunction able to absorb radiation in the visible light range and improve the formation of radicals by a proper alignment of the bands towards reduction potentials of H2O/OH and O2/O2•−. A suitable construction of the heterojunction may support the charge carrier separation as well. The two most applied heterojunctions are type II and direct Z-scheme [2]. The type II heterojunctions consist of the combination of two semiconductors with bands at similar energetic levels yet slightly shifted on the physical energy scale. The photogenerated electrons in the semiconductor with higher CB migrate to the CB with a lower energy of the other semiconductor while the photogenerated holes follow the inverse migration from the lower laying VB to the higher lying VB of the other semiconductor. This inherently leads to the separation of photogenerated charges that are accumulated in the two different semiconductor phases, thus minimizing the recombination of charge carriers. However, the promotion of the spatial charge separation occurs at the expense of the reduction potential of both electrons and holes. Unlike type II configuration, the Z-scheme photocatalysts combine a semiconductor of high energy in the valence band (oxidation photocatalyst) with another semiconductor of lower bandgap and stronger reduction ability in the conduction band, i.e., shifted closer to the vacuum level (reduction photocatalyst). The electrons photogenerated in the oxidative photocatalyst are crosscombined with the holes of the reductive photocatalyst at the heterojunction interface. This process also yields the accumulation of separated charge carriers in the respective phases. Moreover, the holes keep their strong oxidation ability, while the electrons retain their reduction potential. The enhancement of the redox ability of the whole system with respect to the energy of exciting light photons proceeds at the expense of the energy loss in the recombination event. Thus, the construction of direct Z-scheme semiconductor configuration is currently the most attractive one because of its merits in improvement in both charge carrier separation and stronger redox ability [1,2,5,10]
To optimize the construction of a direct Z-scheme heterostructure, researchers must consider several aspects, such as morphology, crystal facets, surface area, and interfacial contact. The geometric configuration also varies when two components are coupled, which also affects the charge transfer efficiency [11,12]. A simple configuration known as the surface decorated system is commonly employed. This type of configuration is fabricated by the integration of a small component onto a large-sized component and requires a suitable interfacial contact that is not attainable by commonly used synthesis routes such as sol–gel or hydrothermal. Surface decoration can be performed by in situ synthesis and deposition–precipitation methods and deliver higher photocatalytic activity because both components are exposed to reactive substances, resulting in increased surface area for photogenerated charge carriers to react with the reactants [2]. Furthermore, the direct Z-scheme has a considerable reduction in the shielding effect and photocorrosion. For example, in the case of Ag3PO4/MoS2 direct Z-scheme, Ag3PO4 serves as an oxidation component at which photogenerated electrons are consumed through recombination reaction with holes generated by MoS2, which lowers the photocorrosion of Ag-based component to metallic Ag [13].
Numerous direct Z-scheme systems have been investigated over the past several years. For example, g-C3N4/TiO2 [3], CaIn2S4/TiO2 [14], Bi2O3/g-C3N4 [15], WO3/Cu2O [16], ZnIn2S4/Bi2WO6 [17], Bi2O3/NaNbO3 [4], NaNbO3/WO3 [18], and ZnO/CdS [19] have reported significant photocatalytic efficiencies. However, a photocatalytic system suitable for commercial applications has not been developed yet. Presumably, the direct Z-scheme still suffers from poor charge transport at the composite interface due to the lattice mismatch and defects, resulting in the trapping of photogenerated carriers and thus impeding the diffusion of the electrons and holes [20].
Among many of the above-mentioned possible combinations, the Z-scheme based on Cu2O/WO3 composite represents an attractive option due to a reasonable difference in CB energy position of WO3 and Cu2O, which should prevent the transfer of the excited electrons from CB of Cu2O into the CB of WO3. Simultaneously, the CB of WO3 and VB of Cu2O do not differ much in energy levels from each other; therefore, the excited electrons from CB of WO3 would easily combine with the holes from the VB of Cu2O, thus completing the Z-scheme mechanism [21]. For WO3-based photocatalysts, several previous studies have shown that WO3 itself is not a suitable photocatalyst while Cu2O suffers from photocorrosion since its redox potential is located within its bandgap, making self-redox reactions inevitable [22]. Moreover, the CB potential of WO3 is not suitable for the single-electron reduction of O2, which results in insufficient photoreduction ability [23]. In spite of the limitations of employing a single-component WO3 or Cu2O photocatalysts, their combination was demonstrated as viable direct Z-scheme construction.
Available reports on the preparation of Cu2O/WO3 heterostructures describe mostly electrochemical deposition of thin films. In a typical procedure, WO3 substrate was prepared and then Cu2O was electrodeposited onto its surface, thus constructing a bilayer heterojunction [16,24,25]. The effectiveness of the heterostructure was demonstrated by electrode photocurrent enhancement for photoelectrochemical water splitting [25,26]. The system showed photocatalytic activity also towards organic dye molecule discoloration and Cr(VI) reduction [16]. Photocatalytic CO2 reduction under visible-light irradiation was also confirmed for electrodeposited systems [27]. The issue of prepared catalysts stability is still a matter of debate. Joining WO3 into the nanocomposite catalyst would prevent Cu2O from photocorrosion at least to some extent [16,24]. Reports on other methods than electrodeposition for Cu2O/WO3 synthesis can be found as well. The performance of the system for water oxidation was improved by facet selective photodeposition of platinum as a noble metal co-catalyst [12]. Concurrently, the viability of CO2 photoreduction into hydrocarbons was published for Z-scheme Cu2O/WO3 heterojunction obtained by a hydrothermal co-precipitation route [21].
Herein, we report on the synthesis of Cu2O/WO3 nanocomposite and evaluation of its photocatalytic performance under visible and ultraviolet (UV) light irradiation. Unlike common methods for the synthesis of WO3, which are based on various hydro/solvothermal synthesis at relatively high temperatures, prolonged time, high-cost tungsten precursor, and a plethora of structure modifying agents [28,29,30], we opted for the classical synthesis route for the preparation of WO3 by thermal decomposition of peroxopolytungstic acid as a precursor material, which can be obtained easily at a large scale via recrystallisation of tungsten powder dissolved in H2O2. The conversion of tungsten into various compounds via its dissolution in hydrogen peroxide was originally reported by Murau as early as in 1961 [31], but systematic investigations of peroxopolytungstic acids were conducted by Kudo et al. much later and summarized in a series of papers [31,32,33]. Different products can be prepared, depending on the molar ratio of peroxide ions to tungsten and conditions during evaporation. Slow and rapid evaporation of the solution in open air results in yellow amorphous and white crystalline solid, respectively. To decorate WO3 nanoplates with Cu2O nanoparticles, we employed a solid-state method by mixing the WO3 with copper acetate precursor followed by quick annealing at the decomposition temperature of the precursor. Preparation of the Cu2O/WO3 nanocomposite is otherwise difficult because the system is prone to the formation of CuWO4 when starting from amorphous WO3 solid phase and/or using long annealing periods and high temperatures [34]. The photocatalytic activity of the Cu2O/WO3 nanocomposite was evaluated by photocatalytic discoloration of methylene blue (MB) dye, which is a known model toxic pollutant [35]. The Cu2O/WO3 nanocomposite possessed direct Z-scheme charge transfer mode resulting in enhanced photocatalytic activity. The reaction mechanism was investigated by using radical scavengers.

2. Results and Discussion

2.1. Characterisation of As-Prepared Photocatalysts

2.1.1. XRD Analysis

The XRD patterns of Cu2O(x wt %)/WO3 nanocomposites are shown in Figure 1c–e. For comparison, the XRD patterns of peroxotungstic acid precursor (PTA) and pure WO3 are also given. Diffractogram of PTA in Figure 1a exhibits typical features for layered compounds with intense diffraction peaks in the range of small Bragg angles. Similar diffraction patterns for [WO2(O2)H2O]·nH2O precursor were reported by other authors, although the positions of individual peaks may slightly vary depending on the degree of hydration [28]. The as-prepared WO3 powder diffraction pattern is identical to the reported monoclinic phase in PDF Card No. 01-072-0677. The most pronounced peaks were indexed to (002), (020), (200), (120), (112), (202), (222), (004), (040), and (142) planes. The monoclinic I (γ-WO3) phase was thermodynamically stable in the range from 17 °C to 330 °C. No traces of triclinic (δ-WO3) phase were observed, although its stability region (from −43 °C to 17 °C) was very close to the room temperature [36,37]. From Figure 1c, it can be observed that when the amount of Cu2O was 1.0 wt %, the diffraction peaks corresponding to the cubic phase of Cu2O were not manifested (PDF Card No. 01-078-2076). Nevertheless, by increasing the content of Cu2O to 5.0 wt % and 10.0 wt %, we found that the diffraction peak intensity corresponding to Cu2O planes increased significantly (see magnified parts of the diffractogram in the right part of the graph in Figure 1). No other crystal phases, namely, CuWO4, were found in the nanocomposite samples.
The average sizes of the nanocrystallites for pure WO3 calculated from (002), (020), and (200) diffraction line width were 27, 18, and 20 nm, respectively, according to the Scherrer formula. Thus, the basic building blocks of the WO3 nanoplatelets did not show significant preferential growth orientation. The processing history of the Cu2O/WO3 nanocomposite did not significantly influence the WO3 nanocrystallite size, and no trend was observed. Taking the variability between individual WO3 samples, we found that the average diffracting domain area sizes were (23 ± 3) nm, (18 ± 3) nm, and (20 ± 4) nm calculated from (002), (020), and (200) diffraction lines, respectively, for all samples containing WO3 reported in Figure 1. For the Cu2O(10 wt %)/WO3 nanocomposite, the dimension of Cu2O nanocrystallites according to Scherrer formula was ≈50 nm and ≈4 nm using (111) and (220) diffraction line breadth, respectively. Sizes ≈40 nm and ≈5 nm were estimated for the same diffracting domain areas for the Cu2O(5 wt %)/WO3 nanocomposite. This implies the anisometric shape of single Cu2O nanocrystallites.

2.1.2. TG/DSC Analysis

Combined thermogravimetric (TG)/differential scanning calorimetry (DSC) analysis of PTA precursor material was performed under air flow at a heating rate of 5 °C min−1 to determine the temperature for the conversion of the precursor to the WO3 and a better understanding of temperature-induced phase transition during the calcination process. In Figure 2, the TGA curve shows that two weight losses occurred corresponding to the endothermic peaks at 120 °C and 200 °C, respectively. The first 6% weight loss was associated with the drying process and can be ascribed to the dehydration of weakly bonded water molecules. The second peak corresponded to a weight loss of 12%, which represented weight losses incurred due to the dehydration of strongly bonded H2O2 molecules and thermal degradation of peroxo groups [36]. Additionally, the DSC thermograph indicated the presence of a sharp exothermic peak at 360 °C. This peak indicated a phase transition of WO3 [38], which can be most likely associated with the crystallization of the amorphous PTA decomposition product to the orthorhombic (β-WO3) phase [36]. The orthorhombic phase is stable in the range from 330 °C to 740 °C [36,37]. The product of annealing transforms into the monoclinic γ-phase during cooling to room temperature. The presence of the γ-phase was confirmed by XRD analysis. Various temperature stability ranges of the WO3 phases are reported in the literature [36,37]. This is due to the effects of the crystallite size on the transition temperature, which may be reasonably downshifted by the nanosize effect. It was reported that the transformation from β to γ begins at 270 °C for particles with an average diameter of about 60 nm. Moreover, it does not even occur for particles with a size of about 16 nm, while for sizes below 4 nm, only short-range order α-like amorphous phase exists over the whole temperature range [39].

2.1.3. Raman Spectroscopy

The Raman spectra of the as-prepared samples are shown in Figure 3. The well-defined peaks can be observed for the monoclinic WO3 phase at 808, 715, 480, 327, and 272 cm−1. The high-frequency peaks at 808 and 715 cm−1 were attributed to W-O-W vibrational stretching mode, while the lower frequency peaks at 327 and 272 cm−1 were induced by the W-O-W bending mode [40]. As shown in Figure 3, intensity peaks were broader but similar to those reported for WO3 in literature [29,39]. It was noticed that by increasing the concentration of Cu2O decoration onto the WO3 surface, the well-defined peaks of WO3 gradually become weaker, possibly due to stronger charge interactions, an increase of disorder, or exciting laser (532 nm) absorption. This observation shows that WO3 nanoparticles were successfully decorated with the Cu2O nanoparticles and also indicates interaction between WO3 and Cu2O crystals after they conjugate with each other.

2.1.4. SEM Analysis

SEM was used for the characterization of as-prepared samples to observe the surface morphology and features. The SEM images revealed that compared to PTA precursor in Figure 4a, which contained rough bundle-like agglomerates, the as-prepared WO3 crystals exhibited very similar yet several times coarser bundle-like agglomerate morphology, which is shown in Figure 4b. This can be due to the growth of the crystalline phase at the expense of the precursor. A closer inspection shows nanoplate-like morphology WO3 crystals, which might be inherited from the original layered PTA structure. On the other hand, all diffractions at low 2θ angles corresponding to the layered structure of PTA vanished in the diffractograms of the calcined products. It should be stressed that the thermal decomposition of the PTA precursor resulted in the amorphous intermediate first, which was then followed by the crystallization of the WO3 phase, as confirmed by the combined TG/DSC analysis and literature data [36]. Therefore, the WO3 nanoplates were much coarser than the PTA layers should be, and it cannot be a topotactic transition. These WO3 crystals were further used in the preparation of Cu2O/WO3 composites. Figure 4c–e shows the SEM images of Cu2O/WO3 composites with 1, 5, and 10 wt % of Cu2O, respectively. The overall morphology of the WO3 nanoplate aggregates was not affected by the mechanical operation. SEM images also indicate that a large number of Cu2O nanoparticles were assembled on the surface of WO3 nanoplates. No separated aggregations of Cu2O nanoparticles were observed. Moreover, the size of the Cu2O nanoparticles on the surface of WO3 appeared to be uniform for each concentration. As expected, with an increasing amount of Cu2O decoration onto WO3 surface, higher coverage of the surface of WO3 nanoplates by Cu2O nanoparticles was achieved. This uniformity of Cu2O decoration on WO3 may favor improved charge transfer, resulting in enhanced photocatalytic activity.

2.1.5. TEM Analysis

The interface and microstructure features of the Cu2O/WO3 heterogeneous structure were further studied by TEM. Figure 5a–d shows the TEM images of the as-prepared WO3 nanoplates and Cu2O/WO3 heterogeneous nanostructures with 1, 5, and 10 wt % of Cu2O, respectively. As shown in Figure 5a, pure WO3 nanoplate aggregates were composed of crystals with plate-like morphology as previously observed by SEM images. Figure 5b–d shows the TEM images of as-prepared Cu2O/WO3 heterogeneous nanostructures with different weight concentrations. It was observed that very small Cu2O particles in 1 wt % nanocomposite (Figure 5b) were sparsely distributed on the surface of WO3 grains with good interfacial contact with WO3. The size of these Cu2O particles may be estimated below a few nanometers. This is in accordance with their virtual invisibility in the X-ray diffractogram, also considering the small concentration of the phase. Much dense decoration surface coverage and bigger particles can be seen in Figure 5c,d. The size of the biggest nanoparticles reached a few tens of nanometers, which is in accordance with the XRD results. Nevertheless, medium-size and very small particles were present as well, implying wide size distribution, which might be a result of the rapid and short annealing of the solid-state mixture of WO3 and the cupric oxide precursor. The shape of decorating particles also seems to be variable. The TEM analysis showed that the surface of relatively big WO3 nanoplates was covered by tiny Cu2O nanoparticle decorations, which can enhance the charge transfer efficiency due to the improved formation of hetero-junctions.
Taking the structural and morphological analyses all together, we can confirm the method of Cu2O (x wt %)/WO3 solid-state synthesis to be successful. Separate preparation of WO3 crystalline nanoplates and mixing them with solid copper acetate even by manual grinding in a mortar provided sufficient dispersion of the WO3 and the Cu2O precursor. Moreover, the low yet sufficient annealing temperature was selected for the precursor decomposition and applied for a very short period. Such mild treatment enabled the attachment of Cu2O nanoparticle decorations to the surface of WO3 nanoplates while the CuWO4 phase formation was inhibited.

2.1.6. BET Surface Area Analysis

The specific surface area estimated according to BET (Brunauer, Emmett and Teller) analysis and porosity of the prepared photocatalysts were investigated by nitrogen adsorption–desorption. Figure 6 and Figure 7 show the nitrogen adsorption–desorption and the corresponding pore-size distribution, respectively. The BET surface areas of prepared Cu2O (x wt %)/WO3 were 9.1, 10.7, 11.3, and 14.3 m2 g−1 with the weight percent values of x = 0.0, 1.0, 5.0, and 10.0, respectively. With the increasing concentration of Cu2O, the surface areas of the samples slightly increased. Increasing specific surface normally implies enhancement in photocatalytic activity due to a higher number of available active sites [41]. Systems with the hierarchical porous structure may obey this simple law in specific cases [42] when the surface area is the only difference between compared materials, while the interplay of the effects of the structural features contributing at various morphology hierarchical levels can be more complicated [43]. It can be observed that all prepared photocatalysts exhibited type IV isotherm according to IUPAC (International Union of Pure and Applied Chemistry) classification, implying the presence of mesoporous structure. At the relative pressure range of 0.5–0.9, the shape of the hysteresis loop of samples was that of type H3, indicating the presence of slit-like pores [44]. The mesoporous pore-size distribution was very broad and ranged from 2 to 60 nm. The pore volume distribution curve had a bimodal characteristic with the main maximum of the pore width about 10 nm and a smaller peak at about 2–3 nm for pure WO3. The addition of Cu2O decoration did not influence the position of the smaller peak, but the main maximum was shifted to lower values (6–7 nm) for Cu2O (1 and 5 wt %)/WO3 nanocomposites. The two peaks merged into one with the maximum of pore width at 2 nm for Cu2O (10 wt %)/WO3 nanocomposite.

2.1.7. UV–VIS Analysis

The optical band gap and light absorption are closely related to the electronic structure and band alignment of a semiconductor [37]. By using the Kubelka–Munk equation, we determined the optical band gaps of the as-prepared samples [45,46]:
[ α h ν ] p =   A ( h ν E g ) ,
where α is the optical absorption coefficient; stands for quantized photon energy; A is the constant of proportionality; and the value of exponent p is determined by the transition type: p = 2 for direct allowed transitions, p = 2/3 for direct forbidden transition, p = 1/2 for indirect allowed transitions, and p = 1/3 for indirect forbidden transitions [45,47]. The exponent was determined by plotting a graph between [F(R)·hν]p and . The best fit to a straight line was found for p = 1/2, indicating an indirect allowed transition. The transformed equation was then obtained as
[ F ( R ) · h ν ] 1 / 2 =   [ h ν E g ] .
By plotting [F(R)·hν]1/2 vs. , as shown in Figure 8, the optical band gap energies of the materials were determined by the extrapolation of the slope to F(R) → 0 after subtraction of the baseline given by the low energy component [38]. The optical band gap energies of the as-prepared pure WO3, 1.0, 5.0, and 10.0 wt % Cu2O/WO3 were estimated to be 2.62, 2.68, 2.76, and 2.8 eV, respectively (Figure 8, inset) which is in accordance with the value 2.7 eV for pure monoclinic WO3 phase in the literature [37,48]. Moreover, the dependence may have only been a systematic manifestation of the inevitable error caused by subtraction of the increasing background baseline. Therefore, the value 2.7 eV was taken into further consideration for the WO3 component. If there was only the absorption due to the band gaps of WO3 and Cu2O, the material was of yellow color, having the absorption edge at about 470 nm. Figure 9 shows a visual representation of gradual color change with respect to increasing Cu2O concentration. It was observed that the pure WO3 powder was yellow as expected, and the addition of minute (1 wt %) amount of Cu2O caused only a brownish tint to the base WO3 yellow color, while a significant color change to brown was observed for Cu2O(5.0 wt %)/WO3 and Cu2O(10.0 wt %)/WO3 samples. The low energy component of the light absorption was manifested clearly in Figure 8. It must be noted that the bandgap of Cu2O was expected to be ≈2.2 eV [49,50], but the data did not allow its separation in the Tauc plot. This bandgap edge was buried in the pronounced tail located below 2.7 eV and ranging down to least 1.4 eV. The tail indicated the presence of significant structural imperfections, lattice disorder, and eventually amorphous phase (or phases), which was in accordance with the peak broadening observed by Raman spectrometry. The structural disorder may have arisen from at least two sources. First, the specific method of synthesis included quick annealing, fast decomposition of the material, and its ballistic cooling, which can produce a large number of frozen defects. Moreover, the generally substantial nanoparticle surface to volume ratio of the material itself made surface defects into existence inevitable. The distribution of these states in the bandgap did not fit to the standard exponential models describing Urbach energy [51,52], which is otherwise normally used to characterize the degree of disorderliness of the material. Therefore, we assume that band bending and band matching between the two semiconductors also may have contributed to the density of the widely distributed deep states in the band gap, specifically at 5.0 and 10 wt % Cu2O concentrations in the nanocomposite.

2.1.8. Electronic Band Structure Analysis

Various bandgap Eg and band edge energy values (ECB and EVB for CB and VB, respectively) are available throughout the recent literature dealing with Cu2O/WO3 photocatalysts. While a relatively common range of WO3 values can be found, the data available for Cu2O shows large variability. The data for WO3 vary from 2.7 eV to 2.9 eV for Eg(WO3), from 0.15 eV to 0.64 eV for ECB(WO3), and from 2.90 eV to 3.54 eV for EVB(WO3) in references [16,21,26,27]. The data for Cu2O vary from 1.92 eV to 2.2 eV for Eg(Cu2O), from −1.12 eV to −0.28 eV for ECB(Cu2O), and from 0.89 eV to 1.92 eV for EVB(Cu2O) in the same references. It should be noted that none of these sources indicate pH other than 0 for these potentials. Therefore, the authors opted here for the prediction of the band edge positions by using bulk electronegativity of the oxide and its bandgap [53]. To obtain the most relevant contemporary available data, we used NIST (National Institute of Standards and Technology) databases for the ionization energy (IE) [54] and electron affinity (EA) [55], giving the IPW ≐ 7.864 eV and EAW ≐ 0.816 eV for tungsten, IPCu ≐ 7.726 eV and EACu ≐ 1.236 eV for copper, and IPO ≐ 13.618 eV and EAO ≐ 1.461 eV for atomic oxygen. The Mulliken (absolute) electronegativity of an atom (X) is the arithmetic mean of the first ionization energy and the electron affinity [56], thus obtaining XW = 4.340 eV, XCu = 4.481 eV, and XO = 7.540 eV.
Concerning oxide materials, we relied in this work on the basic reference [49]. The following equations for band edge position calculations were taken from this reference and were modified to yield values of band edge energies corresponding directly to reduction potentials in the NHE (normal hydrogen electrode) scale:
E C B s   =   X s     4.5   eV     0.5 E g s   ,
E V B s   =   E C B s   +   E g s   ,
where the subscript s indexes the semiconductor; Xs stands for absolute bulk electronegativity of the semiconductor, which is the geometric mean of the absolute electronegativity of the constituent atoms of the semiconductor [53]; and Egs represents bandgap energy of the semiconductor. The standard reduction potential of the normal hydrogen electrode (NHE)(H+/H2) = 0 V is (AES)(H+/H2) = 4.5 V in the absolute electrochemical scale (AES). The physical scale or absolute vacuum energy scale (AVS) is used in the literature oriented more on physics (so it is in [49] as well). Electrons at rest in a vacuum have the energy of 0 eV, corresponding to the absolute potential 0 V; however, the energy goes to negative values while the absolute potential goes to positive values, i.e., the numerical value of E(abs)/[V] = − E(AVS)/[eV]. Therefore, the constant 4.5 eV is used in Equation (3).
The Xs values for Cu2O and WO3 were calculated to be XCu2O = 5.32 eV and XWO3 = 6.59 eV, respectively. The values for band gap energies were taken Eg(WO3) = 2.7 eV and Eg(Cu2O) = 2.2 eV. Hence, the following bandgap edge positions were estimated: ECB(WO3) = 0.72 eV, EVB(WO3) = 3.42 eV, ECB(Cu2O) = −0.27 eV, and EVB(Cu2O) = 1.93 eV.
However, this prediction of CB and VB edge energies holds for materials in a vacuum. The situation of the material immersed in water (or water solutions) must be considered. The predicted band edge energy values correspond to the material at the condition of zero net charge at the semiconductor surface, which is in contact with the solution at the flatband potential, i.e., at the zero point of charge (ZPC) [53]. Therefore, a comparison between the energies on the physical absolute vacuum scale and the electrochemical potentials has to be performed at the condition of ZPC, which means at the corresponding pH(ZPC). According to [49], the pH(ZPC) is 0.43 for WO3 and 8.53 for Cu2O. Therefore, the predicted band edge energy needs to be corrected by the term ΔEpH to the specific pH value used for comparison. Moreover, a potential drop of (0.5 ± 0.3) V is experienced due to the dipole associated with materials interacting with water, and this fact suggests that the band edges of materials always shift closer to the vacuum due to the presence of a net dipole moment caused by preferential orientation of surrounding H2O molecules towards the solid surface, i.e., it requires, on average, ≈0.5 eV less energy to extract an electron from the material if it is immersed in pure water. This effect imposes a constant correction term ΔEdipole [57]. Thus, the band edge energies at given pH are for CB (and analogously for the VB) expressed in energies corresponding to the NHE scale:
E C B s , pH   =   E C B s   +   Δ E pH   +   Δ E dipole   ,
E C B s ,   pH   =   E C B s   +   0.059 ( pH ( ZPC )   pH )     0.5   eV   ,
As indicated in the experimental section, the photocatalytic tests were performed at a mild condition of pH = 6. Henceforth, the values of band edge energies and potentials at pH = 6 are considered. The values ECB(WO3),pH = 6 = −0.11 eV, EVB(WO3),pH = 6 = 2.59 eV, ECB(Cu2O),pH = 6 = −1.10 eV, and EVB(Cu2O),pH = 6 = 1.10 eV were estimated applying Equation (6). These values were presumed to be the best guess that can be given according to the state of the art with the full awareness of possible errors, namely, the influence of the adsorption phenomena and all theoretical and experimental uncertainties of the values included in the model.

2.2. Evaluation of Photocatalytic Activity under UV and VIS Light

For evaluation of photocatalytic degradation of the pollutants, it is reasonable to observe the whole process of degradation of the substrate until its full mineralization. Observations performed using an organic dye as a model molecule need to be taken with caution. A thoroughly conducted analysis of the molecule destruction mechanisms and identification of intermediate products is necessary if the results should be generalized and transferred to the real systems. Certainly, the dye solution discoloration (photobleaching) is not the measure of the kinetics of the dye mineralization. Using dyes has been a subject of constructive criticism recently, and other molecular models are suggested [58]. However, using the photobleaching of a dye as a gauge of the initial kinetics of the first photodegradation reaction step(s) may still be reasonable, especially if the degradation mechanism is deeply understood as in the case of MB [59,60]. Discoloration of MB as the organic dye model molecule in an aqueous medium is also used for assessment of photocatalytic activity according to ISO (International Organization for Standardization) standards, e.g., ISO 10678:2010 revised in 2017 and still currently valid [61]. An overview can be found in [62]. The use of MB solution discoloration is a still considered a first method of choice for preliminary assessment of photocatalytic systems. Here, identification of the heterojunction type is pursued. Moreover, the use of MB in this study is justified by properly selected degradation monochromatic source wavelengths that fit to the spectroscopic window of the dye, thus preventing one of the main issues indicated in [58]. Indeed, MB absorbs little light between 320 and 520 nm and shows negligible discoloration in the absence of the catalyst (see Appendix A, Figure A1).
The initial step(s) of photocatalytic activity of the as-prepared nanocomposites was evaluated by the photocatalytic discoloration of methylene blue under UV (λ ≈ 377 nm) and visible light irradiation (λ ≈ 429 nm and λ ≈ 523 nm) at ambient temperature in the presence of air atmosphere. Unlike employing UV lamp and long-pass filters, we used LEDs for light irradiation. One compelling advantage of UV LEDs over conventional UV lamps is the production of light within ultraviolet to visible range, having narrow emission spectra allowing for separate assessment of specific wavelengths effects with respect to the different bandgap energies of the nanocomposite components [63]. The blank test confirmed that the photolysis was negligible without the catalyst, indicating the absence of self-sensitized photodegradation of the dye (see Appendix A, Figure A1).
The adsorption of MB onto the surface of the catalyst was monitored under dark conditions with constant stirring prior to any photocatalytic discoloration experiment. It was found that 1 h is more than enough time to establish the adsorption–desorption equilibrium. Moreover, the dark adsorption test indicated different adsorption abilities of tested samples as can be seen by following the full symbols in Figure 10a. The adsorbed amount of MB on the surface of the photocatalyst decreased with increasing content of Cu2O decorations on the WO3 surface. This result was somewhat counterintuitive since the specific surface area increased with the Cu2O concentration. Therefore, other factors governing dye adsorption should be considered. It can be expected that MB will be readily adsorbed on negatively charged surfaces because it is a cationic dye. According to [49], the pHZPC is 0.43 for WO3 and 8.53 for Cu2O. At the pH values above the pHZPC, M-O is the predominant charged species on the surface, while M-OH2+ species predominate at pH values below the pHZPC. Thus, under mild pH conditions, decoration of the negatively charged WO3 platelet surface by more positively charged Cu2O nanoparticles lowers the adsorption capacity of the catalyst. Indeed, this is observed for increasing Cu2O concentration up to the negligible adsorption of the Cu2O(10 wt %)/WO3 nanocomposite sample when nearly 100% of the dye molecules remained in the solution.
In Figure 10b–d, the normalized concentrations of MB dye are presented as ln ct/c0 for light irradiation at 377, 429, and 523 nm wavelengths, respectively. Pure WO3 had the lowest photocatalytic effect in the whole UV–VIS light irradiation range utilized in the experiment. For 377 nm (3.29 eV) and 429 nm (2.89 eV) wavelength irradiation, the presence of Cu2O in WO3 resulted in manifold enhanced photocatalytic activity compared to the pure WO3. In the case of 523 nm (2.37 eV) visible light irradiation, the photocatalytic effect was impeded for all samples due to the higher bandgap energy of WO3 (2.7 eV). The low population of disorder-induced states in the bandgap (cf. Figure 8) may have been responsible for the residual activity of pure WO3. On the other hand, the limited photocatalytic activity for 523 nm wavelength irradiation increased with increasing concentration of Cu2O, which was solely due to its lower bandgap energy (2.2 eV). Moreover, decoration of the surface of WO3 by Cu2O introduced a significant density of states in the bandgap, especially at higher concentrations of Cu2O (5% and 10%, cf. Figure 8).
It was observed that discoloration as the first step of degradation of MB dye followed pseudo-first-order kinetics. The discoloration rate constants of pure WO3 and Cu2O/WO3 nanocomposite samples were calculated, and they are summarized in Table 1. The discoloration rate of Cu2O(10.0 wt %)/WO3 at 377 nm was 3.3 times higher than that of pure WO3. The photocatalytic results indicate that the decoration of Cu2O with WO3 played a principal role in the activity of Cu2O/WO3 composite photocatalyst.

2.3. Photocatalytic Activity Mechanism

2.3.1. Role of Active Species

Absorption of a photon with a suitable wavelength with energy ≥Egs results in the generation of one electron e- in the CB leaving a hole h+ in the VB of the semiconductor. Both species may migrate to the surface of the material. These charged pairs may suffer futile recombination or react with the adsorbed molecules. The reducing power of the electron and the oxidizing power of the hole corresponds to the band edge energy ECB and EVB, respectively. If the reduction potential of e- is lower (i.e., closer to vacuum level) than the reduction potential of the adsorbate, reduction may occur. If the reduction potential of h+ is higher than the reduction potential of the adsorbate, oxidation may occur. Among many possible reactions, single-electron transfer processes are the most probable, while two- or four-electron processes requiring large overpotentials are not experienced. In a waterborne system, water molecule can be oxidized by h+ to produce OH (Equation (7)). Hydroxyl radical can be altered to oxide radical anion in a strongly basic (above pH = 11.9) aqueous medium (Equation (8)). When the system is run in the air atmosphere (providing at least some agitation and minimum level of aeration), O2 is usually the only reducible compound in the system (unless hydrogen peroxide is added as an external agent). Molecular oxygen is reduced to O2 according to Equation (9), usually with high quantum yield. Note that this reaction has the standard reduction potential independent of pH. Superoxide radical anion can be protonated at pH ≤ 4.8 according to reaction (10). Due to such consecutive protonation, the formation of hydroperoxyl radical is possible by electron transfer from the CB of the semiconductor to the dioxygen molecule according to Equation (11). This reaction has a higher standard reduction potential yet is pH-dependent. Therefore, the reaction (11) prevails over (9) only in the low pH range (occurring below 4.8). Hence, Equations (7) and (9) are the two possible primary steps in the photocatalytic reaction sequence if the system is at mild pH conditions [64,65].
h +   +   H 2 O     H +   +   O · H ,   E ° ( N H E ) (   OH ,   H + / H 2 O )   =   + 2.38   V
O · H   +   OH     H 2 O   + O ·   ,   pk a   =   11.7
e   +   O 2     O 2 · ,   E ° ( N H E ) ( O 2 / O 2 )   =   0.33   V
O 2 ·   +   H +     O 2 · H ,   pKa   =   4.8
e   +   O 2   +   H +   O 2 · H ,   E ° ( N H E ) ( O 2 ,   H + / O 2 H )   =   0.046   V
Thus, the main active species to be investigated for oxidation and reduction under mild pH conditions in aerated aqueous medium are h+, OH, and O2. The role of eventual direct reduction of substrates by e- needs to be considered as well.
The sorption of the substrate molecule on the surface of the catalyst (cf. Figure 10a in Section 2.2) may have implications towards the effect of proximity of the adsorbate cations to the OH and O2 in statu nascendi, i.e., these ROS could have practically instantaneous contact with the substrate molecule immediately after their creation. Another possibility would be direct oxidation or reduction of the adsorbed dye molecule. In the case of MB, the cation can be barely trapped by a positively charged hole and can provide an electron into the valence band, thus being oxidized. On the other hand, the MB cation is a good electron acceptor and maybe prone to direct reduction on the surface of a semiconductor. Nevertheless, the degradation of MB progressed beyond reversible reduction since no recoloration of the solutions was experienced, indicating that the minimum level of aeration was achieved or exceeded in our experiments [59,60,66].
To classify the charge transfer mechanism using analysis of the roles of active species in the photocatalytic reaction, we investigated the effect of MB photocatalytic discoloration after the introduction of scavengers into the reaction solution. Disodium ethylenediaminetetraacetate (EDTA), tert-butyl alcohol (t-butanol), and 1,4-benzoquinone (PBQ) for quenching holes, OH, and O2 were introduced to the system, respectively. Note the formation of H2O2 and singlet oxygen in Scheme 1, Scheme 2 and Scheme 3 is graphically depicted to keep completeness of the general framework of reaction sequences but their role is neither proved by the analysis nor discussed specifically.
First, the effect of the scavengers on the adsorption of the testing molecule must be examined. Equilibrated concentrations of MB in tested solutions after 1 h in the dark are plotted in Figure 10a by hollow symbols. The addition of the scavengers resulted in the enhancement of the adsorption of MB onto the surface of the photocatalyst. Moreover, here, the effect diminished with increasing concentration of the Cu2O in the nanocomposite.
The effect of the addition of scavengers selective for three major reducing and oxidizing species on MB dye discoloration rate is summarized in Figure 11, while the graphs corresponding to the individual discoloration tests are shown in the Appendix A (Figure A2, Figure A3 and Figure A4). Quenching of reactive species by respective scavengers suppresses the photocatalytic activity, and thus the reaction rate is lower. On the other hand, the adsorption of MB on the surface of the photocatalyst might promote the reaction rate. The discoloration tests with scavengers were performed not only for UV but also for the λ = 429 nm (2.89 eV) illumination. The discoloration rate constants obtained for visible light were comparable with those obtained for UV irradiation (see Table 1). Moreover, the same trends and effects of the scavenger addition were observed as for the 377 nm wavelength.
As can be seen from Figure 11, the photocatalytic discoloration rate of MB for pure WO3 photocatalyst decreased to an almost negligible level after the introduction of EDTA into the reaction solution. The effect is illustrated in Scheme 1. The almost complete inhibition of the reaction suggests that the MB dye discoloration proceeded through the oxidation pathway when pure WO3 was used. On the other hand, the addition of the other scavengers resulted in the enhancement of the reaction rate for pure WO3 catalyst. This could have been due to their positive effect on the MB adsorption on the WO3 surface. Since blocking of holes also blocks the formation of reactive oxide species through the oxidative pathway, the observed photocatalytic activity for Cu2O(x wt %)/WO3 nanocomposites must proceed through the reduction pathway initiated by the excited electrons.
The reaction pathway for tert-butyl alcohol (TBA) is illustrated in Scheme 2. When TBA is introduced as an OH radical scavenger into the reaction solution, the overall photocatalytic activity of the pristine WO3 is enhanced, but the same rate constant value was obtained for all other samples (cf. Figure 11). Inhibition of photocatalytic activity due to the blocking of OH was concluded for Cu2O/WO3 systems. Thus, this result implied for materials with Cu2O that OH radicals had a significant contribution towards dye degradation. Moreover, the effect increased with increasing concentration of Cu2O. In the case of pristine WO3, the inhibition effect could be outweighed by the effect of increased dye adsorption. It can also be hypothesized that TBA effectively scavenged hydroxyl radicals and then controlled the discoloration rate by a reaction with MB on its own timescale, thus dictating the same rate constant to all experiments [67]. Nonetheless, the observation confirmed the active role of hydroxyl radical for all tested catalysts.
For superoxide ion (O2) quenching, PBQ as a scavenger was added to the reaction solution. The principle of its effect is illustrated in Scheme 3. As seen in Scheme 3, the addition of PBQ resulted in an overall increase of photocatalytic activity but gradually reduced with an increasing concentration of Cu2O in the nanocomposite. This result was counterintuitive. It should be noted that the superoxide anion was the first one in the cascade of the ROS formation. Thus, the reductive path of degradation was blocked from the very beginning. The role of this blocking effect would increase with the concentration of Cu2O, and this was indeed observed. On the contrary, the oxidative pathway would not be influenced by the PBQ and even enhanced due to increased MB adsorption (as observed, cf. Figure 10a). A compromise between these two effects would explain the maximum rate observed for Cu2O(1 wt %)/WO3 nanocomposite.

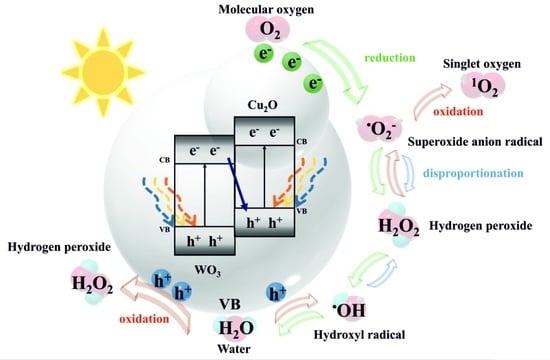
2.3.2. A Proposed Electron–Hole Transfer Mechanism

It is known that photo-excited holes and electrons migrate to the surface of the photocatalyst and react either directly with the adsorbed reactants or with solvent molecules to produce ROS mediating the degradation. The nanosize of prepared particles suppresses futile electron–hole volume recombinations which is favorable for photocatalytic purposes. In the case of multiple-phase systems, the interfacial charge transfer mechanism plays a critical role. By taking into the account electronic band structures of Cu2O (Eg = 2.2) and WO3 (Eg = 2.7), and the contribution of scavengers to the observed photocatalytic activity, we examined a possible charge transfer mechanism for Cu2O and WO3. In principle, the band edge alignment of Cu2O/WO3 enables two possible routes of the charge carrier transfer between the two semiconductor phases, as shown in Scheme 4. If the transfer of electrons and holes takes place according to Scheme 4a (type-II), then the photo-excited electrons and holes will transfer to the conduction band (CB) of WO3 and valence band (VB) of Cu2O, respectively. In this type-II transfer mode, the electrons accumulated in CB of WO3 cannot reduce O2 molecules to yield O2•− radical because CB edge potential of WO3 (−0.11 V vs. NHE at pH = 6) is more positive than the reduction potential of E(O2/O2•−) (−0.33 V vs. NHE at pH = 6). Similarly, the accumulated holes in VB of Cu2O cannot oxidize H2O molecules to yield OH radicals because the VB edge potential of Cu2O (1.10 V at pH = 6) is less than the reduction potential of E (OH, H+/H2O) (2.03 V vs. NHE at pH = 6). However, from the photocatalytic activity analysis, we observed that OH radicals played a role, and O2•− also contributed towards catalytic reaction. Thus, it can be inferred that the charge transfer mode was not in accordance with the type-II mode but followed a Z-scheme mode illustrated in Scheme 4b. In the Z-scheme mode, photo-excited electrons from CB of WO3 combined with the holes of Cu2O, while the photo-excited electrons with high reducing ability and holes with high oxidizing ability were left on the surface of Cu2O and WO3, respectively. Therefore, the holes in WO3 with sufficient reduction potential (2.59 V vs. NHE at pH = 6) efficiently oxidized water molecules producing OH. These hydroxyl radicals were further active in the MB discoloration in the solution. On the other hand, the electrons in the conduction band of Cu2O had reduction potential (−1.10 V vs. NHE at pH = 6) sufficient for reduction of O2 to yield O2•− radicals, which then played a major role towards MB dye degradation through the reductive pathway. A direct reduction of MB by these electrons would also be possible. Accordingly, the actual transfer mode followed the mechanism sketched in Scheme 4b. In other words, the Cu2O/WO3 nanocomposite exhibited direct-Z-scheme charge transfer mode of photocatalytic action under our experimental conditions.

3. Materials and Methods

3.1. Materials

All the chemicals used in the experiments were of analytically pure grade and were purchased from Sigma-Aldrich Co., Ltd. They were used as received without further purification, except the tungsten powder, which was provided by ISS Nippon Kayaku group. All the solutions were prepared with demineralized water.

3.2. Synthesis of WO3 Nanoplates

Two-dimensional WO3 nanoplates were synthesized via a two-step method. In the first step, peroxotungstic acid ([WO2(O2)H2O]·nH2O, PTA) to be used as a precursor was prepared by recrystallization from the solution obtained by dissolving 2 g of tungsten powder in 20 mL of H2O2 (about 32–35 wt %). Tungsten powder dissolved quickly under vigorous stirring and at elevated temperature (50–60 °C), resulting in a transparent solution. Evaporation of the preceding prepared solution in a hot air oven at a temperature of 90 °C resulted in a white crystalline PTA precursor material. Pure two-dimensional WO3 nanoplates were obtained by thermal decomposition of the precursor at 550 °C for 1 h in an open-air atmosphere in the second step.

3.3. Synthesis of Cu2O/WO3 Photocatalyst

The preparation of Cu2O/WO3 photocatalyst nanocomposites was carried out by solid-state method. The process used was as follows. Initially, an appropriate amount of copper acetate as a precursor and 0.5 g of WO3 were mixed and ground together in an agate mortar for about 10 min until a uniform mixture was obtained. The powdered mixture was then transferred to an alumina crucible with a cover and calcined by heating the samples, starting from room temperature to 400 °C. The samples were kept at 400 °C for 5 min to achieve sufficient crystallinity. The heating rate of the muffle furnace was set at 50 °C/min. Finally, different Cu2O(x wt %)/WO3 nanocomposites (x = 1.0, 5.0, 10.0) were obtained.

3.4. Photoreaction Apparatus, Procedure, and Analysis

The photocatalytic activity of the prepared Cu2O/WO3 nanocomposites was evaluated by monitoring discoloration of MB under LED irradiation as follows. Initially, 10 mg of each prepared Cu2O/WO3 photocatalyst with different Cu2O wt % was dispersed in 12 mL aqueous solution of the MB, having the concentration of 3.5 mg/L (denoted as cinit), and stirred for 1 h to establish equilibrium between adsorption–desorption of dye onto the surface of the photocatalysts. The dark equilibrium MB concentration is denoted as c0, which is the actual concentration of MB in the testing solution at the start of the experiment (at the time zero, t = 0 min). Afterward, LED irradiation (Roithner LaserTechnik, UVLUX 340-HL-3) with maxima wavelengths of 377 nm (FWHM 15 nm), 429 nm (FWHM 15 nm), and 523 nm (FWHM 43 nm) was switched on and the solution was kept under continuous magnetic stirring. The spectra of used LEDs are shown in the Appendix A (Figure A5). Discoloration of the model dye solution was monitored in 60 min intervals. During the experiment, the temperature was maintained at 25 °C. To investigate the role of active species in the photocatalytic process, we used disodium ethylenediaminetetraacetate (EDTA, as a hole scavenger), tert-butyl alcohol (TBA, as a hydroxyl radical scavenger), and 1,4-benzoquinone (PBQ, as an O2•− scavenger).
The concentration of MB dye in the solution was determined by routine absorbance measurements in the range 400–800 nm. The discoloration rate constant of MB solution was calculated from Equation (1) as a function of time:
ln ( c t / c 0 ) = k · t ,
where ln is the natural logarithm, c0 is the actual equilibrated concentration of MB in the solution at the start of light irradiation, and ct stands for the concentration of MB after irradiation time t.
The initial pH of the stock solution was 6.4. The pH decreased slightly after the addition of the catalyst powder to 5.9. The variation during the course of reactions was not significant and did not decrease during the photocatalysis. The highest measured pH after completion of the procedure was 6.1. The differences between various catalysts samples varied within this interval. Therefore, the work with dispersions and solutions was conducted at natural conditions and the pH of used liquids was not controlled by the addition of buffers. The value pH = 6 was taken into consideration of the reaction conditions. The experiments were performed under air atmosphere which includes dissolution of air gasses as oxygen and CO2.

3.5. Analytical Instruments and Procedures

X-ray diffraction was carried out to determine the crystal phase composition of all samples using XRD diffractometer MiniFlex600 (Japan, RIGAKU) with Co cathode and a scanning speed of 3° min−1. The voltage and emission current were set to 40 kV and 30 mA, respectively. Crystallite size was estimated according to the well-known Scherrer formula d = Kλ/βcosθ using the approximation of spherical crystallite shape (d is the diameter and the shape factor K is 0.9) since no preferential orientation was observed. The wavelength of used radiation is λ(CoKα1,2) = 0.179 nm, the angle θ is one half of the 2θ of the corresponding diffraction line, and β is the line broadening at half the maximum intensity corrected for the instrumental response [27]. The morphology of the as-prepared photocatalyst nanocomposites was observed by using a NovaNanoSEM 450 scanning electron microscope (The Netherland, FEI Company) operated at an accelerating voltage of 5 kV, and a JEM-2100 transmission electron microscope (Jeol Ltd., Japan) operated at an acceleration voltage of 200 kV. UV–VIS diffuse reflectance spectroscopy measurements were carried by using a Perkin Elmer UV/VIS/NIR spectrophotometer Lambda 1050 (PerkinElmer Inc., United States) equipped with an integrating sphere. Combined thermogravimetric analysis (TG) and differential scanning calorimetry (DSC) were performed by using TGA/SDTA8 (Setaram, France) from 25 °C to 600 °C at a heating rate of 5 °C min−1 under dynamic air atmosphere 60 sccm flow. The Raman spectra were collected by dispersive Raman microscope Nicolet DXR (Thermo Scientific, United States) using the excitation by the 532 nm laser operated at 0.1 mW. The specific surface area and pore diameter distribution were obtained via a multipoint BET and BJH (Barrett-Joyner-Halenda) analysis of the nitrogen adsorption/desorption isotherms at 77 K recorded by the Belsorp-mini II (BEL Japan, Inc.) apparatus.

4. Conclusions

Direct Z-scheme Cu2O(x wt %)/WO3 nanocomposite photocatalysts were prepared by a facile solid-state reaction using pre-synthesized WO3 and copper acetate as a precursor. Crystalline WO3 nanoplates were decorated by Cu2O nanoparticles in different concentrations. The method avoids reliable formation of CuWO4 phase, which is otherwise encountered when using wet syntheses. The photocatalytic activity of Cu2O(x wt %)/WO3 was much higher than that of pure WO3. The addition of Cu2O also extended the photocatalytic activity of the nanocomposite significantly to the visible range. The discoloration rate constants were of comparable value for 429 nm as for 377 nm. Moreover, the lower bandgap of the Cu2O phase enabled measurable activity enhancement even at 523 nm. The photocatalytic mechanism was examined by using scavengers selectively blocking active species in both oxidative and reductive degradation paths. The presence of a suitable interfacial contact and direct Z-scheme charge carrier transfer route was revealed. The adsorption of the tested dye molecule was identified as an important factor as well.

Author Contributions

Conceptualization, M.M. (Michal Machovsky) and I.K.; formal analysis, M.M. (Milan Masar); funding acquisition, M.M. (Michal Machovsky); investigation, H.A., A.C.G., M.M. (Milan Masar), P.U., M.U., D.S., and P.S.; methodology, M.M. (Milan Masar) and M.U.; resources, I.K.; supervision, M.M. (Michal Machovsky) and I.K.; visualization, M.M. (Milan Masar); writing—original draft, H.A.; writing—review and editing, D.G. and I.K. All authors have read and agreed to the published version of the manuscript.

Funding

This research obtained funding from the Ministry of Education, Youth and Sports of the Czech Republic in the frame of the project LTT20010. This article was written with support of Operational Program Research and Development for Innovations co-funded by the European Regional Development Fund (ERDF) and national budget of Czech Republic, within the framework of project CPS-strengthening research capacity (reg. number: CZ.1.05/2.1.00/19.0409).

Data Availability Statement

Not applicable.

Acknowledgments

Tomas Bata University in Zlin is acknowledged for all support provided in kind.

Conflicts of Interest

The authors declare no conflict of interest.

Appendix A. Figures

Figure A1. The negligible photolysis of MB solution (without catalyst) at 377 nm irradiation.
Catalysts 11 00293 g0a1
Figure A2. MB dye discoloration for as-prepared photocatalysts in the presence of EDTA scavenger: (a) 377 nm LED; (b) 429 nm LED.
Catalysts 11 00293 g0a2
Figure A3. MB dye discoloration for as-prepared photocatalysts in presence of TBA scavenger: (a) 377 nm LED; (b) 429 nm LED.
Catalysts 11 00293 g0a3
Figure A4. MB dye discoloration for as-prepared photocatalysts in presence of PBQ scavenger: (a) 377 nm LED; (b) 429 nm LED.
Catalysts 11 00293 g0a4
Figure A5. The emission spectra of used LEDs for photocatalytic experiments.
Catalysts 11 00293 g0a5

References

  1. Solís, R.R.; Bedia, J.; Rodríguez, J.J.; Belver, C. A review on alkaline earth metal titanates for applications in photocatalytic water purification. Chem. Eng. J. 2021, 409, 128110. [Google Scholar] [CrossRef]
  2. Xu, Q.; Zhang, L.; Yu, J.; Wageh, S.; Al-Ghamdi, A.A.; Jaroniec, M. Direct Z-scheme photocatalysts: Principles, synthesis, and applications. Mater. Today 2018, 21, 1042–1063. [Google Scholar] [CrossRef]
  3. Huang, Z.; Sun, Q.; Lv, K.; Zhang, Z.; Li, M.; Li, B. Effect of contact interface between TiO2 and g-C3N4 on the photoreactivity of g-C3N4/TiO2 photocatalyst: (0 0 1) vs (1 0 1) facets of TiO2. Appl. Catal. B Environ. 2015, 164, 420–427. [Google Scholar] [CrossRef]
  4. Chen, S.; Hu, Y.; Ji, L.; Jiang, X.; Fu, X. Preparation and characterization of direct Z-scheme photocatalyst Bi2O3/NaNbO3 and its reaction mechanism. Appl. Surf. Sci. 2014, 292, 357–366. [Google Scholar] [CrossRef]
  5. Ng, B.; Putri, L.K.; Kong, X.Y.; Teh, Y.W.; Pasbakhsh, P.; Chai, S. Z-Scheme Photocatalytic Systems for Solar Water Splitting. Adv. Sci. 2020, 7, 1903171. [Google Scholar] [CrossRef]
  6. Ong, C.B.; Ng, L.Y.; Mohammad, A.W. A review of ZnO nanoparticles as solar photocatalysts: Synthesis, mechanisms and applications. Renew. Sustain. Energy Rev. 2018, 81, 536–551. [Google Scholar] [CrossRef]
  7. Dong, P.; Hou, G.; Xi, X.; Shao, R.; Dong, F. WO3-based photocatalysts: Morphology control, activity enhancement and multifunctional applications. Environ. Sci. Nano 2017, 4, 539–557. [Google Scholar] [CrossRef]
  8. Hitam, C.; Jalil, A. A review on exploration of Fe2O3 photocatalyst towards degradation of dyes and organic contaminants. J. Environ. Manag. 2020, 258, 110050. [Google Scholar] [CrossRef] [PubMed]
  9. Li, H.; Tu, W.; Zhou, Y.; Zou, Z. Z-Scheme Photocatalytic Systems for Promoting Photocatalytic Performance: Recent Progress and Future Challenges. Adv. Sci. 2016, 3, 1500389. [Google Scholar] [CrossRef] [Green Version]
  10. Yuan, L.; Han, C.; Yang, M.-Q.; Xu, Y.-J. Photocatalytic water splitting for solar hydrogen generation: Fundamentals and recent advancements. Int. Rev. Phys. Chem. 2016, 35, 1–36. [Google Scholar] [CrossRef]
  11. Chauhan, A.; Rastogi, M.; Scheier, P.; Bowen, C.; Kumar, R.V.; Vaish, R. Janus nanostructures for heterogeneous photocatalysis. Appl. Phys. Rev. 2018, 5, 041111. [Google Scholar] [CrossRef] [Green Version]
  12. Gong, H.; Zhang, Y.; Cao, Y.; Luo, M.; Feng, Z.; Yang, W.; Liu, K.; Cao, H.; Yan, H. Pt@Cu2O/WO3 composite photocatalyst for enhanced photocatalytic water oxidation performance. Appl. Catal. B Environ. 2018, 237, 309–317. [Google Scholar] [CrossRef]
  13. Wan, J.; Du, X.; Liu, E.; Hu, Y.; Fan, J.; Hu, X. Z-scheme visible-light-driven Ag3PO4 nanoparticle@MoS2 quantum dot/few-layered MoS2 nanosheet heterostructures with high efficiency and stability for photocatalytic selective oxidation. J. Catal. 2017, 345, 281–294. [Google Scholar] [CrossRef]
  14. Jo, W.-K.; Natarajan, T.S. Facile Synthesis of Novel Redox-Mediator-free Direct Z-Scheme CaIn2S4 Marigold-Flower-like/TiO2 Photocatalysts with Superior Photocatalytic Efficiency. ACS Appl. Mater. Interfaces 2015, 7, 17138–17154. [Google Scholar] [CrossRef]
  15. Zhang, J.; Hu, Y.; Jiang, X.; Chen, S.; Meng, S.; Fu, X. Design of a direct Z-scheme photocatalyst: Preparation and characterization of Bi2O3/g-C3N4 with high visible light activity. J. Hazard. Mater. 2014, 280, 713–722. [Google Scholar] [CrossRef]
  16. Wei, S.; Ma, Y.; Chen, Y.; Liu, L.; Liu, Y.; Shao, Z. Fabrication of WO3/Cu2O composite films and their photocatalytic activity. J. Hazard. Mater. 2011, 194, 243–249. [Google Scholar] [CrossRef]
  17. Jo, W.-K.; Lee, J.Y.; Natarajan, T.S. Fabrication of hierarchically structured novel redox-mediator-free ZnIn2S4 marigold flower/Bi2WO6 flower-like direct Z-scheme nanocomposite photocatalysts with superior visible light photocatalytic efficiency. Phys. Chem. Chem. Phys. 2016, 18, 1000–1016. [Google Scholar] [CrossRef]
  18. Chen, S.; Ji, L.; Tang, W.; Fu, X. Fabrication, characterization and mechanism of a novel Z-scheme photocatalyst NaNbO3/WO3 with enhanced photocatalytic activity. Dalton Trans. 2013, 42, 10759–10768. [Google Scholar] [CrossRef]
  19. Wang, S.; Zhu, B.; Liu, M.; Zhang, L.; Yu, J.; Zhou, M. Direct Z-scheme ZnO/CdS hierarchical photocatalyst for enhanced photocatalytic H2-production activity. Appl. Catal. B Environ. 2019, 243, 19–26. [Google Scholar] [CrossRef]
  20. Fang, X.; Zhai, T.; Gautam, U.K.; Li, L.; Wu, L.; Bando, Y.; Golberg, D. ZnS nanostructures: From synthesis to applications. Prog. Mater. Sci. 2011, 56, 175–287. [Google Scholar] [CrossRef]
  21. Hao, J.; Qi, B.; Wei, J.; Li, D.; Zeng, F. A Z-scheme Cu2O/WO3 heterojunction for production of renewable hydrocarbon fuel from carbon dioxide. Fuel 2021, 287, 119439. [Google Scholar] [CrossRef]
  22. Toe, C.Y.; Scott, J.; Amal, R.; Ng, Y.H. Recent advances in suppressing the photocorrosion of cuprous oxide for photocatalytic and photoelectrochemical energy conversion. J. Photochem. Photobiol. C Photochem. Rev. 2019, 40, 191–211. [Google Scholar] [CrossRef]
  23. Monllor-Satoca, D.; Borja, L.; Rodes, A.; Gómez, R.; Salvador, P. Photoelectrochemical Behavior of Nanostructured WO3 Thin-Film Electrodes: The Oxidation of Formic Acid. ChemPhysChem 2006, 7, 2540–2551. [Google Scholar] [CrossRef]
  24. Zheng, J.Y.; Kim, C.W.; Pawar, A.U.; Kang, Y.S. Fabrication of p-Cu2O/n-Bi-WO3heterojunction thin films: Optical and photoelectrochemical properties. New J. Chem. 2016, 41, 755–762. [Google Scholar] [CrossRef]
  25. Minggu, L.J.; Ng, K.H.; Kadir, H.A.; Bin Kassim, M. Bilayer n-WO3/p-Cu2O photoelectrode with photocurrent enhancement in aqueous electrolyte photoelectrochemical reaction. Ceram. Int. 2014, 40, 16015–16021. [Google Scholar] [CrossRef]
  26. Zhang, J.; Ma, H.; Liu, Z. Highly efficient photocatalyst based on all oxides WO3/Cu2O heterojunction for photoelectrochemical water splitting. Appl. Catal. B Environ. 2017, 201, 84–91. [Google Scholar] [CrossRef]
  27. Shi, W.; Guo, X.; Cui, C.; Jiang, K.; Li, Z.; Qu, L.; Wang, J.-C. Controllable synthesis of Cu2O decorated WO3 nanosheets with dominant (0 0 1) facets for photocatalytic CO2 reduction under visible-light irradiation. Appl. Catal. B Environ. 2019, 243, 236–242. [Google Scholar] [CrossRef]
  28. Li, L.; Zhao, J.; Wang, Y.; Li, Y.; Ma, D.; Zhao, Y.; Hou, S.; Hao, X. Oxalic acid mediated synthesis of WO3·H2O nanoplates and self-assembled nanoflowers under mild conditions. J. Solid State Chem. 2011, 184, 1661–1665. [Google Scholar] [CrossRef]
  29. Mohamed, M.M.; Salama, T.M.; Hegazy, M.; Shahba, R.M.A.; Mohamed, S. Synthesis of hexagonal WO3 nanocrystals with various morphologies and their enhanced electrocatalytic activities toward hydrogen evolution. Int. J. Hydrogen Energy 2019, 44, 4724–4736. [Google Scholar] [CrossRef]
  30. Su, X.; Xiao, F.; Li, Y.; Jian, J.; Sun, Q.; Wang, J. Synthesis of uniform WO3 square nanoplates via an organic acid-assisted hydrothermal process. Mater. Lett. 2010, 64, 1232–1234. [Google Scholar] [CrossRef]
  31. Murau, P.C. Dissolution of Tungsten by Hydrogen Peroxide. Anal. Chem. 1961, 33, 1125–1126. [Google Scholar] [CrossRef]
  32. Kudo, T. A new heteropolyacid with carbon as a heteroatom in a Keggin-like structure. Nat. Cell Biol. 1984, 312, 537–538. [Google Scholar] [CrossRef]
  33. Okamoto, H.; Ishikawa, A.; Kudo, T. Amorphous and Crystalline Peroxopolytungstic Acids Formed from Tungsten and Hydrogen Peroxide. Bull. Chem. Soc. Jpn. 1989, 62, 2723–2724. [Google Scholar] [CrossRef] [Green Version]
  34. Hill, J.C.; Choi, K.-S. Synthesis and characterization of high surface area CuWO4 and Bi2WO6 electrodes for use as photoanodes for solar water oxidation. J. Mater. Chem. A 2013, 1, 5006–5014. [Google Scholar] [CrossRef]
  35. Gillman, P.K. CNS toxicity involving methylene blue: The exemplar for understanding and predicting drug interactions that precipitate serotonin toxicity. J. Psychopharmacol. 2010, 25, 429–436. [Google Scholar] [CrossRef]
  36. Pecquenard, B.; Castro-Garcia, S.; Livage, J.; Zavalij, P.Y.; Whittingham, M.S.; Thouvenot, R. Structure of Hydrated Tungsten Peroxides [WO2(O2)H2O]·nH2O. Chem. Mater. 1998, 10, 1882–1888. [Google Scholar] [CrossRef]
  37. Zheng, H.; Ou, J.Z.; Strano, M.S.; Kaner, R.B.; Mitchell, A.; Kalantar-Zadeh, K. Nanostructured Tungsten Oxide—Properties, Synthesis, and Applications. Adv. Funct. Mater. 2011, 21, 2175–2196. [Google Scholar] [CrossRef]
  38. Sharbatdaran, M.; Novinrooz, A.; Noorkojouri, H. Preparation and characterization of WO3 electrochromic films obtained by the sol-gel process, Iran. J. Chem. Chem. Eng. 2006, 25, 25–29. [Google Scholar]
  39. Boulova, M.; Lucazeau, G. Crystallite Nanosize Effect on the Structural Transitions of WO3 Studied by Raman Spectroscopy. J. Solid State Chem. 2002, 167, 425–434. [Google Scholar] [CrossRef]
  40. Su, C.-Y.; Lin, H.-C.; Lin, C.-K. Fabrication and optical properties of Ti-doped W18O49 nanorods using a modified plasma-arc gas-condensation technique. J. Vac. Sci. Technol. B Microelectron. Nanometer Struct. 2009, 27, 2170. [Google Scholar] [CrossRef]
  41. Ohtani, B.; Ogawa, A.Y.; Nishimoto, S.-I. Photocatalytic Activity of Amorphous−Anatase Mixture of Titanium(IV) Oxide Particles Suspended in Aqueous Solutions. J. Phys. Chem. B 1997, 101, 3746–3752. [Google Scholar] [CrossRef] [Green Version]
  42. Amano, F.; Nogami, K.; Tanaka, M.; Ohtani, B. Correlation between Surface Area and Photocatalytic Activity for Acetaldehyde Decomposition over Bismuth Tungstate Particles with a Hierarchical Structure. Langmuir 2010, 26, 7174–7180. [Google Scholar] [CrossRef] [PubMed]
  43. Sedlak, J.; Kuritka, I.; Masar, M.; Machovsky, M.; Urbanek, P.; Bazant, P.; Janota, P.; Dvorackova, M. Contributions of morphological and structural parameters at different hierarchical morphology levels to photocatalytic activity of mesoporous nanostructured ZnO. Appl. Surf. Sci. 2020, 513, 145773. [Google Scholar] [CrossRef]
  44. Sing, K.S.; Williams, R.T. Physisorption Hysteresis Loops and the Characterization of Nanoporous Materials. Adsorpt. Sci. Technol. 2004, 22, 773–782. [Google Scholar] [CrossRef]
  45. Makuła, P.; Pacia, M.; Macyk, W. How to Correctly Determine the Band Gap Energy of Modified Semiconductor Photocatalysts Based on UV–Vis Spectra. J. Phys. Chem. Lett. 2018, 9, 6814–6817. [Google Scholar] [CrossRef] [Green Version]
  46. Schevciw, O.; White, W.B. The optical absorption edge of rare earth sesquisulfides and alkaline earth—Rare earth sulfides. Mater. Res. Bull. 1983, 18, 1059–1068. [Google Scholar] [CrossRef]
  47. Köferstein, R.; Jäger, L.; Ebbinghaus, S.G. Magnetic and optical investigations on LaFeO3 powders with different particle sizes and corresponding ceramics. Solid State Ion. 2013, 249–250, 1–5. [Google Scholar] [CrossRef] [Green Version]
  48. Nagy, D.D.; Szilágyi, I.M.; Fan, X. Effect of the morphology and phases of WO3 nanocrystals on their photocatalytic efficiency. RSC Adv. 2016, 6, 33743–33754. [Google Scholar] [CrossRef] [Green Version]
  49. Xu, Y.; Schoonen, M.A. The absolute energy positions of conduction and valence bands of selected semiconducting minerals. Am. Miner. 2000, 85, 543–556. [Google Scholar] [CrossRef]
  50. Khiavi, N.D.; Katal, R.; Eshkalak, S.K.; Masudy-Panah, S.; Ramakrishna, S.; Jiangyong, H. Visible Light Driven Heterojunction Photocatalyst of CuO–Cu2O Thin Films for Photocatalytic Degradation of Organic Pollutants. Nanomaterials 2019, 9, 1011. [Google Scholar] [CrossRef] [Green Version]
  51. Davis, E.A.; Mott, N.F. Conduction in non-crystalline systems V. Conductivity, optical absorption and photoconductivity in amorphous semiconductors. Philos. Mag. 1970, 22, 0903–0922. [Google Scholar] [CrossRef]
  52. Adachi, S. Properties of Group-IV, III-V and II-VI Semiconductors. In Wiley Series in Materials for Electronic and Optoelectronic Applications; John Wiley & Sons Ltd: Chichester, UK, 2005. [Google Scholar]
  53. Butler, M.A.; Ginley, D.S. Prediction of Flatband Potentials at Semiconductor-Electrolyte Interfaces from Atomic Electronegativities. J. Electrochem. Soc. 1978, 125, 228–232. [Google Scholar] [CrossRef]
  54. Kramida, A.; Ralchenko, Y.; Reader, J. NIST Atomic Spectra Database Team, NIST Atomic Spectra Database (Version 5.8); National Institute of Standards and Technology: Gaithersburg, MD, USA, 2020. [CrossRef]
  55. Bartmess, J.E. Negative Ion Energetics Data. In NIST Chemistry WebBook, NIST Stand. Ref. Database Number 69; Linstrom, P.J., Mallard, W.G., Eds.; National Institute of Standards and Technology: Gaithersburg, MD, USA, 2021; p. 20899. [Google Scholar]
  56. Mulliken, R.S. A New Electroaffinity Scale; Together with Data on Valence States and on Valence Ionization Potentials and Electron Affinities. J. Chem. Phys. 1934, 2, 782–793. [Google Scholar] [CrossRef]
  57. Stevanović, V.; Lany, S.; Ginley, D.S.; Tumas, W.; Zunger, A. Assessing capability of semiconductors to split water using ionization potentials and electron affinities only. Phys. Chem. Chem. Phys. 2014, 16, 3706–3714. [Google Scholar] [CrossRef]
  58. Barbero, N.; Vione, D. Why Dyes Should Not Be Used to Test the Photocatalytic Activity of Semiconductor Oxides. Environ. Sci. Technol. 2016, 50, 2130–2131. [Google Scholar] [CrossRef]
  59. Mills, A.; Wang, J. Photobleaching of methylene blue sensitised by TiO2: An ambiguous system? J. Photochem. Photobiol. A Chem. 1999, 127, 123–134. [Google Scholar] [CrossRef]
  60. Houas, A. Photocatalytic degradation pathway of methylene blue in water. Appl. Catal. B Environ. 2001, 31, 145–157. [Google Scholar] [CrossRef]
  61. International Organization for Standardization. Fine Ceramics (Advanced Ceramics, Advanced Technical Ceramics)—Determination of Photocatalytic Activity of Surfaces in an Aqueous Medium by Degradation of Methylene Blue; International Standard Organization: Geneva, Switzerland, 2010. [Google Scholar]
  62. Mills, A.; Hill, C.; Robertson, P.K. Overview of the current ISO tests for photocatalytic materials. J. Photochem. Photobiol. A Chem. 2012, 237, 7–23. [Google Scholar] [CrossRef]
  63. Tokode, O.; Prabhu, R.; Lawton, L.A.; Robertson, P.K.J. UV LED Sources for Heterogeneous Photocatalysis; Springer International Publishing: Berlin/Heidelberg, Germany, 2014; pp. 159–179. [Google Scholar]
  64. Nosaka, Y.; Nosaka, A.Y. Generation and Detection of Reactive Oxygen Species in Photocatalysis. Chem. Rev. 2017, 117, 11302–11336. [Google Scholar] [CrossRef]
  65. Wood, P.M. The potential diagram for oxygen at pH 7. Biochem. J. 1988, 253, 287–289. [Google Scholar] [CrossRef] [PubMed]
  66. De Tacconi, N.R.; Carmona, J.; Rajeshwar, K. Reversibility of Photoelectrochromism at the TiO2/Methylene Blue Interface. J. Electrochem. Soc. 1997, 144, 2486–2490. [Google Scholar] [CrossRef]
  67. Wardman, P. Reduction Potentials of One-Electron Couples Involving Free Radicals in Aqueous Solution. J. Phys. Chem. Ref. Data 1989, 18, 1637–1755. [Google Scholar] [CrossRef] [Green Version]
Figure 1. XRD patterns of (a) peroxotungstic acid precursor, (b) pristine WO3, (c) Cu2O(1.0 wt %)/WO3, (d) Cu2O(5.0 wt %)/WO3, and (e) Cu2O(10.0 wt %)/WO3. Inset in the right panel shows the development of peaks related to (111), (200), and (220) planes of Cu2O.
Catalysts 11 00293 g001
Figure 2. Thermogravimetric (TG)/differential scanning calorimetry (DSC) analysis of peroxotungstic acid precursor (PTA) (WO3 precursor). The red line and black line denote TGA and DSC, respectively.
Catalysts 11 00293 g002
Figure 3. Raman spectra of pure WO3 and prepared Cu2O/WO3 samples at different wt % concentrations.
Catalysts 11 00293 g003
Figure 4. SEM images of (a) peroxotungstic acid precursor, (b) pristine WO3, (c) Cu2O(1.0 wt %)/WO3, (d) Cu2O(5.0 wt %)/WO3, and (e) Cu2O(10.0 wt %)/WO3.
Catalysts 11 00293 g004
Figure 5. TEM images of (a) pristine WO3, (b) Cu2O(1.0 wt %)/WO3, (c) Cu2O(5.0 wt %)/WO3, and (d) Cu2O(10.0 wt %)/WO3.
Catalysts 11 00293 g005
Figure 6. Nitrogen adsorption–desorption isotherms of as-prepared photocatalysts.
Catalysts 11 00293 g006
Figure 7. The pore size distribution of as-prepared photocatalysts.
Catalysts 11 00293 g007
Figure 8. Plots of (ahv)2 vs. photon energy (hv) for different as-prepared samples. The inset shows obtained optical band energies of samples.
Catalysts 11 00293 g008
Figure 9. Photographs of as-prepared photocatalysts.
Catalysts 11 00293 g009
Figure 10. Summary of photocatalytic activity testing: (a) adsorption–desorption equilibrium of prepared samples including the effects of scavengers addition; (b) methylene blue (MB) dye discoloration for as-prepared photocatalysts at 377 nm; (c) MB dye discoloration for as-prepared photocatalysts at 429 nm; (d) MB dye discoloration for as-prepared photocatalysts at 523 nm. Note: the graphs comprising the results of the corresponding discoloration experiments with scavengers are in the Appendix A (Figure A2, Figure A3 and Figure A4).
Catalysts 11 00293 g010
Figure 11. Summary of effects of a series of scavengers on the discoloration rate constant of MB dye for as prepared photocatalysts.
Catalysts 11 00293 g011
Scheme 1. Schematic diagram of disodium ethylenediaminetetraacetate (EDTA) scavenger-blocking mechanism.
Catalysts 11 00293 sch001
Scheme 2. Schematic diagram of tert-butyl alcohol (t-butanol) scavenger-blocking mechanism.
Catalysts 11 00293 sch002
Scheme 3. Schematic diagram of p-benzoquinone scavenger-blocking mechanism.
Catalysts 11 00293 sch003
Scheme 4. Energy band diagram of the possible Cu2O/WO3 heterojunction types with the illustration of the electron–hole transfer mechanisms. The values of band edge potentials and reduction potentials are given at pH = 6. The diagram (a) depicts type-II junction, and diagram (b) depicts direct Z-scheme.
Catalysts 11 00293 sch004
Table 1. Summary of discoloration rate constants for all performed tests.
Pure WO3Cu2O(1.0 wt %)/WO3Cu2O(5.0 wt %)/WO3Cu2O(10.0 wt %)/WO3
Rate constant k × 10−3 min−1; LED with wavelength 377 nm
No scavenger0.9 ± 0.062.1 ± 0.052.4 ± 0.093.1 ± 0.06
EDTA0.2 ± 0.011.4 ± 0.082.2 ± 0.073.4 ± 0.14
t-butOH1.4 ± 0.101.6 ± 0.061.5 ± 0.061.5 ± 0.07
PBQ1.8 ± 0.063.2 ± 0.302.8 ± 0.101.9 ± 0.08
Rate constant k × 10−3 min−1; LED with wavelength 429 nm
No scavenger1.5 ± 0.061.9 ± 0.041.9 ± 0.032.6 ± 0.06
EDTA0.3 ± 0.021.1 ± 0.032.0 ± 0.112.8 ± 0.17
t-butOH1.6 ± 0.051.9 ± 0.171.8 ± 0.071.7 ± 0.02
PBQ0.5 ± 0.082.4 ± 0.102.5 ± 0.152.8 ± 0.26
Rate constant k × 10−3 min−1; LED with wavelength 523 nm
No scavenger0.1 ± 0.010.6 ± 0.030.3 ± 0.020.3 ± 0.01
Publisher’s Note: MDPI stays neutral with regard to jurisdictional claims in published maps and institutional affiliations.

