Synthesis, Characterization, and Anti-Algal Activity of Molybdenum-Doped Metal Oxides
by
 , ,
, ,
Sondavid Nandanwar
1,† ,
,
Myung Won Lee
2,†,
Shweta Borkar
2,
Jeong Hyung Cho
1,
Naresh H. Tarte
3 and
Hak Jun Kim
2,* 
1
Department of Marine Convergence Design, Pukyong National University, Busan 48513, Korea
2
Department of Chemistry, Pukyong National University, Busan 48513, Korea
3
Department of Chemistry and Biology, KSA of KAIST, Busan 47162, Korea
*
Author to whom correspondence should be addressed.
†
The authors contribute equally in this work.
Catalysts 2020, 10(7), 805; https://doi.org/10.3390/catal10070805
Submission received: 22 June 2020
/
Revised: 14 July 2020
/
Accepted: 14 July 2020
/
Published: 20 July 2020
(This article belongs to the Section Photocatalysis)
Abstract
:In this study, we attempted to synthesize visible light active nano-sized photocatalysts using metal oxides such as zinc oxide, zirconium oxide, tungsten oxide, and strontium titanium oxide with (MoCl5)2 as a dopant by the simple ball-milling method. Fourier-transform infrared spectroscopy data confirmed the presence of M-O-Mo linkage (M = Zn, Zr, W, and SrTi) in all the molybdenum-doped metal oxides (MoMOs), but only MoZnO inhibited the growth of the bloom-forming Microcystis aeruginosa under visible light in a concentration-dependent manner up to 10 mg/L. Further, structural characterization of MoZnO using FESEM and XRD exhibited the formation of typical hexagonal wurtzite nanocrystals of approximately 4 nm. Hydroxyl radical (·OH), reactive oxygen species (ROS), and lipid peroxidation assays revealed ·OH generated by MoZnO under the visible light seemed to cause peroxidation of the lipid membrane of M. aeruginosa, which led to an upsurge of intracellular ROS and consequently introduced the agglomeration of cyanobacteria. These results demonstrated that nano-sized MoZnO photocatalyst can be easily synthesized in a cost-effective ball-mill method and utilized for biological applications such as the reduction of harmful algal blooms. Further, our study implies that a simple ball-milling method can provide an easy, green, and scalable route for the synthesis of visible light active doped metal oxides.
1. Introduction
Photocatalysts are vital photoactive materials that could help eliminate the global energy crisis and mitigate environmental pollution [1]. Photocatalysts generate electrons in the conduction band and holes in the valence band upon illumination with higher light energy compared to its bandgap [2]. These photogenerated electrons and holes can oxidize or reduce surrounding pollutants with suitable redox potentials. Some photocatalysts such as zinc oxide (ZnO), zirconium oxide (ZrO2), and strontium-titanium oxide (SrTiO3) have higher photocatalytic efficiency under ultraviolet (UV) light compared to visible light [3,4,5], meaning an external energy source is needed to activate these photocatalysts. Tungsten oxide (WO3) has also a poor activity under visible light [6]. It is meaningful to synthesize visible light active photocatalysts for practical applications.
Zinc oxide (ZnO), tungsten oxide (WO3), and zirconium oxide (ZrO2), strontium-titanium oxide (SrTiO3) nanoparticles (NPs) are significant semiconductor material and of great interest due to their high stability, harmlessness, excellent optical and electrical properties, and high oxidizing potential [5,7,8,9,10]. Especially, ZnO NPs are used in various products such as sunscreens, toothpaste, beauty products, rubber, and medicine [11]. The doping of metal oxides with 4d transition metals, such as molybdenum (Mo), is a proven method to improve the practical applications of metal oxide. A remarkable increase in photoelectrochemical (PEC) performance of WO3 NPs and in the bioactivity of hydroxyapatite was observed upon doping with Mo [6,12]. The improved photocatalytic activity of ZnO was also reported with an increased percentage of the Mo dopant [13]. Thus, the Mo dopant can play an important role in increasing the photocatalytic performance of metal oxides under visible light.
There are several methods for the preparation of doped photocatalysts, such as the sol-gel [14], hydrothermal [14], co-precipitation [15], and flame spray pyrolysis [16] methods, all of which require multiple steps and precise reaction conditions. These days, the preparation of doped photocatalyst using the easy, rapid, and more environmentally friendly ball-milling method has been increasing rapidly [17]. The ball mill instruments are cheaper and easy to handle. Notably, they have the capability to synthesize size-controlled nanoparticles with a simple operating procedure [18]. The mechanical energy of ball mills can develop dislocations and vacancies in crystals, alter particle sizes, increase specific surface area of particles, and change the photocatalyst framework, thus increasing reactive edge sites [19]. Further, the solvent-free synthesis of desired doped photocatalyst increases the usability of the ball-milling method.
Recently, photocatalysts have been applied for the control of harmful algal bloom extensively [20,21,22]. ZnO NPs have been critically investigated for anti-algal [23] and antimicrobial activity [24], compared to WO3 and ZrO2 NPs. Photocatalysts generate reactive oxygen species such as hydroxyl free radicals (·OH) in the presence of light [25]. The produced ·OH has high oxidizing power and can oxidize cellular lipid into lipid peroxide, destroy cell morphology, and ultimately exterminate the species [26]. Several studies have indicated that photocatalysts can also cause oxidative stress in algal cells by increasing the intracellular ROS level, which can damage DNA, RNA, proteins, and lipids, leading to cell death [6,27,28]. Additionally, the release of metal ions [20,21,22] and aggregation of the photocatalyst [29,30] in the medium can affect the growth of algae.
In the present study, we attempted to synthesize molybdenum-doped zinc oxide (MoZnO), molybdenum-doped zirconium oxide (MoZrO), molybdenum-doped tungsten oxide (MoWO), and molybdenum-doped strontium titanium oxide (MoSrTiO) using the ball-milling method. The biological activity of the synthesized molybdenum-doped metal oxides against bloom-forming Microcystis aeruginosa was examined under the visible light. Based on the results of Fourier-transform infrared spectroscopy (FT-IR) analysis and preliminary anti-algal activity, MoZnO was subjected to further characterizations by Field emission scanning electron microscope (FESEM), energy dispersive X-ray analysis (EDX), X-ray diffraction (XRD), and FT-IR spectroscopy. Furthermore, the mechanisms of action of MoZnO were investigated in terms of the production of extracellular hydroxyl radical and intracellular ROS, lipid peroxidation, the effect of metal oxides, and their combinations on the inhibition of algal growth.
2. Results
2.1. Synthesis, Morphological and Microstructural Analysis of MoZnO
MoZnO was successfully synthesized by ball milling with ZnO and (MoCl5)2 powder. Change in the color of white ZnO to brown indicated the synthesis of MoZnO. The product yield of MoZnO was 65%. However, no color change was observed during the synthesis of MoZrO, MoWO, and MoSrTiO, and the yield of MoZrO, MoWO, and MoSrTiO was 20%, 34%, and 33%, respectively.
Shape and particle-size distribution of ZnO and MoZnO were analyzed using FESEM (Figure 1). The FESEM image showed that ZnO particles were mostly rod-shaped with some irregularity (Figure 1A), while MoZnO particles were largely arranged into an irregular morphology (Figure 1B). The majority of the ZnO particles had a size of up to 300–500 nm (Figure 1C) with the average size of 392 nm, and the particle size decreased upon doping ZnO with Mo (Figure 1D). Most MoZnO particles had a size of 23–45 nm with the average size of 40 nm. Particle shape and size were strongly altered by ball milling and doping. The average particle size decreased 9.8-fold with ball milling and Mo doping. The decrease in particle size increased the surface area, energy, and reactivity of particles.
Atomic% in MoZnO was analyzed using EDX. EDX spectrum analysis was performed to determine the composition of elements present in MoZnO. The EDX spectrum of MoZnO showed the presence of Zn, Mo, O, and Cl elements (Figure 2). The presence of both Mo and Zn elements was also observed in the same crystallite. The linkage of (MoCl5)2 to ZnO was confirmed by the coexistence of Mo and Cl on the surface of MoZnO. The weight% and atomic% of the elements present in MoZnO were shown in Table 1. The atomic% of Zn, Mo, O, and Cl elements were 28.25, 3.23, 61.66, and 6.87, respectively.
2.2. Structural Analysis of MoZnO
Doping of ZnO with Mo strongly affected the peak intensity and showed the coexistence of two phases in the XRD pattern (Figure 3). The weak diffraction peaks related to (100), (002), (101), (102), (110), (103), (200), (112), (201), (004), and (202) reflections in MoZnO showed the existence of the wurtzite phase of ZnO, whereas (021), (111), (150), and (180) reflections indicated the presence of orthorhombic MoO3. The XRD peak at ~17° indicated the presence of (MoCl5)2 on the surface of MoZnO [31]. A 10-fold decrease in the crystallite size of ZnO was observed upon doping with Mo. The calculated crystallite size of ZnO and MoZnO was 45.461 nm and 4.481 nm (Table 2), respectively. These results coincided with FESEM and EDX data. MoZnO showed a small alteration in the position of the diffraction peaks towards slightly higher angles, similar to the standard ZnO crystal, indicating that Mo substituted for Zn in the hexagonal lattice [32,33].
The calculated values of TC(hkl) for seven main peaks were shown in Table 3. Both ZnO and MoZnO had TC(hkl) values somewhat different from one. This indicated that both ZnO and MoZnO had preferential orientation along all planes. This was supported by the values of c/a shown in Table 1. The obtained c/a values for ZnO and MoZnO were just as reported standard c/a values for the wurtzite structure, which was about 1.63 [34]. Therefore, it was concluded that crystallites were oriented along all planes.
A sharp decline in peak intensity of ZnO was observed upon doping with Mo. This could arise from the different ionic radii of Zn and Mo, which led to lattice disorder and strain that occurred in the ZnO crystal after the Zn exchanged with Mo at the Zn lattice sites [35].
Table 2 shows the measured values of the lattice constant. The values of both a and c were slightly larger compared to bulk ZnO values (0.3242 nm and 0.5194 nm, respectively, for a and c, JCPDS-75–0576) [35]. The calculated values of the lattice strain were shown in Table 2. The lattice strain value of ZnO increased from 0.130 to 4.560 upon doping with Mo, which may be related to the nucleation process of ZnO. Higher Mo concentration enhanced the number of nucleations of ZnO, resulting in limited grain size and greater lattice strain [36].
To investigate Mo-O-M bond formation, FT-IR spectra of molybdenum-doped metal oxides (MoZnO, MoZrO, MoWO, and MoSrTiO), Na2MoO4∙2H2O, and their starting materials (ZnO, ZrO2, WO3, SrTiO3) were obtained (Figure 4). The characteristic Mo-O bond appeared at 833 cm−1 in the spectrum of Na2MoO4∙2H2O, while Zn-O showed a stretched band at 439 cm−1 in the ZnO sample [37,38]. MoZnO generated a new band corresponding to Zn−O−Mo linkage at 1038 cm−1 (indicated with an arrow) along with their characteristic bands for Zn-O at 467 cm−1, and for Mo-O at 867 cm−1 [39]. Similarly, MoO3 appeared in XRD data also emerged at 867 cm−1, 906 cm−1, 1618 cm−1, 3454 cm−1, and 3501 cm−1 [39]. The result of MoZnO FT-IR data matched well with those from XRD. Additionally, the FT-IR spectra of MoZrO, MoWO, and MoSrTiO showed the presence of respective metal oxide peaks, i.e., 721 cm−1 (Zr–O) [40], 1174 cm−1 (W–O) [31], and 563 cm−1 (Ti–O) [41]. Interestingly MoZrO, MoWO, and MoSrTiO (Supplementary Figure S3) showed a relatively weak band at 983 cm−1, 953 cm−1, and 954 cm−1 (indicated with an arrow), respectively, which may correspond to Zr–O–Mo [40], W−O−Mo [31], and SrTi–O–Mo linkages, respectively.
2.3. Anti-Algal Assay
A preliminary study revealed that only MoZnO inhibited the growth of M. aeruginosa cells as a function of concentration, while others did not (Supplementary Figure S1). MoZnO showed a linear relationship between the initial rate of reaction and the concentration of photocatalyst, which was one of the characteristics of an ideal photocatalyst (Supplementary Figure S2). Based on the preliminary study, MoZnO was used for further anti-algal study. The MoZnO concentration-dependent growth inhibition result was displayed in Figure 5. We also examined the anti-algal activity of metal salts, metal oxides, and their combinations against M. aeruginosa to rule out their contribution to the anti-algal activity of MoZnO (Supplementary Figure S4). As speculated, they did not show any anti-algal activity. As shown in Figure 5A, the pigment of chlorophyll was faded over the time in a concentration dependent manner, indicating that the algal cells gradually died. To present the anti-algal activity quantitatively, the optical density of M. aeruginosa was measured at 680 nm (OD680) (Figure 5B). The inhibition rate was calculated with OD680 values (Figure 5C). The inhibition rate of 1 mg/L MoZnO was increased gradually over the time, whereas the inhibition rate of 2.5, 5, and 10 mg/L MoZnO was saturated relatively faster. This result clearly demonstrated that MoZnO was a visible light active photocalyst. The minimal effective concentration (MEC) was found to be 1.0 mg/L in this study.
2.4. Mechanisms of Algae Growth Inhibition
The extracellular hydroxyl free radical, intracellular reactive oxygen species, lipid peroxidation, and agglomeration effect were examined to speculate a mechanism of anti-algal activity of MoZnO.
Extracellular ·OH generated by MoZnO under the illumination of ~2000 lx in the absence (C, EX) and presence (SC, SEX) of M. aeruginosa was investigated. Isopropanol was added to S and SC groups to scavenge the ·OH generated by MoZnO, which eventually thus decreased the ·OH fluorescence intensity of the control group [42]. As shown in Figure 6, the MoZnO was effective in generating ·OH radical in solution (EX and SEX). The shading of M. aeruginosa seemed to cause the lower production of ·OH radical by MoZnO (Supplementary Figure S8). Upon shading, the fluorescence intensity of SEX group was decreased by 2.7-fold, compared to the EX group.
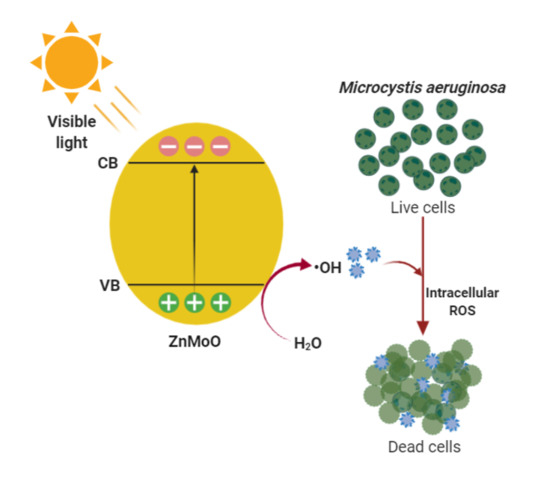
The plausible steps for the generation of ·OH free radical by MoZnO were given as follows:
The irradiation of MoZnO with visible light triggered the generation of a negatively charged conduction band (eCB−) and positively charged valence band (hvB+) [43]. The hvB+ extracted electrons from nearby water molecules, producing hydroxyl radicals and protons. The high oxidation potential of the generated ·OH can damage harmful cyanobacteria.
The intracellular ROS content of M. aeruginosa was also increased in a concentration-dependent manner (Figure 7). Not surprisingly, the ROS content was shown to decrease 2 h after MoZnO treatment. This was in accordance with the anti-algal results, in which algal cells started perishing 2 h after treatment, reducing the concentration of live cells. The detection of ROS is impossible in dead cells.
The membrane integrity was evaluated using lipid peroxidation assay. The MDA content in the treated cells was increased 1.8–2-fold more than in the control group, which indicates that the lipid was more exposed to the ·OH in the treated groups (Supplementary Figure S5). The optical microscope and SEM images of M. aeruginosa showed that algal cells appeared agglomerated in the MoZnO treated samples (Supplementary Figures S6 and S7). In the control group, they did not show any agglomeration.
3. Discussion
In this study, we synthesized molybdenum-doped metal oxides (MoZnO, MoZrO, MoWO, and MoSrTiO) using the solvent-free ball-milling method. The decrease in the crystallite size of ZnO was observed upon doping with Mo. Swapna et al. [35] obtained similar results for Mo-doped ZnO thin films synthesized by spray pyrolysis method. This indicated that the degradation of the crystallinity of MoZnO was the result of doping with high Mo concentration. The lower product yield of MoZrO, MoWO, and MoSrTiO in this study may indicate that the solvent-free ball milling was not a suitable method for the synthesis of these photocatalysts. The molar ratio of metal oxides was lower in MoZrO, MoWO, and MoSrTiO, but was higher in MoZnO, which could be the plausible reason for their low yield. The higher molar ratio of ZnO may increase the chances of the interaction of ZnO with (MoCl5)2 and result in higher yield and doping of Mo. Ideal photocatalysts have a linear relationship between the initial rate of reaction and the concentration of photocatalyst [44]. MoZnO had a linear relationship between the initial rate of reaction and the concentration of photocatalyst (Supplementary Figure S2). After achieving the maximum rate, the rate of reaction may remain constant, or in some cases, it may decrease with an increase in the concentration of photocatalyst. The decrease in rate may be due to the increased scattering of the visible light. The rate of reaction of MoZnO was decreased at higher concentrations, which may be due to the increased scattering of the incident light by MoZnO. Unlike MoZnO, MoZrO, MoWO, and MoSrTiO were not active. The reason of inactivity may be due to the low percentage doping of Mo in MoZrO and MoWO, and electron-hole pair recombination in case of MoSrTiO. Previously, it was reported that the catalytic activity of molybdenum-doped metal oxides was dependent on the concentration of the dopant [45,46]. The low percentage doping of Mo in WO3 increased the bandgap of the resulting MoWO and decreased its reactivity under visible light [45]. On the contrary, Chary et al. [46] showed that the catalytic activity of MoO3/ZrO2 increased with the increase in Mo dopant. Nosaka et al. [47] found that Mo doping in SrTiO3 increased the recombination of generated electron and hole under visible light. Taken together, precipitation [48], RF magnetron sputtering [49], and hydrothermal [47,50] methods could be more efficient than solvent-free ball mill method for the synthesis of MoZrO, MoWO, and MoSrTiO.
We demonstrated the application of the visible light active MoZnO for the inhibition of algal growth. Fan et al. [51] used 1 mg/L Cu-MOF-74, and Yu et al. [52] used AgBiO3, AgNO3, and NaNO3 to inhibit the growth of M. aeruginosa. They noticed that the growth of algal cells was inhibited after 24 and 96 h, respectively. Interestingly, MoZnO synthesized in this study showed rapid growth inhibition of M. aeruginosa at a minimum concentration of 2.5 mg/L after 4 h. ZrO2, WO3, and SrTiO3 did not show growth inhibition of M. aeruginosa (Supplementary Figure S1). The component of MoZnO may contribute to the anti-algal activity. Du et al. [21] noticed that 0.71 mg/L Zn2+ ion and 1 mg/L ZnO NP promoted the growth of M. aeruginosa. Similar results were obtained after incubating M. aeruginosa with 2.5 mg/L ZnO and ZnO + Na2MoO4∙2H2O for 8 h. However, in this study, Zn2+ ion from 2.5 mg/L ZnSO4 treatment did not have any significant effect on M. aeruginosa growth. We performed the ·OH and ROS assay to confirm the generation of extracellular ·OH and intracellular ROS in M. aeruginosa. MoZnO generated extracellular ·OH, which has high oxidation potential. Ding et al. [25] found that nano-ZnS-montmorillonite caused concentration-dependent production of ·OH radicals. Additionally, we found that M. aeruginosa had a shading effect on ·OH production efficiency of MoZnO, decreasing the actual efficiency of MoZnO. Although the shading by M. aeruginosa cells decreased the efficiency of ·OH production, ·OH-mediated growth inhibition of algal cells was considered an important mechanism of inhibition by MoZnO [43]. The intracellular ROS was increased for up to 2 h and then decreased in the MoZnO samples. The decrease of intracellular ROS was likely to the extensive cell death 2 hr after MoZnO treatment, as shown in the anti-algal assay. Concentrations higher than 1 mg/L MoZnO increased the ROS content and the internal oxidative stress in M. aeruginosa cells, suggesting that MoZnO causes oxidative damage to algal cells. He et al. [53] obtained similar results, in which nano-ThO2 exhibited the concentration-dependent generation of intracellular ROS in Chlorella pyrenoidosa after 48 h. Also, intracellular ROS and extracellular ·OH produced by the presence of MoZnO can cause lipid peroxidation in M. aeruginosa. Vicente et al. found that ZnO at 1, 5, and 10 mg/L caused peroxidation of cyanobacteria Synechococcus elongates [54]. MoZnO increased the MDA content in the M. aeruginosa suspension at 1, 2.5, 5, and 10 mg/L, indicating that MoZnO may cause peroxidation of lipids in algal cells. Peroxidation of algal cells may be the cause of oxidative stress generated by MoZnO-mediated ROS. Fan et al. [51] and Zhou et al. [55] found that the treatment of M. aeruginosa with Cu-MOF-74 and potassium ferrate (VI) induced the aggregation of the algal cell with the release of internal organic matter. MoZnO induced the agglomeration of M. aeruginosa in a concentration-dependent manner. SEM image showed the release of organic matter by M. aeruginosa incubated with MoZnO. MoZnO generated ·OH radical in the BG-11 medium, which oxidized the lipid membrane of algal cells, resulting in cell damage. The discharge of organic matter from damage cells in BGM diminished the stability of the algal suspension, facilitating agglomeration.
4. Materials and Methods
4.1. Preparation of MoZnO
Molybdenum-doped zinc oxide (MoZnO) photocatalyst was synthesized in the solvent-free medium in a vacuum planetary ball mill (QM-1F, Nanjing University Instrument Plant, Nanjing, China). 1000 mg of ZnO powder was mixed with agate ball in a 1:10 ratio in the agate ball milling tank, and then a 500 mg of (MoCl5)2 was added. (MoCl5)2 is a highly unstable metal chloride which can react efficiently with stable metal oxides to produce the molybdenum-doped metal oxide [31]. The mixture was milled for 2 h with the milling rate of 300 rpm. The resulting powder was rinsed four times with deionized water and three times with absolute ethanol before being kept at 353 K up to 6 h in an oven. In addition, we used zirconium oxide (ZrO2), tungsten oxide (WO3), and strontium titanate (SrTiO3) to synthesize respective molybdenum-doped metal oxides (MoZrO, MoWO, and MoSrTiO) using the same reaction condition. The molar ratios of ZnO, ZrO2, WO3, and SrTiO3 to (MoCl5)2 were 6.8, 4.5, 2.4, and 3.2, respectively.
4.2. Characterization
4.2.1. Morphological and Microstructural Analysis
The shape and size of MoZnO were analyzed using field emission scanning electron microscopy (FESEM). FESEM was performed at an accelerating voltage of 0.5~30 KV (JSM-6700F, JEOL, Tokyo, Japan). The elemental proportion of MoZnO was analyzed using an energy dispersive X-ray spectrometer (EDX, INCAx-sight, Oxford).
4.2.2. Structural Analysis
XRD Analysis
The crystallinity of MoZnO was analyzed using an X-ray diffractometer (Rigaku Ultima IV, Rigaku, Japan), with Cu Kα radiation (wavelength = 15.4 nm) operated at 40 kV and 40 mA. The crystallite size D of ZnO and MoZnO was calculated using the Scherrer equation [56]:
where D is the crystalline size, k is the shape factor (0.9), λ is the wavelength of X-ray (1.54056 Å), β is the full width at half maximum (FWHM) of the diffraction peak (in radians), and θ is the diffraction angle of the reflection.
Texture coefficients (TC) were calculated to understand the orientation of doped Mo in MoZnO using the 36–1451 JCPDS-ICDD card for all the peaks except (200) peak [57]. The equation of texture coefficient is as follows [57]:
where I(hkl) is the measured relative intensity of (hkl) plane, I0(hkl) is the theoretical intensity of the same plane taken from the 36–1451 JCPDS-ICDD card, and N is the number of reflections. The random orientation of doped material has TC(hkl) value equal to 1, whereas a value other than 1 indicates the preferred orientation.
FT-IR Analysis
Types of bonding present in molybdenum-doped metal oxides (MoZnO, MoZrO, MoWO, and MoSrTiO) was analyzed using Fourier transform infrared (FT-IR). FT-IR spectra was measured with a FT-IR spectrometer (JASCO FT/IR-4100, Tokyo, Japan).
4.3. Algae Growth Inhibition
4.3.1. Algae Culture
A strain of M. aeruginosa (No. FBCC000002) was received from the Nakdonggang National Institute of Biological Resources (Sangju, Korea). The MA was cultured in a 2-L conical flask having BG-11 medium (BGM) (pH 7.0) at 298 ± 1 K [58], exposed to ~2000 lx of incandescent lamp with light-dark cycle of 12:12 h. The conical flask was shaken every hour to prevent deposition of the cells.
4.3.2. Anti-Algal Activity
A preliminary study was performed to determine the anti-algal activity of synthesized molybdenum-doped metal oxides (MoZnO, MoZrO, MoWO, and MoSrTiO). Different concentrations of molybdenum-doped metal oxides were used for growth inhibition of M. aeruginosa. Based on the result, MoZnO was used for further study (Supplementary Figure S1). The stock of MoZnO (1000 mg/L) was prepared in a new BG-11 medium. The resulting solution was ultrasonicated for 15 min to homogenize the MoZnO. M. aeruginosa cultures were washed three times and resuspended in fresh culture medium to obtain an eventual concentration of 6.48 × 10³ cell/mL (OD680 ≈ 0.43), which was nearly equal to the number of toxic concentration of MA blooms occurred in the freshwater bodies [59]. The MoZnO stock solution was mixed with the M. aeruginosa culture to achieve the eventual concentration of 0, 1, 2.5, 5, and 10 mg/L. The resulting solution was incubated according to the conditions given in Section 4.3.1. Next, samples were drawn after successive 1-h time-intervals (1–8 h), and the number of algal cells per milliliter was calculated from OD680 using a UV-Vis spectrophotometer (Bio Drop). The growth inhibition rate of algae was calculated using an inhibitory rate equation [51].
Algae inhibition rate was calculated as follows:
where μa-b is the specific growth rate from ta (h) to tb (h), Xa is the OD680 value at ta (h), Xb is the OD680 value at tb (h), Ir (%) is the inhibition rate based on the specific growth rate, μ0 is the average of the specific growth rate of the control group, μe is the specific growth rate of the experimental group, and ta and tb are the initial and final time measured at 1-h intervals.
4.3.3. Effect of Metal Salts, Metal Oxides and Their Combinations
The effect of ZnSO4 (1), (MoCl5)2 (2), ZnO (3), Na2MoO4∙2H2O (4), and their combinations ZnSO4 + Na2MoO4∙2H2O (5), ZnO + Na2MoO4∙2H2O (6), ZnSO4 + (MoCl5)2 (7), and ZnO + (MoCl5)2 (8) was examined on M. aeruginosa culture. The ZnSO4, (MoCl5)2, ZnO, or Na2MoO4∙2H2O was mixed with M. aeruginosa culture to give an eventual concentration of 2.5 mg/L. For combination effect, a 1:1 weight ratio of each component was mixed with M. aeruginosa culture to give an eventual concentration of 2.5 mg/L. The control group (0) was set as M. aeruginosa culture without any test compound. The resulting solution was incubated according to the conditions given in Section 4.3.1. Next, samples were drawn after successive 1h time-intervals (1–8 h), and the number of algal cells per milliliter was calculated from OD680 using a UV-Vis spectrophotometer (BioDrop Duo, England, Cambridge, UK).
4.4. Experiments on Anti-Algal Mechanisms
4.4.1. Hydroxyl Radical (·OH) Assay
Terephthalic acid (TA) is a nonfluorescent compound, which upon oxidation by hydroxyl radical converted into fluorescent compound 2-hydroxyterephthalic acid. Therefore, the fluorescence intensity is directly proportional to the concentration of ·OH. TA (0.5 mM) was dissolved with excess NaOH (2 g/L) in a 100 mL BGM. Then, the BGM was neutralized by adding HCl, and the BGM was equally distributed into two conical flasks (Supplementary Table S1). One group was labelled as control (C) and the other as experimental group (EX). The final concentration of 10 mg/L MoZnO was mixed with both C and Ex groups, respectively. The C and Ex groups were exposed to ~2000 lx of incandescent lamps for 4 h. 1 mM isopropyl alcohol was added to the C group as a free radical scavenger. The solutions were centrifuged at 4500 rpm for 10 min. Finally, the fluorescence spectrum of supernatant was analyzed at excitation and emission wavelengths of 350 and 500 nm. The obtained fluorescence intensity was used to compare the ·OH free radicals formed in C and Ex groups. The same experiment was performed under the M. aeruginosa to study the effect of the shading of algal cells on the efficiency of MoZnO (Supplementary Figure S8). The control (SC) and experimental (SEX) groups were illuminated with ~2000 lx of incandescent lamps up to 4 h. The rest of the procedure was the same.
4.4.2. ROS Assay
The intracellular ROS produced in M. aeruginosa incubated with MoZnO was evaluated employing 2′,7′-Dichlorofluorescein diacetate (DCFH-DA, Sigma–Aldrich, St. Louis, MO, USA), which is a nonfluorescent dye. In the cell, esterase catalyzed DCFH-DA to another nonfluorescent 2′,7′-dichlorodihydrofluorescein (DCFH) dye. DCFH further oxidized by ·OH to the extremely fluorescent 2′,7′-dichlorofluorescein (DCF). In detail, 5 mL of M. aeruginosa culture was drawn in 15 mL falcon tube from all flasks, at successive time-interval of 1 h. The DCFH-DA solution was mixed with the M. aeruginosa culture to make an eventual concentration of 5 μM. Next, wrapped all the tubes with aluminum foil and incubated at 30 °C up to 1 h. Finally, the fluorescence spectrum of M. aeruginosa culture was analyzed at excitation and emission wavelengths of 488 and 525 nm, respectively, by making use of a fluorescence spectrometer (F-7000, HITACHI, Japan). The obtained fluorescence intensity was used to calculate the relative ROS content.
4.4.3. Lipid Peroxidation Assay
Lipid peroxidation assay was performed according to Metzler’s malondialdehyde (MDA) method [60]. Sample and 10% trichloroacetic acid (TCA) were mixed in the volume ratio of 1:2. The resulting mixture was centrifuged at 11,000 g for 45 min. The supernatant was collected and mixed with 3 mL of 6.7 g/L 2-thiobarbituric acid (TBA). Next, the resulting solution was boiled on the water bath up to 10 min. After the temperature of the solution came to room temperature, the absorbance was measured at the wavelengths of 532 and 600 nm. The value obtained at 600 nm was subtracted from the value at 532 nm. Lipid peroxidation was expressed in terms of mg MDA/kg sample, using the molar extinction coefficient for MDA of 1.56 × 10⁵ M−1 cm−1 [61].
4.4.4. Effect of Agglomeration
Optical Microscope Analysis
A standard experiment was performed to examine the consequence of agglomeration on the multiplication of M. aeruginosa. The M. aeruginosa culture was incubated with different MoZnO concentrations (0, 1, 2.5, 5, and 10 mg/L) up to 4 h. The incubated M. aeruginosa was analyzed using an optical microscope to detect the aggregated algal cells.
SEM Analysis
SEM analysis was performed to investigate the aggregation of M. aeruginosa incubated with 0, 5, and 10 mg/L of MoZnO up to 4 h. M. aeruginosa cultures were washed 3-times with double-distilled water and pelleted by centrifugation at 3000 rpm for 10 min. Obtained pellets were fixed with 4% formaldehyde for 1 h at room temperature. Fixed pellets were serially dehydrated with 30%–100% ethanol. Subsequently, 30 µL of each sample was put on a glass slide and dried overnight in the open air at room temperature. The SEM analysis of the prepared samples was performed using a (JSM-6490LV, JEOL, Tokyo, Japan) at an accelerating voltage of 0.2–30 KV.
4.4.5. Statistical Analysis
The experiments were carried out in triplicate, and the data are presented as mean and standard deviation (SD). Significant differences between means were identified using the paired t-test. Statistical significance was evaluated using significance levels at 0.05.
5. Conclusions
MoZnO nanoparticles were successfully synthesized by a facile surfactant-free ball-milling method. This method seemed not to be suitable for the synthesis of MoZrO, MoWO, and MoSrTiO in high yield. Out of the MoZnO, MoZrO, MoWO, and MoSrTiO, only MoZnO had a linear relationship between the initial rate of reaction and the concentration of photocatalyst (preliminary data). Preliminary data indicated that MoZnO was an ideal photocatalyst. Characterization by FESEM, EDX, XRD, and FT-IR measurements indicated that MoZnO contained typical hexagonal wurtzite nanocrystals of approximately 4 nm. The FT-IR spectrum of MoZrO, MoWO, and MoSrTiO showed the presence of a new peak, which may indicate the formation of the M−O−Mo bond (M = Zr, W, and SrTi). FESEM analysis showed that the average particle size of MoZnO was 40 nm. Particle shape and size were found to be strongly altered by ball milling and doping. EDX showed the presence of both Mo and Zn elements in the same crystallite. FT-IR analysis showed the presence of Zn−O−Mo linkage (1038 cm−1) in MoZnO. Investigation of photocatalytic growth inhibition of algal cells showed that the synthesized MoZnO had superior growth-inhibition properties, with MIC value of 1 mg/L under visible light. MoZrO, MoWO, and MoSrTiO were found inactive to control the growth of M. aeruginosa. The pristine ZnSO4, (MoCl5)2, ZnO, Na2MoO4∙2H2O, and their various combinations of ZnSO4 + Na2MoO4∙2H2O, ZnO + Na2MoO4∙2H2O, ZnSO4 + (MoCl5)2, and ZnO + (MoCl5)2 did not affect the growth of M. aeruginosa significantly. Extracellular ·OH and intracellular ROS oxidized the algal cells, which was supported by the lipid peroxidation assay. The shading effect of M. aeruginosa decreased the anti-algal efficiency of MoZnO. Extracellular ·OH generated by MoZnO induced the lysis of the M. aeruginosa membrane, which leaked the internal organic matter and caused the agglomeration of algal cells. The main mechanism for inhibiting M. aeruginosa growth by MoZnO included the generation of intracellular ROS, extracellular ·OH, and oxidative damage to algal cells.
Supplementary Materials
The following are available online at https://www.mdpi.com/2073-4344/10/7/805/s1, Figure S1. Preliminary anti-algal activity of molybdenum-doped metal oxides at 2 h, 24 h, and 48 h (A) ZnO, (B) ZrO2, (C) WO3, and (D) SrTiO3, Figure S2. Plot of pseudo first order rate vs concentration of molybdenum-doped metal oxides, Figure S3. FT-IR spectra of metal oxide, sodium molybdate dihydrate, and molybdenum doped metal oxides (A) ZrO2, Na2MoO4∙2H2O, and MoZrO, (B) WO3, Na2MoO4∙2H2O, and MoWO, and (C) SrTiO3, Na2MoO4∙2H2O, and MoSrTiO, Figure S4. Effect of ZnSO4 (1), (MoCl5)2 (2), ZnO (3), Na2MoO4∙2H2O (4), and their combinations ZnSO4+Na2MoO4∙2H2O (5), ZnO+Na2MoO4∙2H2O (6), ZnSO4 + (MoCl5)2 (7), and ZnO + (MoCl5)2 (8) on the growth of M. aeruginosa. Statistical significance (determined by paired t-test) is shown by * = p < 0.05, ** = p < 0.001, when compared to control (0), Figure S5. Lipid peroxidation of M. aeruginosa cells at 4 h, Figure S6. Optical microscope images of M. aeruginosa cells after incubation with MoZnO up to 4 h: (A) 0 mg/L; (B) 1 mg/L; (C) 2.5 mg/L; (D) 5 mg/L; (E) 10 mg/L, Figure S7. SEM images of M. aeruginosa cells after incubation with MoZnO up to 4 h: (A) 0 mg/L; (B) 5 mg/L; (C) 10 mg/L, Figure S8. OH assay under the shading of M. aeruginosa, and Table S1: Experimental grouping.
Author Contributions
Conceptualization: S.N., N.H.T., and H.J.K. Methodology: S.N., S.B., and H.J.K. Validation: S.N., J.H.C., and H.J.K. Formal analysis: S.N. and H.J.K. Investigation: S.N. and S.B. Data curation: S.N. and H.J.K. Writing, original draft preparation: S.N. Writing, review and editing: H.J.K. and M.W.L. Visualization: S.N. and H.J.K. Supervision: H.J.K. Funding Acquisition: H.J.K. All authors have read and agreed to the published version of the manuscript.
Funding
This research was funded by Pukyong National University grant number 2019.
Conflicts of Interest
The authors declare no conflict of interest.
References
- Theerthagiri, J.; Salla, S.; Senthil, R.A.; Nithyadharseni, P.; Madankumar, A.; Arunachalam, P.; Maiyalagan, T.; Kim, H.-S. A review on ZnO nanostructured materials: Energy, environmental and biological applications. Nanotechnology 2019, 30, 392001. [Google Scholar] [CrossRef] [PubMed]
- Lebedev, A.; Anariba, F.; Tan, J.C.; Li, X.; Wu, P. A review of physiochemical and photocatalytic properties of metal oxides against Escherichia coli. J. Photochem. Photobiol. A Chem. 2018, 360, 306–315. [Google Scholar] [CrossRef]
- Ding, W.; Zhao, L.; Yan, H.; Wang, X.; Liu, X.; Zhang, X.; Huang, X.; Hang, R.; Wang, Y.; Yao, X.; et al. Bovine serum albumin assisted synthesis of Ag/Ag2O/ZnO photocatalyst with enhanced photocatalytic activity under visible light. Colloids Surf. A Physicochem. Eng. Asp. 2019, 568, 131–140. [Google Scholar] [CrossRef]
- Shu, Z.; Jiao, X.; Chen, D. Synthesis and photocatalytic properties of flower-like zirconia nanostructures. CrystEngComm 2012, 14, 1122–1127. [Google Scholar] [CrossRef]
- Yan, X.; Hu, B.; Lu, W.; Sun, S.; Shi, W.; Wang, X. Enhanced photocatalytic activity induced by surface plasmon resonance on Ag-loaded strontium titanate nanoparticles. Micro Nano Lett. 2013, 8, 504–507. [Google Scholar] [CrossRef]
- Kalanur, S.S.; Seo, H. Influence of molybdenum doping on the structural, optical and electronic properties of WO3 for improved solar water splitting. J. Colloid Interface Sci. 2018, 509, 440–447. [Google Scholar] [CrossRef]
- Ebrahimi, R.; Hossienzadeh, K.; Maleki, A.; Ghanbari, R.; Rezaee, R.; Safari, M.; Shahmoradi, B.; Daraei, H.; Jafari, A.; Yetilmezsoy, K.; et al. Effects of doping zinc oxide nanoparticles with transition metals (Ag, Cu, Mn) on photocatalytic degradation of Direct Blue 15 dye under UV and visible light irradiation. J. Environ. Health Sci. Eng. 2019, 17, 479–492. [Google Scholar] [CrossRef]
- Gouda, M. Nano-zirconium oxide and nano-silver oxide/cotton gauze fabrics for antimicrobial and wound healing acceleration. J. Ind. Text. 2011, 41, 222–240. [Google Scholar] [CrossRef]
- Ghasempour, F.; Azimirad, R.; Amini, A.; Akhavan, O. Visible light photoinactivation of bacteria by tungsten oxide nanostructures formed on a tungsten foil. Appl. Surf. Sci. 2015, 338, 55–60. [Google Scholar] [CrossRef]
- Autefage, H.; Allen, F.; Tang, H.; Kallepitis, C.; Gentleman, E.; Reznikov, N.; Nitiputri, K.; Nommeots-Nomm, A.; O’Donnell, M.; Lange, C.; et al. Multiscale analyses reveal native-like lamellar bone repair and near perfect bone-contact with porous strontium-loaded bioactive glass. Biomaterials 2019, 209, 152–162. [Google Scholar] [CrossRef]
- Hou, J.; Wu, Y.; Li, X.; Wei, B.; Li, S.; Wang, X. Toxic effects of different types of zinc oxide nanoparticles on algae, plants, invertebrates, vertebrates and microorganisms. Chemosphere 2018, 193, 852–860. [Google Scholar] [CrossRef] [PubMed]
- Abutalib, M.; Yahia, I. Novel and facile microwave-assisted synthesis of Mo-doped hydroxyapatite nanorods: Characterization, gamma absorption coefficient, and bioactivity. Mater. Sci. Eng. C 2017, 78, 1093–1100. [Google Scholar] [CrossRef] [PubMed]
- Vayaa, D.; Sharmab, V.K. Study of synthesis and photocatalytic activities of Mo doped ZnO. J. Chem. Pharm. 2011, 3, 234–244. [Google Scholar]
- Khaki, M.R.D.; Shafeeyan, M.S.; Raman, A.A.A.; Daud, W.M.A.W. Application of doped photocatalysts for organic pollutant degradation—A review. J. Environ. Manag. 2017, 198, 78–94. [Google Scholar] [CrossRef]
- Nasir, Z.; Shakir, M.; Wahab, R.; Shoeb, M.; Alam, P.; Khan, R.; Mobin, M.; Lutfullah, L. Co-precipitation synthesis and characterization of Co doped SnO2 NPs, HSA interaction via various spectroscopic techniques and their antimicrobial and photocatalytic activities. Int. J. Biol. Macromol. 2017, 94, 554–565. [Google Scholar] [CrossRef]
- Boningari, T.; Inturi, S.N.R.; Suidan, M.; Smirniotis, P.G. Novel one-step synthesis of sulfur doped-TiO2 by flame spray pyrolysis for visible light photocatalytic degradation of acetaldehyde. Chem. Eng. J. 2018, 339, 249–258. [Google Scholar] [CrossRef]
- Lonkar, S.P.; Pillai, V.; Abdala, A. Solvent-free synthesis of ZnO-graphene nanocomposite with superior photocatalytic activity. Appl. Surf. Sci. 2019, 465, 1107–1113. [Google Scholar] [CrossRef]
- Ahadi, S.; Moalej, N.S.; Sheibani, S. Characteristics and photocatalytic behavior of Fe and Cu doped TiO2 prepared by combined sol-gel and mechanical alloying. Solid State Sci. 2019, 96, 105975. [Google Scholar] [CrossRef]
- Shafei, A.; Salarpour, M.E.; Sheibani, S. Effect of intermediate ball milling on the synthesis of Cu-doped TiO2 nano-photocatalyst by sol–gel method. J. Sol-Gel Sci. Technol. 2019, 92, 173–185. [Google Scholar] [CrossRef]
- Oukarroum, A.; Halimi, I.; Siaj, M. Cellular Responses of Chlorococcum Sp. Algae Exposed to Zinc Oxide Nanoparticles by Using Flow Cytometry. Water Air Soil Pollut. 2018, 230, 1–7. [Google Scholar] [CrossRef]
- Du, J.; Guo, R.; Li, K.; Ma, B.; Chen, Y.; Lv, Y. Contributions of Zn Ions to ZnO Nanoparticle Toxicity on Microcystis aeruginosa During Chronic Exposure. Bull. Environ. Contam. Toxicol. 2019, 103, 802–807. [Google Scholar] [CrossRef] [PubMed]
- Aruoja, V.; Dubourguier, H.-C.; Kasemets, K.; Kahru, A. Toxicity of nanoparticles of CuO, ZnO and TiO2 to microalgae Pseudokirchneriella subcapitata. Sci. Total Environ. 2009, 407, 1461–1468. [Google Scholar] [CrossRef] [PubMed]
- Halbus, A.; Horozov, T.S.; Paunov, V.N. Surface-Modified Zinc Oxide Nanoparticles for Antialgal and Antiyeast Applications. ACS Appl. Nano Mater. 2020, 3, 440–451. [Google Scholar] [CrossRef] [Green Version]
- Da Silva, B.L.; Abuçafy, M.P.; Manaia, E.B.; Junior, J.A.O.; Chiari-Andréo, B.G.; Pietro, R.C.R.; Chiavacci, L. Relationship Between Structure And Antimicrobial Activity Of Zinc Oxide Nanoparticles: An Overview. Int. J. Nanomed. 2019, 14, 9395–9410. [Google Scholar] [CrossRef] [Green Version]
- Ding, Y.; Sun, L.; Jiang, Y.; Liu, S.; Chen, M.; Chen, M.; Ding, Y.; Liu, Q. A facile strategy for the preparation of ZnS nanoparticles deposited on montmorillonite and their higher catalytic activity for rapidly colorimetric detection of H2O2. Mater. Sci. Eng. C 2016, 67, 188–194. [Google Scholar] [CrossRef]
- Li, F.; Liang, Z.; Zheng, X.; Zhao, W.; Wu, M.; Wang, Z. Toxicity of nano-TiO2 on algae and the site of reactive oxygen species production. Aquat. Toxicol. 2015, 158, 1–13. [Google Scholar] [CrossRef]
- Suman, T.; Rajasree, S.R.R.; Kirubagaran, R. Evaluation of zinc oxide nanoparticles toxicity on marine algae chlorella vulgaris through flow cytometric, cytotoxicity and oxidative stress analysis. Ecotoxicol. Environ. Saf. 2015, 113, 23–30. [Google Scholar] [CrossRef]
- Brynildsen, M.P.; Winkler, J.A.; Spina, C.; Macdonald, I.C.; Collins, J.J. Potentiating antibacterial activity by predictably enhancing endogenous microbial ROS production. Nat. Biotechnol. 2013, 31, 160–165. [Google Scholar] [CrossRef] [Green Version]
- Sousa, C.A.; Soares, E.V.; Soares, E.V. Chronic exposure of the freshwater alga Pseudokirchneriella subcapitata to five oxide nanoparticles: Hazard assessment and cytotoxicity mechanisms. Aquat. Toxicol. 2019, 214, 105265. [Google Scholar] [CrossRef] [Green Version]
- Joonas, E.; Aruoja, V.; Olli, K.; Kahru, A. Environmental safety data on CuO and TiO2 nanoparticles for multiple algal species in natural water: Filling the data gaps for risk assessment. Sci. Total Environ. 2019, 647, 973–980. [Google Scholar] [CrossRef] [PubMed]
- Kim, D.; Kim, G.; Bae, H.; Kim, E.; Moon, B.; Cheon, D.; Tarte, N.H. An External Energy Independent WO3/MoCl5 Nano-Sized Catalyst for the Superior Degradation of Crystal Violet and Rhodamine B Dye. Catalysts 2019, 9, 642. [Google Scholar] [CrossRef] [Green Version]
- Xiu, X.; Pang, Z.; Lv, M.; Dai, Y.; Ye, L.; Han, S. Transparent conducting molybdenum-doped zinc oxide films deposited by RF magnetron sputtering. Appl. Surf. Sci. 2007, 253, 3345–3348. [Google Scholar] [CrossRef]
- Shatnawi, M.; Alsmadi, A.; Bsoul, I.; Salameh, B.; Mathai, M.; Alnawashi, G.; Alzoubi, G.M.; Al-Dweri, F.; Bawa’Aneh, M. Influence of Mn doping on the magnetic and optical properties of ZnO nanocrystalline particles. Results Phys. 2016, 6, 1064–1071. [Google Scholar] [CrossRef] [Green Version]
- Rusu, D.; Rusu, G.; Luca, D. Structural Characteristics and Optical Properties of Thermally Oxidized Zinc Films. Acta Phys. Pol. A 2011, 119, 850–856. [Google Scholar] [CrossRef]
- Swapna, R.; Kumar, M. Growth and characterization of molybdenum doped ZnO thin films by spray pyrolysis. J. Phys. Chem. Solids 2013, 74, 418–425. [Google Scholar] [CrossRef]
- Boukhachem, A.; Ouni, B.; Karyaoui, M.; Madani, A.; Chtourou, R.; Amlouk, M. Structural, opto-thermal and electrical properties of ZnO:Mo sprayed thin films. Mater. Sci. Semicond. Process. 2012, 15, 282–292. [Google Scholar] [CrossRef]
- Azizi, S.; Bin Ahmad, M.; Namvar, F.; Mohamad, R. Green biosynthesis and characterization of zinc oxide nanoparticles using brown marine macroalga Sargassum muticum aqueous extract. Mater. Lett. 2014, 116, 275–277. [Google Scholar] [CrossRef]
- Nakagaki, S.; Bail, A.; Dos Santos, V.C.; Souza, V.H.R.; Vrubel, H.; Nunes, F.S.; Ramos, L.P. Use of anhydrous sodium molybdate as an efficient heterogeneous catalyst for soybean oil methanolysis. Appl. Catal. A Gen. 2008, 351, 267–274. [Google Scholar] [CrossRef]
- Yu, C.; Yang, K.; Shu, Q.; Yu, J.C.-M.; Cao, F.; Li, X.; Zhou, X. Preparation, characterization and photocatalytic performance of Mo-doped ZnO photocatalysts. Sci. China Ser. B Chem. 2012, 55, 1802–1810. [Google Scholar] [CrossRef]
- Afanasiev, P.; Geantet, C.; Kerridge, D.H. Products of reactions of Mo and Zr compounds in molten nitrate. J. Mater. Chem. 1995, 5, 347. [Google Scholar] [CrossRef]
- Craciun, V.; Singh, R.K. Characteristics of the surface layer of barium strontium titanate thin films deposited by laser ablation. Appl. Phys. Lett. 2000, 76, 1932–1934. [Google Scholar] [CrossRef] [Green Version]
- Phongarthit, K.; Amornpitoksuk, P.; Suwanboon, S. Synthesis, characterization, and photocatalytic properties of ZnO nanoparticles prepared by a precipitation-calcination method using a natural alkaline solution. Mater. Res. Express 2019, 6, 045501. [Google Scholar] [CrossRef]
- Quek, J.-A.; Lam, S.-M.; Sin, J.-C.; Mohamed, A.R. Visible light responsive flower-like ZnO in photocatalytic antibacterial mechanism towards Enterococcus faecalis and Micrococcus luteus. J. Photochem. Photobiol. B Biol. 2018, 187, 66–75. [Google Scholar] [CrossRef]
- Hoque, A.; Guzman, M.I. Photocatalytic Activity: Experimental Features to Report in Heterogeneous Photocatalysis. Materials 2018, 11, 1990. [Google Scholar] [CrossRef] [PubMed] [Green Version]
- May, R.A.; Kondrachova, L.; Hahn, B.P.; Stevenson, K.J. Optical Constants of Electrodeposited Mixed Molybdenum−Tungsten Oxide Films Determined by Variable-Angle Spectroscopic Ellipsometry. J. Phys. Chem. C 2007, 111, 18251–18257. [Google Scholar] [CrossRef]
- Chary, K.V. Structure and catalytic properties of molybdenum oxide catalysts supported on zirconia. J. Catal. 2004, 226, 283–291. [Google Scholar] [CrossRef]
- Nosaka, Y.; Takahashi, S.; Mitani, Y.; Qiu, X.; Miyauchi, M. Reaction mechanism of visible-light responsive Cu(II)-grafted Mo-doped SrTiO3 photocatalyst studied by means of ESR spectroscopy and chemiluminescence photometry. Appl. Catal. B Environ. 2012, 111, 636–640. [Google Scholar] [CrossRef]
- Xie, S.; Chen, K.; Bell, A.T.; Iglesia, E. Structural Characterization of Molybdenum Oxide Supported on Zirconia. J. Phys. Chem. B 2000, 104, 10059–10068. [Google Scholar] [CrossRef] [Green Version]
- Madhavi, V.; Kumar, P.J.; Kondaiah, P.; Hussain, O.M.; Uthanna, S. Effect of molybdenum doping on the electrochromic properties of tungsten oxide thin films by RF magnetron sputtering. Ionics 2014, 20, 1737–1745. [Google Scholar] [CrossRef]
- Yin, H.; Kuwahara, Y.; Mori, K.; Cheng, H.; Wen, M.; Huo, Y.; Yamashita, H. Localized Surface Plasmon Resonances in Plasmonic Molybdenum Tungsten Oxide Hybrid for Visible-Light-Enhanced Catalytic Reaction. J. Phys. Chem. C 2017, 121, 23531–23540. [Google Scholar] [CrossRef]
- Fan, G.; Bao, M.; Zheng, X.; Hong, L.; Zhan, J.; Chen, Z.; Qu, F. Growth inhibition of harmful cyanobacteria by nanocrystalline Cu-MOF-74: Efficiency and its mechanisms. J. Hazard. Mater. 2019, 367, 529–538. [Google Scholar] [CrossRef] [PubMed]
- Yu, X.; Zhou, J.; Wang, Z.; Cai, W. Preparation of visible light-responsive AgBiO3 bactericide and its control effect on the Microcystis aeruginosa. J. Photochem. Photobiol. B Biol. 2010, 101, 265–270. [Google Scholar] [CrossRef]
- He, X.; Xie, C.; Ma, Y.; Wang, L.; He, X.; Shi, W.; Liu, X.; Liu, Y.; Zhang, Z. Size-dependent toxicity of ThO2 nanoparticles to green algae Chlorella pyrenoidosa. Aquat. Toxicol. 2019, 209, 113–120. [Google Scholar] [CrossRef] [PubMed]
- Wang, L.; Yang, Y.; Chen, S.; Ge, M.; He, J.; Yang, Z.; Lin, P.; Wu, X. White matter integrity correlates with residual consciousness in patients with severe brain injury. Brain Imaging Behav. 2018, 12, 1669–1677. [Google Scholar] [CrossRef] [PubMed]
- Zhou, S.; Shao, Y.; Gao, N.; Zhu, S.; Li, L.; Deng, J.; Zhu, M. Removal of Microcystis aeruginosa by potassium ferrate (VI): Impacts on cells integrity, intracellular organic matter release and disinfection by-products formation. Chem. Eng. J. 2014, 251, 304–309. [Google Scholar] [CrossRef]
- Mitran, G.; Neaţu, F.; Pavel, O.D.; Trandafir, M.M.; Florea, M. Behavior of Molybdenum-Vanadium Mixed Oxides in Selective Oxidation and Disproportionation of Toluene. Materials 2019, 12, 748. [Google Scholar] [CrossRef] [Green Version]
- Znaidi, L.; Touam, T.; Vrel, D.; Souded, N.; Ben Yahia, S.; Brinza, O.; Fischer, A.; Boudrioua, A. AZO Thin Films by Sol-Gel Process for Integrated Optics. Coatings 2013, 3, 126–139. [Google Scholar] [CrossRef] [Green Version]
- Zhao, M.; Chen, X.; Ma, N.; Zhang, Q.; Qu, D.; Li, M. Overvalued allelopathy and overlooked effects of humic acid-like substances on Microcystis aeruginosa and Scenedesmus obliquus competition. Harmful Algae 2018, 78, 18–26. [Google Scholar] [CrossRef]
- Fan, G.; You, Y.; Wang, B.; Wu, S.; Zhang, Z.; Zheng, X.; Bao, M.; Zhan, J. Inactivation of harmful cyanobacteria by Ag/AgCl@ZIF-8 coating under visible light: Efficiency and its mechanisms. Appl. Catal. B Environ. 2019, 256, 123767. [Google Scholar] [CrossRef]
- Metzler, D.M.; Erdem, A.; Huang, C. Influence of Algae Age and Population on the Response to TiO2 Nanoparticles. Int. J. Environ. Res. Public Health 2018, 15, 585. [Google Scholar] [CrossRef] [PubMed] [Green Version]
- Carmona, E.R.; Inostroza-Blancheteau, C.; Obando, V.; Rubió, L.; Marcos, R. Genotoxicity of copper oxide nanoparticles in Drosophila melanogaster. Mutat. Res. Toxicol. Environ. Mutagen. 2015, 791, 1–11. [Google Scholar] [CrossRef] [PubMed]
Figure 1.
Field emission scanning electron microscope (FESEM) image of (A) ZnO, and (B) MoZnO, particle size distribution of (C) ZnO, and (D) MoZnO.
Figure 1.
Field emission scanning electron microscope (FESEM) image of (A) ZnO, and (B) MoZnO, particle size distribution of (C) ZnO, and (D) MoZnO.

Figure 2.
Energy dispersive x-ray analysis (EDX) spectrum of MoZnO. EDX spectrum displayed the atomic composition of MoZnO. The presence of Zn, Mo, O, and Cl elements were observed.
Figure 2.
Energy dispersive x-ray analysis (EDX) spectrum of MoZnO. EDX spectrum displayed the atomic composition of MoZnO. The presence of Zn, Mo, O, and Cl elements were observed.

Figure 3.
X-ray diffraction patterns of the (A) ZnO and (B) MoZnO.

Figure 4.
FT-IR spectra of ZnO, Na2MoO4∙2H2O, and MoZnO.

Figure 5.
Growth inhibition of M. aeruginosa by MoZnO with time. (A) Change in pigment of M. aeruginosa suspension. (B) Change in OD680 of M. aeruginosa, and (C) Inhibition rate (%) of M. aeruginosa. Statistical significance (determined by paired t-test) is shown by * = p < 0.05, ** = p < 0.001, *** = p < 0.0001, when compared to control (0).

Figure 6.
Fluorescence intensity of extracellular ·OH generated at 4 h. C and SC are control groups under open air and shading of M. aeruginosa, and EX and SEX experimental groups under open air and shading of M. aeruginosa. Statistical significance (determined by paired t-test) is shown by *** = p < 0.0001, when compared to control (0).

Figure 7.
Intracellular ROS induced by MoZnO in the M. aeruginosa cells.


Table 1.
Element proportion analysis of MoZnO.
| Element | Weight% | Atomic% |
|---|---|---|
| O | 29.1 | 61.6 |
| Cl | 7.1 | 6.8 |
| Zn | 54.5 | 28.2 |
| Mo | 9.1 | 3.2 |
Table 2.
Calculated crystallite size, lattice constants, and microstrain values of ZnO and MoZnO.
| Material | Dopant Atomic% | Crystallite Size (nm) | Lattice Constant (Å) | c/a | Lattice Strain (ɛ) | |
|---|---|---|---|---|---|---|
| c | a | |||||
| ZnO | 0 | 45 ± 3.5 | 5.2 ± 0.01 | 3.2 ± 0.002 | 1.6 | 0.10 ± 0.03 |
| MoZnO | 3.2 | 4.4 ± 0.61 | 5.2 ± 0.02 | 3.2 ± 0.002 | 1.6 | 4.5 ± 0.5 |
Table 3.
Calculated texture coefficients of MoZnO for the seven main peaks.
| Material | Dopant% | TC(hkl) | ||||||
|---|---|---|---|---|---|---|---|---|
| (100) | (002) | (101) | (102) | (110) | (103) | (112) | ||
| ZnO | 0 | 0.91 | 0.97 | 0.95 | 1.07 | 1.23 | 1.21 | 0.65 |
| MoZnO | 3.23 | 0.85 | 1.07 | 0.55 | 1.28 | 1.08 | 1.03 | 1.13 |
© 2020 by the authors. Licensee MDPI, Basel, Switzerland. This article is an open access article distributed under the terms and conditions of the Creative Commons Attribution (CC BY) license (http://creativecommons.org/licenses/by/4.0/).
Share and Cite
MDPI and ACS Style
Nandanwar, S.; Lee, M.W.; Borkar, S.; Cho, J.H.; Tarte, N.H.; Kim, H.J. Synthesis, Characterization, and Anti-Algal Activity of Molybdenum-Doped Metal Oxides. Catalysts 2020, 10, 805. https://doi.org/10.3390/catal10070805
AMA Style
Nandanwar S, Lee MW, Borkar S, Cho JH, Tarte NH, Kim HJ. Synthesis, Characterization, and Anti-Algal Activity of Molybdenum-Doped Metal Oxides. Catalysts. 2020; 10(7):805. https://doi.org/10.3390/catal10070805
Chicago/Turabian StyleNandanwar, Sondavid, Myung Won Lee, Shweta Borkar, Jeong Hyung Cho, Naresh H. Tarte, and Hak Jun Kim. 2020. "Synthesis, Characterization, and Anti-Algal Activity of Molybdenum-Doped Metal Oxides" Catalysts 10, no. 7: 805. https://doi.org/10.3390/catal10070805
Note that from the first issue of 2016, this journal uses article numbers instead of page numbers. See further details here.