Low-Temperature Selective Catalytic Reduction of NOx on MnO2 Octahedral Molecular Sieves (OMS-2) Doped with Co

1
Fujian Key Laboratory of Advanced Materials, Department of Materials and Engineering, College of Materials, Xiamen, Fujian 361005, China
2
School of Metallurgy and Environment, Central South University, Changsha 410083, China
3
Key Laboratory of Metallurgical Emission Reduction & Resources Recycling (Anhui University of Technology), Ministry of Education, Ma’anshan 243002, China
*
Authors to whom correspondence should be addressed.
Catalysts 2020, 10(4), 396; https://doi.org/10.3390/catal10040396
Submission received: 4 March 2020
/
Revised: 26 March 2020
/
Accepted: 29 March 2020
/
Published: 3 April 2020
(This article belongs to the Special Issue Porous Materials and Catalysts)
Abstract
:To improve NO conversion and sulfur resistance of low-temperature NO-CO selective catalytic reduction (SCR), it is urgent to seek new catalyst materials. Herein, using the pre-doping method, Cox-OMS-2 with different ratios of cobalt (Co) was obtained during hydrothermal synthesis of OMS-2 molecular sieves (where x represents the doping ratio of Co, i.e., x = 0.1, 0.2, 0.3, 0.4). Co was found to very efficiently intercalate into the crystal structure of OMS-2. Co and Mn work together to promote the selective reduction reaction of NOx;; the NO conversion of Co0.3-OMS-2 was the highest among all samples. Specifically, NO conversion at 50 °C increased from 72% for undoped OMS-2 to 90% for Co0.3-OMS-2. Moreover, due to the incorporation of Co, the latter also showed better sulfur resistance.
1. Introduction
At present, the main sources of nitrogen oxide (NOx) emissions are industrial waste gas, automobile exhausts and the burning of coal, diesel and gasoline [1,2,3]. The ternary V2O5-WO3(MoO3)/TiO2 catalyst system, which has been widely used commercially, is efficient for nitrogen oxide removal at high temperature ranges (300–400 °C). However, the poor low-temperature (<300 °C) activity of this catalyst, its narrow operating temperature window, toxic active components and tendency to produce N2O, among other problems, limits its further application [4,5,6]. Therefore, the search for a new type of low-temperature catalyst with high denitrification activity has become a focus of intense research.
Currently, the most widely used denitrification technology is NH3-selective catalytic reduction (SCR). However, this has problems such as poor low-temperature activity and a narrow active-temperature window [7,8,9]. As an alternative, research suggests that carbon monoxide SCR (CO-SCR)-based catalysts may have the advantages of a low activation temperature range, excellent catalytic performance and good resistance to sulfur and water [10,11,12,13,14]. Therefore, the search for CO-SCR catalysts fulfilling these characteristics has become a defining theme in the field of remediation.
CO-SCR technology uses CO gas as a reducing agent to reduce nitrogen oxides such as NO to non-toxic N2, assisted by a catalyst. This technology allows exhaust gas to react with each other to effectively achieve exhaust gas treatment, thus simultaneously reducing the emissions of CO and NOx [14,15,16]. The key to this technology is to find the correct catalyst.
Transition metal-based oxide catalysts have drawn much attention for low-temperature NH3-SCR due to their excellent redox properties, high activity, durability and relatively low manufacturing costs. Particularly, MnOx-based catalyst formulations have caught much attention because of their excellent de-NOx efficiency at low-temperatures [17]. A series of titanium-supported transition metal oxide catalysts were evaluated for NO reduction with CO as reductant at low temperature (200 °C) in Boningari [18] et al.’s study. The results show that MnOx/TiO2 was the preeminent catalyst among the investigated systems. And they found that the reaction mechanism follows a different pathway for their catalyst, from that of the other metal-based catalysts. This finding has great significance for the study of CO-NO redox reactions. Luo [19] used a natural active octahedral molecular sieve to achieve good results in catalytic oxidation of VOCs at low temperature. Manganese oxide octahedral molecular sieve has good selectivity and adsorption to CO and NO, meaning it is a highly promising catalyst for CO-SCR technology. Manganese oxide octahedral molecular sieves are a new class of material similar to porous zeolite-type molecular sieves. Their crystal structure is composed of 2 × 2 octahedral MnO6 chains, where each chain is connected with the oxygen atom at the apex of octahedral MnO6. In a one-dimensional channel of approximately 0.46 nm × 0.46 nm, manganese ions exist in the skeleton of OMS-2 in a mixed valence state and K+ ions are located in the center of the channel surrounded by [MnO6] octahedra to maintain the overall charge balance [20,21,22,23].
Different preparation methods affect the crystal morphology and texture of these molecular sieves, which in turn affects their catalytic performance. Therefore, the choice of preparation method is crucial. At present, the main preparation methods of OMS-2 are refluxing, solid-phase synthesis and heating in water [24,25,26,27]. Wang et al. [28] used a number of different methods to prepare a series of OMS-2 catalysts and investigated the effect of the preparation method on the low-temperature NH3-SCR catalytic performance. The study found that OMS-2 catalyst has higher catalytic activity under low temperature conditions (<300 °C) than traditional manganese -based catalysts or V2O5-WO3 (MoO3)/TiO2 catalysts. The low temperature SCR activity of OMS-2 catalyst is significantly better than that of MnOx catalyst at 50–150 °C and the NOx conversion rate of OMS-2 catalyst is close to 100% at 120 °C. No further research has been conducted on the sulfur resistance of OMS-2 catalyst.
Manganese has five oxidation states; this mixed valence makes the recently developed manganese-potassium zeolite molecular sieves substantially different from other molecular sieves. Meanwhile, the transition metal-based OMS-2 sieves not only have catalytic properties but are also capable of surface acid-base and ion-exchange reactions, which enables their metal matrix to be effectively doped by other transition metals. This is the basis of modified OMS-2 [29]. Cao [30] successfully synthesized manganese oxide octahedral molecular sieve nanorods by reflux method. The silver sieves were doped with silver atoms, and the structure of the silver-manganese molecular sieve was finely analyzed using X-ray absorption fine structure and Rietveld refinements of X-ray diffraction. The research results show that silver atoms are successfully doped in the pores of a molecular sieve to form a highly dispersed monoatomic structure. The discovery of this result has innovative significance for the study of metallic monoatomic dispersion.
In this paper, different proportions of cobalt (Co) dopant were added during the hydrothermal synthesis of the OMS-2 catalyst, with the aim of preparing a molecular sieve catalyst with a NO conversion reaching 90% at low temperature (50–300 °C).
2. Results and Discussion
Figure 1 shows the XRD patterns of OMS-2 molecular sieves containing different proportions (x) of Co dopant, where x is 0.1–0.4. It can be seen that the diffraction peaks of the OMS-2 molecular sieves modified by Co were at 2θ = 12.819°, 18.089°, 25.802°, 28.493°, 37.441°, 42.193°, 46.534°, 50.077°, 56.402°, 60.024°, 65.185°, 68.997° and 72.673°, which can be assigned to the KMn8O16 of cryptomelane type. (PDF#44-0141). The corresponding crystal faces (110), (200), (310), (211), (301), (411) and (521) were respectively detected at diffraction angles 2θ = 12.7°, 18.0°, 28.7°, 37.4°, 41.8°, 50.0° and 60.0°. The average lattice parameters of OMS-2 after doping cobalt were a = 9.8759 Å, b = 2.8626 Å, c = 9.6333 Å, α = 90 °, β = 90.42 °, γ = 90 °. The lattice parameters of the OMS-2 standard PDF card were a = 9.942 Å, b = 2.866, c = 9.709; α = 90 °, β = 90.84 °, γ = 90 °, which were almost the same. In the XRD diagram, only the diffraction peak representing the OMS-2 structure can be seen and there is no corresponding metal diffraction peak, indicating that the doped metal intercalated efficiently into the crystal structure of OMS-2. With the increase of Co doping content, the degree of crystallinity of OMS-2 decreased successively, due to the formation of lower crystallinity MnO2. Compared with the undoped OMS-2, the intensity of the peaks for the (310) and (211) crystal planes of the Co0.1-OMS-2 and Co0.2-OMS-2 samples is higher, indicating that the addition of a small amount of Co increased the exposure of the (310) and (211) crystal planes of OMS-2. The crystallite size of OMS-2 calculated by Scherer’s formula is 9.4 nm. In addition, the crystallite sizes of Co(0.1–0.4)-OMS-2 were 8.1 nm, 9.9 nm, 7.1 nm and 7.7 nm, respectively.
Figure 2 shows the nitrogen adsorption/desorption isotherms of the Cox-OMS-2 catalysts. The isotherms of the Co-doped Cox-OMS-2 catalysts are all typical of mesoporous materials. According to the IUPAC classification, Cox-OMS-2 belongs to class IV in terms of its isothermal adsorption/desorption.
The amount of nitrogen adsorption increased with the increase of relative pressure (P/P). With the increase of Co doping amount, the nitrogen adsorption amount first increased and then decreased and reached its highest value when x was 0.3. In the low P/P region, the curve rose slowly, and single-layer molecular adsorption occurred; in the high P/P region, capillary condensation of adsorbent materials occurs, and the isotherm rose rapidly. Due to capillary condensation, a hysteresis loop could be observed in this region [31]. Such loops can reflect the relative proportion of pores or capillaries between particles of a material with a particular shape. The XRD characterization showed that the doped Co did not form a heterophase, implying that the pores of the molecular sieves were not blocked by Co oxide. Therefore, it is possible that the doped Co modified the adsorption capacity of the molecular sieves by changing the size of the pore passages [32,33,34,35]. Table 1 shows the specific surface areas of OMS-2 with different Co doping amounts.
It can be seen that as the amount of Co doping increased, the specific surface area and pore volume of OMS-2 first increased. then decreased; the maximum specific surface area, maximum pore volume and maximum average pore size reached at an x value of 0.3. This trend of the specific surface area of the samples was consistent with the NO conversion, which also reached the maximum when x was 0.3. Thus, the NO conversion increased with specific surface area.
Figure 3 shows the nitrogen adsorption/desorption pore-size distribution of OMS-2. It can be seen from Figure 3b that the sample pore volume increases with pore size. With an increase of Co doping amount, the overall pore volume of the material first increased, then decreased; the pore volume of Co0.3-OMS-2 was significantly higher than that of the other three catalysts. This trend is consistent with the nitrogen adsorption/desorption curves of the samples. It can be seen from Figure 3a that OMS-2 has a wide pore size distribution, ranging from 3 nm to 65 nm. The peak diameter of the pores was between 20 nm and 50 nm, indicating that most of the sample consisted of mesopores and the OMS-2 molecular sieve can be classified as mesoporous. As the proportion of Co doping increased, the peak intensity first increased and then decreased, indicating that the number of pores first increased and then decreased. The sample Co0.3-OMS-2 had the highest number of pores, and the position of the peak did not change with the change in the proportion of doping, indicating that the pores of the modified material were not blocked. OMS-2 retained good mesoporous characteristics after modification and the pore size was mainly in the nanoscale range.
Figure 4 shows the electron micrographs of molecular sieves OMS-2 with Co doping amounts of 0.1–0.4. It can be seen that as the proportion of Co doping increases, the tubular structures of the sample become shorter and the particle size decreased. Both Co0.1-OMS-2 and Co0.2-OMS-2 show a clear one-dimensional linear structure, and no other impurity phases were observed. Co0.3-OMS-2 exhibits some flocculent aggregation between linear structures; when the Co doping proportion reached 0.4, the sample morphology shows clear flocculation. Comparing the morphologies of pure OMS-2 (Figure 4e) and Co-modified Co0.3-OMS-2 (Figure 4f), it can be seen that the one-dimensional tubular microstructures of OMS-2 become smaller and shorter after modification, and a fibrous structure becomes clearer. The Co atoms were dispersed well in Co0.3-OMS-2, as shown in Figure 4g, h.
The difference in the morphology of OMS-2 with different Co doping proportions may have been determined by the final morphology of the doped metal species in the products. In the synthesized Co-OMS-2 catalysts, the doping metal can exist in two forms: as a separate metal oxide on the surface of the catalyst, or as metal ions replacing the Mn sites in the OMS-2 skeleton or the K sites in the channel. Only diffraction peaks of the OMS-2 structure were observed in the XRD pattern. Therefore, the doped metal may replace the ions in the skeleton or pores, resulting in the distortion of the OMS-2 morphology, or forming metal oxide crystallite on the catalyst surface so that it cannot be detected. If Co is substituted for K in the K sites, the tunnels of the OMS-2 structure will be distorted, and the molecular sieve pores will shrink. If Co replaces the Mn sites, meanwhile, the thickness of the OMS-2 tube wall will decrease [35]. To find out what form the Co-exist in, further characterization is required.
The nanorod morphology of OMS-2 is shown in Figure 5d [30]. It is a one-dimensional tetragonal prism structure. The nanorods grow in the [001] direction; all sides are exposed to the (110) crystal plane, the top is a quadrangular pyramid, and the (310) crystal plane is exposed. The angle between the edge of the prism and the (001) plane is about 90° [19]. This structure was previously shown to be a mesoporous structure [36], thus enabling a way for molecules or ions with suitable kinetic diameter to diffuse into the pores.
TEM images of the prepared OMS-2 are shown in Figure 5. Figure 5a shows the TEM-imaged morphology, from which it can be seen that the OMS-2 nanorods synthesized under the above conditions have a diameter of approximately 7 nm, different lengths and no microporous structure. Figure 5b shows the diffraction pattern of the OMS-2 crystal, in which a pattern of semi-diffraction rings is formed, indicating that the OMS-2 prepared under these conditions largely forms a single crystal structure. The diffraction pattern of the (200), (310) and (211) crystal planes of OMS-2 can be clearly identified by comparison with the pattern of the standard diffraction rings [37]. In the diffraction pattern, the (310) crystal plane diffraction region is the most pronounced. The (310) exposed crystal plane atoms are arranged in K+-[MnO6] 2 × 2 channels or O-[MnO6] 2 × 2 channels (where O represents vacancies). K+ at the coordination center is the main Lewis acid site of OMS-2, which binds to NO and allows NO to enter the interior of the molecular sieve via the orifice. Thus, an N2O intermediate active substance is formed and adsorbed on the molecular sieve [23]. Figure 5c is a high-resolution TEM (HRTEM) image of the OMS-2 synthesized under the above conditions, which shows clear lattice fringes extending along the [001] direction of the OMS-2 crystal axis. The lattice fringe spacings shown in Figure 5c are 0.47 nm and 0.29 nm, respectively corresponding to the crystal face (200) and (110). Moreover, there are O atoms in sp2 and sp3 states on the crystal surface. Mn-O(sp3) bonds can more easily be activated by CO because of their longer average bond length. The CO is adsorbed on the surface by O(sp3)···Co coordinate bonds [38]. The active oxygen species are transferred inside and outside the molecular sieve, so that the CO adsorbed on the outer surface generates CO2, and the N2O adsorbed in the pores generates N2 to complete the entire CO-SCR process [39]. Some crystal defects are shown along the c crystal axis and around the boundary of the well-structured nanocrystals. This can be attributed to the growth mechanism of the well-developed nanocrystalline fibers, which involves the self-organization of compact particles with a common crystal orientation [40].
Figure 6 shows the particle morphology, lattice fringe spacing and ion diffraction pattern of Co0.2-OMS-2 and Co0.4-OMS-2. As can be seen, when the proportion of Co doping is small, the two nanotubes in Co0.2-OMS-2 exhibit a large difference in size, with diameters of 6 nm and 10 nm, respectively. The nanotube lattice fringe spacing is relatively small but slightly larger than that of OMS-2, according to the standard PDF data. Figure 6b, e show the HRTEM images of Co0.2-OMS-2 and Co0.4-OMS-2, with clear lattice fringes. The lattice fringe spacing of Co0.2-OMS-2 is 0.21 nm, corresponding to the crystal face (301); the lattice fringe spacing of Co0.4-OMS-2 is 0.28 nm, corresponding to the crystal face (001) [19]. In the selected-area electron diffraction (SAED) pattern, there are several concentric rings in the same crystal plane, which belong to different tetragonal crystal systems. When the Co doping proportion is large (x = 0.4), the particle morphology and diffraction pattern of Co0.4-OMS-2 tend to be uniform. Moreover, all the lattice fringe spacings are larger than those in OMS-2 (standard PDF data). When Co replaces Mn in the MnO6 crystal cell, it forms a new CoO6 crystal system, and the Co-O bond is longer than the Mn-O bond, causing the lattice fringe spacing to increase and the diffraction pattern to change.
Table 2 shows the Analysis of Mn value in Co-OMS-2 before and after reaction.Mn participates in catalytic reactions in the form of +3 and +4 valences.
The X-ray photoelectron spectroscopy (XPS) spectra of K2p for the Co-OMS-2 catalysts are displayed in Figure 7a. Two main peaks of K2p3/2 and K2p1/2 are observed. The intensity of the peak of K2p increases after the reaction. As shown in Figure 7b, two main peaks of Mn2p3/2 and Mn2p1/2 were also observed for Mn. The spectrum of Mn2p3/2 can be divided into two sub-bands assigned to Mn2O3 (640–643 eV) and MnO2 (641–646 eV). Likewise, the spectrum of Mn2p1/2 can also be divided into two sub-bands assigned to Mn2O3 (651–655 eV) and MnO2 (652–660 eV).
The XPS spectra of Co2p for the Co0.3-OMS-2 catalyst are displayed in Figure 8.Two main peaks with satellite peaks are observed, corresponding to the binding energies of Co2p1/2 and Co2p3/2 at 791–800 and 775–783 eV, respectively.
The peak of Co2p3/2 can be ascribed to Co3O4, indicating that the doped Co in the material exists in +2 and +3 valence states, and the intensity of the peak of Co2p3/2 decreases after the reaction— implying that doping with Co will affect the material’s catalytic performance in the denitrification reaction.
In the study of Pietrzyk [41], the author revealed the interaction of Co2+ and NO in SCR by spectroscopy, it was believed that Co2+ adsorbed NO to form Co2+(NO)2 active intermediate species and removed NO by the form of Co2+(NO)2. Wang, Y [42] proposed in his experimental study that Co3+ and CO form Co3+CO active intermediate species. At the same time, basing on the achievements of our group about OMS-2 [43], The chemical process of OMS-2 catalyzing CO-NO reaction can be attributed to the following reactions (Equations (1) and (2)):
NO + Mn3+→N2 + Mn4+ + O2
CO + O2 + Mn4+→CO2 + N2 + Mn3+
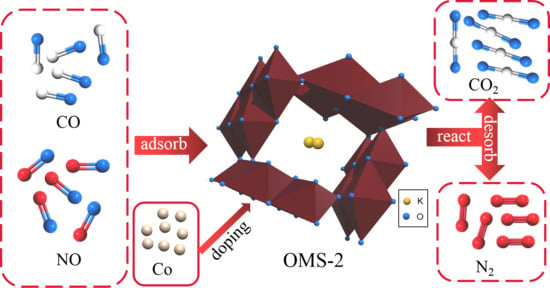
A mixed valence state plays a critical role in redox catalysts. The efficiency of electron transfer between catalysts usually depends on the relationship between the cations of different valence states. Therefore, we speculate that the process of catalytic denitrification by Co-OMS-2 involved adsorption of CO and NO on the active sites of Co2+ and Co3+ of Co-OMS-2, which has an extremely high specific surface area, to form activated adsorption species, thus promoting the formation of CO2 and N2 from CO and NOx. At the same time, the active sites of Mn4+ and Mn3+ also adsorbed CO and NO and converted these species into CO2 and N2. The catalytic process of Co-OMS-2 in Figure 9. The catalytic denitrification process is likely to follow the Langmuir-Hinshelwood mechanism according to the following reactions (Equations (3)–(6)) [42]:
Co2+ + 2NO→Co2+(NO)2→Co3+ + N2
Co3+ + CO→Co3+CO→Co2+ + CO2
CO + Mn4+→CO2 + Mn3+
Mn3+ + NO→Mn4+ + N2
When Co is doped into OMS-2 in an appropriate amount and Co sites are successfully formed, we can make such hypothesis that Co sites are more active than Mn sites at low temperature on the basis of experimental characterization and the proposed mechanism. Co and Mn work together to promote the selective reduction reaction of NOx.
In this study, the NO conversions of Cox-OMS-2 materials doped with different proportions of Co (i.e., x) were measured. According to the principle of CO-SCR catalytic denitrification, the gas phase ratio of CO:NO = 1:1 was selected, and the NO conversion was measured in the temperature range of 50–300 °C.
Figure 10 shows the NO conversion curves of four materials with different Co doping ratios and pure OMS-2 at 50–300 °C. It can be seen that the NO conversion of pure OMS-2 and OMS-2 doped with different proportions of Co all increased at higher temperature. The NO conversions of Co0.2-OMS-2 and Co0.3-OMS-2 were higher than that of pure OMS-2, while those of Co0.1-OMS-2 and Co0.4-OMS-2 were lower than that of pure OMS-2. Among all catalysts, Co0.3-OMS-2 had the highest activity, reaching 90% NO conversion at 50 °C and 95% NO conversion at 100–300 °C. The activity of Co0.4-OMS-2 was the poorest, with a NO conversion of less than 65% at 50 °C and only 80% at 300 °C. Evidently, x = 0.3 is the most appropriate doping proportion; higher or lower values will reduce the low-temperature activity of Co-OMS-2. When the doping ratio is too high (0.4), either the pores of the catalyst are too small, or they are blocked by the doped metal forming oxides, which reduces the catalytic activity.
The by-product of CO reduction of NO is N2O. Due to the high temperature required for the side reaction, the catalyst usually has good N2 selectivity under low temperature conditions and can reduce all NO to N2. However, catalysts with higher activity on the main reaction can also catalyze side reactions. Figure 11 shows the N2 selectivity curves of four materials with different Co doping ratios and pure OMS-2 at 50–300 °C. When the reaction temperature is below 100 °C, the N2 selectivity is 100%. As the temperature increases, the N2 selectivity decreases. As can be seen from Figure 10 and Figure 11, Co0.3-OMS-2 achieved 95% NO conversion and 95.2% N2 selectivity at 200 °C. At 300 °C, the N2 selectivity of Co0.3-OMS-2 drops to 88.5%. OMS-2 reduces N2 selectivity while increasing NO conversion.
Figure 12 shows the NO conversion of OMS-2 in the absence of SO2 and in the presence of SO2. It can be seen that the presence of SO2 reduces the NO conversion of OMS-2. Figure 12b shows the NO conversion of modified Co-OMS-2 in the presence of SO2. The sulfur resistance of the modified OMS-2 was improved: in the presence of SO2, the NO conversions of Co0.1-OMS-2 and Co0.4-OMS-2 at 50 °C were 5%–7% higher than that of pure OMS-2. The difference between the NO conversions of Co0.1-OMS-2/Co0.4-OMS-2 OMS-2 and pure OMS-2 was not significant at 100–300 °C. However, in the presence of SO2, Co0.3-OMS-2 had a higher NO conversion than pure OMS-2 by 15% at 50 °C, and 5% at 100–300 °C. In the presence of SO2, the NO conversion of Co0.3-OMS-2 at 50 °C was 27% higher than that of pure OMS-2; at 100 °C it was 15% higher than that of pure OMS-2.
At 150–250 °C, the NO conversion of Co0.3-OMS-2 in the presence of SO2 was approximately 10% higher than that of pure OMS-2. Therefore, doping with Co effectively improved the sulfur resistance of OMS-2. A possible explanation for this is that after modification by Co, the microscopic one-dimensional tubular structures of OMS-2 became thinner and shorter, reducing the particle size of the material, leading to the contraction of the pore diameter of the molecular sieve. Thus, while SO2 molecules, with a molecular diameter of approximately 0.41 nm, cannot easily pass through such narrow pores, CO, with a diameter of 0.33 nm; NO, with a diameter of 0.35 nm, can still enter and react in the pore channels.
3. Experimental
3.1. Preparation of Cox-OMS-2
Main experimental reagents and materials were potassium permanganate (KMnO4, Chemically pure, Sinopharm Chemical Reagent Co., Ltd., Shanghai, China), manganese acetate tetrahydrate (Mn(CH3COO)2·4H2O, analytically pure, Sinopharm chemical reagent co. LTD, Shanghai, China) and Cobalt- nitrate hexahydrate(Co(NO3)2·6H2O, analytically pure, Guangdong Fine Chemical Engineering Technology Research and Development Center).
Cox-OMS-2 molecular sieves were prepared by the pre-doping method (where x represented the Co/Mn molar ratio; in this study, x = 0.1, 0.2, 0.3 or 0.4; e.g., Co0.2-OMS-2). First, 2.528 g of potassium permanganate (0.016 mol) was dissolved in 30 mL of deionized water, to form solution A. Then, 4.092 g (0.02 mol) of manganese acetate tetrahydrate and a calculated amount of cobalt nitrate were weighed into a beaker and dissolved in 30 mL of deionized water, forming solution B. Then, solution B was poured into a polytetrafluoroethylene autoclave and solution A was slowly added with stirring with a glass rod. After the solution was uniformly mixed, the autoclave was sealed and placed in an oven. The oven was heated to 120 °C for 4 h (The oven was pre-set to this temperature). After this time, the oven was cooled to room temperature, the autoclave was carefully opened and the crude product was washed with successively with 10mldeionized water and 10 mL absolute ethanol to remove impurities. After washing, transfer the mixture to a centrifuge tube (100 mL) and centrifuge for 5 min (7000r/min). The resulting black solid obtained by centrifugation was dried at 100 °C for 12 h, then ground to a powder and placed in a sealed bag for use.
3.2. Material Characterization
The phases and crystalline structures were characterized by X-ray diffractometry (XRD, TTR III, Rint-2000, Rigaku, λ = 0.15418 nm) using CuKα radiation at the 2θ range of 10°–80° at a scanning rate of 2° per minute. The morphology and microstructural properties of the prepared samples were characterized by scanning electron microscopy (SEM, J SM-5600LV, JEOL, Tokyo, Japan) and transmission electron microscopy (TEM, JEM-2100F, JEOL, Tokyo, Japan). The images were analyzed by DM3 software and the lattice spacing was measured by fast Fourier transform. The specific surface area values were obtained by a fully automatic specific surface area and pore analyzer (BET, ASAP2020, Micromeritics Instrument Ltd., Shanghai, China).
3.3. Catalytic Tests
The catalytic denitrification performance of the synthetic catalysts was tested. The experimental system consisted of three parts, for gas distribution, catalysis and detection. NO was the main target for removal by denitrification. The composition of the gas was controlled by a valve meter; the overall gas velocity was controlled at 400 mL/min. The process gas was allowed to enter the mixing tank and then fed into the catalytic system. The catalytic system contained approximately 1 g of catalyst and a fixed bed of high-temperature resistant quartz wool of approximately 10 mm length in the center of a high-temperature resistant quartz glass tube having an inner diameter of 12 mm and a length of 500 mm. The catalyst catalyzed the oxidation of NO and CO at a certain temperature. The temperature of the tubular resistance furnace was controlled by a programmable temperature controller, and was raised from the ambient value to the desired temperature at a rate of 2.5 °C/min (where the selected temperature points were 50 °C, 100 °C, 150 °C, 200 °C, 250 °C and 300 °C) and maintained at this temperature for 1 h. The mixed gas catalytically reacted over the fixed bed of the catalyst and was then discharged to the detection system. The composition of the sulfur-free reaction gas was 500 ppm NO and 500 ppm CO, balanced with air; and the sulfur-containing reaction gas composition was 500 ppm NO, 500 ppm CO and 1000 ppm SO2, balanced with air. The real-time flue gas composition was recorded every minute by a VARIO PLUS enhanced flue gas analyzer and an NDIR infrared sensor was used in the flue gas analyzer to detect the NO emission. When analyzing the data recorded by the flue gas analyzer per minute, the maximum deviation value was discarded, and the average value was taken as the gas composition at the corresponding temperature point. The NO conversion was calculated as follows (Equation (7)):
where [NO]in: NO content entering quartz tube. [NOX]out: Contents of NO and NO2 after reaction, as recorded by the flue gas analyzer.
XNO = {([NO]in − [NOX]out)/[NO]in} × 100% (NOX contains NO and NO2)
4. Conclusions
The inner pore channels of the OMS-2 molecular sieve are mainly microporous; increasing the specific surface area of this material while shrinking the pore aperture size improved its NO conversion. Doped metals intercalated very efficiently into the crystal structure of OMS-2. During the pre-doping modification process, Co replaced the Mn site in the [MnO6] unit cell to form a new [CoO6] crystal system. As the proportion of Co dopant was increased, the degree of crystallinity of the resulting Co-doped OMS-2 decreased. Small proportions of Co dopant further exposed the (310) and (211) crystal faces of OMS-2. Co replaced Mn to form new active sites, and the active sites of Co2+, Co3+, Mn3+ and Mn4+ adsorbed CO and NO and converted these species into CO2 and N2. In addition, the tubular structures of the sample became shorter and the particle size became smaller following Co doping. Meanwhile, the low-temperature NO conversion of OMS-2 was increased: compared with undoped OMS-2, the NO conversion of Co0.3-OMS-2 in flue gas at 50 °C increased from 72% to 90% and reached approximately 95% at 100–300 °C. Doping with Co also improved the sulfur resistance of the catalyst.
Author Contributions
Conceptualization, L.L. and H.H.; methodology, L.L.; software, Y.W.; validation, L.L., L.Z. and Y.Y.; formal analysis, Y.W.; investigation, Y.W.; resources, H.H.; data curation, H.H.; writing—original draft preparation, Y.W.; writing—review and editing, L.L.; supervision, L.L.; project administration, H.H.; funding acquisition, H.H. All authors have read and agreed to the published version of the manuscript.
Funding
The work was supported by Hunan Province’s Scientific Technology Project of Strategic Emerging Industries and Major Achievement Transformation in 2017 (2017GK4010), the Hunan Province Natural Science Foundation (2019JJ40378), the National Key Laboratory of Environmental Protection, Mineral Resources Utilization and Pollution Control, the Open Sharing Fund for the Large-scale Instruments and Equipment of Central South University, the State Environmental Protection Key Laboratory of Mineral Metallurgical Resources Utilization and Pollution Control, Wuhan University of Science and Technology and the Open Foundation of State Environmental Protection Key Laboratory of Mineral Metallurgical Resources Utilization and Pollution Control (HB201908).
Conflicts of Interest
The authors declare no conflict of interest.
References
- Cai, Z.; Xing, G.; Yan, X.; Xu, H.; Tsuruta, H.; Yagi, K.; Minami, K. Methane and nitrous oxide emissions from rice paddy fields as affected by nitrogen fertilisers and water management. Plant Soil 1997, 196, 7–14. [Google Scholar] [CrossRef]
- Barton, P.K.; Atwater, J.W. Nitrous Oxide Emissions and the Anthropogenic Nitrogen in Wastewater and Solid Waste. J. Environ. Eng. 2002, 128, 137–150. [Google Scholar] [CrossRef] [Green Version]
- Du, E.; Dong, D.; Zeng, X.; Sun, Z.; Jiang, X.; de Vries, W. Direct effect of acid rain on leaf chlorophyll content of terrestrial plants in China. Sci. Total Environ. 2017, 605, 764–769. [Google Scholar] [CrossRef] [PubMed]
- Shan, W.; Liu, F.; He, H.; Shi, X.; Zhang, C. Novel cerium–tungsten mixed oxide catalyst for the selective catalytic reduction of NOx with NH3. Chem. Commun. 2011, 47, 8046–8048. [Google Scholar] [CrossRef] [Green Version]
- Qin, Y.; Huang, L.; Zheng, J.; Ren, Q. Low-temperature selective catalytic reduction of NO with CO over A-Cu-BTC and AOx/CuOy/C catalyst. Inorg. Chem. Commun. 2016, 72, 78–82. [Google Scholar] [CrossRef]
- Qin, Y.; Sun, L.; Zhang, D.; Huang, L. Role of ceria in the improvement of SO2 resistance of LaxCe1− xFeO3 catalysts for catalytic reduction of NO with CO. Catal. Commun. 2016, 79, 53–57. [Google Scholar] [CrossRef]
- Frey, A.M.; Mert, S.; Due-Hansen, J.; Fehrmann, R.; Christensen, C.H. Fe-BEA zeolite catalysts for NH 3-SCR of NO x. Catal. Lett. 2009, 130, 1–8. [Google Scholar] [CrossRef]
- Iwasaki, M.; Yamazaki, K.; Banno, K.; Shinjoh, H. Characterization of Fe/ZSM-5 DeNOx catalysts prepared by different methods: Relationships between active Fe sites and NH3-SCR performance. J. Catal. 2008, 260, 205–216. [Google Scholar] [CrossRef]
- Chang, H.; Chen, X.; Li, J.; Ma, L.; Wang, C.; Liu, C.; Schwank, J.W.; Hao, J. Improvement of activity and SO2 tolerance of Sn-modified MnO x–CeO2 catalysts for NH3-SCR at low temperatures. Environ. Sci. Technol. 2013, 47, 5294–5301. [Google Scholar] [CrossRef]
- Shelef, M.; Graham, G.W. Why rhodium in automotive three-way catalysts? Catal. Rev. 1994, 36, 433–457. [Google Scholar] [CrossRef]
- Kantcheva, M.; Milanova, M.; Mametsheripov, S. In situ FT-IR spectroscopic investigation of gold supported on tungstated zirconia as catalyst for CO-SCR of NOx. Catal. Today 2012, 191, 12–19. [Google Scholar] [CrossRef] [Green Version]
- Sultana, A.; Haneda, M.; Hamada, H. A new concept of combined NH3-CO-SCR system for efficient NO reduction in excess oxygen. Appl. Catal. B Environ. 2009, 88, 180–184. [Google Scholar] [CrossRef]
- Junying, L.; Fan, G.; Yaping, G.; Hongdan, X. Review of Catalysts for Selective Catalytic Reduction of NO~ x. Chem. Ind. Eng. Prog. 2005, 24, 1079. [Google Scholar]
- He, L.F.; Liu, J.D.; Huang, W.; Li, Z. Effect of preparation methods of Mn-Ce/ZSM-5 catalyst for low-temperature selective catalytic reduction of NO. Chem. J. Chin. Univ. 2012, 33, 2532–2536. [Google Scholar]
- Breitenbach, L.P.; Shelef, M. Development of a method for the analysis of NO2 and NH3 by NO-measuring instruments. J. Air Pollut. Control Assoc. 1973, 23, 128–131. [Google Scholar] [CrossRef]
- Xie, X.P. Synthesis of Micro/Nano Structured CuMnOx and VMnOx for CO Oxidation; Henan Normal University: Xinxiang, China, 2016. [Google Scholar]
- Damma, D.; Ettireddy, P.R.; Reddy, B.M.; Smirniotis, P.G. A Review of Low Temperature NH3-SCR for Removal of NOx. Catalysts 2019, 9, 349. [Google Scholar] [CrossRef] [Green Version]
- Boningari, T.; Pavani, S.M.; Ettireddy, P.R.; Chuang, S.S.C.; Smirniotis, P.G. Mechanistic investigations on NO reduction with CO over Mn/TiO2 catalyst at low temperatures. Mol. Catal. 2018, 451, 33–42. [Google Scholar] [CrossRef]
- Luo, J.; Zhang, Q.; Huang, A.; Suib, S.L. Total oxidation of volatile organic compounds with hydrophobic cryptomelane-type octahedral molecular sieves. Microporous Mesoporous Mater. 2000, 35–36, 209–217. [Google Scholar] [CrossRef]
- Anhuai, L.U.; Xiang, G.; Amp, Q.S.; Changqiu, W.; University, P. Cryptomelane (K_xMn_(8-x)O_(16)) Natural active octahedral molecular sieve(OMS-2). Chin. Sci. Bull. 2003, 48, 82–85. [Google Scholar]
- Deng, Y.Q. Controllable Synthesis, Characterization and Catalytic Application of MFI and OMS-2 Molecular Sieves with Novel Structure and Morphology; Hunan University: Changsha, China, 2014. [Google Scholar]
- Zhao, H.; Qing, Y.E.; Zhang, Y.; Xiaoxin, L.I.; Meng, L.I.; Wang, D. Prepared of Cu-loading manganese oxide octahedral molecular sieves and its catalytic performance for CO oxidation. Environ. Pollut. Control 2014, 4, 48–52. [Google Scholar]
- Wang, C.; Ma, J.; Liu, F.; He, H.; Zhang, R. The effects of Mn2+ precursors on the structure and ozone decomposition activity of cryptomelane-type manganese oxide (OMS-2) catalysts. J. Phys. Chem. C 2015, 119, 23119–23126. [Google Scholar] [CrossRef]
- Scire, S.; Minico, S.; Crisafulli, C.; Satriano, C.; Pistone, A. Catalytic combustion of volatile organic compounds on gold/cerium oxide catalysts. Appl. Catal. B Environ. 2003, 40, 43–49. [Google Scholar] [CrossRef]
- Genuino, H.C.; Seraji, M.S.; Meng, Y.; Valencia, D.; Suib, S.L. Combined experimental and computational study of CO oxidation promoted by Nb in manganese oxide octahedral molecular sieves. Appl. Catal. B Environ. 2015, 163, 361–369. [Google Scholar] [CrossRef] [Green Version]
- Sithambaram, S.; Kumar, R.; Son, Y.; Suib, S.L. Tandem catalysis: Direct catalytic synthesis of imines from alcohols using manganese octahedral molecular sieves. J. Catal. 2008, 253, 269–277. [Google Scholar] [CrossRef]
- Rasul, S.; Suzuki, S.; Yamaguchi, S.; Miyayama, M. Manganese oxide octahedral molecular sieves as insertion electrodes for rechargeable Mg batteries. Electrochim. Acta 2013, 110, 247–252. [Google Scholar] [CrossRef]
- Wang, Y.; Xin, L.; Ping, N.; Zhang, Q.; Zhang, J.; Xu, L.; Tang, X.; Wang, M. Effect of preparation methods on selective catalytic reduction of NOx with NH3 over manganese oxide octahedral molecular sieves. J. Fuel Chem. Technol. 2014, 42, 1357–1364. [Google Scholar] [CrossRef]
- Suib, S.L. Porous manganese oxide octahedral molecular sieves and octahedral layered materials. Acc. Chem. Res. 2008, 41, 479–487. [Google Scholar] [CrossRef]
- Cao, Q. Structure and Catalytic Performance of Silver-Manganese Oxide Sieve; Fudan University: Shanghai, China, 2011. [Google Scholar]
- Nenoff, T.M.; Ockwig, N.W.; Cygan, R.T.; Alam, T.M.; Leung, K.; Pless, J.D.; Xu, H.; Hartl, M.A.; Daemen, L.L. Role of water in the ion selectivity of niobate-based octahedral molecular sieves. J. Phys. Chem. C 2007, 111, 13212–13221. [Google Scholar] [CrossRef]
- Xiaojun, Y.; Yuanxin, W.; Jinyu, H.; Hua, Y.; Zhiping, D. One Step Synthesis of Diphenyl Carbonate over Palladium/Metal Doped Manganese Oxide Octahedral Molecular Sieve Catalysts. Acta Chim. Sin. 2009, 67, 2809–2814. [Google Scholar]
- Barrett, E.P.; Joyner, L.G. Determination of nitrogen adsorption-desorption isotherms. Anal. Chem. 1951, 23, 791–792. [Google Scholar] [CrossRef]
- Liu, X.; Jin, Z.; Lu, J.; Wang, X.; Luo, M. Highly active CuO/OMS-2 catalysts for low-temperature CO oxidation. Chem. Eng. J. 2010, 162, 151–157. [Google Scholar] [CrossRef]
- Boonruam, P.; Neramittagapong, S.; Neramittagapong, A.; Wantala, K. Advanced Materials Research. In Toluene Degradation by Thermal Catalytic Oxidation over K-OMS-2 Catalysts; Trans Tech Publication: Stafa-Zurich, Switzerland, 2014; pp. 22–26. [Google Scholar]
- Wang, C.; Sun, L.; Cao, Q.; Hu, B.; Huang, Z.; Tang, X. Surface structure sensitivity of manganese oxides for low-temperature selective catalytic reduction of NO with NH3. Appl. Catal. B Environ. 2011, 101, 598–605. [Google Scholar] [CrossRef]
- Galindo, H.M.; Carvajal, Y.; Njagi, E.; Ristau, R.A.; Suib, S.L. Facile one-step template-free synthesis of uniform hollow microstructures of cryptomelane-type manganese oxide K-OMS-2. Langmuir 2010, 26, 13677–13683. [Google Scholar] [CrossRef] [PubMed]
- Tang, X.; Li, J.; Sun, L.; Hao, J. Origination of N2O from NO reduction by NH3 over β-MnO2 and α-Mn2O3. Appl. Catal. B Environ. 2010, 99, 156–162. [Google Scholar] [CrossRef]
- Chabre, Y.; Pannetier, J. Structural and electrochemical properties of the proton/γ-MnO2 system. Prog. Solid State Chem. 1995, 23, 1–130. [Google Scholar] [CrossRef]
- Penn, R.L. Kinetics of oriented aggregation. J. Phys. Chem. B 2004, 108, 12707–12712. [Google Scholar] [CrossRef]
- Pietrzyk, P.; Sojka, Z. Co~(2+)/Co~0 redox couple revealed by EPR spectroscopy triggers preferential coordination of reactants during SCR of NO_x with propene over cobalt-exchanged zeolites. Chem. Commun. 2007, 1930–1932. [Google Scholar] [CrossRef]
- Wang, Y.; Zhang, L.; Li, R.; He, H.; Wang, H.; Huang, L. MOFs-based coating derived Me-ZIF-67@ CuOx materials as low-temperature NO-CO catalysts. Chem. Eng. J. 2020, 381, 122757. [Google Scholar] [CrossRef]
- Long, J. OMS-2 Molecular Sieve Low Temperature Catalytic Denitrification Research; Central South University: Changsha, China, 2019. [Google Scholar]
Figure 1.
XRD of MnO2 octahedral molecular sieves (OMS-2) prepared by Co doping method.

Figure 2.
Nitrogen absorption /desorption isothermal curves of OMS-2 samples. (a) Co0.1-OMS-2 (b) Co0.2-OMS-2; (c) Co0.3-OMS-2; (d) Co0.4-OMS-2).
Figure 2.
Nitrogen absorption /desorption isothermal curves of OMS-2 samples. (a) Co0.1-OMS-2 (b) Co0.2-OMS-2; (c) Co0.3-OMS-2; (d) Co0.4-OMS-2).

Figure 3.
Nitrogen gas absorption and desorption pore size distribution of OMS-2. (a) adsorption, (b) desorption.
Figure 3.
Nitrogen gas absorption and desorption pore size distribution of OMS-2. (a) adsorption, (b) desorption.

Figure 4.
(a) Scanning electron microscopy (SEM) of Co0.1-OMS-2, (b) Co0.2-OMS-2, (c) Co0.3-OMS-2, (d) Co0.4-OMS-2, (e) pure OMS-2, (f) Co0.3-OMS-2, (g, h) the energy dispersive spectrum (EDS) of Co0.3-OMS-2.
Figure 4.
(a) Scanning electron microscopy (SEM) of Co0.1-OMS-2, (b) Co0.2-OMS-2, (c) Co0.3-OMS-2, (d) Co0.4-OMS-2, (e) pure OMS-2, (f) Co0.3-OMS-2, (g, h) the energy dispersive spectrum (EDS) of Co0.3-OMS-2.

Figure 5.
TEM of OMS-2 ((a) TEM, (b) SAED, (c) HRTEM, (d) OMS-2 nanorod model).

Figure 6.
TEM of Co0.2-OMS-2 ((a) TEM, (b) HRTEM, (c) SAED) and Co0.4-OMS-2 ((d) TEM, (e) HRTEM (f) SAED).
Figure 6.
TEM of Co0.2-OMS-2 ((a) TEM, (b) HRTEM, (c) SAED) and Co0.4-OMS-2 ((d) TEM, (e) HRTEM (f) SAED).

Figure 7.
XPS spectra of Co0.3-OMS-2: (a) K2p, (b) Mn2p.

Figure 8.
XPS of Co2p over the Co0.3-OMS-2.

Figure 9.
The catalytic process of Co-OMS-2.

Figure 10.
NO conversion curves of OMS-2 prepared by Co doping method.

Figure 11.
N2 selectivity curves of OMS-2 prepared by Co doping method.

Figure 12.
(a) NO conversion curve of oms-2 in the presence and absence of SO2 respectively, (b) The NO conversion curves of modified oms-2 in the presence of sulfur dioxide respectively.
Figure 12.
(a) NO conversion curve of oms-2 in the presence and absence of SO2 respectively, (b) The NO conversion curves of modified oms-2 in the presence of sulfur dioxide respectively.


Table 1.
Specific surface area/pore volume/average pore size of Cox-OMS-2.
| Sample | SBET/m2·g−1 | V/cc·g−1 | D/nm |
|---|---|---|---|
| OMS-2 | 83.71 | 0.4214 | 20.32 |
| Co0.1-OMS-2 | 80.91 | 0.4141 | 20.47 |
| Co0.2-OMS-2 | 94.75 | 0.4649 | 19.62 |
| Co0.3-OMS-2 | 107.2 | 0.6464 | 24.13 |
| Co0.4-OMS-2 | 98.89 | 0.4709 | 19.04 |
Table 2.
Analysis of Mn value in Co-OMS-2 before and after reaction.
| Sample | Mn3+ Content (%) | Mn4+ Content (%) |
|---|---|---|
| Before reaction | 65.56 | 34.44 |
| After reaction | 67.70 | 32.30 |
© 2020 by the authors. Licensee MDPI, Basel, Switzerland. This article is an open access article distributed under the terms and conditions of the Creative Commons Attribution (CC BY) license (http://creativecommons.org/licenses/by/4.0/).
Share and Cite
MDPI and ACS Style
Li, L.; Wang, Y.; Zhang, L.; Yu, Y.; He, H. Low-Temperature Selective Catalytic Reduction of NOx on MnO2 Octahedral Molecular Sieves (OMS-2) Doped with Co. Catalysts 2020, 10, 396. https://doi.org/10.3390/catal10040396
AMA Style
Li L, Wang Y, Zhang L, Yu Y, He H. Low-Temperature Selective Catalytic Reduction of NOx on MnO2 Octahedral Molecular Sieves (OMS-2) Doped with Co. Catalysts. 2020; 10(4):396. https://doi.org/10.3390/catal10040396
Chicago/Turabian StyleLi, Laichao, Yusi Wang, Li Zhang, Yuxi Yu, and Hanbing He. 2020. "Low-Temperature Selective Catalytic Reduction of NOx on MnO2 Octahedral Molecular Sieves (OMS-2) Doped with Co" Catalysts 10, no. 4: 396. https://doi.org/10.3390/catal10040396
Note that from the first issue of 2016, this journal uses article numbers instead of page numbers. See further details here.