Article

Distribution of Enhanced Potentially Toxic Element Contaminations Due to Natural and Coexisting Gold Mining Activities Using Planet Smallsat Constellations

by
Satomi Kimijima
1,*,
Masahiko Nagai
2,3 and
Masayuki Sakakibara
1,4
1
Research Institute for Humanity and Nature, Kyoto 603-8047, Japan
2
Graduate School of Science and Technology for Innovation, Yamaguchi University, Ube 755-8611, Japan
3
Center for Research and Application of Satellite Remote Sensing, Yamaguchi University, Ube 755-8611, Japan
4
Graduate School of Science and Engineering, Ehime University, Matsuyama 790-8577, Japan
*
Author to whom correspondence should be addressed.
Remote Sens. 2023, 15(3), 861; https://doi.org/10.3390/rs15030861
Submission received: 28 December 2022 / Revised: 21 January 2023 / Accepted: 25 January 2023 / Published: 3 February 2023
(This article belongs to the Special Issue Small Satellites for Disaster and Environmental Monitoring)

Abstract

:
Potentially toxic elements (PTEs) from natural and anthropogenic activities threaten the environment and human health. The associations of PTEs with natural hazards can be powerful and prominent mechanisms to release PTEs, considerably hastening their multiple contaminations and widespread distribution. This study primarily aimed to investigate the enhanced potential distribution of PTE contaminations (arsenic, lead, and mercury) from coexisting gold mining operations combined with massive riverbank erosion in Indonesia from 2002 to 2022, where soil and water are highly contaminated naturally, using PlanetScope smallsat constellations, Google Earth imagery, and hydrographic datasets. According to the findings, increased barren extents were found because of mining deposits and road network developments. Enhanced natural and anthropogenic PTE runoffs would be transported across two different sub-basins, affecting broader parts of the Bone River. Between 2002 and 2022, 139.3% of river expansion was identified, eroding a maximum of 3,436,139.4 m3 of contaminated soil. Particularly land surfaces were repeatedly transformed from rivers to agricultural lands in the low Bone River, possibly contaminated by fertilizer spills. The combination of PTE potentials from different sources would further exacerbate the contamination level at an estuary. These findings are expected to aid in the timely monitoring of and assuming volumes, rates, and distribution of PTEs from various natural and anthropogenic activities and alert PTE contamination risks to ecosystems and human health. Future work in this area should aim to investigate contamination levels at the estuary, where contaminated materials from both natural and anthropogenic activities are accumulated.

1. Introduction

Potentially toxic elements (PTEs) are omnipresent on Earth. PTEs are a group of metals and metalloids with an atomic mass of >20 [1] and an atomic density higher than 4 g cm−3 [2]. These elements enter the ecosystem through different natural and anthropogenic processes [1,3,4,5,6,7], such as industrial activities, the use of fertilizers, the application of treated wastewater to land, sewage sludge, and the weathering of soil minerals [2,8]. Most PTEs are toxic to humans and animals even at low concentrations [2,8]. Furthermore, they severely affect soil health [6,9], inhibit the metabolic function of plants [4,7], and contaminate the food chain [10], surface and groundwater [6,11], and human health [12,13]. During natural hazards, such as floods, riverbank erosion, and landslides, contaminated water and soil resources can enhance PTE release and distribution, further contaminating larger soil and water ecosystems [14].
As discussed, PTEs from various natural and anthropogenic activities can be transported and transformed via soil and water systems, thereby accelerating vast PTE contamination [2,6,7,15,16,17]. Transportation and transformation levels of PET differ based on the geochemical backgrounds of parent materials [1,6,7,11,16], their weathering [11], and environmental conditions [7]. For instance, agricultural practices, corrosion, fossil fuel combustion, mining, smelting, and waste disposal are anthropogenic sources of PTE contamination [1]. The PTE mobilization capacity from anthropogenic sources is higher than that from natural sources [16].
Moreover, the gold mining sector is a critical source of PTE contamination of soil and water resources [6,7,18,19,20]. This sector can be categorized into large-scale mining (LSM) and artisanal and small-scale gold mining (ASGM). The former is formally performed through mechanized operations [21], while the latter is informal, unregistered, and illegal [22,23,24,25,26]. In the ASGM sector, PTEs, such as mercury (Hg) and cyanide (CN), are used in gold extraction processes [12,22,27,28]. Hg and CN contaminated runoff water from the gold mining sector can be transported to the environment [8], increasing contamination in surface and groundwater systems [4]. Particularly, Hg can be methylated over time. Hg methylation is undesirably accelerated in acidic environments [15] and is further exposed to ecosystems [19].
The coexisting ASGM and LSM sites in nature and highly contaminated areas with arsenic (As) and lead (Pb) are anticipated to further accelerate PTE contamination. Here, PTE contamination is associated with excavating of underground deposits and opening lands [26]. Moreover, natural hazards, such as floods, riverbank erosion, and landslides, can accelerate flows of naturally and anthropogenically contaminated water and soil accumulation [16]. In our previous study sites, extremely high concentrations of As, Hg, and Pb in water [18], sediments [18,20], soil [19], and plants (fern) [18], exceeding regulatory limits, were identified [29,30,31,32,33,34,35]. Specifically, Hg contamination was caused by gold extraction activities [18,19,20]. However, a massive development of coexisting mining sites in combination with natural hazards, such as riverbank erosion, motivates a considerable spatiotemporal analysis of the enhanced potential distributions of PTE contamination.
Remote sensing technologies are widely used to characterize natural features or physical objects on the land surface using various spatial, temporal, spectral, and resolution datasets [22,24,26,36,37]. Medium-resolution satellites, such as the Landsat and Sentinel-1 series, were previously used to investigate the transformation of camp-type ASGM (C-ASGM). These places are rural–remote informal worksites where miners live and perform mining activities [22,23,24,25,26]. Despite the availability of historical datasets, timely and detailed assessments of landcover or land surface changes are not monitored effectively in the high cloud-covered tropical region [22,23] and foreshortening and layover regions of mountainous areas due to the side-looking characteristic of synthetic aperture radar [24,25]. In this regard, using high spatiotemporal observation associated with hydrographic information may be crucial and beneficial in identifying details, such as potential distributions, volumes, and rates of PTE contamination, hastened by various factors, such as the rapid development of coexisting mining and riverbank erosion. Furthermore, this work may aid in determining the scope of the potential risk to the environment and human health and provide principal information to localities and policymakers.
Therefore, this study primarily investigated the enhanced potential distributions of PTE contaminations from coexisting gold mining sites in combination with natural hazards (riverbank erosion) in the Bone Bolango Regency, Gorontalo Province, Indonesia, from 2002 to 2022 using PlanetScope (PS) smallsat constellation (SSC) (https://www.planet.com/, accessed on 28 December 2022), Google Earth Pro (GEP), and hydrographic datasets. Particularly, the objectives were to (1) review PTE contamination in the study area, (2) assess coexisting rapid development of C-ASGM and LSM sites from 2019 to 2022 associated with river sub-basin using SSCs and hydrographic datasets (3) assess Bone Riverbank erosion from 2002 to 2022 using SSCs and GEP, and (4) access relationships using the results obtained in steps 2 and 3.

2. Materials and Methods

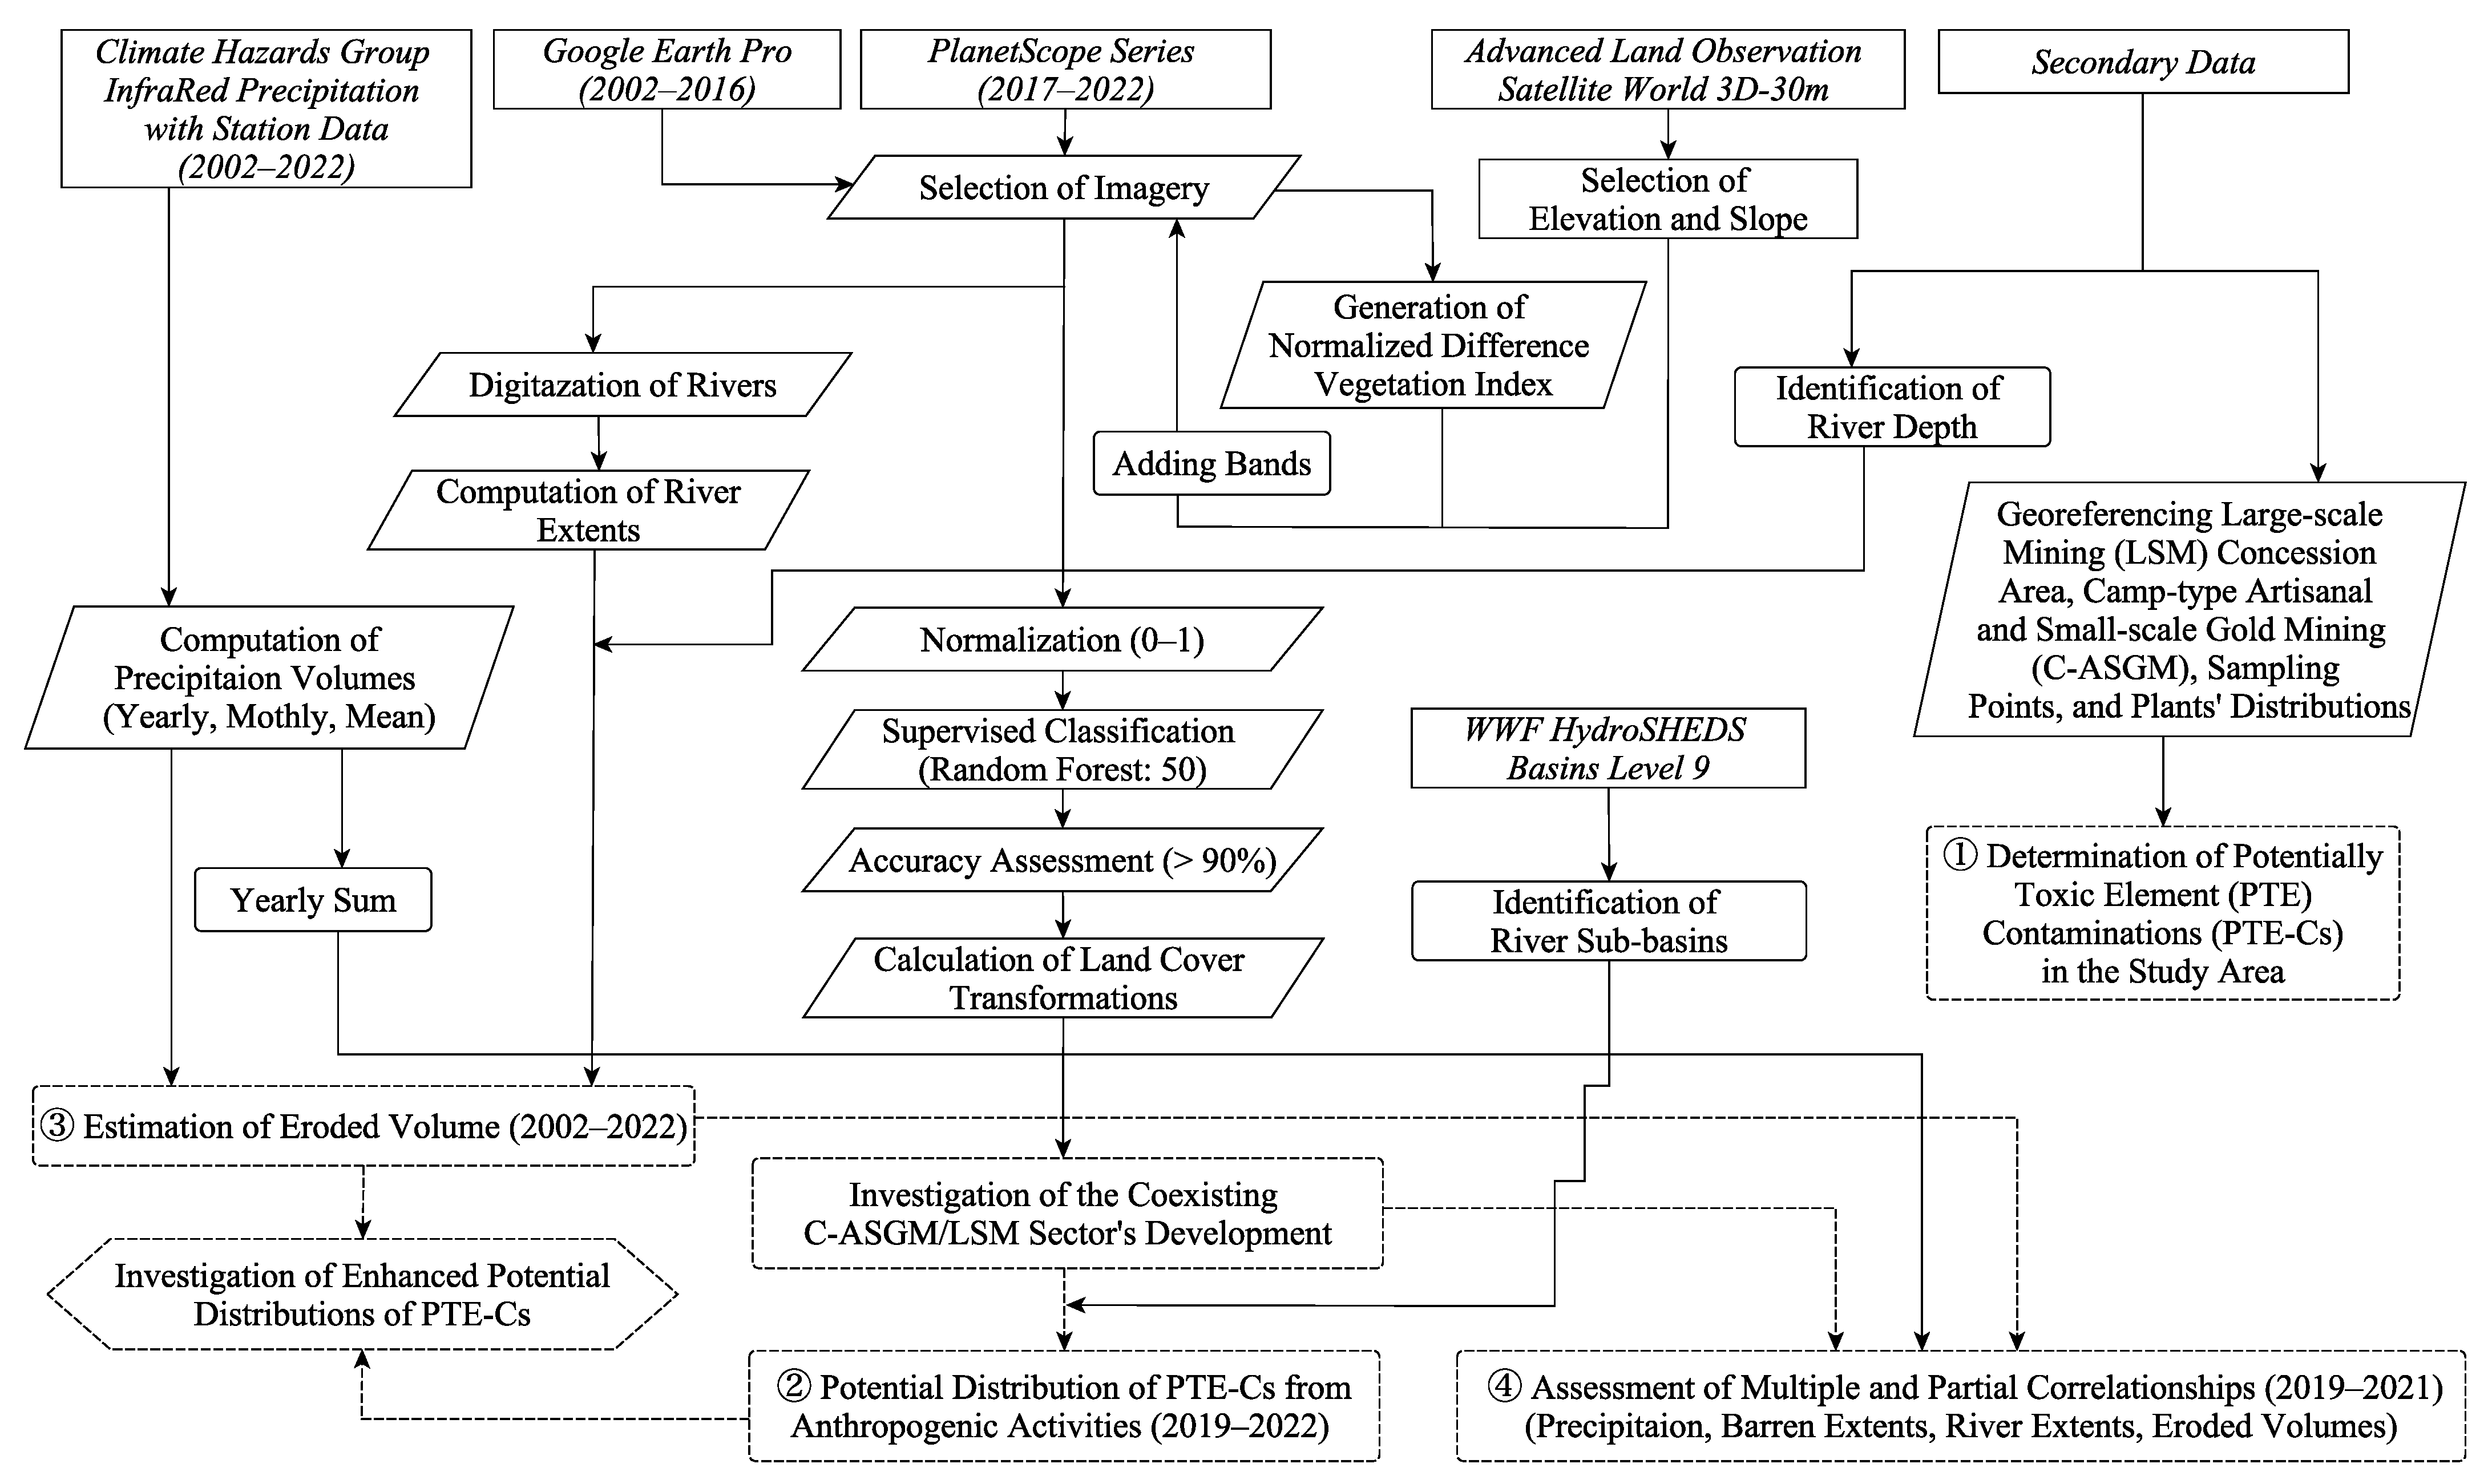
2.1. Overall Methodological Workflow
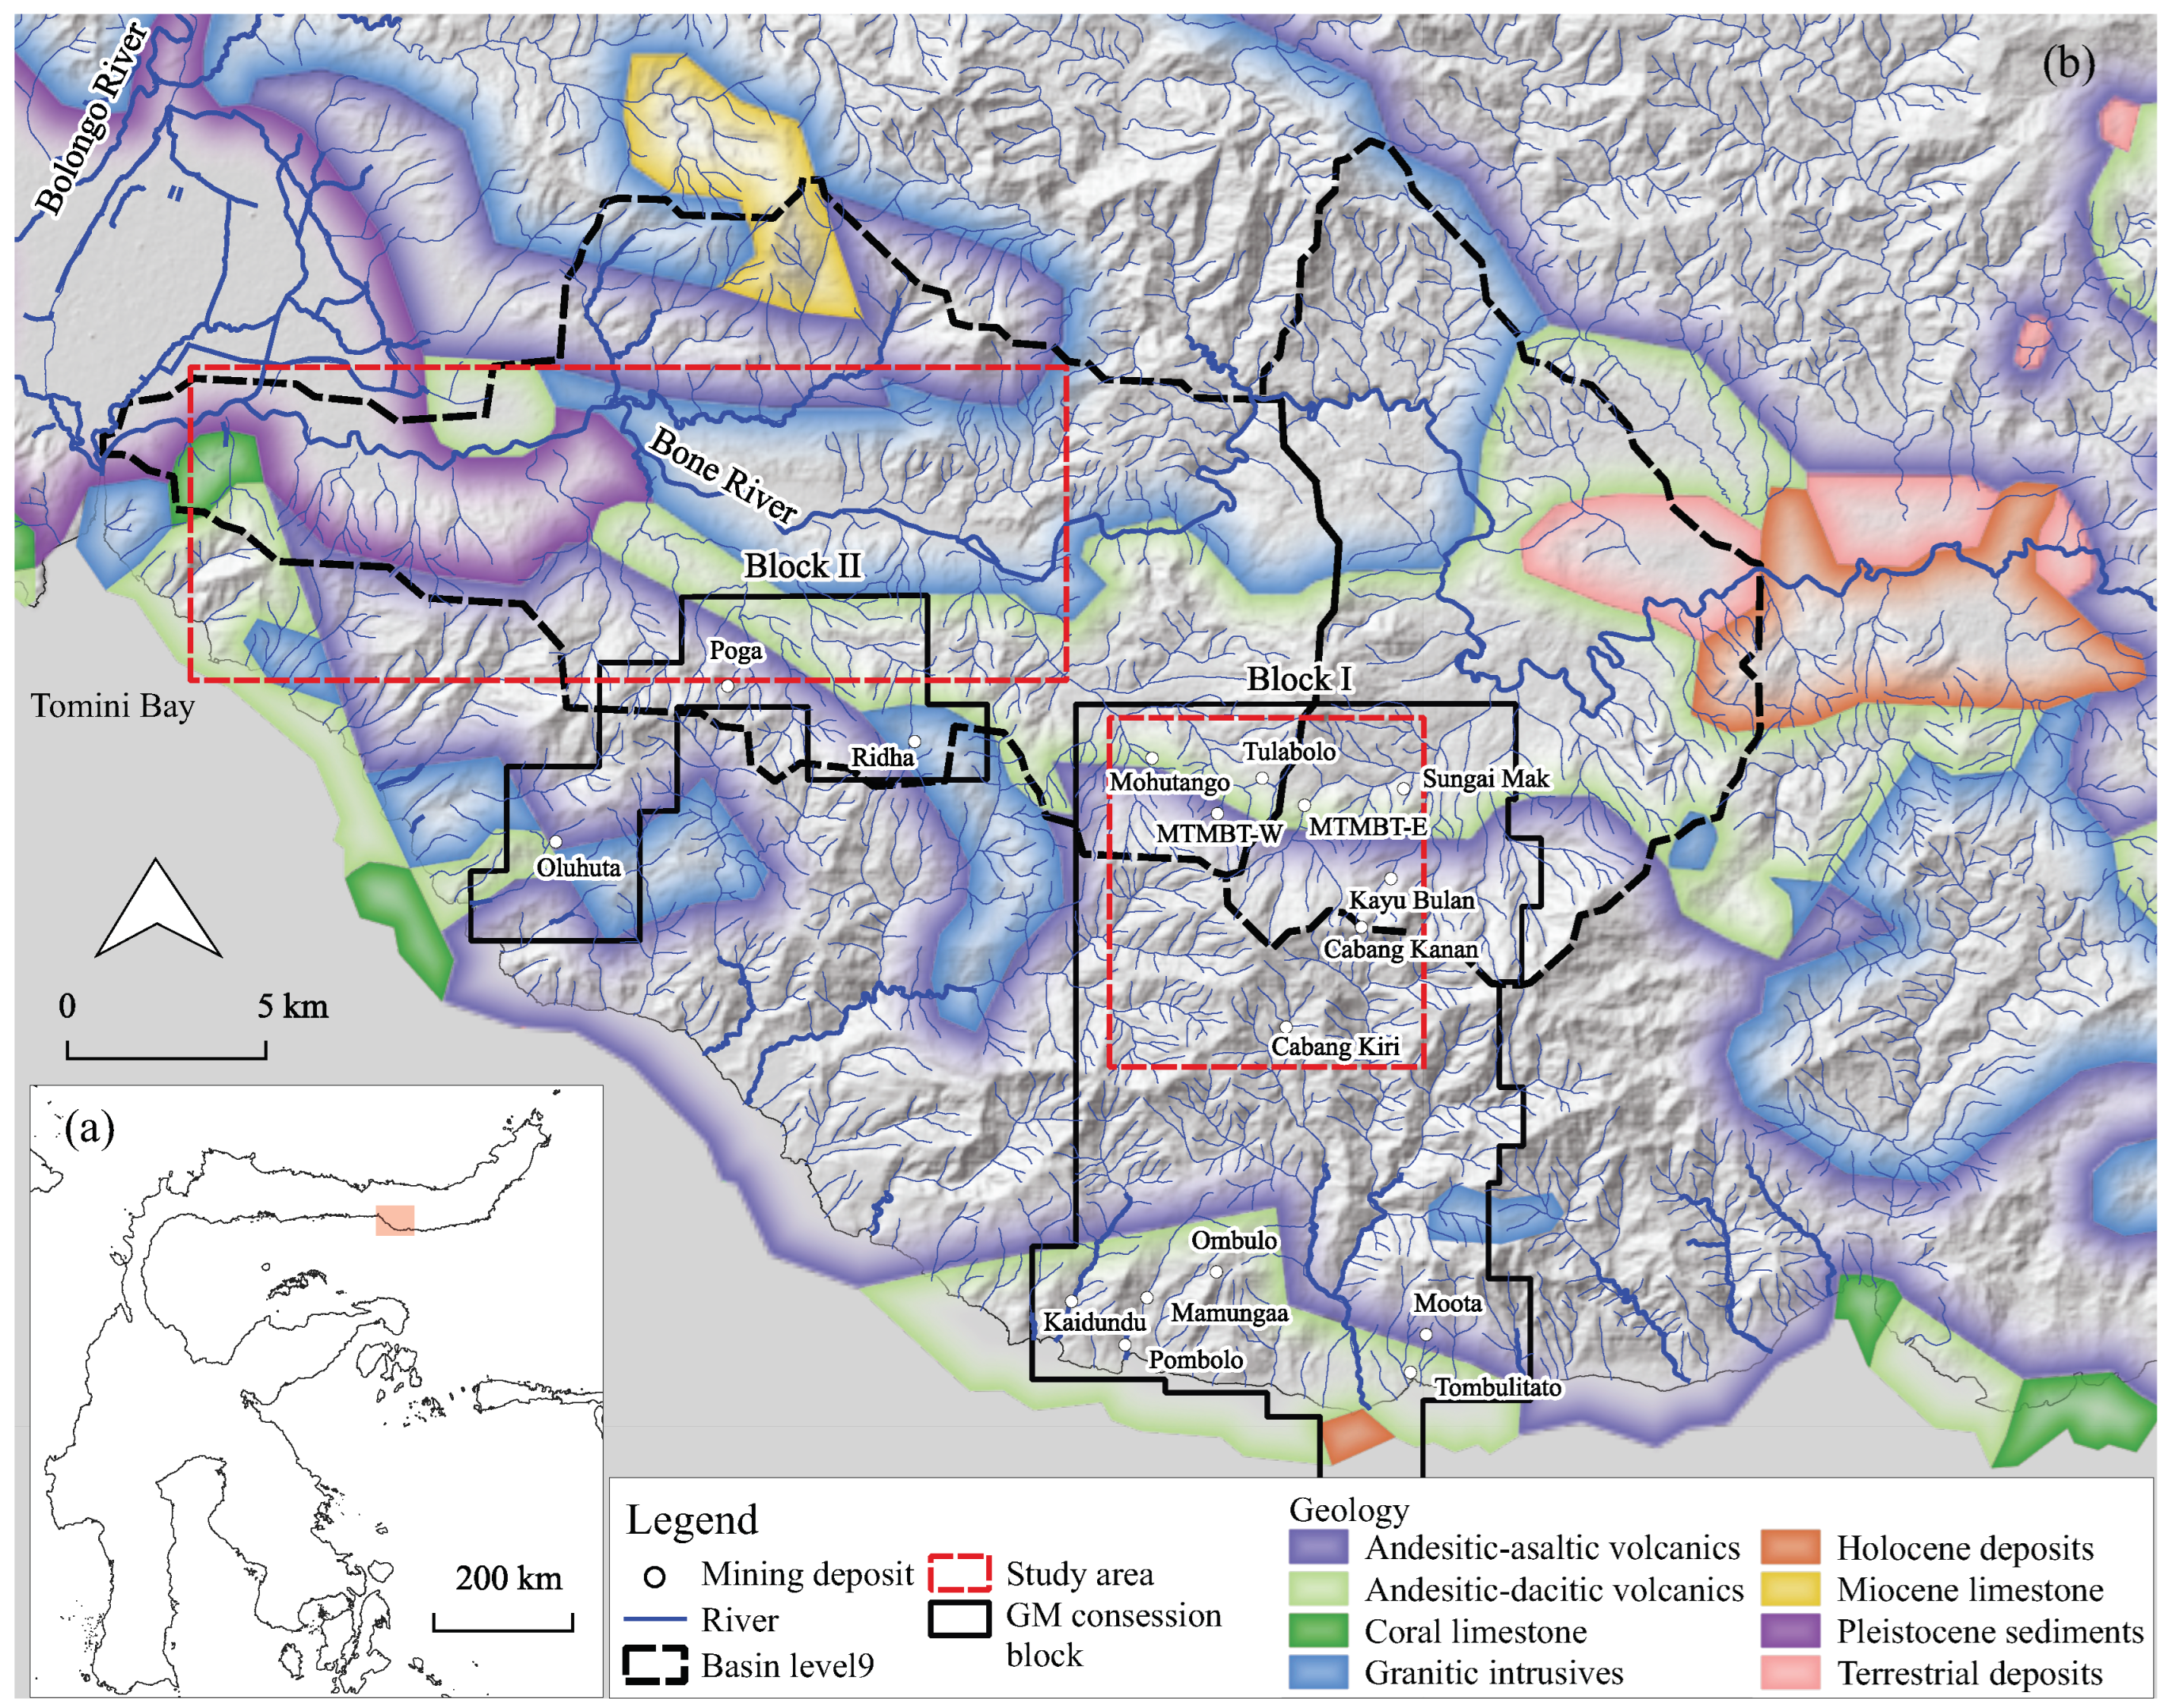
Figure 1 shows the methodological workflow. First, PTE contamination in the study area was summarized. Second, the rapid development of coexisting mining was assessed using hydrographic information and PS time series (2019–2022) to explore the potential distributions of PTE contaminations from mining activities. Third, the riverbank erosion at the Bone River was computed using PS and GEP time series (2002–2022) to estimate volumes of contaminated soil from natural activities. Fourth, relationships were statistically assessed using multiple correlations and partial correlation analysis (2019–2021). This study presents a discussion based on the abovementioned findings. The methods used in each step are described in the following sections.

2.2. Study Area

2.2.1. Identification of Study Villages and Sub-basins

The deposits were identified by georeferencing company reports [38]. The sub-basins were identified using the HydroSHEDS Basins-Level 9 dataset (https://www.hydrosheds.org, accessed on 28 December 2022), providing hydrographic information at a global scale generated by the Shuttle Radar Topography Mission datasets of the National Aeronautics and Space Administration [39].

2.2.2. Characteristics of Study Area

Here, our study area covers a coexisting mining site and the middle of the Bone River (M-BR) in Bone Bolango Regency (Figure 2). The Bone River flows to the west through the mountainous terrains, joining the Bolango River before discharging into Tomini Bay. Concession blocks of the Gorontalo Minerals project, a joint venture of the LSM, are situated to the south of the Bone River. The following four official deposits employing the vertical tunnel method (shaft) of mining are operated even in conserved areas situated north of concession block I: Mohutango, Motomboto West (MTMBT–W), Motomboto East (MTMBT–E), Sungai Mak, and Tulabolo. All deposits are located in the Bone River basin [22,23,39]. Moreover, disasters, such as flooding, riverbank erosion, and sedimentation, are common in riverside areas [40,41].
The geological settings of our study area are andesitic–dacitic volcanic, granitic intrusives, and Pleistocene sediments (Figure 2). Furthermore, rocks hosting this geology primarily comprise igneous rocks, such as volcanic and metamorphosed rocks from the middle Tertiary to the early Quaternary period [42,43]. Soils in mining areas are naturally contaminated by As and Pb due to parent rock weathering [19].
However, despite the high toxicity of CN to various ecosystems, technology transfer from Hg to CN in the mining sector was promoted by the government of North Sulawesi, Indonesia, in 2000, developing combined processing techniques using both these materials [31]. Recently, considerable rapid and massive developments of coexisting ASGM and LSM sites have been observed in this study area [26], excavating an extensive number of rocks and soil [22] with the use of Hg and CN for gold extraction (Figure 3) [18,22]. In addition, rapid mining-related infrastructure developments cause land-shape changes by opening the land surfaces [26].
This study focused on the MTMBT–E, MTMBT–W, Sungai Mak, and Tulabolo deposits located in the Bone River basin, where substantial mining developments have been observed [22,23,26]. We refer to our direct field measurements conducted in 2017, 2018, 2019, and 2021 [18,19,20,22,23].

2.3. Satellite Imagery and Data Processing

2.3.1. PlanetScope Smallsat Constellation Datasets

This study used PS Ortho Scene-Analytic-Level 3B products [44]. The PS constellation comprises three satellite generations with multiple satellite groups, including Dove-Classic [Dove-C (image availability: 2016–April 2022)], Dove-R (March 2019–April 2022), and SuperDove (March 2020–current) [45]. The PS SSCs capture multispectral imagery of the entire land surface and coral reefs of Earth daily, with ~3-m spatial resolutions [45]. All types of Dove satellites are in a 98° inclination sun-synchronous orbit at 475 km and cross times of 9:30–11:30 in the morning [46]. The Dove-C and Dove-R satellites collect imagery in four bands [Blue, Green II, Red, and Near Infrared (NIR)]. While SuperDove has eight bands, only five bands can be downloaded, including Blue, Green II, Red, Red-Edge, and NIR [46]. Although the band number of Dove-C and Dove-R is the same, the separation and definition of the second-generation satellites have considerably improved. Therefore, integrating these sensors for spectral analyses became difficult. The development from Dove to SuperDove increased the spectral bands and considerably improved the radiometric calibration, dynamic range, spectral response, and image sharpness [46]. Although bandwidths and placements of Dove-R differ slightly from SuperDove, bands are compatible [47]. Bands of SuperDove are interoperable with Sentinel-2 bands [46,48].

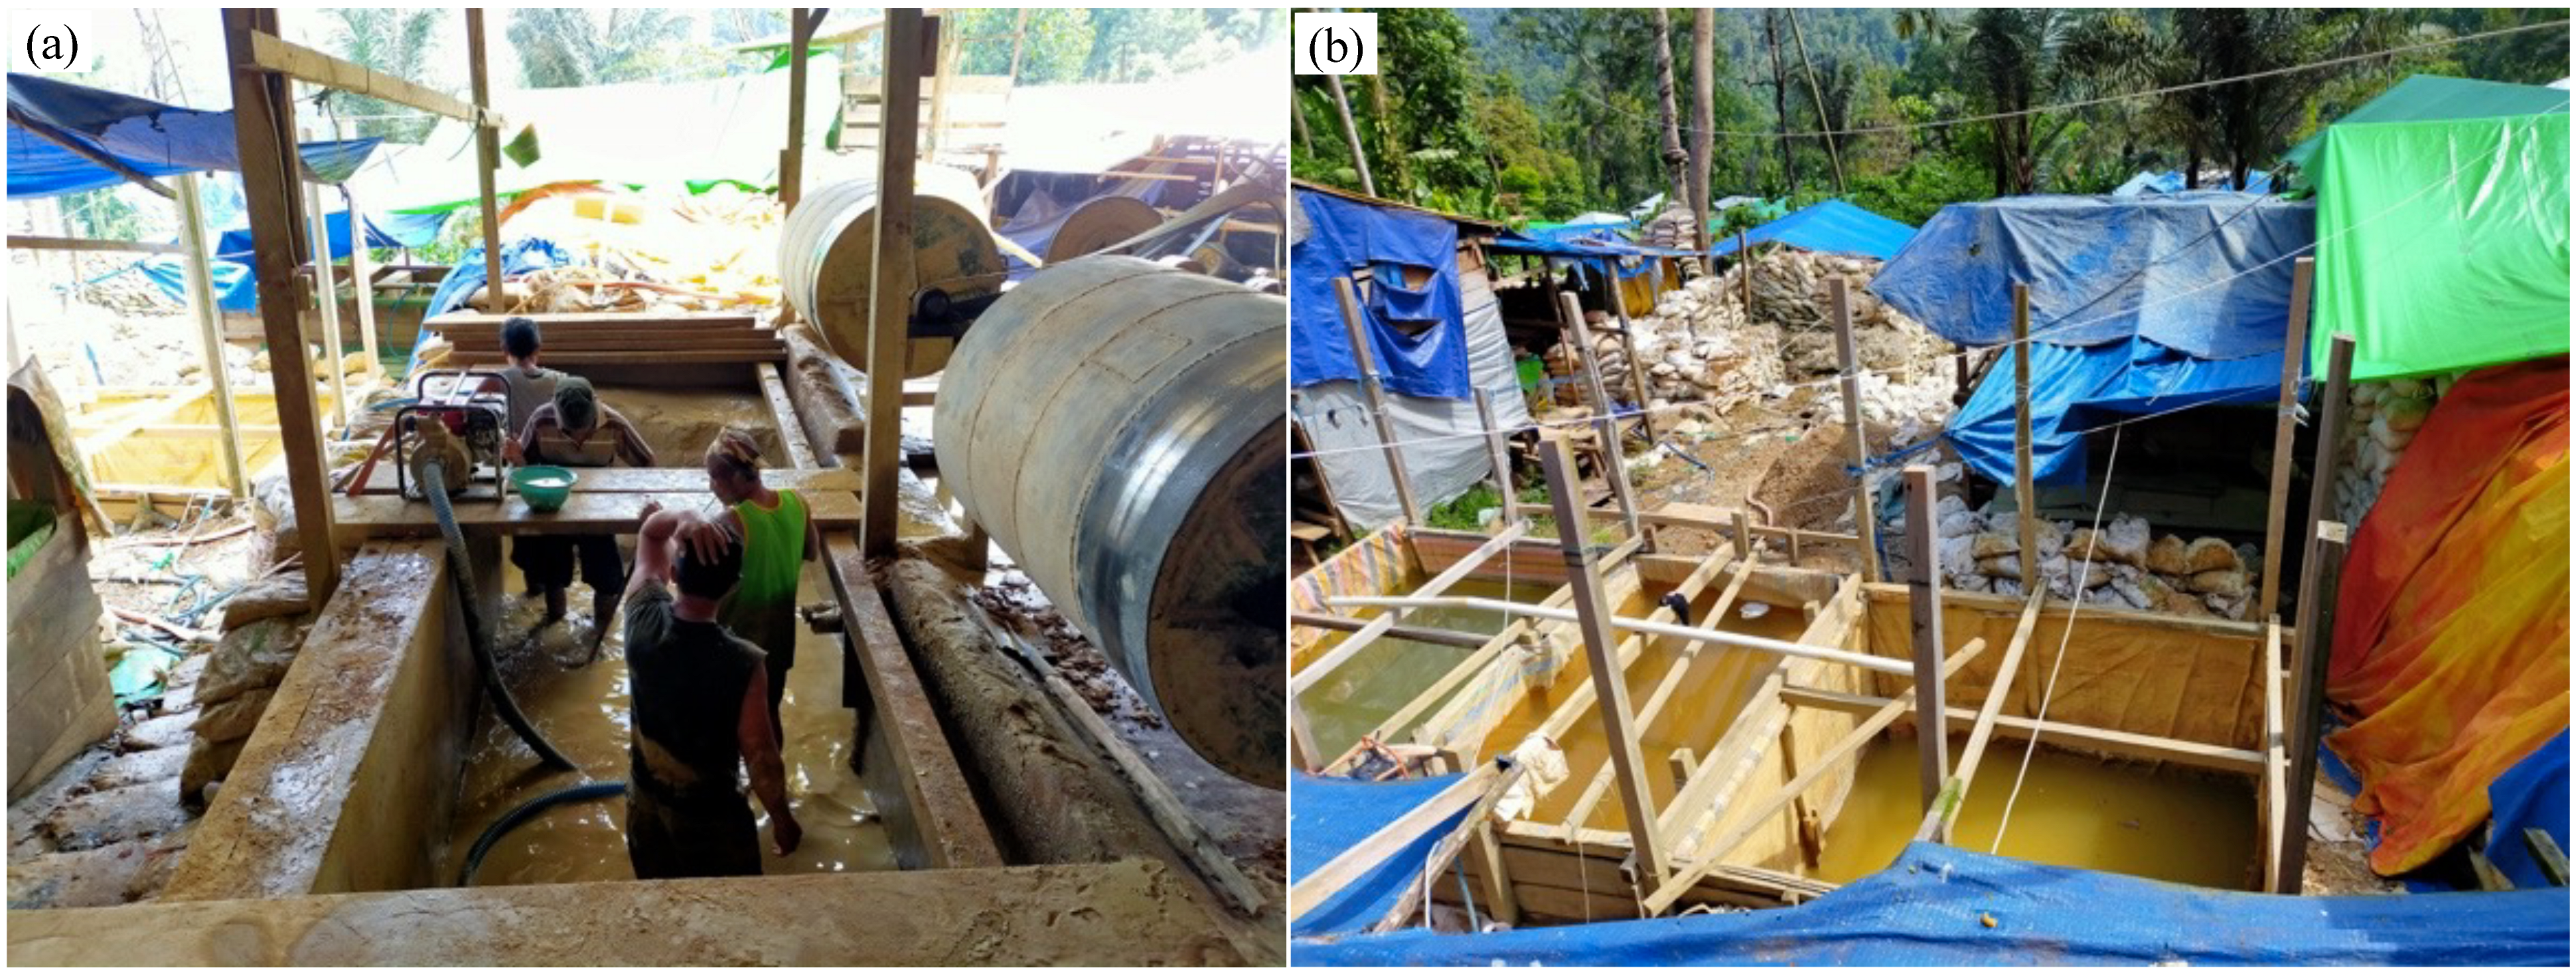
2.3.2. Identification of Rapid Development of a Coexisting Mining Site

PS imagery from 2019 to 2022 was used to assess land cover transformations (LCTs) in the coexisting mining site. Dove-R and SuperDove were primarily targeted because of their bandwidth compatibility [47]. The normalized difference vegetation index (NDVI) was generated and added to each composite using Equation (1). Subsequently, the elevation and slope data acquired from the Advanced Land Observation Satellite World 3D-30 m were added to improve classification quality. Then, the data were normalized to a range of 0–1 [26,37]. Consequently, seven PS imagery of 2019 (August), 2020 (April and November), 2021 (January and June), and 2022 (January and June) were obtained with a ground resolution of 3 m in the World Geodetic System 84 Universal Transverse Mercator coordinate system Zone 51.
NDVI = (NIRRed)/(NIR + Red)
Following that, landcover classes were categorized into four categories: barren, built-up, grassland, and trees. The study area was remote and rural, employing a shaft-mining method [22,23]. Therefore, the spatial distribution of built-up and barren extents can be an essential indicator for revealing transformations of the hidden coexisting mining site development. A supervised classification was used for the time series LCT analysis. Earth imagery was used to determine the ground control points for the classification on a pixel basis. In a simple random forest classifier with 50 decision trees, a machine learning method was used in terms of excellent classification results with high processing speed [49]. Subsequently, the overall accuracy (OA) from confusion matrices was used to assess the accuracy of the produced map by comparing the predicted and actual values. Based on the imagery, >90% of OA was targeted. The ground control point, classifier, and accuracy assessment were implemented using Google Earth Engine. Subsequently, the total built-up and barren extents were computed and graphed. The main specifications of the imagery and sensors used in this study are summarized in Table 1.

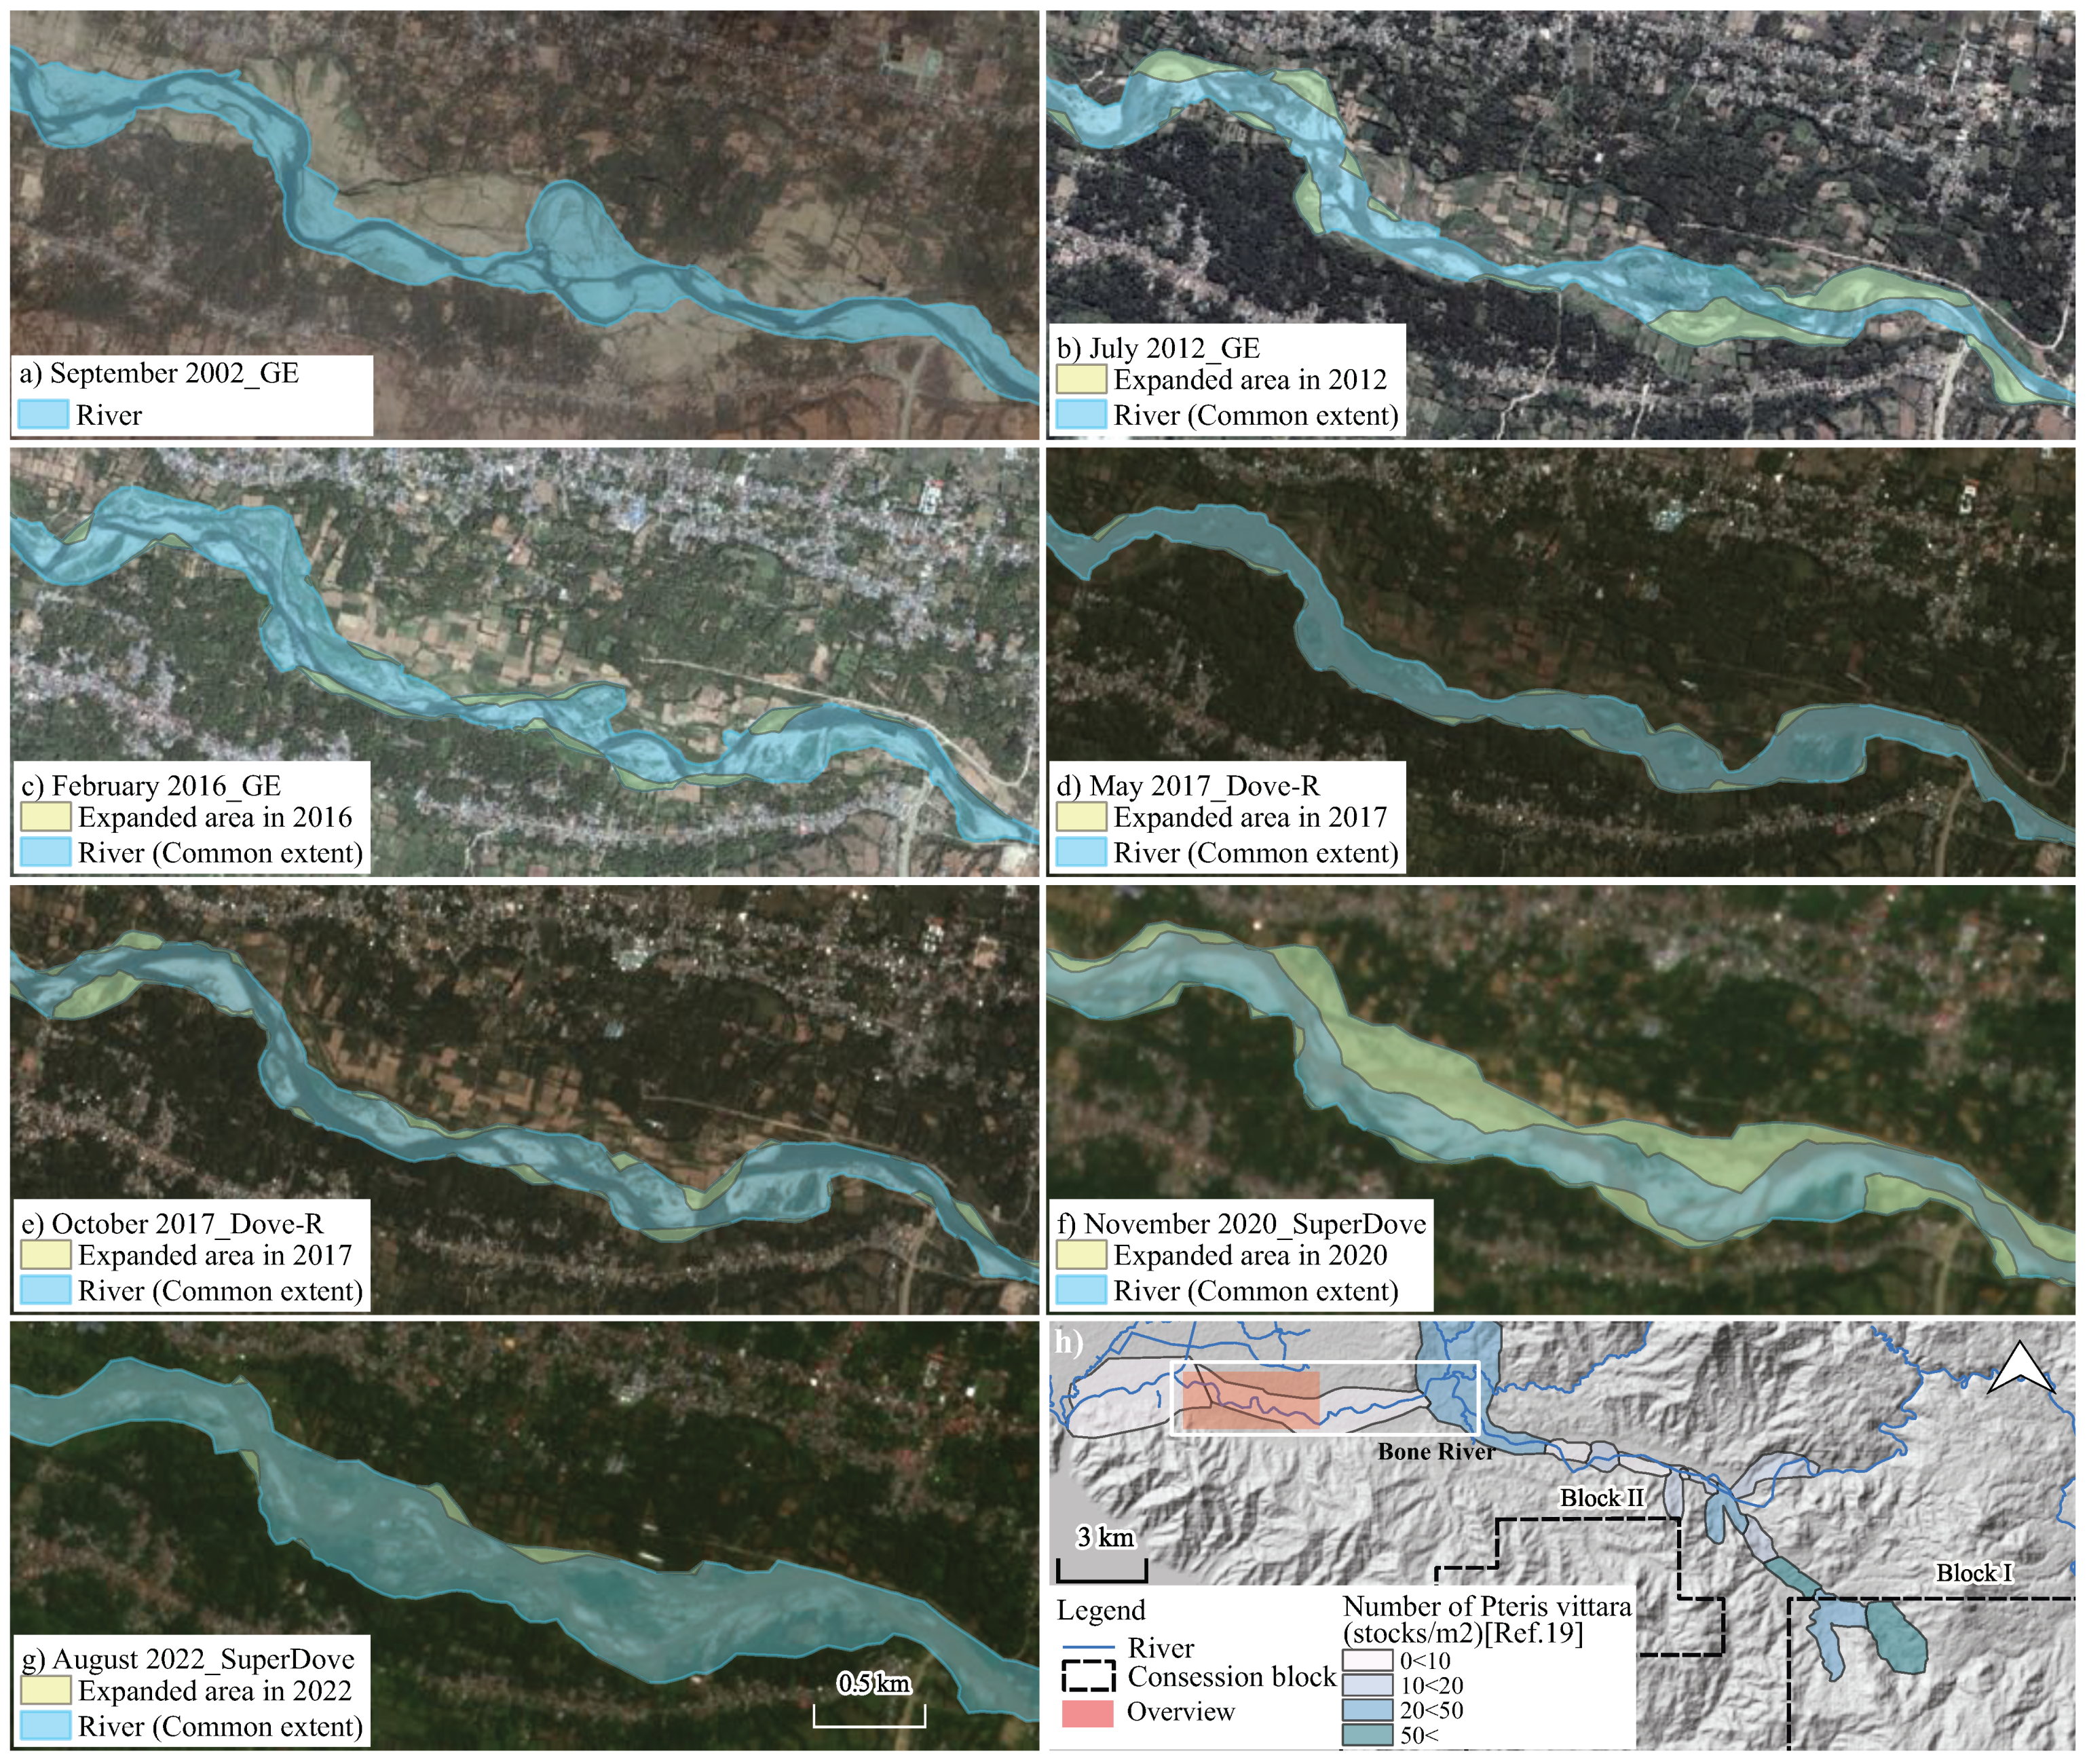
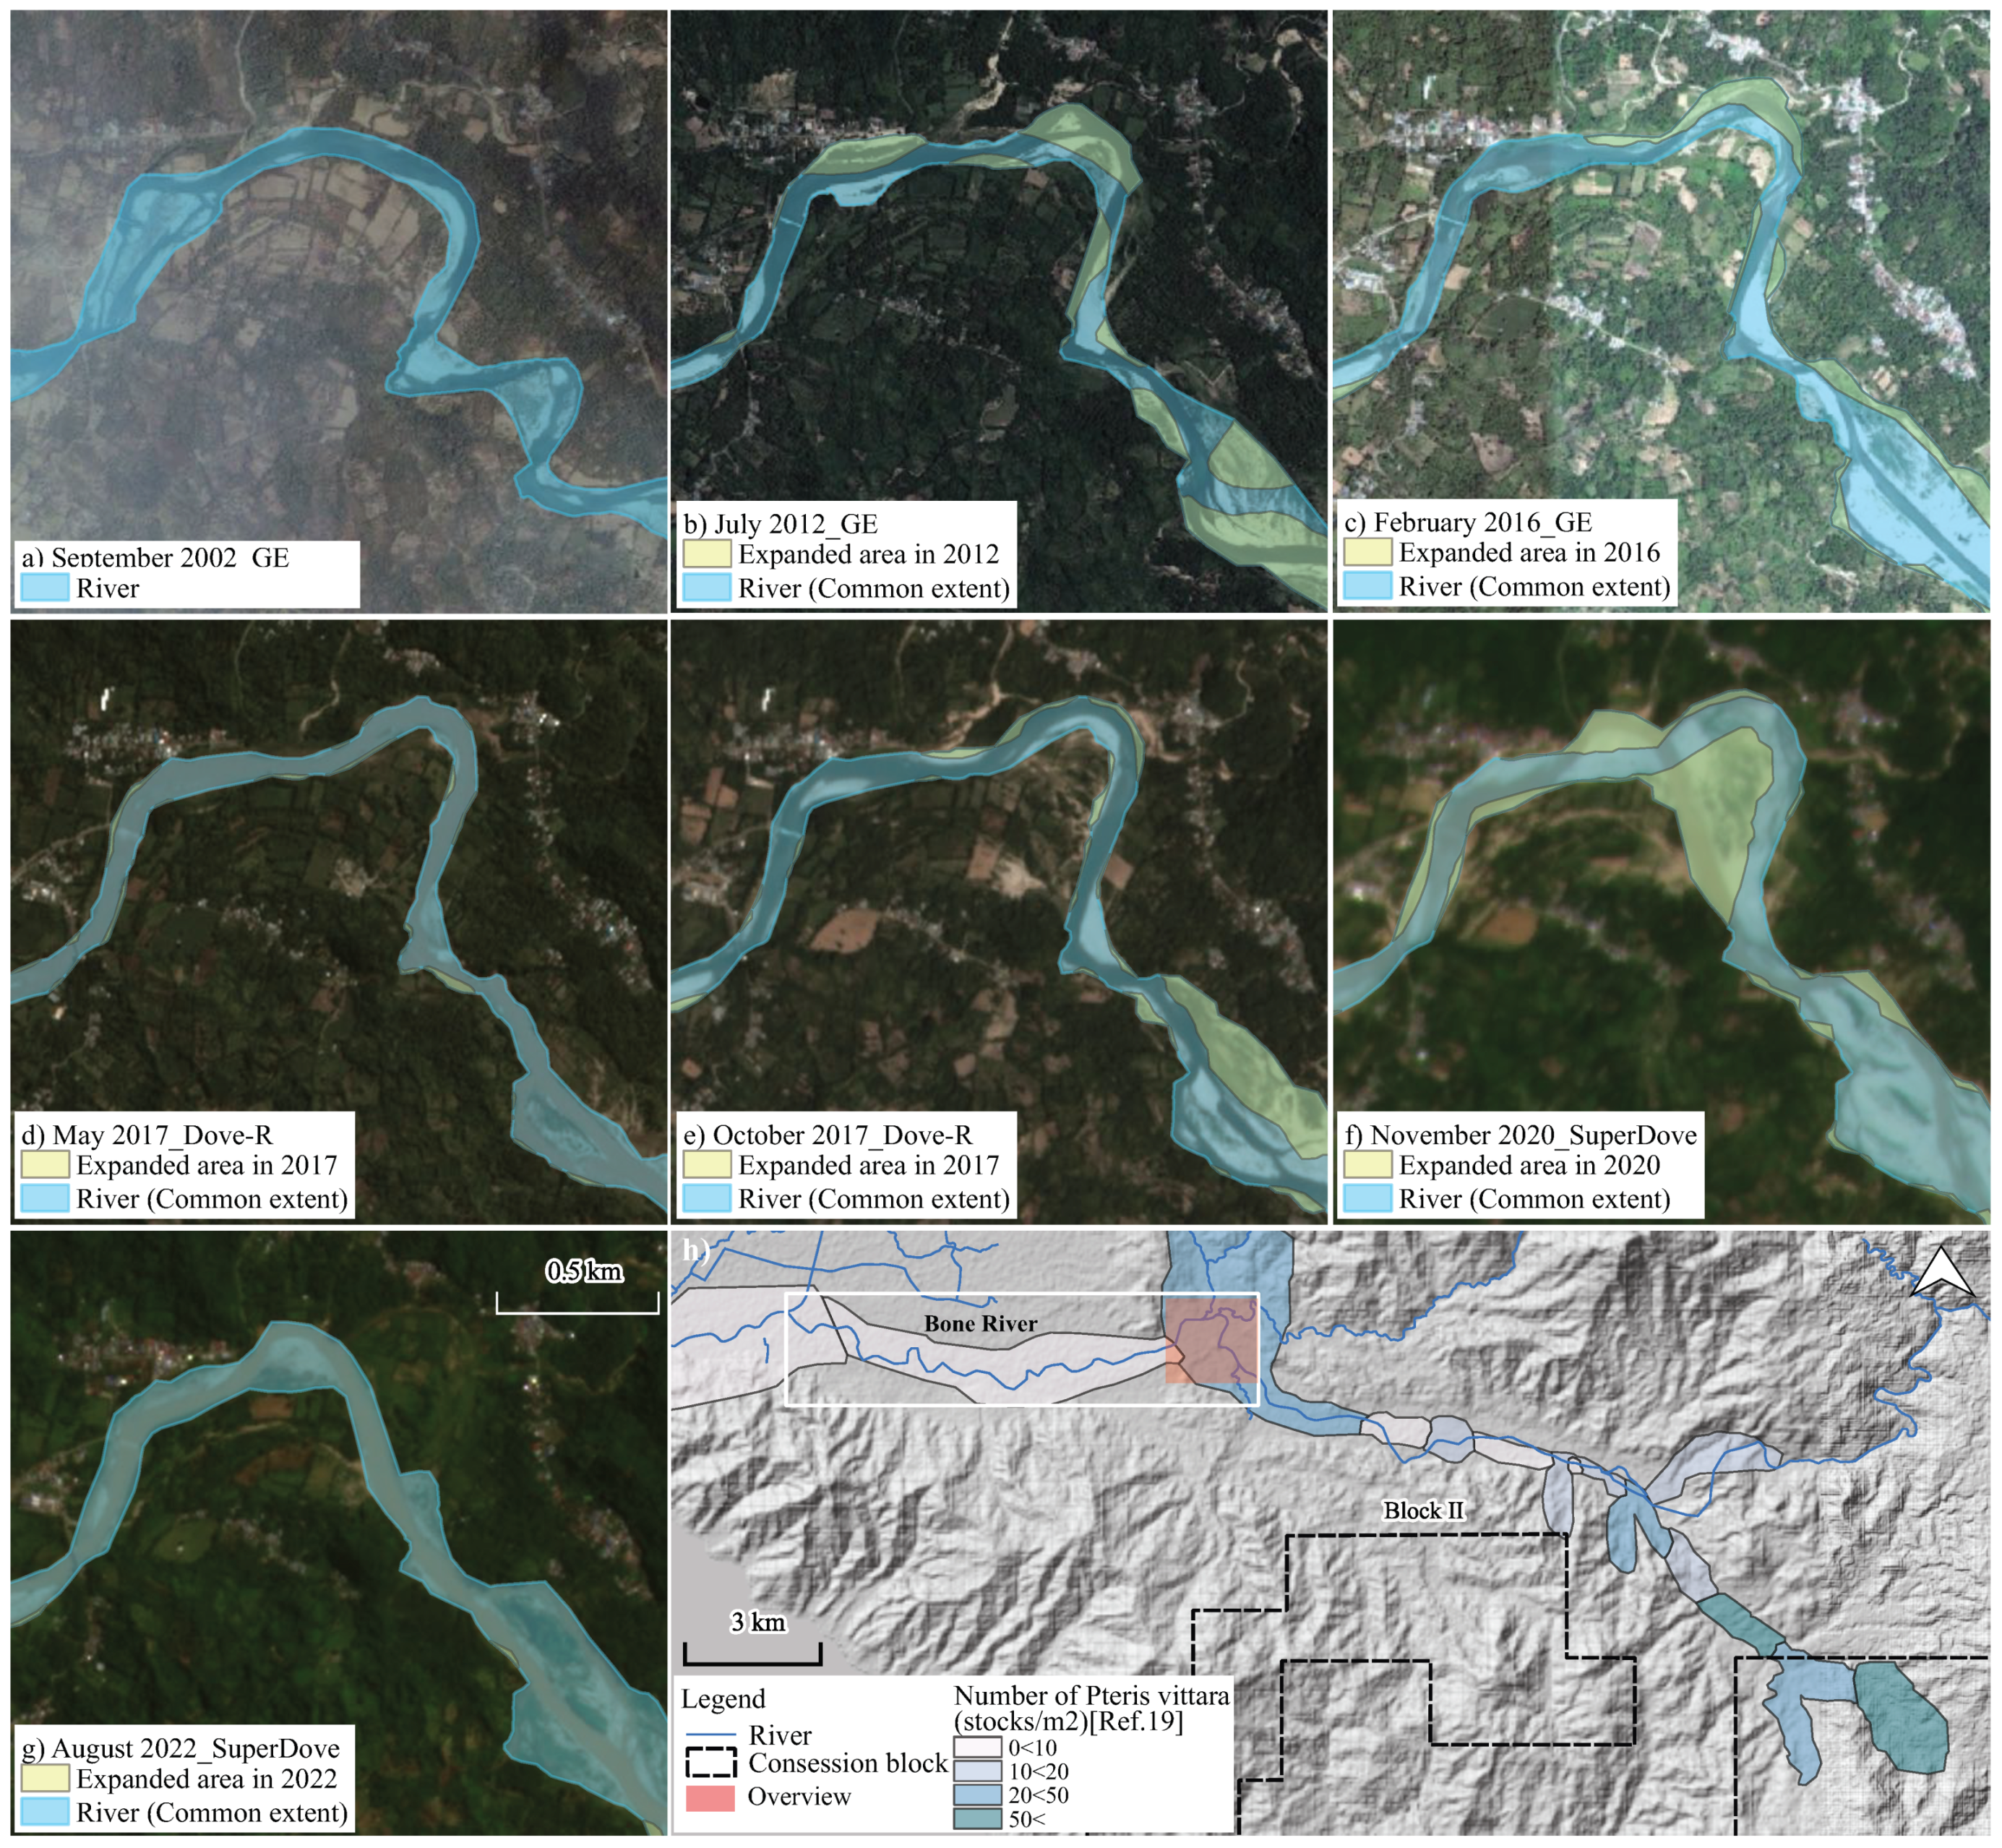
2.3.3. Estimation of Riverbank Erosion

Rivers comprise watercourses, such as channels or branches, and they can possess natural channels (e.g., perennial or nonperennial) or artificially improved channels [50]. Nonperennial rivers lack surface water seasonally [51]. Herein, we defined a river as any watercourse, including surface land extent eroded by rivers [36]. The extension in the Bone River area from 2002 to 2022 was extracted using GEP (2002–2016) and PS SSCs (2017–2022) (Table 1) through digitization based on human visual interpretation. Subsequently, an average depth of 1.3 m (Bone River 969 to 15,824 m from the estuary, investigated in 2002 [52]) was used for all periods because the actual depth of rivers could not be determined based on each year. Consequently, the amount of riverbank erosion was calculated and graphed using quantum geographic information system and excel. A time series was used to visualize the critical areas of riverbank erosion. Meanwhile, monthly precipitation volumes were computed from 2002 to 2022 using the Climate Hazards Group InfraRed Precipitation with Station (CHIRPS) datasets to associate their trends with the obtained results. Moreover, landcovers trends were evaluated statistically using the nonparametric Mann–Kendall test, followed by Sen’s Slope test if a trend exists.

2.4. Correlation among Landcover Transformation, Precipitation, River Extent, and Riverbank Erosion

A correlation among landcover, such as barren areas, precipitation, river extent, and riverbank erosion, was assessed from 2019 to 2021 using multiple correlations and partial correlation analysis. Here, yearly values of barren extents (August 2019, November 2020, and June 2021), precipitation (yearly sum), and river extent and riverbank erosion (September 2019, November 2020, and October 2021) were considered for both correlation analyses. A multicollinearity test was applied using the variance inflation factor (VIF).

3. Results

3.1. Potentially Toxic Element Contamination in Study Area

PTE contamination in the same area was investigated in previous studies, covering the Mohutango and MTMBT deposits, upper stream to downstream, and the lower Bone River [18,19,20] (Figure 4). Although concentrations of PTEs were heterogeneous, extremely high concentrations of As, Hg, and Pb were detected in water, sediments, and plants [18,19,20] (Table 2). Low potential of hydrogen (pH) values were observed in mining and tailing waters (1.96 and 4.00, respectively), whereas it ranged from 7.53 to 7.82 for river water [18]. Furthermore, the As, Hg, and Pb concentrations in water samples [18] exceeded various quality guidelines (QGs) [29,30]. These elements had comparable concentration values in Indonesia [53,54]. Some water samples contained PTEs with 167 (Pb), 347 (Hg), and 8250 (As) times maximum higher concentrations than those recommended by the World Health Organization (WHO) water QGs. High contamination levels exceeding QGs [3,32,33,34,55] were also detected in sediment [18,20] and soil samples [19]. Some sediments contained PTEs with 299 (Pb), 4389 (Hg), and 12,257 (As) times maximum higher concentrations than the probable effect concentrations [34]. Soils exhibited 46 (Pb), 133 (Hg), and 2028 (As) times maximum higher concentrations than the industrial soil QGs [35]. These levels are even higher than those in metal-rich soils [3,55]. The distribution of Pteris vittata (P’vittata), a potential bioindicator for assessing Pb and Hg contamination [18], was highly concentrated in mining areas and gradually decreased downstream. Crushed and milled rock materials were immersed in a pool mixed with CN [18,22].

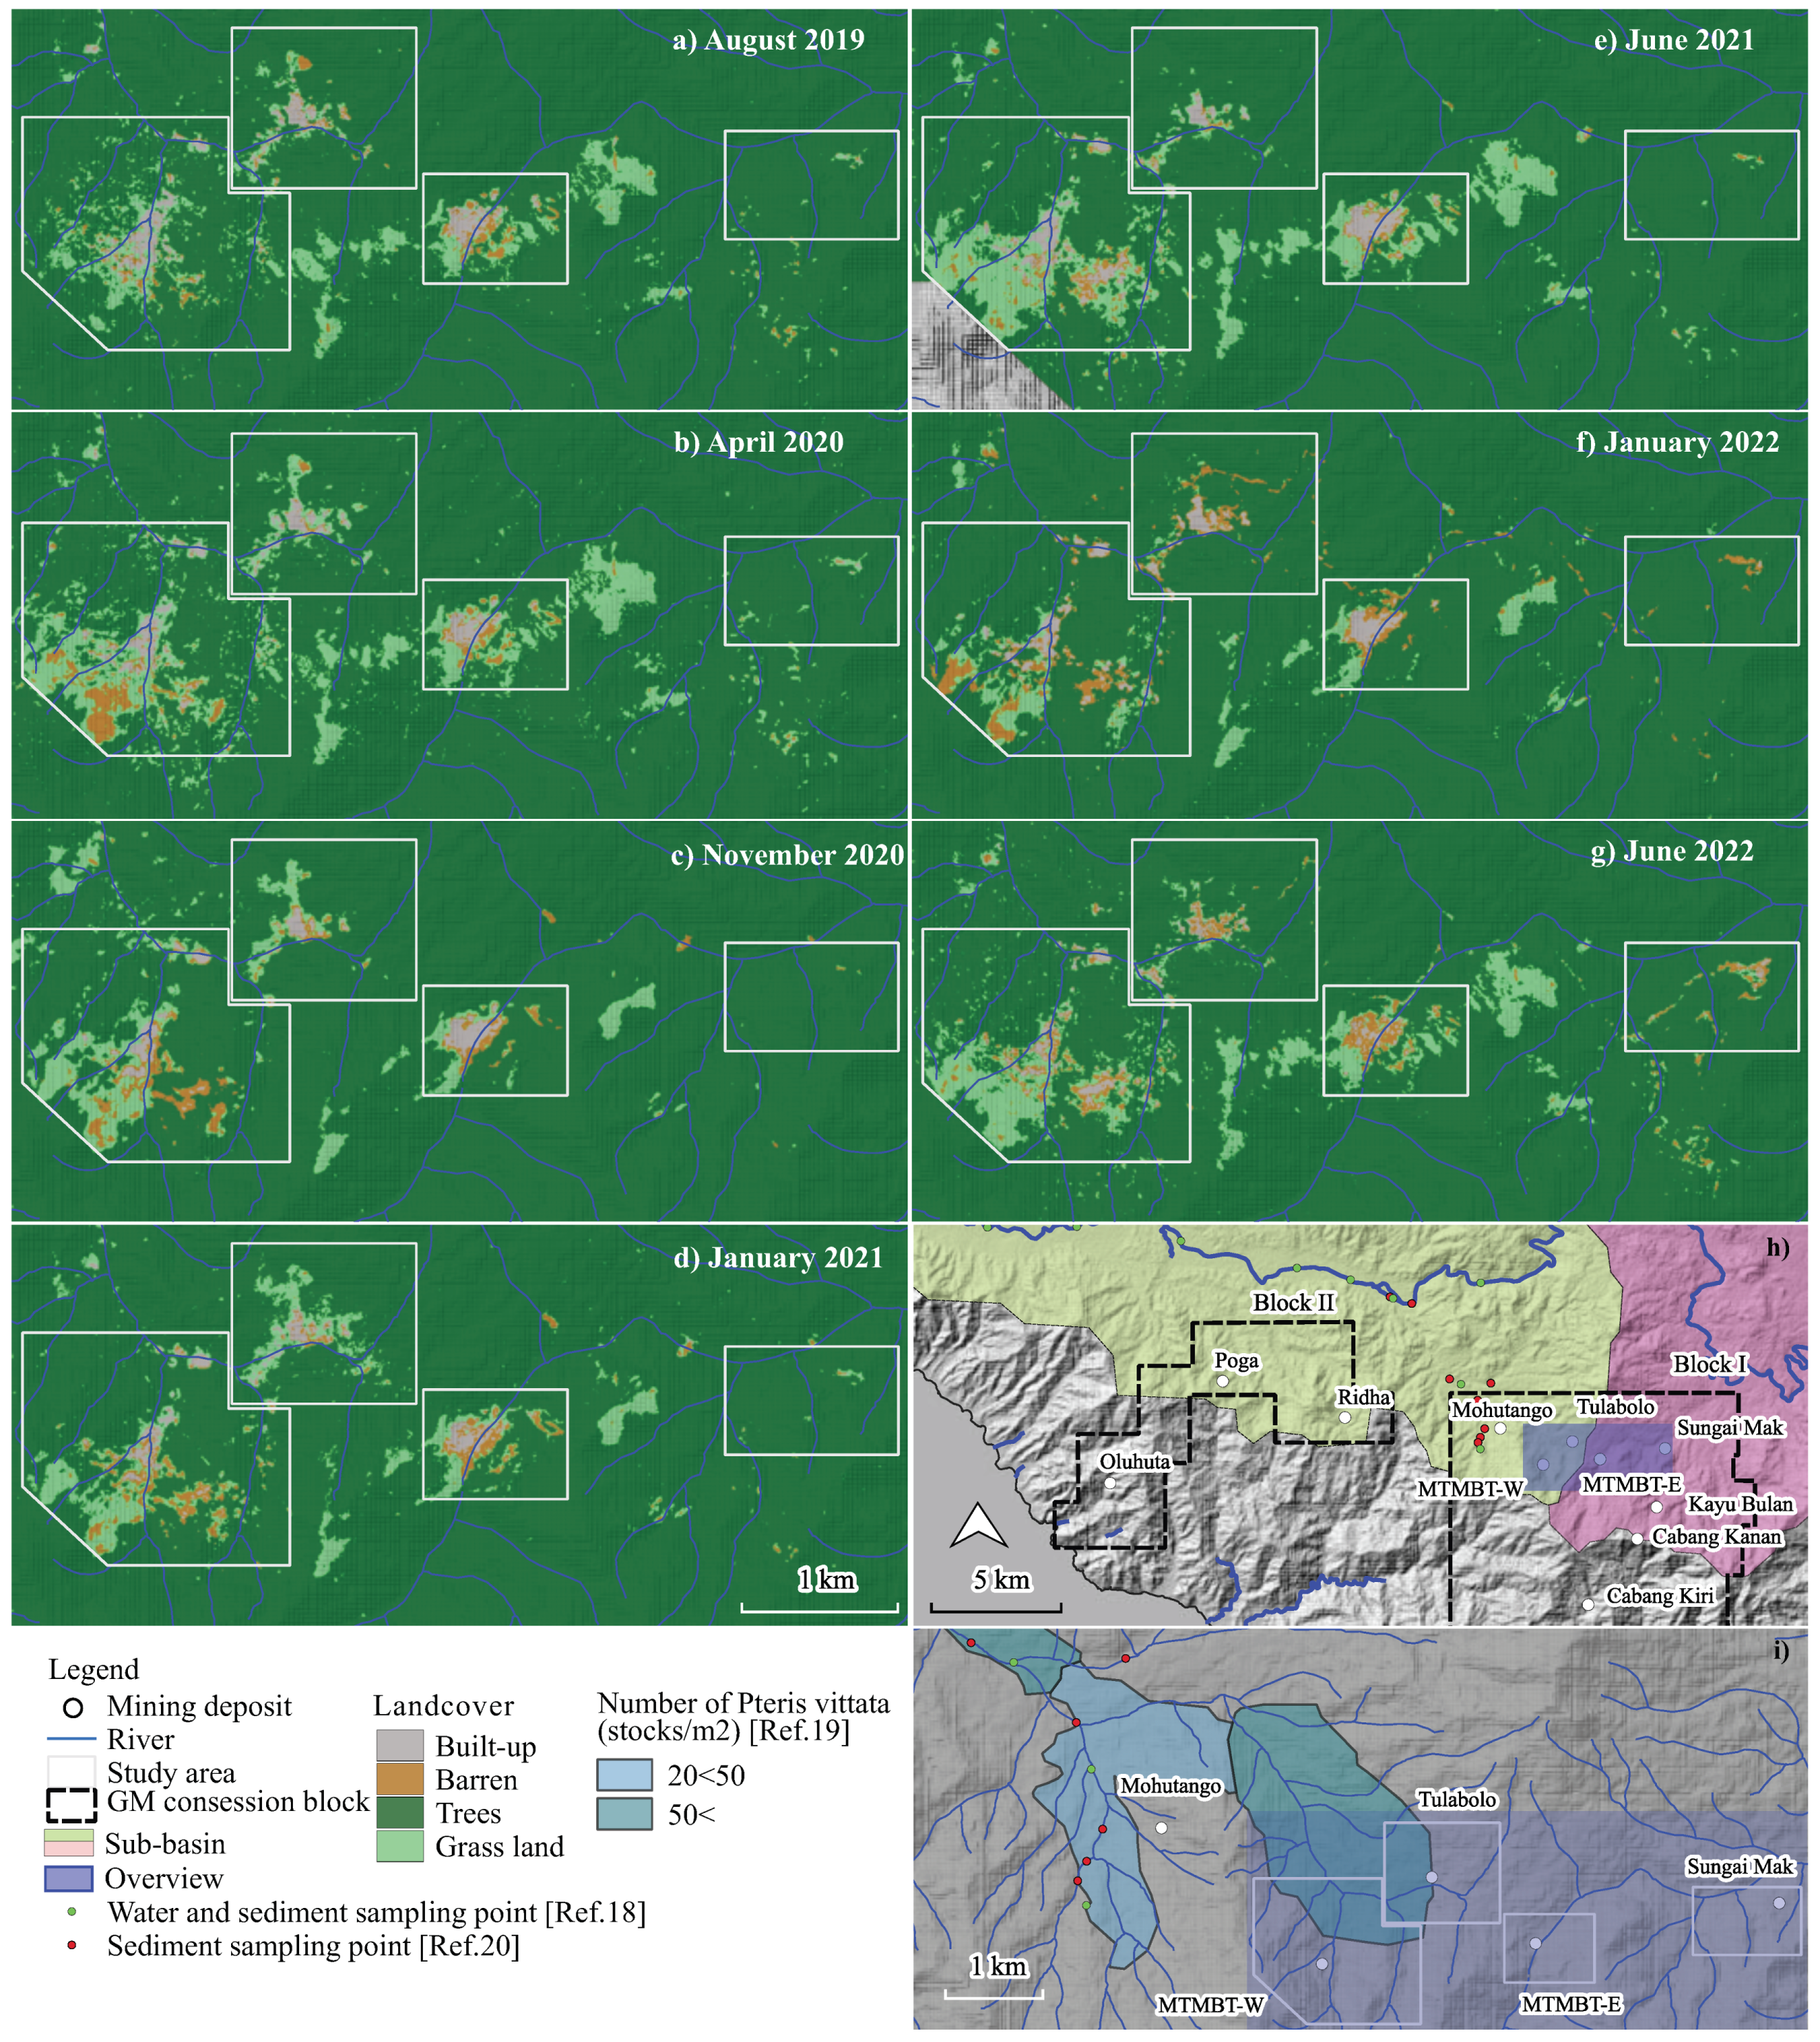
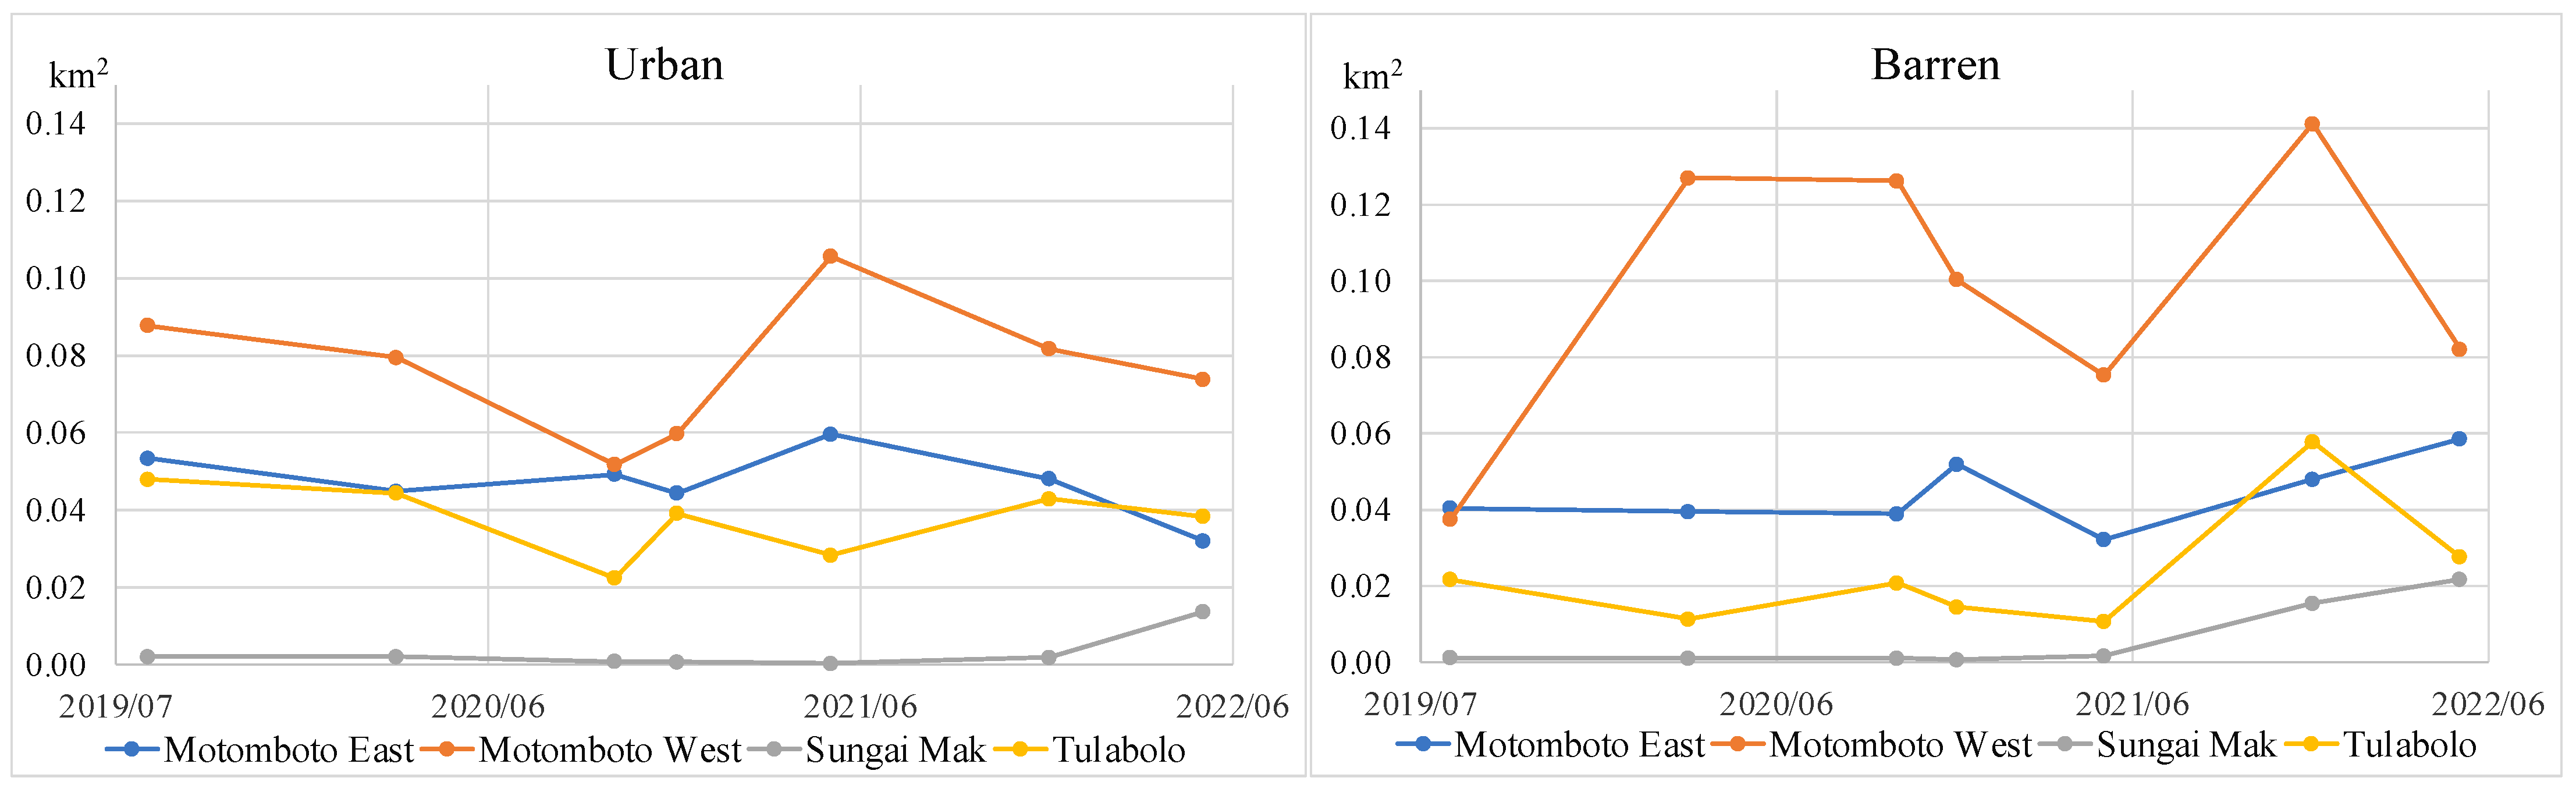
3.2. Time Series Landcover Transformations of a Coexisting Mining Site

Seven landcover maps with OA of the confusion matrices of 95.8% (August 2019), 93.3% (April 2020), 92.9% (November 2020), 94.1% (January 2021), 93.8% (June 2021), 95.2% (January 2022), and 92.0% (June 2022) were demonstrated in this study. The time series LCTs in the study area are shown in Figure 5 and Figure 6. All study deposits are located along the streams that connect to the Bone River. The mining deposits are divided into two categories, based on the overlay of the HydroSHEDS Basins-Level 9 dataset, including the MTMBT–W and Tulabolo deposits, as well as the MTMBT–E and Sungai Mak deposits (Figure 5h). The former is connected to the M-BR, whereas the latter is connected to the upper Bone River (U-BR).
According to the time series LCT analysis, LCTs in the MTMBT–W deposit were significant. The barren extent appeared and transformed into grassland, with the process repeated. Their first peak changes to barren extents occurred in April 2020 (0.13 km2) and the second was in January 2022 (0.14 km2) (Figure 6). As urban and grassland areas increase, barren areas tend to decrease. The urban and barren extents were relatively stable in the MTMBT–E deposit. A barren-based unpaved road connecting Tulabolo, MTMBT–E, and Sungai Mak deposits, crossing the northern part of the sub-basins, notably appeared in January 2022 (Figure 5f). These turned to grassy areas in June 2022 (Figure 5g). The urban extent in Tulabolo remained stable, but the barren extents increased in January 2022 (0.06 km2) because of road construction. The urban and barren extent in Sungai Mak also increased in June (0.01 km2) and January 2022 (0.02 km2).

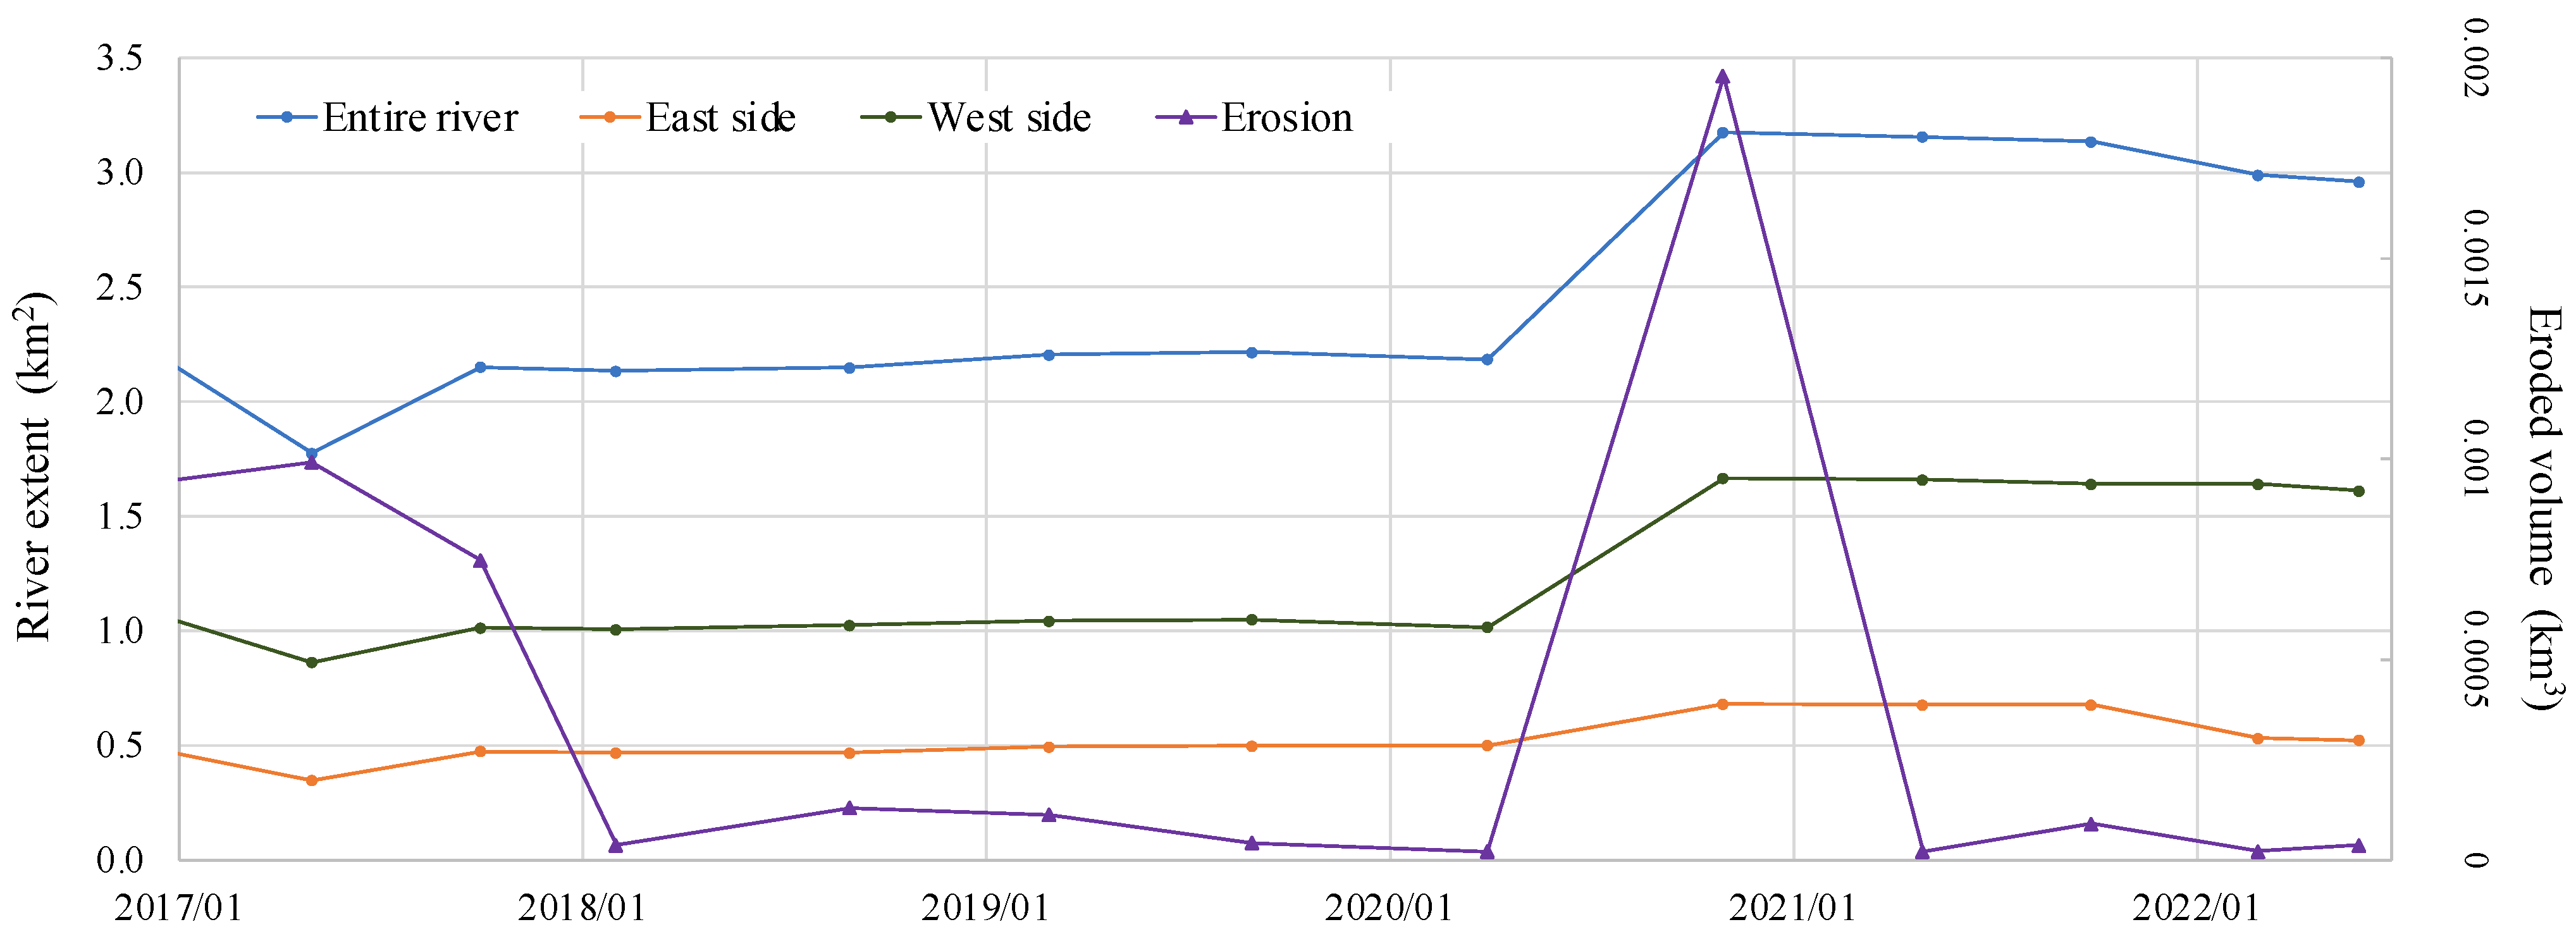
3.3. Time Series Riverbank Erosion of Bone River

The M-BR was digitized using the imagery provided by GEP and SSCs, based on human visual interpretation. The total area identified for 2002 and 2022 is 2.13 and 2.96 km2, respectively, demonstrating a 139.3% river expansion between 2002 and 2022. The peak change was observed significantly in November 2020 (1.01 km2). An average river depth of 1.3 m was used for all years to calculate erosion volumes from 2002 to 2022, as described in Section 2.3.3. The total volume of eroded river soil during the period was 3,436,139.40 m3. The identified entire river extents, eroded extents, and eroded volumes are summarized in Table 3.
Critically eroded areas (east (E–BR) and west sides (W–BR) of the Bone River) were demonstrated from 2002 to 2022 (Figure 7 and Figure 8) and graphed in time series along the entire river extent and eroded volumes from 2017 to 2022 (Figure 9). Expansion of river extents was identified in both critical areas. Both areas experienced a slight decrease in river extents in May 2017; however, these remained steady until April 2020. A similar tendency was also observed in the eroded volume. Changes in river extent (E–BR, W–BR, and entire areas) and eroded volumes peaked in November 2020. The observed change in the peak of E–BR in November 2020 was lower than that of the W–BR; however, they showed a similar tendency during our study period. It is worth noting that in the same year, the rapid increase in barren areas, which indicates developments of the coexisting mining sites, was observed in the study area in April 2020.
These river expansions followed river course changes, demonstrating significant changes in both critical areas from 2002 to 2022. The river extents were repeatedly transformed into agricultural lands, then back to the river (Figure 7a,b,f and Figure 8a,b,e–g). These are significant in the meandering river area (Figure 8b,c,f,g).

3.4. Changes in Precipitation Amount and Disasters That Occurred in the Study Area

The precipitation volumes from January 2002 to June 2022 were computed using CHIRPS datasets (Figure 10). A monthly precipitation peak was identified in October 2016 (360.7 mm), while the mean value during the study period was 112.1 mm. Precipitation volumes exceeding 200 mm were maintained from May to July 2020. The statistical test showed an increasing precipitation trend with a positive slope of 0.12 (p = 0.0349), with significance at the 95% confidence level. Natural disasters have considerably increased after the rapid development of mining activities and related infrastructure since 2019 [41] (Table 4). Severe rainstorms with volumes of >200 mm continued from May to July 2020, affecting a population of 1321–9301 [41].
The statistical test described in Section 2.4 revealed a correlation from 2019 to 2021 among barren extent, precipitation amount, river extent, and riverbank erosion volume (R2 = 1), with VIF > 10, indicating a high correlation between the variables. Particularly, high partial correlations were found between precipitation and riverbank erosion volume (R2 = 1), river extent and riverbank erosion volume (R2 = 1), precipitation and river extent (R2 = 0.99), and barren and riverbank erosion volume (R2 = 0.70).

4. Discussion

4.1. Potentially Toxic Element Contamination in the Study Area

Soils around the study deposits are naturally contaminated by PTEs (e.g., As and Pb) because of the weathering of hydrothermally altered parent rocks [18,19,20]. We found extremely high As, Hg, and Pb concentrations in water, sediments, and plants (Table 2). Based on previous studies, Hg contamination in this study site was caused by gold extraction activities that released Hg into aquatic systems (e.g., streams) near mining deposits [18,19,20]. Concentrations of PTEs in water, sediments, and plant systems have shown a heterogeneous distribution [7,19,56]. Hence, we decided not to determine PTE concentrations in a time series along with mining activity development. Instead, we presented information on the enhanced potential distributions of PTE contaminations caused by multiple factors in a local time series. Because the ASGM sector is informal, illegal, unregulated, and vulnerable, the gold supply from this sector is unknown. ASGM developments in remote rural areas using LCTs as a critical indicator of mining scale development has been revealed in previous studies [22]. Large entry of illegal immigrant miners from neighboring regions to the mining camps was identified as associated with increases in local gold prices [22]. Furthermore, detailed changes and volumes of mining activities have been identified by combining them with a nighttime light dataset [23]. The considerable growth of mining activities with an increase of illegal miners likely resulted in considerable releases of Hg concentrated runoffs, thereby increasing environmental and human health risks from PTEs.

4.2. Time Series Analysis of a Coexisting Mining Site

The study deposits are located in two different sub-basins connected to the M-BR and U-BR (Figure 5). According to the findings, the frequent LCTs and their repeated process in the MTMBT–W deposit has been caused by dumping the excavated underground soil during their rapid development since 2019 [26]. Notable road development may result from a part of a 30-km mining road network development with a 24 million US dollar (MUSD) investment, connecting to the southern port in the concession area [57]. The mining-related infrastructure constructions would rapidly follow along with the mining road development. The related infrastructure construction would comprise a gold ore processing plant (29 MUSD investments), mining support facilities (21 MUSD), drilling two gold prospects of MTMBT–E and Tulabolo (24 MUSD), and a waste treatment facility (10 MUSD) [57]. Particularly, the target deposits for drilling are MTMBT–E and Tulabolo [57], located in different sub-basins, and the contamination in both basins would be critical.
The volume of anthropogenic PTEs, such as Hg, used in gold extraction processing could increase along with the site development. Mining-related infrastructure developments would cause land-shape changes by opening, excavating, and dumping As- and Pb-contaminated underground soils. Acidity conditions in the mining area could further accelerate the mobilization of PTE [4,15,16] and undesirable Hg methylation in sediment [15].
To date, few studies have quantified coexisting mining operations using SSC technology. Previous studies have qualitatively explored the interface between LSM and small-scale artisanal mining in Ghana [58]. However, this study quantified their development using time series visualization. High spatiotemporal SSC series were used to monitor the developments of the coexisting mining operations by overcoming the challenges of medium spatiotemporal resolution satellites, particularly in tropical regions with frequent heavy rainstorms [26]. Our analysis was based on a river sub-basin, revealing possible PTE contamination directions and high-risk areas, particularly in the MTMBT–E and Tulabolo areas, as discussed in the previous paragraph. We also associated the findings with the impacts of natural hazards to investigate enhanced PTE contaminations driven by multiple sources (Section 3.3).

4.3. Time Series Analysis of Riverbank Erosion

We quantified and characterized the maximum erosion volume using GEP and SSCs associated with the CHIRPS datasets. According to the findings, the river expansion was 139.3% between 2002 and 2022, revealing a maximum of 3,436,139.40 m3 of contaminated soil erosion. Particularly, critical riverbank erosion was demonstrated by changing river courses and expanding its extent, with a peak in November 2020. The repetition of LCTs from rivers to agricultural lands was remarkable in the meandering parts (Figure 8). As described in the introduction, fertilizers are an anthropogenic critical contributing factor to PTE contamination of soil [2,8]. In addition to eroded riverbank soils naturally contaminated by PTEs, erosion of agricultural soil applied with fertilizer can be easily flushed into rivers and even to residential areas, threatening human health and the environment [16]. The repeated LCT patterns would exacerbate PTE contamination, particularly in the lower part of the BR, where even a low density of P’vittata distribution was found (Figure 7 and Figure 8). High spatiotemporal observations enable us to quantify and estimate the volumes and rates of contaminated soil erosion caused by natural hazards. Associating results with weathering datasets helps reveal the causing factors and patterns of changes. Previously, [36] used publicly available satellite datasets to quantify riverbank erosion volume, critically affecting the rapid shrinkage of a critical lake in Goraontalo Province, Indonesia. Conversely, we quantified riverbank erosion associated with multiple PTE contamination sources using SSCs.

4.4. Enhanced Potentially Toxic Element Contaminations from the Rapid Development of Coexisting Gold Mining Operations Combined with Riverbank Erosion

A combination of various factors results in enhanced PTE contaminations. We found multiple correlations among LCTs, precipitation, river extents, and riverbank erosion volumes. The increase in river extents and riverbank erosion could be related to a change in the precipitation pattern associated with a decrease in water storage capacities under the mining developments. Moreover, natural resource extraction, such as deforestation and mining, alters the partitioning of precipitation into runoff, storage, and evaporation, accelerating flood hazard risks [59]. In addition, mountaintop mining has a high risk of heavy runoff and flash floods [60]. However, the severe shaft-mining method and rapid infrastructure development since 2019 are expected to increase the vulnerability and frequency of natural hazards, such as floods and landslides. These increased flood hazard risks also hasten riverbank erosion, significantly provoking multiple PTE contaminations from various factors. Although multiple PTE contamination occurs in geographically distinct areas, it is quickly mobilized, transformed, and methylated on a large scale, combined with natural hazards’ mechanisms [14]. Moreover, this combined PTE contamination could further be critical at Tomini Bay due to the increased salt concentrations [15]. The effects on human health are crucial, because bay-side localities mainly depend on marine products. In a recent study, plants were used as biometers in the related mining area to assess the contamination (i.e., AS, Pb, and Hg) of the environment [19]. However, this study relied primarily on river sub-basins and quantified the enhanced possible distribution of PTE contamination from the coexisting mining sites combined with natural hazards using SSCs.
Time series analysis using high spatiotemporal datasets can reveal the volume, pattern, direction, and rate of possible distribution of multiple PTE contaminations caused by various factors. Examples of the maximum two-period of LCT images, river extents, and eroded volume in a year were shown in Section 3.2 and Section 3.3. However, the PS SSC series are the products available daily, weekly, and monthly. Therefore, these can quantify natural hazards and mining-induced socio–environmental changes in shorter time frames. For example, the number of available images (PS SuperDove Ortho tile) with less than 30% cloud coverage and 100% area coverage in the Bone River in 2021 was approximately 8, 6, and 42 times more (42 imagery) [44] than that of Landsat-8 (5 imagery) [39], Sentinel-2 (7 imagery) [39], and GEP (1 imagery), respectively. This high temporal image availability enables effective time series monitoring based on the periods (week, month, and season) [37] and natural hazard types, providing significant insights into environmental and human health management [26,31,61].

4.5. Limitations

This study had several limitations related to the size of the study area and the quality of the riverbank erosion volume. First, the study area of the Bone Riverside was determined using image availability in GEP. Our study area was expanded because of the limited number of available cloud-free images and area coverage biases. Second, the results are based on a qualitatively measured average depth of 1.3 m surveyed in 2002 because the actual depth of the rivers by year cannot be precisely determined.

5. Conclusions

In this study, we quantified the enhanced potential distribution of multiple PTE contaminations for the coexisting gold mining site associated with massive riverbank erosion using SSC, GEP, and hydrographic datasets. Strong correlations among natural event and anthropogenic activity-induced changes and precipitation were found. The employed high spatiotemporal observations allowed us to characterize advantageous spatiotemporal information, such as critical directions, volumes, rates, and distributions of PTEs, for various natural and anthropogenic activities at various stages. In regions where harmful anthropogenic activities are conducted in natural and high PTE environments, our methodology may be crucial and further beneficial. Recognizing the massive and rapid developments of the coexisting mining sites, the impacts of natural hazards, and an association between them aids in predicting and alerting to possible enhanced PTE contamination risks for marine ecosystems and humans at local and regional levels. In the present work, we focused on the potential enhanced distribution for multiple PTE contaminations for various sources; future work in this area, however, could aim to estimate contamination levels at the estuary, where contaminated materials are accumulated by natural and anthropogenic activities.

Author Contributions

S.K. contributed to conceptualization of the research, methodology, data analysis, data visualization, writing—original draft preparation, and writing—review and editing. M.N. provided PS datasets and technical advice. M.S. conducted funding acquisition. All authors have read and agreed to the published version of the manuscript.

Funding

This research was financially supported by the Research Institute for Humanity and Nature (RIHN: a constituent member of NIHU). Project No. RIHN 14200102.

Institutional Review Board Statement

Not applicable.

Data Availability Statement

Not applicable.

Acknowledgments

We thank the Center for Research and Application of Satellite Remote Sensing, Yamaguchi University, Japan, for providing PS datasets for this research. We also thank the anonymous reviewers for their constructive comments that strengthened the work.

Conflicts of Interest

The authors declare no conflict of interest.

References

  1. He, Z.; Shentu, J.; Yang, X.; Baligar, V.C.; Zhang, T.; Stoffella, P.J. Heavy Metal Contamination of Soils: Sources, Indicators, and Assessment. J. Environ. Indic. 2015, 9, 17–18. [Google Scholar]
  2. Edelstein, M.; Ben-Hur, M. Heavy metals and metalloids: Sources, risks and strategies to reduce their accumulation in horticultural crops. Sci. Hortic. 2018, 234, 431–444. [Google Scholar] [CrossRef]
  3. He, Z.L.; Yang, X.E.; Stoffella, P.J. Trace elements in agroecosystems and impacts on the environment. J. Trace Elem. Med. Biol. 2005, 19, 125–140. [Google Scholar] [CrossRef] [PubMed]
  4. Bakshi, S.; Banik, C.; He, Z. The impact of heavy metal contamination on soil health. Manag. Soil Health Sustain. Agric. 2018, 2, 63–95. [Google Scholar] [CrossRef]
  5. Sarwar, N.; Imran, M.; Shaheen, M.R.; Ishaque, W.; Kamran, M.A.; Matloob, A.; Rehim, A.; Hussain, S. Phytoremediation strategies for soils contaminated with heavy metals: Modifications and future perspectives. Chemosphere 2017, 171, 710–721. [Google Scholar] [CrossRef]
  6. Smedley, P.L.; Kinniburgh, D.G. A review of the source, behaviour and distribution of arsenic in natural waters. Appl. Geochem. 2002, 17, 517–568. [Google Scholar] [CrossRef]
  7. Kabata-Pendias, A.; Pendias, H. Trace Elements in Soils and Plants, 3rd ed.; CRC Press: Boca Raton, FL, USA, 2001; Volume 2. [Google Scholar]
  8. Vardhan, K.H.; Kumar, P.S.; Panda, R.C. A review on heavy metal pollution, toxicity and remedial measures: Current trends and future perspectives. J. Mol. Liq. 2019, 290, 111197. [Google Scholar] [CrossRef]
  9. Abdu, N.; Abdullahi, A.A.; Abdulkadir, A. Heavy metals and soil microbes. Environ. Chem. Lett. 2017, 15, 65–84. [Google Scholar]
  10. Roy, M.; McDonald, L.M. Metal Uptake in Plants and Health Risk Assessments in Metal-Contaminated Smelter Soils. Land Degrad. Dev. 2013, 25, 785–792. [Google Scholar] [CrossRef]
  11. Alloway, B.J. Heavy Metals in Soils, 2nd ed.; Springer: London, UK; Dordrecht, The Netherlands, 1995. [Google Scholar]
  12. World Health Organization. Artisanal and Small-Scale Gold Mining and Health; World Health Organization: Geneva, Switzerland, 2016. [Google Scholar]
  13. Ajeel, M.A.; Ajeel, A.A.; Nejres, A.M.; Salih, R.A. Assessment of Heavy Metals and Related Impacts on Antioxidants and Physiological Parameters in Oil Refinery Workers in Iraq. J. Health Pollut. 2021, 11, 210907. [Google Scholar] [CrossRef]
  14. Young, S.; Balluz, L.; Malilay, J. Natural and technologic hazardous material releases during and after natural disasters: A review. Sci. Total. Environ. 2004, 322, 3–20. [Google Scholar] [CrossRef] [PubMed]
  15. Förstner, U.; Salomons, W. Mobilization of Metals from Sediments in Metals and Their Compounds in the Environment: Occurrence, Analysis, and Biological Relevance, 2nd ed.; Wiley-VCH: Weinheim, Germany, 1991. [Google Scholar]
  16. Adamo, P.; Arienzo, M.; Imperato, M.; Naimo, D.; Nardi, G.; Stanzione, D. Distribution and partition of heavy metals in surface and sub-surface sediments of Naples city port. Chemosphere 2005, 61, 800–809. [Google Scholar] [CrossRef] [PubMed]
  17. Smedley, P.; Nicolli, H.; Macdonald, D.; Barros, A.; Tullio, J. Hydrogeochemistry of arsenic and other inorganic constituents in groundwaters from La Pampa, Argentina. Appl. Geochem. 2002, 17, 259–284. [Google Scholar] [CrossRef]
  18. Gafur, N.A.; Sakakibara, M.; Sano, S.; Sera, K. A case study of heavy metal pollution in water of Bone river by ASGM activities in Eastern part of Gorontalo, Indonesia. Water 2018, 10, 1507. [Google Scholar] [CrossRef]
  19. Gafur, N.A.; Sakakibara, M.; Komatsu, S.; Sano, S.; Sera, K. Environmental Survey of the Distribution and Metal Contents of Pteris vittata in Arsenic–Lead–Mercury-Contaminated Gold Mining Areas along the Bone River in Gorontalo Province, Indonesia. Int. J. Environ. Res. Public Health 2022, 19, 530. [Google Scholar] [CrossRef]
  20. Basir, S.; Kimijima, M.; Sakakibara, M.; Pateda, S.M.; Sera, K. Contamination Level in Geo-Accumulation Index of River Sediments at Artisanal and Small-Scale Gold Mining Area in Gorontalo Province, Indonesia. Int. J. Environ. Res. Public Health 2022, 19, 6094. [Google Scholar] [CrossRef]
  21. World Bank. Working Together: How Large-Scale Mining Can Engage with Artisanal and Small-Scale Miners; World Bank: Washington, DC, USA, 2009. [Google Scholar] [CrossRef]
  22. Kimijima, S.; Sakakibara, M.; Nagai, M.; Gafur, N.A. Time-Series Assessment of Camp-Type Artisanal and Small-Scale Gold Mining Sectors with Large Influxes of Miners Using LANDSAT Imagery. Int. J. Environ. Res. Public Health 2021, 18, 9441. [Google Scholar] [CrossRef]
  23. Kimijima, S.; Sakakibara, M.; Nagai, M. Detection of Artisanal and Small-Scale Gold Mining Activities and Their Transformation Using Earth Observation, Nighttime Light, and Precipitation Data. Int. J. Environ. Res. Public Health 2021, 18, 10954. [Google Scholar] [CrossRef]
  24. Kimijima, S.; Sakakibara, M.; Nagai, M. Characterizing Time-Series Roving Artisanal and Small-Scale Gold Mining Activities in Indonesia Using Sentinel-1 Data. Int. J. Environ. Res. Public Health 2022, 19, 6266. [Google Scholar] [CrossRef]
  25. Kimijima, S.; Sakakibara, M.; Nagai, M. Investigation of Long-Term Roving Artisanal and Small-Scale Gold Mining Activities Using Time-Series Sentinel-1 and Global Surface Water Datasets. Int. J. Environ. Res. Public Health 2022, 19, 5530. [Google Scholar] [CrossRef]
  26. Kimijima, S.; Nagai, M.; Sakakibara, M. Monitoring Coexisting Rapid Small-Scale and Large-Scale Gold Mining Developments Using Planet Smallsats Constellations. Mining 2022, 2, 566–577. [Google Scholar] [CrossRef]
  27. United Nations Environment Programmet. Technical Background Report to the Global Mercury Assessment 2018; United Nations Environment Programme: Tromsø, Norway, 2018. [Google Scholar]
  28. Eisler, R.; Wiemeyer, S.N. Cyanide hazards to plants and animals from gold mining and related water issues. Rev. Environ. Contam. Toxicol. 2004, 183, 21–54. [Google Scholar] [CrossRef] [PubMed]
  29. World Health Organization. Guidelines for Drinking-Water Quality. Graphics, 2022. Available online: https://apps.who.int/iris/bitstream/handle/10665/352532/9789240045064-eng.pdf?sequence=1&isAllowed=y#page=29 (accessed on 1 December 2022).
  30. U.S. Environmental Protection Agency. Clean Water Act: Section 503; U.S. Environmental Protection Agency: Washington, DC, USA, 1993; Volume 58. [Google Scholar]
  31. Palapa, T.M.; Maramis, A.A. Heavy Metals in Water of Stream Near an Amalgamation Tailing Ponds in Talawaan—Tatelu Gold Mining, North Sulawesi, Indonesia. Procedia Chem. 2015, 14, 428–436. [Google Scholar] [CrossRef]
  32. Persaud, D.; Jaagumagi, R.; Hayton, A. Guidelines for the Protection and Management of Aquatic Sediment Quality in Ontario; Ministry of Environment and Energy: Toronto, ON, Canada, 1993. [Google Scholar] [CrossRef]
  33. U.S. Environmental Protection Agency. The Incidence and Severity of Sediment Contamination in Surface Waters of the United States, Volume 1—National Sediment Quality Survey; U.S. Environmental Protection Agency: Washington, DC, USA, 1997. [Google Scholar]
  34. MacDonald, D.D.; Ingersoll, C.G.; Berger, T.A. Development and Evaluation of Consensus-Based Sediment Quality Guidelines for Freshwater Ecosystems. Arch. Environ. Contam. Toxicol. 2000, 39, 20–31. [Google Scholar] [CrossRef]
  35. Ontario Ministry of Environment Conservation and Parks. Rules for Soil Management and Excess Soil Quality Standards; Ontario Ministry of Environment Conservation and Parks: Toronto, ON, Canada, 2020. [Google Scholar]
  36. Kimijima, S.; Sakakibara, M.; Amin, A.; Nagai, M.; Arifin, Y.I. Mechanism of the Rapid Shrinkage of Limboto Lake in Gorontalo, Indonesia. Sustainability 2020, 12, 9598. [Google Scholar] [CrossRef]
  37. Kimijima, S.; Nagai, M.; Sakakibara, M.; Jahja, M. Investigation of Cultural–Environmental Relationships for an Alternative Environmental Management Approach Using Planet Smallsat Constellations and Questionnaire Datasets. Remote Sens. 2022, 14, 4249. [Google Scholar] [CrossRef]
  38. PT Bumi Resources Minerals Tbk. New Face New Direction. 2017. Available online: https://bumiresourcesminerals.com/wp-content/uploads/2020/11/brm_2017_annual_report-min2.pdf (accessed on 1 December 2022).
  39. Google Earth Engine. 2022. Available online: https://code.earthengine.google.co.in (accessed on 1 December 2022).
  40. Japan International Cooperation Agency. Summary: The Study on Flood Control and Water Management in Limboto-Bolango-Bone Basin; Final Report Volume-II Main Report; Japan International Cooperation Agency: Tokyo, Japan, 2002. [Google Scholar]
  41. The ASEAN Disaster Information Network. SEARCH. 2022. Available online: https://adinet.ahacentre.org/ (accessed on 1 December 2022).
  42. Japan International Cooperation Agency. The Study on Flood Control and Water Management Limboto-Bolango-Bone Basin in the Republic of Indonesia Volume-III Supporting Report: Part-A Existing Conditions; Japan International Cooperation Agency: Tokyo, Japan, 2002. [Google Scholar]
  43. Japan International Cooperation Agency. The Study on Flood Control and Water Management in Limboto-Bolango-Bone Basin in The Republic of Indonesia Final Report Volume-1 Summary; Japan International Cooperation Agency: Tokyo, Japan, 2002; p. D1-1. [Google Scholar]
  44. Planet Labs. Planet Explore. 2022. Available online: https://www.planet.com/expl (accessed on 1 December 2022).
  45. Planet Labs. PlanetScope. 2022. Available online: https://developers.planet.com/docs/data/planetscope/#:~:text=lastupdated%3AJune01%2C2022,200millionkm2%2Fday (accessed on 1 December 2022).
  46. Harrison, N.; Mascaro, J. Access to Planet High Spatial and Temporal Resolution Earth Observation Imagery via the NASA Commercial Smallsat Data Acquisition (CSDA) Program. 2021. Available online: https://www.hou.usra.edu/meetings/planetdata2021/pdf/7107.pdf (accessed on 1 December 2022).
  47. Frazier, A.E.; Hemingway, B.L. A Technical Review of Planet Smallsat Data: Practical Considerations for Processing and Using PlanetScope Imagery. Remote. Sens. 2021, 13, 3930. [Google Scholar] [CrossRef]
  48. Planet Labs. Understanding PlanetScope Instruments. 2022. Available online: https://developers.planet.com/docs/apis/data/sensors/ (accessed on 1 December 2022).
  49. Rodriguez-Galiano, V.F.; Ghimire, B.; Rogan, J.; Chica-Olmo, M.; Rigol-Sanchez, J.P. An assessment of the effectiveness of a random forest classifier for land-cover classification. ISPRS J. Photogramm. Remote Sens. 2012, 67, 93–104. [Google Scholar] [CrossRef]
  50. Taylor, M.P.; Stokes, R. When is a River not a River? Consideration of the legal definition of a river for geomorphologists practising in New South Wales, Australia. Aust. Geogr. 2005, 36, 183–200. [Google Scholar] [CrossRef]
  51. Vidal-Abarca, M.; Gómez, R.; Sánchez-Montoya, M.; Arce, M.; Nicolás, N.; Suárez, M. Defining Dry Rivers as the Most Extreme Type of Non-Perennial Fluvial Ecosystems. Sustainability 2020, 12, 7202. [Google Scholar] [CrossRef]
  52. Japan International Cooperation Agency. Basic Surveys and Studies; Japan International Cooperation Agency: Tokyo, Japan, 2002. [Google Scholar]
  53. Japanese International Cooperation Agency. Indonesian Profile of Environmental and Social Considerations: Environmental Management Act 1995. September 2011. Available online: https://openjicareport.jica.go.jp/pdf/12040044.pdf (accessed on 1 December 2022).
  54. Republic of Indonesia. Republic of Indonesia Government Regulation 82 on Water Quality Management and Water Pollution Control; Republic of Indonesia: Jakarta, Indonesia, 2011. [Google Scholar]
  55. Xie, Z.M.; Lu, S.G. Trace elements and environmental quality. In Micronutrients and Biohealth; Guizhou Sci Technol Press: Guiyan, China, 2000. [Google Scholar]
  56. Alloway, B.J.; Jackson, A.P. The behaviour of heavy metals in sewage sludge-amended soils. Sci. Total. Environ. 1991, 100, 151–176. [Google Scholar] [CrossRef]
  57. KONTAN. Gorontalo Minerals Immediately Implements Gold Mine Development. 2022. Available online: https://industri.kontan.co.id/news/gorontalo-minerals-segera-melaksanakan-pengembangan-tambang-emas (accessed on 1 December 2022).
  58. Yankson, P.W.; Gough, K.V. Gold in Ghana: The effects of changes in large-scale mining on artisanal and small-scale mining (ASM). Extr. Ind. Soc. 2019, 6, 120–128. [Google Scholar] [CrossRef]
  59. Caretta, M.A.; Fernandez, R.; Zegre, N.; Shinn, J. Flooding Hazard and Vulnerability. An Interdisciplinary Experimental Approach for the Study of the 2016 West Virginia Floods. Front. Water 2021, 3, 60. [Google Scholar] [CrossRef]
  60. Zégre, N.P.; Maxwell, A.; Lamont, S. Characterizing streamflow response of a mountaintop-mined watershed to changing land use. Appl. Geogr. 2013, 39, 5–15. [Google Scholar] [CrossRef]
  61. Kimijima, S.; Nagai, M. Rapid Lake Shrinkage Associated High-Spatiotemporal Flood Monitoring using Planet Smallsat Constellation and Sentinel-1 Datasets. Remote Sens. 2023. [Google Scholar]
Figure 1. Overall methodological workflow used in this study.
Remotesensing 15 00861 g001
Figure 2. (a) Regional overview, (b) geological characteristics and river sub-basins in the study area overlapped with the data from the Shuttle Radar Topography Mission. The study area in the right panel corresponds to assessing the mining development. The study area in the left panel corresponds to assessing the riverbank erosion.
Remotesensing 15 00861 g002
Figure 3. Pools of water mixed with hydrogen peroxide (a) and mercury mixed with cyanide (b) for immersing materials in the study sites [22].
Remotesensing 15 00861 g003
Figure 4. Georeferenced map of water and sediments sampling points and plants (Pteris vittata) distribution in the study site.
Remotesensing 15 00861 g004
Figure 5. Landcover classification using PlanetScope series; (ag) landcover transformations in the coexisting mining site (2019–2022); (h,i) overview of the target area.
Remotesensing 15 00861 g005
Figure 6. Time series of landcover changes of built-up and barren extents by target deposits.
Remotesensing 15 00861 g006
Figure 7. Transformations of west side river extents using PlanetScope series; (ag) transformations of river extents by highlighting differences (2002–2022); (h) site overview.
Remotesensing 15 00861 g007
Figure 8. Transformations of east side river extents using PlanetScope series; (ag) transformations of river extents by highlighting differences (2002–2022); (h) site overview.
Remotesensing 15 00861 g008
Figure 9. Time series of the extents of the entire Bone River, east and west side, and eroded volumes from 2017 to 2022.
Remotesensing 15 00861 g009
Figure 10. Time series of the monthly precipitation in the study area.
Remotesensing 15 00861 g010
Table 1. Main specification of the imagery used in this study.
Coexisting Mining AreaBone River Area
Acquisition DateInstrumentAcquisition DateProvider/Instrument
10 August 2019Dove-R3 September 2002Maxar Technologies
13 April 2020Dove-R1 July 2012
11 November 2020SuperDove19 February 2016
29 January 2021 31 May 2017Dove-C
9 June 2021 28 October 2017
31 January 2022 23 February 2018
3 June 2022 27 September 2018
2, 7 March 2019
25 September 2019Dove-R
12, 13 April 2020
11 November 2020SuperDove
6 May 2021
24 October 2021
12 March 2022
2 August 2022
Table 2. Potentially toxic element concentrations (As, Hg, Pb) in water, sediment, and soils and pH (water) in the study area and various world standards.
Sample AsHgPbpHReference
Water Reported Range Mining site 201866–118176–48922–1351.96–4.00[18]
(μg L−1)  Bone River 2018103–82,50016–208018–16707.53–7.82[18]
 Water Quality WHO 1 2022106106.5–8.0[29]
 Guidelines  US-EPA 1 1993102156.5–8.5[30]
(QGs) IWQI 1 2001501306.0–9.0[53,54]
Sediment Reported Range Mining site 201827,000–62,100ND–790843–2660 [18]
(mg kg−1)  Bone River 20184.6–120,000ND–57.924.1–10,700 [18]
 Bone River 2018-201915.9–7989.5–86.358.2–645 [20]
 Sediment QGs Persaud et al. (1993):     LEL60.231 [32]
 SEL332250 [32]
 US-EPA (1997):         TEL7.240.01330.2 [33]
 PEL41.60.696112 [33]
 MacDonald et al. (2000):    TEC9.790.1835.8 [34]
 PEC331.06128 [34]
Soil Reported Range Bone River (2018)0–36,5000–368–11,400 [19]
(mg kg−1) Soil QGs  ERO (2000):       Agricultural110.2445 [35]
Residential180.27120 [35]
Industrial180.27250 [35]
Metal-rich Soils250–250010–100>1% [3,55]
Note: IWQI indicates the Indonesian water quality index. 1 indicates drinking water standard. LEL and SEL indicate the lowest effect level and severe effect level, respectively. TEL and PEL indicate the threshold effects level and probable effects level, respectively. TEC and PEC indicate the threshold effect concentration and probable effect concentration, respectively. LEL, TEL, and TEC represent the concentration levels below the occurrence of adverse effects that are not expected. SEL, PEL, and PEC represent the concentration levels above the occurrence of adverse effects that are frequently expected. ND indicates not detected. ERO indicates the Environmental Registry of Ontario.
Table 3. Entire river extents, eroded extents, and eroded volumes from 2002 to 2022 in the study area.
River Extents (km2)Eroded Extents (km2)Eroded Volumes (m3)
September 20022.13--
July 20122.090.66859,003.35
December 20162.230.31408,713.59
May 20171.780.10128,724.72
October 20172.150.38489,717.59
February 20182.130.0115,316.75
September 20182.150.0338,461.11
March 20192.210.0673,957.46
September 20192.220.0224,534.75
April 20202.190.0119,068.75
November 20203.181.011,307,705.23
May 20213.160.0118,424.66
October 20213.140.0229,230.93
March 20222.990.00-
August 20222.960.0223,280.54
Total 3,436,139.40
Table 4. Disasters that occurred in Bone Bolango from 2012 to 2022.
YearTypeNumber of
Occurrences
RiverAffected
Population
Damaged
Houses
2012Flood2Bone Raya123663–211
2013Flood2Bone145–61177–90
2014Flood1Bone574NA
2017Flood1Bone10,350499
2018Flood1Bolango1540NA
2020Landslide, Flood4Bone and Bolango1321–9301NA
2021Landslide, Flood3Bone238–123160–376
2022Landslide, Flood5Bone342–3166106–901
Note: Affected population per disaster. NA indicates that data are not available. (Source: ASEAN Disaster Information Network [41]).
Disclaimer/Publisher’s Note: The statements, opinions and data contained in all publications are solely those of the individual author(s) and contributor(s) and not of MDPI and/or the editor(s). MDPI and/or the editor(s) disclaim responsibility for any injury to people or property resulting from any ideas, methods, instructions or products referred to in the content.

