
A Comparison of Six Forest Mapping Products in Southeast Asia, Aided by Field Validation Data
by
 , , and
Bin Liu
1,2,†, 
Xiaomei Yang
1,2,† ,
,
Zhihua Wang
1,2,*,
Yaxin Ding
1,2,
Junyao Zhang
1,2 and
Dan Meng
1,2 1
State Key Laboratory of Resources and Environmental Information System, Institute of Geographic Sciences and Natural Resources Research, Chinese Academy of Sciences, Beijing 100101, China
2
University of Chinese Academy of Sciences, Beijing 100049, China
*
Author to whom correspondence should be addressed.
†
These authors contributed equally to this work.
Remote Sens. 2023, 15(18), 4584; https://doi.org/10.3390/rs15184584
Submission received: 17 July 2023
/
Revised: 14 September 2023
/
Accepted: 15 September 2023
/
Published: 18 September 2023
(This article belongs to the Topic Advances in Multi-Scale Geographic Environmental Monitoring: Theory, Methodology and Applications)
Abstract
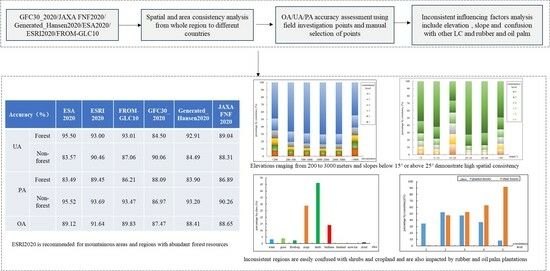
:Currently, many globally accessible forest mapping products can be utilized to monitor and assess the status of and changes in forests. However, substantial disparities exist among these products due to variations in forest definitions, classification methods, and remote sensing data sources. This becomes particularly conspicuous in regions characterized by significant deforestation, like Southeast Asia, where forest mapping uncertainty is more pronounced, presenting users with challenges in selecting appropriate datasets across diverse regions. Moreover, this situation impedes the further enhancement of accuracy for forest mapping products. The aim of this research is to assess the consistency and accuracy of six recently produced forest mapping products in Southeast Asia. These products include three 10 m land cover products (Finer Resolution Observation and Monitoring Global LC (FROM-GLC10), ESA WorldCover 10 m 2020 (ESA2020), and ESRI 2020 Land Cover (ESRI2020)) and three forest thematic mapping products (Global PALSAR-2 Forest/Non-Forest map (JAXA FNF2020), global 30 m spatial distribution of forest cover in 2020 (GFC30_2020), and Generated_Hansen2020, which was synthesized based on Hansen TreeCover2010 (Hansen2010) and Hansen Global Forest Change (Hansen GFC) for the year 2020). Firstly, the research compared the area and spatial consistency. Next, accuracy was assessed using field validation points and manual densification points. Finally, the research analyzed the geographical environmental and biophysical factors influencing consistency. The results show that ESRI2020 had the highest overall accuracy for forest, followed by ESA2020, FROM-GLC10, and Generated_Hansen2020. Regions with elevations ranging from 200 to 3000 m and slopes below 15° or above 25° showed high spatial consistency, whereas other regions showed low consistency. Inconsistent regions showed complex landscapes heavily influenced by human activities; these regions are prone to being confused with shrubs and cropland and are also impacted by rubber and oil palm plantations, significantly affecting the accuracy of forest mapping. Based on the research findings, ESRI2020 is recommended for mountainous areas and abundant forest regions. However, in areas significantly affected by human activities, such as forest and non-forest edges and mixed areas of plantations and natural forests, caution should be taken with product selection. The research has identified areas of forest inconsistency that require attention in future forest mapping. To enhance our understanding of forest mapping and generate high-precision forest cover maps, it is recommended to incorporate multi-source data, subdivide forest types, and increase the number of sample points.
1. Introduction
Forests are of great importance in global ecology, specifically in terms of biodiversity conservation and carbon balance [1,2,3,4,5]. In particular, tropical forests play a significant role in mitigating climate change [6,7]. Southeast Asia is home to approximately 15% of the world’s tropical forests [7], encompassing at least four biodiversity hotspots [8]. Moreover, these forests are essential for the region’s development [9,10]. However, human activities have led to rapid changes in the forests of this region [9,11], which in turn have significant implications for the natural environment [10]. Therefore, gaining a comprehensive understanding of the distribution and changes in Southeast Asia forests is of great importance. Remote sensing technology has greatly aided the mapping of large-scale tropical forests, leading to the production of numerous land cover products that include forest in recent years [12,13,14], for example, 10 m resolution Finer Resolution Observation and Monitoring Global LC (FROM-GLC10) [12], ESA WorldCover 10 m 2020 (ESA2020) [13], and ESRI 2020 Land Cover (ESRI2020) [14]. Forest thematic mapping products, such as global 30 m spatial distribution of forest cover in 2020 (GFC30_2020) [15], have also been developed, alongside continuously updated forest products like Hansen Global Forest Change (Hansen GFC) [16] and the Global PALSAR-2 Forest/Non-Forest map (JAXA FNF) [17]. Nevertheless, variations in definitions, classification algorithms, and data sources lead to limited comparability among products, particularly regarding the spatial consistency of forests across different regions [18,19,20]. This complicates the precise measurement of forests and spatial distribution. Thus, the identification of the spatial distribution of forests necessitates cross-validation among various products.
Numerous studies have been conducted to analyze the consistency of multiple forest mapping products, focusing on two aspects: (1) consistency analysis within land cover products, including forests as one of the land cover classes [21,22,23,24]; (2) consistency analysis specifically targeting forests, using land cover data to extract forests for analysis [25,26,27]. However, these studies still have certain limitations. On one hand, Southeast Asia boasts vast tropical rainforests, but these rainforests have been impacted by global forestry demand [10], such as the extensive cultivation of oil palm in Malaysia and Indonesia, which account for over 90% of global palm oil production [28,29]. As the balance between forestry supply and demand changes, the types and spatial distribution of forest resources in each country experience corresponding changes. Analyzing the Southeast Asian region aids in comprehending forest distribution, identifying hotspots with inconsistent forest distribution, and determining the primary factors of spatial inconsistency. This approach prevents overly biased and inaccurate analysis of the influencing factors of inconsistency in individual countries or smaller regions. On the other hand, the lack of field validation points has left the accuracy of numerous remote sensing products unassessed [30]. Even if assessment is feasible, ensuring the reliability of accuracy evaluation is challenging due to the difficulty of guaranteeing the accuracy of the obtained validation points. The availability of field validation points allows them to be used as references during other point collection processes, thereby making the manual densification points more reflective of real land cover features and significantly improving the reliability of accuracy evaluation results. Therefore, it is of great significance to conduct accuracy evaluations on medium-high resolution forest products, compare the accuracy and strengths and weaknesses of multiple forest mapping products, and analyze potential factors of the observed differences.
The aim of this research was to utilize field validation data collected by the research team [21,23] to analyze and assess the consistency and accuracy of multiple forest mapping products. Furthermore, we sought to analyze the factors that influence consistency by considering the geographical environmental (elevation, slope) and biophysical (land cover, LC) factors [26,31,32]. This analysis provides users with guidance for selecting and using forest products in tropical rainforest regions and identifying areas for improvement and optimization in future forest extraction and updates. Moreover, it serves as a reference for improving the accuracy of forest mapping. Specifically, we used six forest mapping products with resolutions ranging from 10 m to 30 m, including three land cover products (FROM-GLC10, ESA2020, and ESRI2020) and three forest thematic products (JAXA FNF2020, GFC30_2020, and Generated_Hansen2020, which was synthesized based on Hansen TreeCover2010 (Hansen2010) and Hansen GFC). The year for FROM-GLC10 was 2017, while the other products were for 2020. We compared the area and spatial consistency among the different products and evaluated their accuracy using field validation points and manual densification points. Additionally, in regions exhibiting spatial inconsistency, we investigated the impact of elevation, slope, and various land cover classes (including rubber and oil palm) on the variations in forest distribution.
2. Study Area and Data Preprocessing
2.1. Southeast Asia
Southeast Asia (SEA) is located in the southeastern part of Asia, covering an area of approximately 430 million hectares. SEA is abundant in forest resources, holding nearly 15% of the world’s tropical forests. These forests are predominantly distributed in the northeastern part of the Indochina Peninsula, as well as the Malay Archipelago and the island of New Guinea. Forests play a vital role in the region’s development, offering employment opportunities across various sectors for the local population. However, population growth and economic transformation have led to an escalating demand for forests, resulting in rapid changes in forested areas. Consequently, Southeast Asia is recognized as one of the significant hotspots for tropical forest logging and forest degradation [31]. During the period from 1990 to 2010, forest cover in Southeast Asia experienced a decline from 268 million hectares to 236 million hectares [9,10], with ongoing large-scale deforestation.
Southeast Asia boasts expansive plantations and serves as a significant producer of tropical cash crops, including rubber, oil palm, coconut, and banana fiber. It stands as the world’s largest production region, encompassing 85% of the world’s rubber plantations and 90% of rubber production [33]. Additionally, Southeast Asia is home to over 80% of oil palm plantations and contributes to more than 90% of global palm oil production [28]. The dynamic changes in forest resources within this region exert substantial impacts on society, politics, economy, and climate. So we chose Southeast Asia as the study area (Figure 1), including eight countries: Cambodia, Indonesia, Laos, Malaysia, Myanmar, Philippines, Thailand, and Vietnam. East Timor, Singapore, and Brunei are excluded from the research due to their smaller land area, limited forest resources, and negligible influence on the analysis of large-scale forest patterns. By comparing and validating six forest mapping products, our aim is to offer insights into the utilization of such products for studying changes in forest ecosystems, human–environment interactions, and environmental conservation.
2.2. Data and Preprocessing
The forest products selected for this research consist of three land cover products: FROM-GLC10, ESA2020, and ESRI2020. Additionally, three forest thematic products were chosen: JAXA FNF2020, GFC30_2020 and Hansen2010, which was used to synthesize the Generated_Hansen2020 for the year 2020. The land cover products currently offer the highest resolution available for free, with a 10 m resolution. Conversely, the forest thematic products are either recent releases or continuously updated products with a medium resolution of 25–30 m. These products possess high timeliness and resolution, enabling a more precise comprehension of the present forest conditions and facilitating the analysis of the strengths, weaknesses, and distribution of the data products.
- (1)
- FROM-GLC10
The FROM-GLC10 [12] is a global land cover product created by Gong Peng et al., from Tsinghua University, in 2017 (http://data.starcloud.pcl.ac.cn/zh/resource/1, accessed on 31 August 2023). It is based on 10 m resolution Sentinel-2 imagery and was produced using a random forest classifier. The forest class is coded as 20 and is defined as areas with trees higher than 3 m and tree cover of more than 15%. The product was generated using a multi-seasonal sample library, collecting over 300,000 training samples of various sizes from around 93,000 sample points worldwide. The validation set consists of approximately 140,000 samples from different seasons, covering 38,000 sample points. The overall accuracy of the product is 72.76%, with a user’s accuracy for the forest class of about 83.47%.
- (2)
- ESA2020
The ESA2020 [13] is a global land cover product for the year 2020 (https://developers.google.com/earth-engine/datasets/catalog/ESA_WorldCover_v100, accessed on 31 August 2023). It is a collaborative effort between the European Space Agency (ESA) and multiple research institutions worldwide, utilizing imagery from Sentinel-1 and Sentinel-2. The forest class is coded as 10 and is defined as areas where tree cover is more than 10%. This land cover includes classes below the canopy, like shrubs, built-up areas, and plantations, like oil palm and olive trees. It also includes tree-covered areas with seasonally or permanently flooded with freshwater, except for mangroves. The product assesses accuracy through statistical verification, map visual comparison, and spatial accuracy verification. More than 200,000 reference points were used in the map visual comparison to evaluate its accuracy and assess its spatial uncertainty. Its overall accuracy was determined to be 74.4%.
- (3)
- ESRI2020
The ESRI2020 [14] is a global land cover product for the year 2020 (https://www.arcgis.com/home/item.html?id=8214141a576848f69f440c793144f6ce, accessed on 31 August 2023). It was developed using Sentinel-2 imagery with a 10 m resolution and deep learning methods. In this product, the forest class is coded as 2 and defined as dense vegetation clustering of trees taller than 15 m, typically with a closed or dense canopy. This class includes various types of vegetation, such as wooded vegetation and clusters of dense tall vegetation within savannas, plantations, swamps, and mangroves. The model utilized over 5 billion Sentinel-2 pixels, manually annotated from more than 20,000 sampling points distributed worldwide. By processing images captured on multiple dates throughout the year, the model generated a representative map. The overall accuracy is reported to be 85%.
- (4)
- Hansen2010
The Hansen 2010 [16] is a global forest thematic mapping product for the year 2010 (https://glad.umd.edu/dataset/global-2010-tree-cover-30-m, accessed on 31 August 2023). It is a collaborative effort between the Global Land Analysis and Discovery (GLAD) lab at the University of Maryland, Google, the United States Geological Survey (USGS), and the National Aeronautics and Space Administration (NASA). Tree cover is defined as all vegetation taller than 5 m, including both natural forests and planted forests that meet the criteria. The spatial resolution is 30 m, and the tree cover is represented as a percentage from 1% to 100%. The data are derived from Landsat 7 reflectance measurements obtained during the growing season. Over 600,000 Landsat 7 images were analyzed using the Google Earth Engine (GEE) to accurately classify and supervise tree cover at the pixel level.
- (5)
- JAXA FNF2020
The JAXA FNF2020 [17] is a forest product for the year 2020 (https://developers.google.com/earth-engine/datasets/catalog/JAXA_ALOS_PALSAR_YEARLY_FNF4, accessed on 31 August 2023). It was developed by the Japan Aerospace Exploration Agency (JAXA) using L-band synthetic aperture radar sensors on the Advanced Land Observing Satellite-2 (ALOS-2 PALSAR-2) and Advanced Land Observing Satellite (ALOS PALSAR). It was generated through random forest, utilizing variances in the backscattering coefficients among different land cover classes in diverse ecological regions. The product has a spatial resolution of 25 m. Forests are defined as land spanning more than 0.5 hectares with trees higher than 5 m and a canopy cover of more than 10%. This includes forested areas that have not yet reached but are expected to reach the criteria, as well as forest roads, firebreaks, and other small open areas. It includes rubberwood, cork oak, and Christmas tree plantations, but excludes plantations in agricultural production systems, such as oil palm plantations, fruit tree plantations, and olive grove orchards. The accuracy was evaluated using ground photographs and high-resolution optical satellite images. The overall accuracy for three classes—forests, non-forests, and water—was higher than 86%.
- (6)
- GFC30_2020
The GFC30_2020 [15] is a global forest cover product for the year 2020 (https://data.casearth.cn/sdo/detail/625e1760819aec2a46dcd2d8, accessed on 31 August 2023), and it was developed through a collaboration between the Aerospace Information Research Institute of the Chinese Academy of Sciences and other institutions. It was created using a random forest algorithm based on Landsat satellite images and images from GF-1 and GF-6 satellites. The product employs global ecological geographical zoning and crowd-sourced sample data. Its resolution is 30 m. Forests are defined as land spanning more than 0.5 hectares with trees higher than 5 m and a canopy cover of more than 10%, or areas that have not yet reached but are expected to reach the criteria. It excludes forests primarily used for agricultural and urban purposes. The primary data source consists of multi-temporal Landsat images captured during the global forest vegetation growing season. The random forest algorithm was applied for large-scale learning and model training, resulting in the creation of a global forest zoning classifier and the production of the global forest cover product. The product’s accuracy was evaluated through a combination of direct validation and cross-validation. For direct validation, a stratified random sampling approach was adopted, with 1500 points randomly selected for each class. These points were manually inspected and verified using high-resolution images from Google Earth/GF, referencing relevant data products from the United States, Japan, and other sources, and incorporating some field survey data to ensure the reliability of the validation points. In total, 39,900 validation points were obtained globally, and the overall accuracy of the product exceeded 85%.
Table 1 shows the varying resolutions and forest definitions of these forest mapping products. Data preprocessing mainly involves three steps. First, considering the resolution ranges from 10 m to 30 m, we used the nearest neighbor method to resample the spatial resolution to 10 m. Second, we adopted Hansen2010, combined with Hansen GFC loss and gain, to synthesize the forest cover for 2020 based on net changes, and named it Generated_Hansen2020. These products exhibit significant differences in their forest definitions, with the minimum forest cover ranging from 10% to 15% and the minimum tree height ranging from 3 m to 15 m. These variations greatly impacted our assessment of forest distribution and are among the reasons for inconsistency [34]. Therefore, for effective comparison, we appropriately adjusted the products to ensure consistency when comparing different products. In detail, for FROM-GLC10, ESA2020, ESRI2020, JAXA FNF2020, and GFC30_2020, where forests are mapped as a separate class, we directly extracted the forest from the products. For Generated_Hansen2020, to maintain consistency with the other five products, we converted the percentage into a forest category. Therefore, referring to the Global Forest Review (GFR) (https://research.wri.org/gfr/key-terms-definitions#glossary, accessed on 31 August 2023), we extracted areas with tree cover exceeding 30% and considered them forests.
3. Methods
This research utilized field validation points and manual densification points to assess the accuracy, consistency, and disparities among six extensively utilized forest mapping products in Southeast Asia. The processing flowchart is shown in Figure 2. Firstly, we compared the consistency of their area and spatial distribution. Subsequently, accuracy assessment was performed using samples from both forest and non-forest areas. Lastly, we analyzed factors influencing spatial consistency, considering geographical environmental factors, such as elevation and slope, and biophysical factors, such as confusion with other land cover types in spatially inconsistent areas.
3.1. Area and Spatial Consistency Analysis
For area consistency, we used GEE to calculate the differences in the areas among the six products. Furthermore, we analyzed the areas within each country to emphasize the regional disparities throughout Southeast Asia.
For spatial consistency, we used the likelihood assessment method to analyze and compare discrepancies among the different products in terms of spatial differences [35]. By measuring the determinacy and uncertainty of each product, this method evaluates the consistency of individual pixels across different products. It is commonly applied in situations where determining the credibility of multiple products poses challenges [36]. Conceptually, this method can be likened to a voting mechanism for the products and is implemented through spatial overlay techniques. If all products identify a pixel as forest, it results in a high voting score for that pixel, indicating a high level of consistency across the products.
In this research, the forest products were recorded, with a value of 1 for the forest class and 0 for other classes. Spatial overlay was conducted using GEE to obtain the spatial consistency results of forests. The pixel values range from 0 to 6, where each value corresponds to the number of votes for the forest. For instance, a value of 6 signifies that the pixel is classified as forest in all six forest products, whereas a value of 0 indicates that the pixel is not classified as forest in any of the products. Higher pixel values indicate a greater probability of being classified as forest, indicating higher consistency among the products. The spatial consistency was categorized into six levels based on the pixel value range: Level 1 represents areas of complete inconsistency, Levels 2–5 represent partially consistent areas, and Level 6 represents areas of complete consistency. Moreover, a value of 0 signifies non-forest areas. It is crucial to address a specific matter accurately: a value of 0 indicates that the six products do not classify the area as forest; however, this does not necessarily mean there is no forest there. Rather, it suggests an extremely low likelihood of forest presence in that area.
Additionally, we computed a comprehensive index to assess the overall level of spatial consistency. The formula is defined as follows:
In this formula, AHF represents the forest area in completely consistent regions, while Ai(F) represents the forest area in the ESRI2020, ESA2020, FROM-GLC10, GFC30_2020, Generated_Hansen2020, and JAXA FNF2020 products, respectively.
3.2. Verification Point Design and Accuracy Assessment
We evaluated the accuracy of the forest products using field validation points and manual densification points. The design of the validation points involved determining the sampling method, the number of sample points, and the attributes of the sample types.
We utilized a stratified random sampling method. Adequate samples were necessary to validate product accuracy and capture the confusion between different classes. Stratified random sampling is a practical and commonly used sampling design scheme [37,38] for accuracy assessment purposes. Cochran [39] provided the following sample size formula (assuming equal sampling costs across strata):
where N represents the number of pixels in the study area, represents the standard error of the desired estimation accuracy, indicates the area percentage of the class i, and represents the standard deviation of the stratum i. = [39]. When N is sufficiently large, the equation can be approximated, where denotes the user accuracy. For instance, in the sampling stratum ranked 1, indicating complete inconsistency, the forest accuracy within this stratum is significantly low. The area percentage can be acquired through area statistics. Assuming that the confusing class in this stratum is shrub, with user accuracies of 60%, 70%, and 50% for shrub in three land cover products, the average value of was determined as 60%. is specified as a standard error of 0.01.
The different levels of the spatial consistency analysis results are regarded as distinct sampling strata, and the allocation of sample quantities is based on the area percentage of each stratum determined by the area statistics [38,39]. Moreover, given the intricate nature of land cover types in regions with low spatial consistency, it is essential to appropriately augment the number of sample points while ensuring that the sample size for each class in every level remains at a minimum of 100.
To facilitate the accuracy assessment, we obtained and processed the sample points from reference [23]. These sample points encompass a wide range of types, considering the quantity, richness, and spatial distribution of the samples, including field validation points and manual densification points from Google high-resolution images. However, since our research focuses on forest areas, these sample points are needed to undergo processing and coordination. We enhanced and refined the attribute types by augmenting the original sample data attribute table with two additional attributes: a primary class and a secondary class. The primary class classifies the samples as either forest or non-forest. Moreover, the secondary class expands the forest samples to rubber, oil palm, and other forest types, thereby facilitating the analysis of confused land cover classes. During the expansion of the secondary classes, we meticulously examined all sample data and rectified certain attribute errors. As rubber and oil palm areas are relatively small, we adjusted some rubber and oil palm points located at the edges to the nearest spatial positions with similar types in the clustered distribution of the current samples during the expansion process. Additionally, we randomly added around 100 rubber and oil palm samples. While this presented challenges to meet the minimum requirement of 100 samples for each level, we made sure that each sample class had a total count of at least 100.
We conducted an accuracy assessment using the overall accuracy (OA), user’s accuracy (UA), and producer’s accuracy (PA) [40]. This formed the confusion matrix for each product, enabling the analysis of the accuracy of the forest products. The OA can directly reflect the proportion of correct categorization. It is equal to the sum of correctly categorized pixels divided by the total number of pixels. UA refers to the ratio of the total number of pixels correctly classified into class A to the total number of pixels of the entire image classified into class A by the classifier. PA refers to the ratio of the number of pixels of the whole image correctly classified by the classifier into class A to the total number of true references of class A. We also calculated the commission error and omission error to assess the accuracy of the products. The commission error refers to how many of the classification results are incorrect. The omission error refers to how many true results were missed in the classification results.
3.3. Analysis of Geographical Environmental and Biophysical Influencing Factors
To investigate the factors of inconsistent spatial patterns, we carefully selected the most representative geographical environmental factors, such as the elevation and slope, along with biophysical factors related to land cover, specifically focusing on the distribution of rubber and oil palm [41,42,43,44,45]. Subsequently, we conducted an analysis of the factors behind these spatial inconsistencies. Following the references [41,42], elevation was categorized into six intervals: 0–200 m, 200–500 m, 500–1000 m, 1000–2000 m, 2000–3000 m, and above 3000 m. Moreover, using the digital elevation model (DEM), we derived slope and divided them into the following intervals: 0–5°, 5–15°, 15–25°, 25–35°, 35–45°, and above 45°. We then computed the consistency between different elevation and slope zones. The formulas used to calculate the percentage of each elevation and slope zone are as follows:
In these formulas, and represent the respective percentages of forest area in the jth level of both the elevation zone ith and the corresponding slope zone. and denote the forest area of the jth level in the same elevation zone and slope zone, while and indicate the total forest area within the elevation zone ith and the corresponding slope zone. The variable j ranges from 1 to 6.
We utilized land cover products of higher accuracy to calculate the area and percentage of diverse land cover types within the inconsistent regions. This analysis aimed to analyze the impact of land cover on forest distribution, as described by Formulas (5) and (6). We further analyzed the land cover area and percentage of forest inconsistency across various countries, with a focus on highlighting the variations in Southeast Asia. By superimposing detailed samples within the inconsistent regions, the percentages of accurately classified samples for rubber, oil palm, and other forests were calculated. Furthermore, the elevation and slope values were extracted for these sample points, followed by an analysis of the elevation and slope distributions for these types.
These formulas use to represent the percentage of land cover area for the jth class within the inconsistent region, while represents the percentage of land cover area for the jth class in the ith level. represents the forest area for the jth class, and represents the total land cover area. Similarly, represents the forest area for the jth class in the ith level, and represents the forest area in the ith level. Here, the value of i ranges from 1 to 5.
4. Results
4.1. Area Consistency Comparison
Regarding the comparison of area consistency, we calculated the forest area and area percentage for six products (Figure 3). Substantial differences exist in the areas among the products. The forest area of GFC30_2020 is the smallest, covering 2.49 million square kilometers, which represents 56.32% of the total area. The largest forest area belongs to ESA2020, covering 3.31 million square kilometers, which accounts for 74.86% of the total area. There is an area difference of 820,000 square kilometers between the two. ESRI2020 and FROM-GLC10 have forest areas of 2.98 million square kilometers and 2.85 million square kilometers, respectively, with a relatively minor discrepancy of around 120,000 square kilometers. Except for Generated_Hansen2020, the land cover products generally exhibit higher forest area values compared to the forest thematic products. Discrepancies arise due to variations in resolution and forest definition among the products. Among the products, GFC30_2020, which has the lowest resolution, exhibits the most pronounced differences. Furthermore, the consistency of the products can be influenced by different data sources. For instance, the utilization of optical imagery in GFC30_2020 might result in a lower classification performance in regions of Southeast Asia characterized by cloudiness and rainfall. In conclusion, notable differences in area exist among the various products, particularly for GFC30_2020. Hence, it is vital to analyze the consistency of the products.
By analyzing regional statistics, we obtained the forest area coverage percentages for different countries across six products, as shown in Figure 4. First and foremost, notable disparities exist in the forest area percentages among different countries in Southeast Asia and across different forest products. Malaysia, Thailand, and the Philippines demonstrate the most significant variations in forest area percentages. The difference between the highest and lowest forest area percentages in Malaysia is 30.76%, while other countries exhibit percentage ranges surpassing 20%. In contrast, Laos and Myanmar exhibit relatively smaller discrepancies compared to other countries; nevertheless, their percentage differences still reach approximately 15%.
4.2. Spatial Consistency Comparison
Figure 5 and Figure 6 show the results of the spatial consistency of six forest products. The forest area percentages for consistency levels 6, 5, 4, 3, 2, and 1 are 48.59%, 16.19%, 10.74%, 9.02%, 7.53%, and 7.94%, respectively (see Table 2). The spatial distribution exhibits good consistency due to the substantial percentage of forest areas classified as levels 6 and 5. This is also evidenced by the spatial comprehensive consistency index, which measures 62.62%. Moreover, Figure 5 and Figure 6 reveal concentrated regions of high consistency in forest areas, including northern Myanmar, the western coast of Sumatra in Indonesia, the western and northern portions of Kalimantan, Sulawesi, and West Papua, as well as western Malaysia. These regions are characterized by higher elevations or minimal human activity impact. Conversely, regions exhibiting low consistency in forest areas are more scattered, primarily located in the southeastern coastal areas of Sumatra in Indonesia, Jakarta, the southeastern coastal areas of Kalimantan, and the southern coastal areas of Vietnam. Thus, regions with concentrated forest distribution can be readily identified in remote sensing images and show greater consistency.
4.3. Accuracy Assessment
The accuracy evaluation involved utilizing field survey verification points and manual densification points to acquire sample points. The minimum sample size of 941 was calculated based on the designed sampling scheme. However, with the collection of 1133 field samples, the sample points were expanded, resulting in a total of 6985 forest samples and 7809 non-forest samples, as illustrated in Figure 7.
Table 3 shows the validation results of 6 products generated by the overall accuracy (OA), user’s accuracy (UA), producer’s accuracy (PA), commission error, and omission error. Generally, the forest areas in the six products exhibited high overall accuracy, surpassing 85%. ESRI2020 had the highest overall accuracy at 91.64%, while both ESA2020 and FROM-GLC10 both had overall accuracies, above 89%, and GFC30_2020 had the lowest accuracy at 87.47%. Except for GFC30_2020, the user’s accuracy for the remaining five forest products surpassed 90%. All products, except ESA2020 and Generated_Hansen2020, achieved producer’s accuracies, exceeding 85%. Particularly, the user’s accuracy for forest areas in GFC30_2020 was only 84.5%, resulting in a 15.5% commission error of forest areas as non-forest. Furthermore, the producer’s accuracy for non-forest was 86.97%, accompanied by a 13.03% omission error where non-forest areas were inaccurately extracted. Regarding the ESA2020 and Generated_Hansen2020, the producer’s accuracy for forest areas reached 83.49% and 83.9%, respectively, suggesting an approximate 16% of unidentified forest areas. Additionally, a notable commission error existed for non-forest areas, with roughly 16% of non-forest areas not accurately identified.
Additionally, we conducted a comparison of accuracy across different countries and forest products (Figure 8). The results indicate minimal variation in the overall accuracy across different products and countries. However, notable discrepancies exist in the user’s accuracy and producer’s accuracy among some countries. Thailand and the Philippines demonstrated more significant disparities in the user’s accuracy. FROM-GLC10 showed the highest user’s accuracy in Thailand, reaching 89.96%, whereas GFC30_2020 exhibited the lowest at 72.65%, resulting in an accuracy difference of approximately 17%. Similarly, in the Philippines, ESRI2020 demonstrated the highest user’s accuracy at 90.69%, while FROM-GLC10 had the lowest at 80.18%, resulting in a 10% difference. Notably, there were substantial variations in the producer’s accuracy between Thailand and Cambodia. ESRI2020 attained the highest producer’s accuracy in Thailand, at 84%, whereas ESA2020 exhibited the lowest at 65%, resulting in an accuracy difference of approximately 19%. In Cambodia, ESRI2020 showed the highest producer’s accuracy at 67%, while ESA2020 demonstrated the lowest at 48%, resulting in a 19% difference.
4.4. Factors Influencing Spatial Consistency
To analyze the geographical environmental factors influencing the inconsistency in forest spatial distribution, we utilized DEM data to extract the elevation and slope, and then calculated the percentages of different elevation zones and slope zones with consistency levels (Figure 9 and Figure 10). The forest consistency was divided into six levels, where Level 6 represents complete consistency, Levels 5 to 2 represent partial consistency, and Level 1 represents complete inconsistency. Figure 9 illustrates the percentage of spatial consistency distributions in different elevation intervals. Figure 9a shows six levels, while in Figure 9b, we consolidated the six levels into three levels, where Level 6 in Figure 9a corresponds to Level 3 in Figure 9b. Levels 5 to 2 in Figure 9a were merged into Level 2, and Level 1 remains the same as Level 1 in Figure 9a. The percentage of complete consistency is lower for elevations below 200 m and reaches its lowest for elevations above 3000 m. However, within the elevation range of 200–3000 m, the percentage of complete consistency for forest areas is remarkably high, exceeding 60%. In the plain areas below 200 m, the consistency between products is lower. The spatial pattern of consistency distribution exhibits variation with elevation. Consistency is high within the elevation range of 200–3000 m, whereas the percentage of consistency distribution is low below 200 m and above 3000 m.
Figure 10 reflects the percentage of spatially consistent distributions among different slope intervals, where Figure 10a shows six levels, while Figure 10b shows three levels, following the same merging method as in Figure 9. In Figure 10a, the percentage of complete consistency is highest between slopes 25° and 45°, reaching 70%. It remains substantial, exceeding 50%, when the slope is below 15°. However, it is at its lowest when the slope falls within the range of 15° to 25°. Dividing the slope range into 15°–25° and below 15°, we found that as the slope increases within the 0–15° range, the percentage of consistent areas increases, while the percentages of partially consistent and completely inconsistent areas decrease. Conversely, when the slope exceeds 25°, consistent areas decrease while partially consistent and completely inconsistent areas increase. In the slope range of 15°–25°, consistent areas are at their lowest at 26%, while partially consistent and completely inconsistent areas peak at 14%. Figure 10b consolidates the six levels, reflecting a spatial consistency pattern for these levels with respect to slope variation. Complete consistency is high below 15° and above 25°, while it is lower within the 15°–25° range, with a higher percentage of partially consistent areas.
Utilizing the ESRI 2020 land cover product, we selected alternative land cover types as biophysical factors to calculate the area and percentage of forest that is confused with other types (Figure 11). From the standpoint of land cover, forests are regarded as distinctive ecosystems or vegetation types characterized by unique compositions of flora and fauna [46]. In such instances, accurately distinguishing between forest and shrub poses a challenge. The findings presented in Figure 11a reveal that the classes prone to the greatest confusion with forest, in descending order, are shrub, crops, and built area, whereas the level of confusion with other classes is minimal. Within all regions exhibiting inconsistencies in forest, shrub accounts for 46%, crops for 28%, and built area for 14%. The outcomes shown in Figure 11b demonstrate the variability of land cover types that impact the distribution of forest across different levels of inconsistency. In areas characterized by complete inconsistency, crops exhibit the highest level of confusion with forest, reaching 38%, followed by shrub at 31%. Additionally, the built area demonstrates notable confusion at a percentage of 20%. In partially consistent areas, particularly within the range of Levels 2–5, shrub shows the highest percentage of confusion, surpassing 40%. Moreover, we conducted calculations to determine the percentages of various land cover types that lead to confusion with forest in inconsistent areas across different countries, aiming to illustrate intercountry discrepancies, as depicted in Figure 11c. In Indonesia, Thailand, Vietnam, and the Philippines, the disparities in the percentages between crops and shrub being confused with forest are relatively minor, suggesting that forest is prone to being confused with crops and shrub in these countries. In Laos, Cambodia, and Myanmar, there is a significant likelihood of confusion between forest and shrub, leading to inconsistency. Malaysia exhibits substantial percentages of confusion between forest and crops, shrub, built area, and grassland. Except for Laos, Cambodia, and Myanmar, all countries demonstrate some level of confusion between areas of forest inconsistency and built area.
Considering the extensive rubber and oil palm plantations in Southeast Asia, which have a notable impact on the spatial distribution of forests, we computed the percentages of planted forests and other forests within the areas exhibiting inconsistency, as depicted in Figure 12a. Planted forests and other forests exhibit broad distributions and are present in all areas characterized by inconsistency. Notably, in Level 1, the percentage of planted forest samples is substantially higher than that of other forests, reaching 34.62%. Conversely, in Level 5, the percentage of other forests is significantly higher than that of planted forests. In Level 2, the number of planted forest samples slightly surpasses that of other forests, with percentages of 47.58% and 52.42%, respectively. In Levels 3–5, the percentage of other forests experiences a substantial increase from 52% to 99%, whereas the percentage of planted forests declines from 47% to 8%. While the sample points cannot fully represent the distribution of planted forests and other forests across the entire region, they still enable us to analyze the land cover types responsible for the inconsistencies in these areas. Furthermore, the results presented in Figure 12a indicate that planted forests play a significant role in the inconsistency of forest products.
Additionally, we utilized the sample points to determine the distribution of planted forests in relation to elevation and slope, as depicted in Figure 12b,c. The results reveal that the distribution of planted forests corresponds to the distribution of elevation and slope in the areas of inconsistent forest. In Figure 12b, numbers 11, 12, and 13 represent the distribution of sample points for rubber, oil palm, and other forests across various elevation zones. It is evident that rubber is primarily distributed at elevations below 1000 m, whereas oil palm exhibits a concentration below 600 m, and other forests show a relatively extensive distribution below 3500 m in elevation. Figure 12c illustrates the distribution of rubber, oil palm, and other forests across various slope zones. The findings indicate that rubber is distributed on slopes below 30°, oil palm shows concentration below 25°, and other forests are prevalent across all slope angles.
5. Discussion
5.1. Comparison of Precision with Existing Local Area Studies Results
We assessed the accuracy of six forest mapping products using field verification points and manual densification points. ESRI2020 achieved the highest overall accuracy of 91.64%. However, in the reference [26], it was found that FROM-GLC10 achieved higher accuracy in the consistency of forest mapping products in Myanmar, with an overall accuracy of 84.48%. It is apparent that our research attained higher accuracy, primarily due to the utilization of field verification products and the improved referencing of field verification points during the manual densification of Google’s high-resolution image verification points. To establish the reliability of the findings, we conducted a review of specific verification points. Additionally, we obtained World Imagery high-resolution historical images for 10 June 2020 from World Imagery Wayback (https://www.arcgis.com/home/item.html?id=ca2adf1589524e29a1c754405cde15af, accessed on 31 August 2023) and performed visual comparisons among ESRI2020, ESA2020, and FROM-GLC10, thereby affirming the accuracy of our results. Figure 13 undeniably supports the assertion of ESRI2020’s superior accuracy, thereby enhancing the reliability of our findings. Nonetheless, it is important to note that our selection of a limited number of illustrative points may not fully encapsulate the entire scope of the research, thereby acknowledging potential limitations. To further bolster the reliability and accuracy of the results, it is recommended to augment the number of sample points in the areas exhibiting inconsistency, thereby enhancing accuracy.
5.2. Analysis of Inconsistent Forest Mapping Products in Southeast Asia
Despite the high forest coverage in Southeast Asia, there are still significant discrepancies in the six products. First, forest inconsistencies may stem from varying forest definitions [34]. During the creation of forest mapping products using remote sensing images, producers establish forest definitions based on a range of factors, including research objectives, study regions, and data sources. In the cases of ESA2020 and Generated_Hansen2020, ESA2020 utilizes Sentinel-1 and Sentinel-2 imagery, whereas Generated_Hansen2020 relies on the Landsat series imagery. Differences in data sources can impact forest definitions, consequently impacting forest areas and causing uncertainty. Furthermore, Generated_Hansen2020 is a synthetic dataset based on Hansen2010 and Hansen GFC, introducing uncertainties itself. Thus, when performing consistency analyses with different forest products, standardizing forest criteria becomes imperative to maintain the fundamental consistency of product comparisons. Various data sources and classification algorithms are equally crucial factors influencing consistency. In this study, ESRI2020 employed Sentinel-2 imagery generated through deep learning, whereas JAXA_FNF2020 utilized PALSAR mosaic imagery generated via random forests. The forest extent varies by approximately 280,000 square kilometers between these two datasets. These factors, including forest definitions, data sources, and classification methods, among others, contribute to spatial inconsistencies.
Forest inconsistencies are primarily concentrated on the border regions between forest and non-forest areas, where small and fragmented patches can emerge due to factors like forest logging and planted afforestation [32,47]. Within this research, the areas of inconsistency predominantly occurred in high mountainous regions above 3000 m, low-lying plains areas below 200 m, and areas with slopes ranging from 15 to 25 degrees. The complex and diverse terrain leads to variations in elevation and slope across forest. In regions of high altitude, differences in people’s perception of forest may arise. From an economic standpoint, gentle slopes accommodate the cultivation of various land cover types, resulting in a less organized assortment of planting types and diminished consistency.
Forest is susceptible to confusion with land cover types like crops, shrub, and grass [12,14,16,46]. When extracting forest from remote sensing images, situations inevitably arise where “same spectrum, different objects” and “same object, different spectra” occur. Diverse interpretations of forest will introduce confusion between forest and other land cover types, thereby causing inconsistencies in forest mapping products.
The encroachment of plantations has extended into certain regions of natural forests, causing spatial disparities between plantations and other forest types, thus introducing inconsistencies in forest mapping products. Rubber and oil palm represent the primary plantation types in Southeast Asia. Our results indicate that rubber is distributed below 1000 m in elevation, with a minor extension between 1000 and 1500 m, and on slopes with gradients less than 35°. Oil palm is distributed below 800 m in elevation and on slopes with gradients less than 30°. Recent studies have demonstrated that rubber plantations are gradually expanding into less favorable zones characterized by higher elevations and steeper slopes, which were previously considered less conducive for rubber cultivation [44,48,49]. Additionally, oil palm, which was commonly found at elevations below 500 m and slopes less steep than 25°, is also expanding into higher elevation areas [50], and the area of oil palm cultivation within the range of slopes from 0.5° to 2.5° has significantly increased. This is due to the expansion of rubber and oil palm into areas less favorable for their growth, encroaching upon the growing space of other forests, that spatial inconsistency in forest products has been affected.
5.3. Suggestions for Usage of Forest Mapping Products in Southeast Asia
The overall accuracy of the ESA2020, FROM-GLC10, Generated_Hansen2020, GFC30_2020, and JAXA FNF2020 for forest areas in Southeast Asia exceeded 85%. However, ESRI2020 achieved the highest overall accuracy, reaching 91.64%. Nevertheless, variations persist in specific local areas. Therefore, we have the following recommendations: (1) For forest areas located in hilly or mountainous terrain, or characterized by gentle or steep slopes, we recommend utilizing the ESRI2020 forest dataset. In such areas, the forest exhibits relatively homogeneous internal patterns and can be effectively differentiated from other land cover classes. (2) In cases where the study area borders between forest and non-forest regions or includes a substantial presence of artificial forests, refining the forest type classification from these six datasets is necessary to mitigate errors resulting from inconsistent forest areas. (3) Regarding protected areas (PA), the ESRI2020 dataset attains the highest accuracy, indicating superior precision. This outcome can be attributed to the utilization of deep learning, scalable cloud-based computing, and a large-scale labeled sample dataset [14]. These findings align with those presented in the study [23]. Consequently, we recommend considering the inclusion of sample points during dataset production to enhance classification accuracy. (4) In terms of urban areas (UA), the accuracy of forest classification exceeds 90%. ESA2020, FROM-GLC10, ESRI2020, Generated_Hansen2020, ESA2020, and FROM-GLC10 offer higher levels of detail compared to ESRI2020. Considering points (1) and (2), we recommend users integrate and employ these four forest products, with particular attention given to spatially inconsistent areas.
5.4. Recommendations for Future Large-Scale Forest Mapping
When undertaking research on large-scale forest mapping, it is imperative to take regional characteristics into account and establish a precise forest definition [46]. In countries such as Malaysia, Indonesia, Thailand, and others, where significant areas are dominated by oil palm plantations, the influence of these plantations on forest extraction must be considered.
Through the analysis of six forest mapping products, we determined that the process of large-scale forest mapping is affected by the combined impact of image resolution and classification methods. Presently, forest mapping commonly employs optical imagery data and radar data with resolutions ranging from 10 to 30 m, and classification tasks are frequently carried out through machine learning techniques. Notwithstanding the similarities in data and methods, certain limitations persist. Studies have revealed that forest thematic products with a resolution of 30 m exhibit slightly lower overall accuracy compared to those with a resolution of 10 m. Elevating the spatial resolution of imagery can enhance pixel purity, diminish the percentage of mixed pixels [51], and thereby improve the accuracy to a certain extent. Despite using the same Sentinel-2 data with enhanced resolution, discrepancies in accuracy persist. The ESRI2020 product exhibited the highest overall accuracy, followed by ESA2020 and FROM-GLC10, which possessed slightly lower accuracies. This disparity can be attributed to variances in the classification methods. ESRI2020 employs deep learning techniques and incorporates a substantial number of manually labeled samples during the dataset creation process [14], leading to enhanced accuracy. Therefore, we suggest that producers enhance the spatial image resolution and expand the sample size to generate highly accurate forest cover maps encompassing extensive regions in the future.
In the production of remote sensing mapping products, the synergistic use of multi-source data can enhance the accuracy of remote sensing classification and feature recognition [52,53]. The process of producing forest mapping products benefits from the integration of multi-source data, enabling the capture of additional features and facilitating large-scale forest mapping. For example, the integration of optical and radar data enables the utilization of spectral and textural characteristics, facilitating the extraction of forest structure information and enhancing forest mapping [54,55]. Moreover, the inclusion of time-series data, such as NDVI and EVI, enables the capturing of vegetation phenological traits, thereby further improving forest identification accuracy [56]. In a study [57], researchers introduced the notion of a geoscientific knowledge graph to tackle the challenges associated with comprehensive analysis of remote sensing big data. This concept strives to advance the accuracy of geoscientific knowledge within the remote sensing big data era, enhance the interpretability and practicality of remote sensing data, and deepen the comprehension of geoscientific principles, and it holds significant potential.
6. Conclusions
We conducted a comparative analysis and comprehensive evaluation of six extensively utilized forest mapping products in Southeast Asia. Field validation points and manual densification points were used to analyze the consistency and assess the accuracy of each product. We compared the variations in area and spatial distribution among these products and analyzed the error factors that affect the spatial consistency of forest, such as terrain and land cover classes that are prone to confusion. The primary conclusions are as follows:
- (1)
- The ESRI2020 forest product achieved the highest overall accuracy in Southeast Asia, followed by ESA2020, FROM-GLC10, Generated_Hansen2020, and finally, JAXA FNF2020 and GFC30_2020.
- (2)
- Among the six forest mapping products, there is a notable spatial consistency for elevations ranging from 200 to 3000 m, with high consistency observed for slopes below 15° or above 25°. Forest is predominantly characterized by natural attributes and demonstrates a relatively even distribution across elevations ranging from 200 to 3000 m. Below 200 m, forest experiences rapid changes and lower consistency due to human activities, such as forest exploitation and logging. Above 3000 m, discrepancies in people’s perception of forest may lead to inconsistency. Forest demonstrates high consistency for slopes below 15° or above 25°, but lower consistency within the range of 15–25°.
- (3)
- Among the six products, forest is susceptible to confusion with shrub, cropland, and built areas. This is primarily due to the significant spectral similarity between forest and shrub, resulting in confusion. The land cover types that contribute to forest inconsistency differ among different countries. The research also utilized samples to analyze the percentage of planted forest samples, including rubber and oil palm, among other forest samples within areas of inconsistent forest, highlighting the significant impact of planted forests on the distribution of forest consistency.
Therefore, comparing multiple products can assist users in selecting suitable products for different regions during forest mapping in Southeast Asia, which is of great value. When mapping different regions, it is necessary to consider the characteristics of forest in that particular area. Additionally, the utilization of high spatial resolution imagery, radar imagery, and appropriate classification methods for forest monitoring should be considered.
Author Contributions
Conceptualization, X.Y. and Z.W.; data curation, B.L. and Y.D.; formal analysis, B.L.; funding acquisition, X.Y.; investigation, X.Y., Z.W., B.L., Y.D., J.Z. and D.M.; methodology, X.Y., Z.W. and B.L.; supervision, B.L.; validation, Y.D. and B.L.; visualization, B.L.; writing—original draft, B.L.; writing—review and editing, B.L., X.Y. and Z.W. All authors have read and agreed to the published version of the manuscript.
Funding
This research was funded by the National Key R&D Program of China (Grant No. 2021YFB3900501).
Acknowledgments
We thank the anonymous reviewers for improving the quality of the paper. We would also like to thank the other project team members who provided help: Yueming Liu, Xiaoliang Liu, Ku Gao, Guo Yu, QingyangZhang, Junmei Kang, and Jun Wang.
Conflicts of Interest
The authors declare that they have no conflict of interest. The authors also declare that this paper has not been published previously, that it is not under consideration for publication elsewhere, and that its publication has been approved by all of the authors and has been tacitly or explicitly approved by the responsible authorities in the area where the work was carried out.
References
- Estoque, R.C.; Dasgupta, R.; Winkler, K.; Avitabile, V.; Johnson, B.A.; Myint, S.W.; Gao, Y.; Ooba, M.; Murayama, Y.; Lasco, R.D. Spatiotemporal pattern of global forest change over the past 60 years and the forest transition theory. Environ. Res. Lett. 2022, 17, 084022. [Google Scholar] [CrossRef]
- Oldekop, J.A.; Rasmussen, L.V.; Agrawal, A.; Bebbington, A.J.; Meyfroidt, P.; Bengston, D.N.; Blackman, A.; Brooks, S.; Davidson-Hunt, I.; Davies, P.; et al. Forest-linked livelihoods in a globalized world. Nat. Plants 2020, 6, 1400–1407. [Google Scholar] [CrossRef] [PubMed]
- Sudmeier-Rieux, K.; Arce-Mojica, T.; Boehmer, H.J.; Doswald, N.; Emerton, L.; Friess, D.A.; Galvin, S.; Hagenlocher, M.; James, H.; Laban, P.; et al. Scientific evidence for ecosystem-based disaster risk reduction. Nat. Sustain. 2021, 4, 803–810. [Google Scholar] [CrossRef]
- Hansen, A.J.; Noble, B.P.; Veneros, J.; East, A.; Goetz, S.J.; Supples, C.; Watson, J.E.M.; Jantz, P.A.; Pillay, R.; Jetz, W.; et al. Toward monitoring forest ecosystem integrity within the post-2020 Global Biodiversity Framework. Conserv. Lett. 2021, 14, e12822. [Google Scholar] [CrossRef]
- Grassi, G.; House, J.; Dentener, F.; Federici, S.; den Elzen, M.; Penman, J. The key role of forests in meeting climate targets requires science for credible mitigation. Nat. Clim. Chang. 2017, 7, 220–226. [Google Scholar] [CrossRef]
- Estoque, R.C.; Ooba, M.; Avitabile, V.; Hijioka, Y.; DasGupta, R.; Togawa, T.; Murayama, Y. The future of Southeast Asia’s forests. Nat. Commun. 2019, 10, 1829. [Google Scholar] [CrossRef] [PubMed]
- Sodhi, N.S.; Posa, M.R.C.; Lee, T.M.; Bickford, D.; Koh, L.P.; Brook, B.W. The state and conservation of Southeast Asian biodiversity. Biodivers. Conserv. 2010, 19, 317–328. [Google Scholar] [CrossRef]
- Stibig, H.J.; Achard, F.; Carboni, S.; Raši, R.; Miettinen, J. Change in tropical forest cover of Southeast Asia from 1990 to 2010. Biogeosciences 2014, 11, 247–258. [Google Scholar] [CrossRef]
- FAO. Global Forest Resources Assessment 2020; Main Report; Food and Agriculture Organization of the United Nations: Rome, Italy, 2020. [Google Scholar]
- FAO. Southeast Asian Forests and Forestry to 2020: Subregional Report of the Second Asia-Pacific Forestry Sector Outlook Study; Asia-Pacific Forestry Commission; Food and Agriculture Organization of the United Nations: Bangkok, Thailand, 2011. [Google Scholar]
- Keenan, R.J.; Reams, G.A.; Achard, F.; de Freitas, J.V.; Grainger, A.; Lindquist, E. Dynamics of global forest area: Results from the FAO Global Forest Resources Assessment 2015. For. Ecol. Manag. 2015, 352, 9–20. [Google Scholar] [CrossRef]
- Gong, P.; Liu, H.; Zhang, M.; Li, C.; Wang, J.; Huang, H.; Clinton, N.; Ji, L.; Li, W.; Bai, Y.; et al. Stable classification with limited sample: Transferring a 30-m resolution sample set collected in 2015 to mapping 10-m resolution global land cover in 2017. Sci. Bull. 2019, 64, 370–373. [Google Scholar] [CrossRef] [PubMed]
- Zanaga, D.; Van De Kerchove, R.; De Keersmaecker, W.; Souverijns, N.; Brockmann, C.; Quast, R.; Wevers, J.; Grosu, A.; Paccini, A.; Vergnaud, S.; et al. ESA2020 WorldCover 10 m 2020 v100. 2021. Available online: https://zenodo.org/record/5571936 (accessed on 14 September 2023).
- Karra, K.; Kontgis, C.; Statman-Weil, Z.; Mazzariello, J.C.; Mathis, M.; Brumby, S.P. Global land use/land cover with Sentinel 2 and deep learning. In Proceedings of the 2021 IEEE International Geoscience and Remote Sensing Symposium IGARSS, Brussels, Belgium, 11–16 July 2021; pp. 4704–4707. [Google Scholar]
- Zhang, X.; He, G.; Long, T. Global 30-m Spatial Distribution of Forest Cover in 2020 (GFC30_2020); International Research Center of Big Data for Sustainable Development Goals (CBAS): Beijing, China, 2022. [Google Scholar]
- Hansen, M.C.; Potapov, P.; Moore, R.; Hancher, M.; Turubanova, S.; Tyukavina, A.; Thau, D.; Stehman, S.; Goetz, S.; Loveland, T.; et al. High-Resolution Global Maps of 21st-Century Forest Cover Change. Science 2013, 342, 850–853. [Google Scholar] [CrossRef] [PubMed]
- Shimada, M.; Itoh, T.; Motooka, T.; Watanabe, M.; Shiraishi, T.; Thapa, R.; Lucas, R. New global forest/non-forest maps from ALOS PALSAR data (2007–2010). Remote Sens. Environ. 2014, 155, 13–31. [Google Scholar] [CrossRef]
- Liang, J.; Gamarra, J.G.P. The importance of sharing global forest data in a world of crises. Sci. Data 2020, 7, 424. [Google Scholar] [CrossRef] [PubMed]
- Nesha, K.; Herold, M.; De Sy, V.; Duchelle, A.E.; Martius, C.; Branthomme, A.; Garzuglia, M.; Jonsson, O.; Pekkarinen, A. An assessment of data sources, data quality and changes in national forest monitoring capacities in the Global Forest Resources Assessment 2005–2020. Environ. Res. Lett. 2021, 16, 054029. [Google Scholar] [CrossRef]
- Estoque, R.C.; Johnson, B.A.; Dasgupta, R.; Gao, Y.; Matsuura, T.; Toma, T.; Hirata, Y.; Lasco, R.D. Rethinking Forest monitoring for more meaningful global forest landscape change assessments. J. Environ. Manag. 2022, 317, 115478. [Google Scholar] [CrossRef]
- Kang, J.; Wang, Z.; Sui, L.; Yang, X.; Ma, Y.; Wang, J. Consistency Analysis of Remote Sensing Land Cover Products in the Tropical Rainforest Climate Region: A Case Study of Indonesia. Remote Sens. 2020, 12, 1410. [Google Scholar] [CrossRef]
- Kang, J.; Sui, L.; Yang, X.; Wang, Z.; Huang, C.; Wang, J. Spatial Pattern Consistency among Different Remote-Sensing Land Cover Datasets: A Case Study in Northern Laos. ISPRS Int. J. Geo-Inf. 2019, 8, 201. [Google Scholar] [CrossRef]
- Ding, Y.; Yang, X.; Wang, Z.; Fu, D.; Li, H.; Meng, D.; Zeng, X.; Zhang, J. A Field-Data-Aided Comparison of Three 10 m Land Cover Products in Southeast Asia. Remote Sens. 2022, 14, 5053. [Google Scholar] [CrossRef]
- Gao, Y.; Liu, L.; Zhang, X.; Chen, X.; Mi, J.; Xie, S. Consistency Analysis and Accuracy Assessment of Three Global 30-m Land-Cover Products over the European Union using the LUCAS Dataset. Remote Sens. 2020, 12, 3479. [Google Scholar] [CrossRef]
- Arjasakusuma, S.; Pribadi, U.; Aria Seta, G. Accuracy and Spatial Pattern Assessment of Forest Cover Change Datasets in Central Kalimantan. Indones. J. Geogr. 2018, 50, 222. [Google Scholar] [CrossRef]
- Xing, H.; Niu, J.; Liu, C.; Chen, B.; Yang, S.; Hou, D.; Zhu, L.; Hao, W.; Li, C. Consistency Analysis and Accuracy Assessment of Eight Global Forest Datasets over Myanmar. Appl. Sci. 2021, 11, 11348. [Google Scholar] [CrossRef]
- Li, Y. Analysis of Multi-Source Forest Cover Products and Research on Forest Information Extraction; Wuhan University: Wuhan, China, 2019. [Google Scholar]
- Meijaard, E.; Brooks, T.M.; Carlson, K.M.; Slade, E.M.; Garcia-Ulloa, J.; Gaveau, D.L.A.; Lee, J.S.H.; Santika, T.; Juffe-Bignoli, D.; Struebig, M.J.; et al. The environmental impacts of palm oil in context. Nat. Plants 2020, 6, 1418–1426. [Google Scholar] [CrossRef] [PubMed]
- Kenney-Lazar, M.; Ishikawa, N. Mega-Plantations in Southeast Asia: Landscapes of Displacement. Environ. Soc. 2019, 10, 63–82. [Google Scholar] [CrossRef]
- Bos, A.B.; De Sy, V.; Duchelle, A.E.; Herold, M.; Martius, C.; Tsendbazar, N.-E. Global data and tools for local forest cover loss and REDD+ performance assessment: Accuracy, uncertainty, complementarity and impact. Int. J. Appl. Earth Obs. Geoinf. 2019, 80, 295–311. [Google Scholar] [CrossRef]
- Fagan, M.E.; Kim, D.-H.; Settle, W.; Ferry, L.; Drew, J.; Carlson, H.; Slaughter, J.; Schaferbien, J.; Tyukavina, A.; Harris, N.L.; et al. The expansion of tree plantations across tropical biomes. Nat. Sustain. 2022, 5, 681–688. [Google Scholar] [CrossRef]
- Ma, J.; Li, J.; Wu, W.; Liu, J. Global Forest fragmentation change from 2000 to 2020. Nat. Commun. 2023, 14, 3752. [Google Scholar] [CrossRef] [PubMed]
- Li, Y.; Liu, C.; Zhang, J.; Zhang, P.; Xue, Y. Monitoring Spatial and Temporal Patterns of Rubber Plantation Dynamics Using Time-Series Landsat Images and Google Earth Engine. IEEE J. Sel. Top. Appl. Earth Obs. Remote Sens. 2021, 14, 9450–9461. [Google Scholar] [CrossRef]
- Qin, Y.; Dong, J.; Xiao, X. Analysis of Differences and Uncertainties in Forest Cover Products in China. Biodiversity 2015, 23, 5. [Google Scholar]
- Wang, H.; Cai, L.; Wen, X.; Fan, D.; Wang, Y. Land cover change and multiple remotely sensed datasets consistency in China. Ecosyst. Health Sustain. 2022, 8, 2040385. [Google Scholar] [CrossRef]
- Fang, X.; Zhao, W.; Zhang, C.; Zhang, D.; Wei, X.; Qiu, W.; Ye, Y. Methodology for credibility assessment of historical global LUCC datasets. Sci. China Earth Sci. 2020, 63, 1013–1025. [Google Scholar] [CrossRef]
- Huang, C.; Goward, S.N.; Masek, J.G.; Thomas, N.; Zhu, Z.; Vogelmann, J.E. An automated approach for reconstructing recent forest disturbance history using dense Landsat time series stacks. Remote Sens. Environ. 2010, 114, 183–198. [Google Scholar] [CrossRef]
- Olofsson, P.; Foody, G.M.; Herold, M.; Stehman, S.V.; Woodcock, C.E.; Wulder, M.A. Good practices for estimating area and assessing accuracy of land change. Remote Sens. Environ. 2014, 148, 42–57. [Google Scholar] [CrossRef]
- Stehman, S.V.J.R.S.L. Impact of sample size allocation when using stratified random sampling to estimate accuracy and area of land-cover change. Remote Sens. Lett. 2012, 3, 111–120. [Google Scholar] [CrossRef]
- Stehman, S.V. Estimating area from an accuracy assessment error matrix. Remote Sens. Environ. 2013, 132, 202–211. [Google Scholar] [CrossRef]
- Yang, Z.; Dong, J.; Liu, J.; Zhai, J.; Kuang, W.; Zhao, G.; Shen, W.; Zhou, Y.; Qin, Y.; Xiao, X. Accuracy Assessment and Inter-Comparison of Eight Medium Resolution Forest Products on the Loess Plateau, China. ISPRS Int. J. Geo-Inf. 2017, 6, 152. [Google Scholar] [CrossRef]
- Blasco, F.; Whitmore, T.C.; Gers, C. A framework for the worldwide comparison of tropical woody vegetation types. Biol. Conserv. 2000, 95, 175–189. [Google Scholar] [CrossRef]
- Li, W.; Fu, D.; Su, F.; Xiao, Y. Spatial–Temporal Evolution and Analysis of the Driving Force of Oil Palm Patterns in Malaysia from 2000 to 2018. ISPRS Int. J. Geo-Inf. 2020, 9, 280. [Google Scholar] [CrossRef]
- Liu, X.; Feng, Z.; Jiang, L.; Li, P.; Liao, C.; Yang, Y.; You, Z. Rubber plantation and its relationship with topographical factors in the border region of China, Laos and Myanmar. J. Geogr. Sci. 2013, 23, 1019–1040. [Google Scholar] [CrossRef]
- Selvalakshmi, S.; Kalarikkal, R.K.; Yang, X. Predicting the habitat distribution of rubber plantations with topography, soil, land use, and climatic factors. Environ. Monit. Assess. 2020, 192, 598. [Google Scholar] [CrossRef] [PubMed]
- Chazdon, R.L.; Brancalion, P.H.S.; Laestadius, L.; Bennett-Curry, A.; Buckingham, K.; Kumar, C.; Moll-Rocek, J.; Vieira, I.C.G.; Wilson, S.J. When is a forest a forest? Forest concepts and definitions in the era of forest and landscape restoration. Ambio 2016, 45, 538–550. [Google Scholar] [CrossRef]
- Chen, H.; Yi, Z.-F.; Schmidt-Vogt, D.; Ahrends, A.; Beckschäfer, P.; Kleinn, C.; Ranjitkar, S.; Xu, J.; Schmidt-Vogt, Y.; Ahrends, D. Pushing the Limits: The Pattern and Dynamics of Rubber Monoculture Expansion in Xishuangbanna, SW China. PLoS ONE 2016, 11, e0150062. [Google Scholar] [CrossRef] [PubMed]
- Liu, X. Research on Land Use: Land Cover Change in the Border Area between China, Laos and Myanmar; University of Chinese Academy of Sciences: Beijing, China, 2013. [Google Scholar]
- Liao, C.; Feng, Z.; Li, P. Land use change information mining and country comparison in the border area between China, Laos, Myanmar, and Thailand. J. Nat. Resour. 2015, 30, 1785–1797. [Google Scholar]
- Cheng, Y. Analysis of Dynamic Changes in Oil Palm Planting in Malaysia; Henan University: Kaifeng, China, 2017. [Google Scholar]
- Cui, L.; Du, H.; Zhou, G.; Li, X.; Mao, F.; Xu, X.; Fan, W.; Li, Y.; Zhu, D.; Liu, T.; et al. Combination of decision tree and mixed pixel decomposition for extracting bamboo forest information in China. Yaogan Xuebao/J. Remote Sens. 2019, 23, 166–176. [Google Scholar] [CrossRef]
- Wang, Z.; Zhang, J.; Yang, X.; Huang, C.; Su, F.; Liu, X.; Liu, Y.; Zhang, Y. Global mapping of the landside clustering of aquaculture ponds from dense time-series 10 m Sentinel-2 images on Google Earth Engine. Int. J. Appl. Earth Obs. Geoinf. 2022, 115, 103100. [Google Scholar] [CrossRef]
- Kang, J.; Yang, X.; Wang, Z.; Huang, C.; Wang, J. Collaborative Extraction of Paddy Planting Areas with Multi-Source Information Based on Google Earth Engine: A Case Study of Cambodia. Remote Sens. 2022, 14, 1823. [Google Scholar] [CrossRef]
- Reiche, J.; Hamunyela, E.; Verbesselt, J.; Hoekman, D.; Herold, M. Improving near-real time deforestation monitoring in tropical dry forests by combining dense Sentinel-1 time series with Landsat and ALOS-2 PALSAR-2. Remote Sens. Environ. 2018, 204, 147–161. [Google Scholar] [CrossRef]
- Reddy, C.S.; Pasha, S.V.; Satish, K.V.; Unnikrishnan, A.; Chavan, S.B.; Jha, C.S.; Diwakar, P.G.; Dadhwal, V.K. Quantifying and predicting multi-decadal forest cover changes in Myanmar: A biodiversity hotspot under threat. Biodivers. Conserv. 2019, 28, 1129–1149. [Google Scholar] [CrossRef]
- Lossou, E.; Owusu-Prempeh, N.; Agyemang, G. Monitoring Land Cover changes in the tropical high forests using multi-temporal remote sensing and spatial analysis techniques. Remote Sens. Appl. Soc. Environ. 2019, 16, 100264. [Google Scholar] [CrossRef]
- Wang, Z.; Yang, X.; Zhou, C. The concept of geoscience knowledge graph for remote sensing big data. J. Earth Inf. Sci. 2021, 23, 13. [Google Scholar]
Figure 1.
Location and topography of Southeast Asia.

Figure 2.
Flowchart of forest consistency, accuracy assessment, and influencing factor analysis.

Figure 3.
Comparison of forest area and area percentage distribution in 6 products.

Figure 4.
Forest area percentage comparison of different countries in 6 products.

Figure 5.
The spatial consistency distribution maps of the six products. Values range from 6 to 1, where 6 represents completely consistent areas, 1 represents completely inconsistent areas, and 2–5 represent partially consistent areas. Areas with 0 indicate non-forest. The areas in the red box are the enlarged display regions.

Figure 6.
The spatial consistency distribution of 6 products is divided into three levels: completely consistent areas (corresponding to value 6), partially consistent areas (corresponding to values 2–5), and completely inconsistent areas (corresponding to value 1).
Figure 6.
The spatial consistency distribution of 6 products is divided into three levels: completely consistent areas (corresponding to value 6), partially consistent areas (corresponding to values 2–5), and completely inconsistent areas (corresponding to value 1).

Figure 7.
Forest and non-forest sample points in Southeast Asia.

Figure 8.
OA, UA, and PA of different products in different countries. (a) Overall accuracy (OA), (b) user’s accuracy (UA), (c) producer’s accuracy (PA).
Figure 8.
OA, UA, and PA of different products in different countries. (a) Overall accuracy (OA), (b) user’s accuracy (UA), (c) producer’s accuracy (PA).

Figure 9.
The spatial consistency distribution percentage of different elevation intervals. (a) Six-level consistency percentages, (b) three-level consistency percentages, from high to low.
Figure 9.
The spatial consistency distribution percentage of different elevation intervals. (a) Six-level consistency percentages, (b) three-level consistency percentages, from high to low.

Figure 10.
The spatial consistency distribution percentage of different slope intervals. (a) Six-level consistency percentages; (b) three-level consistency percentages, from high to low.
Figure 10.
The spatial consistency distribution percentage of different slope intervals. (a) Six-level consistency percentages; (b) three-level consistency percentages, from high to low.

Figure 11.
Percentage of forest areas with inconsistency and their confusion with other land cover types in ESRI2020. (a) Forest areas with inconsistency and confused land cover classes. (b) Forest areas with different consistency levels and confused land cover, (c) Forest areas with easily confused land cover in different countries.

Figure 12.
The impact of rubber, oil palm, and other forests on inconsistent areas. (a) Percentage of sample distribution of planted forests and other forests in inconsistent areas. (b) Elevation distribution of sample points in rubber, oil palm, and other forests. (c) Slope distribution of sample points in rubber, oil palm, and other forests.

Figure 13.
Comparison of forest in partial areas of ESRI2020, ESA2020, and FROM-GLC10. The second to fourth columns display the forest cover areas for three products (ESRI2020, ESA2020, and FROM-GLC10) corresponding to the high-resolution imagery in the first column.
Figure 13.
Comparison of forest in partial areas of ESRI2020, ESA2020, and FROM-GLC10. The second to fourth columns display the forest cover areas for three products (ESRI2020, ESA2020, and FROM-GLC10) corresponding to the high-resolution imagery in the first column.


Table 1.
Comparison of different forest products.
| Products | Forest Definition | Special Provisions in the Definition | Spatial Resolution | Data Source | Algorithm | Product Accuracy | Sample Size and Sample Acquisition Method |
|---|---|---|---|---|---|---|---|
| FROM-GLC10 | Areas with trees higher than 3 m and tree cover of more than 15% | —— | 10 m | Sentinel-2 satellite data | Supervised classification | Overall accuracy is 72.76% | Validation set consists of approximately 140,000 samples from different seasons, covering 38,000 sample points |
| ESRI2020 | Dense vegetation clustering of trees taller than 15 m, typically with a closed or dense canopy | Including wooded vegetation, clusters of dense tall vegetations within savannas, plantations, swamp, or mangroves | 10 m | Sentinel-2 satellite data | Deep learning | Overall accuracy is 85% | Over 5 billion manually annotated Sentinel-2 pixels in over 20,000 sampling points worldwide |
| ESA2020 | Tree cover is more than 10% | ① Including land cover classes below the canopy, like shrubs and built-up areas; ② including plantations like oil palm and olive trees and tree covered areas with seasonally or permanently flooded with freshwater except for mangroves | 10 m | Sentinel-1 and Sentinel-2 satellite data | Supervised classification | Overall accuracy is 74.4% | Over 200,000 reference points |
| Hansen2010 | All vegetation taller than 5 m in height | Including both natural forests and planted forests that meet the criteria | 30 m | Landsat7 reflectance characteristic indicators during the growing season | Supervised classification | Stratified random sampling based on random forest | |
| JAXA FNF2020 | Land spanning more than 0.5 hectares with trees higher than 5 m and a canopy cover of more than 10% | ① Including forested areas that have not yet reached but are expected to reach the criteria; ② including forest roads, firebreaks, and other small open areas; ③ including rubberwood, cork oak, and Christmas tree plantations; ④ excluding plantations in agricultural production systems, such as oil palm plantations, fruit tree plantations, and olive grove orchards | 25 m | PALSAR mosaic dataset | Supervised classification | By forest, non-forest, and water classes, the overall accuracy is higher than 86% | Used ground photographs and high-resolution optical satellite images |
| GFC30_2020 | Land spanning more than 0.5 hectares with trees higher than 5 m and a canopy cover of more than 10% | ① Including areas that have not yet reached but are expected to reach the criteria; ② excluding forest primarily used for agricultural and urban purposes | 30 m | Landsat series satellite images of the global forest vegetation growth season in 2020, China’s GF-1, GF-6 and other satellite imagery | Machine learning algorithms | Overall accuracy is higher than 90.94% | Using high-resolution images such as Google Earth/GF for manual inspection and verification, referencing relevant data products from the United States and Japan, and combining some field survey data, a total of 39,900 verification points were obtained |
Table 2.
Area and percentage of different spatial consistency levels.
| Spatial Consistency Level | 1 | 2 | 3 | 4 | 5 | 6 |
|---|---|---|---|---|---|---|
| Forest area (104 km2) | 29.54 | 28.04 | 33.57 | 39.97 | 60.27 | 180.87 |
| Forest area percentage (%) | 7.94 | 7.53 | 9.02 | 10.74 | 16.19 | 48.59 |
Table 3.
Validation results of 6 products.
| Accuracy (%) | ESA2020 | ESRI2020 | FROM-GLC10 | GFC30_2020 | Generated_Hansen2020 | JAXA FNF2020 | |
|---|---|---|---|---|---|---|---|
| UA | Forest | 95.50 | 93.00 | 93.01 | 84.50 | 92.91 | 89.04 |
| Non-forest | 83.57 | 90.46 | 87.06 | 90.06 | 84.49 | 88.31 | |
| PA | Forest | 83.49 | 89.45 | 86.21 | 88.09 | 83.90 | 86.89 |
| Non-forest | 95.52 | 93.69 | 93.47 | 86.97 | 93.20 | 90.26 | |
| Commission error | Forest | 4.50 | 7.00 | 6.99 | 15.50 | 7.09 | 10.96 |
| Non-forest | 16.43 | 9.54 | 12.94 | 9.94 | 15.51 | 11.69 | |
| Omission error | Forest | 16.51 | 10.55 | 13.79 | 11.91 | 16.10 | 13.11 |
| Non-forest | 4.48 | 6.31 | 6.53 | 13.03 | 6.80 | 9.74 | |
| OA | 89.12 | 91.64 | 89.83 | 87.47 | 88.41 | 88.65 | |
Disclaimer/Publisher’s Note: The statements, opinions and data contained in all publications are solely those of the individual author(s) and contributor(s) and not of MDPI and/or the editor(s). MDPI and/or the editor(s) disclaim responsibility for any injury to people or property resulting from any ideas, methods, instructions or products referred to in the content. |
© 2023 by the authors. Licensee MDPI, Basel, Switzerland. This article is an open access article distributed under the terms and conditions of the Creative Commons Attribution (CC BY) license (https://creativecommons.org/licenses/by/4.0/).
Share and Cite
MDPI and ACS Style
Liu, B.; Yang, X.; Wang, Z.; Ding, Y.; Zhang, J.; Meng, D. A Comparison of Six Forest Mapping Products in Southeast Asia, Aided by Field Validation Data. Remote Sens. 2023, 15, 4584. https://doi.org/10.3390/rs15184584
AMA Style
Liu B, Yang X, Wang Z, Ding Y, Zhang J, Meng D. A Comparison of Six Forest Mapping Products in Southeast Asia, Aided by Field Validation Data. Remote Sensing. 2023; 15(18):4584. https://doi.org/10.3390/rs15184584
Chicago/Turabian StyleLiu, Bin, Xiaomei Yang, Zhihua Wang, Yaxin Ding, Junyao Zhang, and Dan Meng. 2023. "A Comparison of Six Forest Mapping Products in Southeast Asia, Aided by Field Validation Data" Remote Sensing 15, no. 18: 4584. https://doi.org/10.3390/rs15184584
Note that from the first issue of 2016, this journal uses article numbers instead of page numbers. See further details here.