

Deep Learning for Earthquake Disaster Assessment: Objects, Data, Models, Stages, Challenges, and Opportunities


Department of Civil Engineering, College of Engineering, Ocean University of China, Qingdao 266100, China
*
Author to whom correspondence should be addressed.
Remote Sens. 2023, 15(16), 4098; https://doi.org/10.3390/rs15164098
Submission received: 13 July 2023
/
Revised: 14 August 2023
/
Accepted: 16 August 2023
/
Published: 21 August 2023
(This article belongs to the Special Issue Artificial Intelligence and Remote Sensing for Natural Hazard and Disaster Management)
Abstract
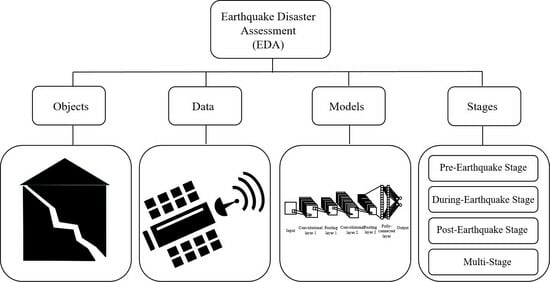
:Earthquake Disaster Assessment (EDA) plays a critical role in earthquake disaster prevention, evacuation, and rescue efforts. Deep learning (DL), which boasts advantages in image processing, signal recognition, and object detection, has facilitated scientific research in EDA. This paper analyses 204 articles through a systematic literature review to investigate the status quo, development, and challenges of DL for EDA. The paper first examines the distribution characteristics and trends of the two categories of EDA assessment objects, including earthquakes and secondary disasters as disaster objects, buildings, infrastructure, and areas as physical objects. Next, this study analyses the application distribution, advantages, and disadvantages of the three types of data (remote sensing data, seismic data, and social media data) mainly involved in these studies. Furthermore, the review identifies the characteristics and application of six commonly used DL models in EDA, including convolutional neural network (CNN), multi-layer perceptron (MLP), recurrent neural network (RNN), generative adversarial network (GAN), transfer learning (TL), and hybrid models. The paper also systematically details the application of DL for EDA at different times (i.e., pre-earthquake stage, during-earthquake stage, post-earthquake stage, and multi-stage). We find that the most extensive research in this field involves using CNNs for image classification to detect and assess building damage resulting from earthquakes. Finally, the paper discusses challenges related to training data and DL models, and identifies opportunities in new data sources, multimodal DL, and new concepts. This review provides valuable references for scholars and practitioners in related fields.
1. Introduction
The 2023 Turkey-Syria earthquake has captured significant global attention. Earthquakes are among the most catastrophic and unpredictable natural disasters that severely threaten human life. According to the significant earthquake database maintained by the National Centers for Environmental Information of the National Oceanic and Atmospheric Administration, earthquakes caused approximately 570,000 fatalities and 1 million injuries worldwide from 2000 to 2018 [1]. The dominant functions of EDA lie in predicting the probability of earthquakes to implement effective countermeasures, provide early warning systems, evaluate damage, and assess facility safety for evacuation and emergency arrangements. EDA is critical in reducing casualties and minimizing economic losses.
DL, a significant branch of machine learning (ML), has become an essential research topic in artificial intelligence (AI) with the advent of big data. The concept of DL originated from the study of artificial neural networks (ANNs) and consists of multi-layer ANNs covering the supervised and unsupervised learning parts of the ML [2]. Its purpose is to find specific rules from large sets of sample data and use these rules to analyse target samples. Traditional ML models have limitations in their capability and capacity to process the increasing quantity and variety of data and quality of information requirements. At the same time, DL can automatically extract advanced features from big data with higher effectiveness and efficiency. DL is superior to traditional ML in data processing [3], especially in classification [4], recognition [5], segmentation [6], and detection [7] due to its ability to handle more complex data.
DL has emerged as a powerful tool for analysing high-dimensional data and is widely used in various scientific fields, including earthquake engineering, civil engineering, and natural language processing [8,9]. Prevailing discourses show that DL can be applied in all phases of EDA, ranging from earthquake prediction [10,11] and damage assessment [12,13] to disaster information extraction [14] and risk analysis [15]. Additionally, DL can also be used to assess secondary disasters caused by earthquakes, such as tsunamis [16] and landslides [17,18]. DL’s ability to process large amounts of data and learn complex patterns from them provides significant advantages in various EDA applications, which can lead to more accurate and timely risk assessments and mitigation strategies.
Fifteen literature reviews have been retrieved on the topic of applying DL for EDA (see the retrieval methodology in Section 2). Among them, eleven reviews focus on geological hazards with earthquake-induced geological disasters as a sub-type [19,20,21,22,23,24], or on specific secondary disasters related to earthquakes [25,26,27,28,29], with only four papers specifically addressing earthquakes [30,31,32,33]. Of these, three papers are scoped in AI [30] and ML [31,32], which are more comprehensive than DL, while the third is limited to a specific DL algorithm [33], and which may not be representative. Given this, a comprehensive literature review on the explicit intersection of DL and EDA is needed. Such a review should include bibliographic analysis dimensions of objects, data, models, stages, challenges, and opportunities. Accordingly, we propose to review and summarise the application of DL algorithms in EDA with the main concerns listed below. This paper will be the first comprehensive review of the application of DL for EDA.
- What are the dominant research objects for EDA using DL—earthquakes, earthquake-induced secondary disasters, buildings, infrastructure, or other objects—and how about their trends? Which detailed functions prevail for each EDA’s assessment object?
- What are the data types and their obtaining methods for DL algorithms in the EDA? Furthermore, what are the data sources (especially the publicly available ones), advantages, disadvantages, and adaptability of these data types?
- What are the types of DL models commonly used in EDA? Moreover, what are the corresponding advantages, disadvantages, adaptability, and characteristics of their data sources?
- How is DL applied in different stages of EDA, i.e., the main functions of DL in pre-earthquake, during-earthquake, and post-earthquake stages, respectively? What are the models’ and data types’ distribution in the more detailed assessment sub-stages?
This paper reviews 204 published reports on the application of DL for EDA. The structure of the remaining sections is as follows: Section 2 presents the methodology used in this study. Section 3 elaborates on EDA’s current research status analysis from the perspective of assessment objects. Section 4 introduces three main categories of data used by DL for EDA. Section 5 summarises the DL models most commonly adopted in EDA. Section 6 analyses the EDA emphasis in different temporal stages of an earthquake. Section 7 discusses current challenges and future opportunities in this field. Finally, Section 8 provides a comprehensive summary of the entire paper.
2. Methodology
Web of Science (WOS) Core Collection is selected as the database for paper retrieval due to its authority, popularity, and comprehensive coverage. Our preliminary survey found that the CNN is the most widely adopted DL algorithm in EDA research. To improve the articles’ relevance and highlight the current state of research, “CNN” is added to the retrieval expression to clarify our search scope and include the papers that specifically use CNN rather than DL in the text. As shown in Figure 1, the retrieval combination is “(earthquake or seismic) and (risk or disaster or hazard or damage or destroy) and (analysis or assess* or evaluat*) and (“deep learning” or “CNN” or “convolutional neural network”)”. A total of 304 articles were retrieved (as of 1 January 2023).
Based on the initial search results, we further clarified the scope of our literature review by applying specific screening rules. First, we limited the types of literature to four categories: article, review article, online publication, and data paper, while excluding conference papers. Second, we screened out papers that were not closely associated with our research content based on the title, abstract, and keywords. For example, we manually deleted papers in the medical or physical fields. Third, we confirmed that the literature was specifically about seismic hazards. In particular, we ensured that the causal factor of secondary disasters was an earthquake, thus excluding articles related to secondary disasters caused by non-seismic factors. Finally, we checked whether the algorithm used was specified as DL, filtering out literature that focused on AI or ML in general. By applying these screening rules, we selected 204 papers as the final dataset for our literature review. Among these, 15 papers were literature reviews and were excluded from our subsequent data analysis.
This paper summarises the most prolific journals in the field and their corresponding publications. The analysis presented in Figure 2a reveals that REMOTE SENSING journals are the leading contributors, accounting for 16.667% of the total publications in this area, followed by APPLIED SCIENCES BASEL and SENSORS.
As depicted in Figure 2b, the graph illustrates a rising trend in the application of DL for EDA, which began in 2018 and has continued to grow. This upward trend indicates a stable expansion of the DL’s application in EDA, highlighting the significance of this field as a prominent research topic.
3. Assessment Objects
As shown in Supplementary Table S1, five main assessment objects are identified, i.e., earthquakes, earthquake-induced secondary disasters, buildings affected by earthquakes, infrastructure affected by earthquakes, and regions affected by earthquakes. The sum of the total number is 199, with 10 of them involving multiple categories.
3.1. Earthquakes
The evaluation of the earthquake itself is an essential component of EDA. Our analysis of 59 articles in this field reveals two main categories of earthquake assessment: disaster assessment for tectonic earthquakes and man-made earthquakes.
3.1.1. Tectonic Earthquakes
Among the 54 studies of tectonic earthquakes, the themes of earthquake prediction and localisation comprise the majority, with 27 and 11 studies, respectively. Other studies focus on seismic data processing, earthquake warning, and identification. Earthquake prediction can be subdivided into mainshock prediction and aftershock prediction, with probabilistic and magnitude predictions being the primary concerns. For example, Jain et al. [34] designed an earthquake prediction model based on position and depth parameters using ML and DL algorithms. Ding et al. [35] developed a DL-based ground motion prediction equation (GMPE) for aftershock prediction after mainshocks. Perol et al. [36] proposed ConvNetQuake for seismic detection and localisation based on a single waveform. Instead of classifying waveforms based on similarity, the model uses a set of nonlinear local filters to analyse waveforms. Compared to other seismic detection methods (autocorrelation and FAST), ConvNetQuake achieves state-of-the-art performance in probabilistic event detection and localisation using a single signal. In addition, the model’s accuracy improves with the increase in the signal-to-noise ratio.
3.1.2. Man-Made Earthquakes
Man-made earthquakes mainly refer to earthquakes of anthropogenic origin, such as blasting and mining. The five articles on man-made earthquakes can be summarised in three aspects.
One paper is about the localisation of microseismic events. Wu et al. [37] established a dynamic model for locating shallow underground seismic sources based on the seismic wave analysis technique and the deep reinforcement learning method.
Three papers are about the identification of microseismic events. Since microseismic signals formed by mining events tend to have a smaller signal-to-noise ratio than tectonic earthquakes, Wilkins et al. [38] conducted a study to identify such seismic events accurately. The microseismic signals from the mines were recorded using geophones first. Then, a CNN algorithm was used to identify the signals and classify them as true events and false-positive events. This study proves that CNN is more efficient than humans in accurately classifying microseismic signals. Peng et al. [39] proposed a method based on deep convolution neural network inception (DCNN-Inception) for microseismic signal recognition. Comparing the performance of DCNN-Inception and CNN shows that the proposed method has better recognition accuracy than CNN. Xu et al. [40] proposed an automatic P-wave onset time picking method for mining-induced microseismic data based on a long short-term memory deep neural network. The proposed method can accurately extract data features of microseismic waveforms and further improve the P-onset picking performance.
The left paper is about the classification of clustered microseismic events. Duan et al. [41] investigated the feasibility of classifying seismic events distributed around the main dike and longwall face of an underground coal mine. Four models—random forest (RF), support vector machine (SVM), deep convolutional neural network (DCNN), and residual neural network (ResNN)—were used for classifying seismic signal data. Among them, DCNN is the most effective and reliable classifier.
3.2. Earthquake-Induced Secondary Disasters
Earthquakes could induce a series of secondary disasters, such as landslides, tsunamis, subsidence, collapse, liquefaction, etc. According to Supplementary Table S1, landslides and tsunamis are predominant earthquake-induced secondary disasters.
3.2.1. Earthquake-Induced Landslides
Earthquake-induced landslides (EQIL) are one of the most critical earthquake-induced secondary disasters, and bring many adverse impacts such as blocking traffic and burying houses. Therefore, assessing earthquake-induced landslides is of great significance for mitigating post-earthquake losses.
In our reviewed papers, there are 30 articles related to EQIL assessment. Based on the DL model, Zhang et al. [42] proposed a coseismic landslide identification model for the rapid and automatic extraction of landslides caused by the 2018 Iburi earthquake in Japan. Due to the spatial uncertainty in landslide areas and incomplete information extraction, Li et al. [43] used high-resolution remote sensing images and digital elevation models (DEMs) to extract the source area of an EQIL. In addition, a DL framework based on Stacked Auto-Encoders (SAE) was also used to predict EQILs. By comparing the proposed one with traditional prediction models, the DL-based model shows superiority in the spatial prediction of an EQIL.
3.2.2. Earthquake-Induced Tsunamis
Earthquake-induced tsunamis (EQIT) often cause significant damage to coastal cities. For EQIT assessment, the main concern lies in damage detection. Traditional damage detection methods were based on ground-based observations and low-altitude imagery. With the gradual maturity of remote sensing technology, tsunami-related data are more often collected by satellite to significantly reduce acquisition time and cost. Furthermore, combining DL with remote sensing images can detect EQIT damages and even subtle changes, significantly improving efficiency and effectiveness.
In this review, there are six papers on EQITs. Adriano et al. [44] developed a global multimodal and multitemporal dataset for building damage mapping. In addition, a damage mapping framework based on modern Attention U-Net architecture is proposed to study the damage mapping problem of three natural disasters, including tsunamis, under five data modality scenarios. This study shows that integrating the developed dataset and DL methods provides acceptable prediction results for all data modality scenarios with acceptable accuracy. Taking the 2011 Tohoku Earthquake-Tsunami as an example, Bai et al. [45] and Sublime and Kalinicheva [46] studied DL-based change detection and damage mapping using satellite images before and after the disaster. Due to the lack of high-resolution radar images, Synthetic Aperture Radar (SAR) images were considered a substitute to improve the model’s accuracy further. Considering that pre-disaster data may be unavailable, Bai et al. [16] studied the problem of EQIT damage identification and building damage mapping using only post-disaster SAR data.
3.3. Buildings Affected by Earthquakes
There are 74 articles assessing buildings affected by earthquakes. From the point of view of the research object, they can be further divided into (1) buildings (43 papers) and (2) building structures or components (31 papers).
3.3.1. Buildings
For buildings, the EDA focuses on three categories of seismic performance analysis and safety assessment.
The first category is to classify the vulnerability of buildings before an earthquake to analyse their seismic resistance or to carry out corresponding evacuation planning in advance. Aiming at the problem of identifying soft-story buildings, Chen et al. [47] developed a new method to overcome the occlusion problem of street view images to improve the soft-story identification performance. Soft-story buildings are open spaces on lower floors, mainly used for parking or commercial activities. The second category is the safety assessment of post-earthquake buildings for countermeasure-making of structural reinforcement or total reconstruction. Tsuchimoto et al. [48] used CNN and sparse acceleration measurement methods to assess the safety of post-earthquake buildings, whose effectiveness is verified through the case study of a five-story steel structure building.
3.3.2. Building Structures or Components
For building structures or components, the EDA is primarily concerned with structural damage detection and assessment.
By quickly detecting and locating structural damage during an earthquake, more serious damage can be avoided, and subsequent rescue can be facilitated. Morales-Valdez et al. [49] proposed a novel model for the automatic positioning of building structural damage. Experimental verification using an aluminium two-story building prototype confirms the development prospects of the proposed method, but more research is still needed to evaluate its potential.
Damage assessment of building structures or components can measure their post-earthquake residual capacity and assist in assessing the post-earthquake safety of buildings. Miao et al. [50] proposed a DL-based approach for the evaluation of mechanical property degradation of RC columns based on the visible seismic damage of the components.
3.4. Infrastructure Affected by Earthquakes
Infrastructure, including buildings, bridges, roads, railways, and ancillary pipe network facilities, is an essential element for ensuring human daily production and life [51]. There are 21 articles assessing infrastructure affected by earthquakes, mainly referring to public service facilities such as bridges and highways. Naser [52] combined DL with computer vision to program a framework for self-diagnosis and assessment of infrastructure under the impact of extreme events such as earthquakes. For highways, Hong et al. [53] proposed a DL method for road crack detection based on post-earthquake unmanned aerial vehicle (UAV) images. Experimental results indicate that the proposed method achieves 68.38% crack accuracy, surpassing U-Net and some traditional crack segmentation models.
Mangalathu and Jeon [54] proposed a framework for rapid damage assessment of bridge systems. Nine DL architectures—AlexNet, Inception, ResNet18, ResNet51, ResNet101, Vgg16, Vgg19, InceptionResNet, and DenseNet—were applied to four-span reinforced concrete box girder bridges designed in California before 1970. The comparison reveals that AlexNet has the highest test set accuracy among all models. Except for AlexNet, ResNet18, and Vgg19, all methods achieve greater than 70% accuracy on unknown test sets. Yoon et al. [55] established a method for damage detection and seismic resistance evaluation of deteriorating bridges.
3.5. Regions Affected by Earthquakes
In our review, nine articles focus on how to detect and assess post-earthquake damage on a regional scale. The areas affected by an earthquake are characterised by complex object components, including various buildings and infrastructures within a community with multiple functions. The systematic evaluation of damage within the affected region is crucial for effective emergency rescue work. Remote sensing technology has been increasingly employed in such scenarios, in combination with deep learning methods, to acquire and analyse regional data.
Bernabe et al. [56] performed fast seismic damage detection of regional very high-resolution remote sensing images using the OpenVINO toolkit. Lu et al. [57] proposed a method for rapid post-earthquake damage assessment in the region, which performs well in efficiency and accuracy. Kim et al. [58] studied pre- and post-earthquake regional loss assessments using DL models. Improvements in not only pre-earthquake prediction accuracy of structural response, but also post-earthquake near real-time assessment and decision-making were achieved. Conducting regional EDA allows for a more comprehensive overall assessment of the extent and severity of damage, aiding in the planning and execution of post-earthquake relief efforts.
3.6. Discussion
As shown in Supplementary Table S1, papers themed with assessing buildings affected by the earthquake account for the most significant proportion, while relatively few studies focus on infrastructure and regions. Among the 59 articles evaluating the earthquake, the CNN algorithm (63%) and RNN algorithm (12%) are the most commonly used algorithms. Among the 74 papers that evaluate buildings, the most applied algorithm is CNN (92%). Among the 36 papers on secondary disaster assessments, the most widely used algorithm is still CNN (67%). In the articles that evaluate infrastructure and regions, the application rates of the CNN algorithm reach 52% and 67%, respectively. These results indicate that the CNN algorithm is the most popular DL algorithm employed in EDA across all objects of assessment considered in this study.
As shown in Table 1, through the structuralisation of literature by the fields of assessment objects (earthquakes, earthquake-induced secondary disasters, buildings affected by earthquakes, infrastructure affected by earthquakes, regions affected by earthquakes), categories (disaster objects and physical objects), application stages (pre-earthquake stage, during-earthquake stage and post-earthquake stage), and functions, damage detection is identified as the application focus. The coexisting function of all disaster objects is probabilistic prediction, and the coexisting functions of all physical objects are damage detection, damage assessment, and risk assessment.
In addition, we categorise the objects of EDA and create a trend chart for each assessment object, as shown in Figure 3. The chart indicates that disaster objects and physical objects are assessed in nearly equal proportions, and that there is an overall increasing trend for almost all objects. In terms of disaster objects, studies of secondary disasters affected by earthquakes are relatively few but have demonstrated steady growth. In terms of physical objects, infrastructure and regions are currently less studied, potentially due to factors such as the limitations of hardware and software capabilities, the complexity of object components, high property density, and expansive spatial coverage. These findings provide valuable insights into the current state of EDA research and indicate possible regions for future investigation from the dimension of assessment objects.
4. Data Types
The input data of DL models cover various types, including remote sensing images, ground motion data, and social media data. Supplementary Table S2 shows the categorisation of reviewed papers by data types, with a total of 207 papers included, including 18 covering multiple data types. Moreover, data types that are unclear are considered “other”.
Access to reliable data resources, especially open-access ones, are valuable for EDA and other related research. During the literature review, we identified authoritative data sources available to the public that satisfy the retrieval and reference requirements. We manually extracted this information from 189 papers with additional details on data types and websites. These records are listed in Table 2.
4.1. Remote Sensing Data
There are generally three types of remote sensing data retrieved in this paper: satellite images, aerial images, and point cloud data. Remote sensing data covers a variety of acquisition methods, such as UAVs, aerial photography, and satellite platforms. This section sequentially introduces the characteristics and applications of satellite images, aerial images, and point cloud data.
4.1.1. Satellite Images
There are 68 articles adopting satellite images, including the sub-types of optical satellite images, SAR images, and Interferometric Synthetic Aperture Radar (InSAR) images.
Optical satellite images are the first choice for post-earthquake damage detection and assessment because they are easy to interpret [59]. Furthermore, given enough overlaps, optical images may be able to generate 3D models to assess the damage to buildings further [60]. Nevertheless, this approach requires sufficient time to collect images, which is undoubtedly impractical in emergency relief work. The intrinsic limitations of satellite images in identifying structural damages to buildings include their inability to aid in the identification of damage within structures, as well as vertical perspective data poorly identifying soft-story collapse [61,62]. It is also worth noting that optical satellite images are highly susceptible to weather conditions.
SAR images have the advantage of being insensitive to atmospheric conditions [63]. The disadvantage of SAR images is that it is difficult to interpret and detect similar objects. Nava et al. [64] explored the use of SAR data in a rapid mapping study of coseismic landslides in the eastern Iburi sub-prefecture of Hokkaido, Japan. Their findings suggest that combining SAR data with other data may help quickly map landslides.
InSAR has incomparable advantages in surface deformation monitoring, such as all-weather detection, wide detection range, high detection accuracy, and low detection cost [65]. It can provide data to support further earthquake event identification and risk assessment. InSAR is a technique that can be used to generate DEMs. But the accuracy of InSAR is greatly limited by geometrical distortions, atmospheric effects, and decorrelations, particularly in mountainous areas [66]. Shakeel et al. [67] constructed an anomaly detector of deformation in InSAR (ALADDIn) for earthquake detection.
4.1.2. Aerial Images
Aerial images are used in 28 articles, among which the most commonly used types are UAV and airborne images. UAV images have more applications in damage detection, mainly because of their portability and flexibility. Compared to satellite images, UAV images are less expensive and more accessible. Moreover, UAVs can observe more subtle damage due to the shorter sampling distance, such as cracks in roads and bridges [53,55]. The disadvantages of UAV acquisition mainly include the low quality of imaging, the small coverage area, and the dependence on human control.
Since aerial (manned) systems can perform multi-view image capture, oblique views can be obtained to detect building facade damage [68]. Therefore, airborne images can be combined with optical satellite images to obtain more comprehensive data. The disadvantage of airborne images is that they cannot achieve rapid image acquisition after the earthquake. Particularly in remote areas, it is challenging to obtain manned aircraft in emergencies. Consequently, airborne images are unsuitable for post-earthquake emergency response [61]. Duarte et al. [60] evaluated the combined use of airborne and satellite images and studied three CNN feature fusion approaches with three resolution levels of images. Such a multi-resolution feature fusion approach achieves better classification accuracy.
4.1.3. Point Cloud Data
Four articles are identified to use point cloud data in our review. LiDAR mainly acquires point cloud data. Airborne LiDAR can effectively obtain the 3D geometry of buildings (in the form of point clouds) and thus has more potential to be used to detect various collapsed buildings after an earthquake [69]. Additionally, point cloud data can be generated through photography software. When training DL models for soft-story building classification, Chen et al. [47] used a well-developed photogrammetry software to automatically register the shared points among images and calculate the distances in 3D space. Ultimately, 1.1 billion point-cloud data points were generated in Santa Monica.
The advantage of LiDAR technology is that it can acquire data with higher speed and accuracy. Moreover, LiDAR is not affected by light and can work all day. Its main limitation lies in the difficulty and complexity of data interpretation. Hence, optical images and LiDAR data can be combined to obtain more detailed information and achieve better results than using a single data type [70].
4.2. Seismic Data
In our review, 79 articles use seismic data. Seismic data includes ground motion data, earthquake catalogues, and seismic signals.
4.2.1. Ground Motion Data
Ground motion data are mainly physical parameters that characterise the ground motion caused by an earthquake, including peak ground acceleration (PGA), response spectrum, and duration. To monitor ground motion triggered by seismic waves, seismic stations are usually equipped with receivers (e.g., seismographs) and recorders (e.g., data recorders). At present, many countries have established real-time seismic monitoring networks, such as the China Digital Seismological Observation Network (CDSN) [71], CESMD, European Mediterranean Seismological Center (EMSC), Regional Earthquake-Tsunami Monitoring Center (RETMC) [57], Hi-net, F-net, K-NET, and KiK-net [72]. Once an earthquake occurs, these networks can record ground motion and transmit it in real time. To characterize the vector components of ground motion, earthquakes are generally monitored by three-component seismographs equipped with one vertical and two orthogonal horizontal sensors for ground motion in three directions (e.g., east-west, north-south, and vertical). Open source databases of ground motion are also specially extracted and collected in this literature analysis for data reference and requisition of related research, including STEAD (containing nearly 1.05 million three-component seismic events) [73], the PEER database (PEER NGA-East/West/West2 ground motion database) [74], CESMD [75], and so on.
Using appropriate methods to extract the features of the ground motion data can reflect the destructive force of the ground motion on the structure. There are two types of ground motion features—time domain features and frequency domain features. Time-frequency distributions (TFDs) of ground motions generated by wavelet transform (WT) can be used to describe seismic responses accurately. Lu et al. [57] used TFD as input data for a DL model when performing regional rapid damage assessments. The TFD is generated by first preprocessing (amplitude scaling and period adjustment) ground motion records obtained from the PEER NGA-West2 and K-NET databases. A continuous WT is then performed, resulting in the final TFD.
The encoding process of ground motion data requires a lot of time and resources. Accordingly, Yuan et al. [76] proposed a 1D CNN for rapid damage assessment based on 1D ground motion data, avoiding the process of 2D image encoding. In addition, given the above shortcomings, Yuan et al. [77] also conducted research from another perspective. That is, they developed a new time-series segmentation (TS)-based image encoding technique to convert acceleration (A), velocity (V), and displacement (D) ground motion records into AVD images for seismic damage assessment.
4.2.2. Earthquake Catalogues
Earthquake catalogues often include time of occurrence, location of epicentre, depth of source, magnitude, latitude, longitude, and intensity of the epicentre. Jena et al. [78] used the distributed earthquake catalogue and data from USGS to train the model, predict classifications, and generate the probability map in the study. Jena et al. [79] collected a complete catalogue of historic events for probability mapping.
4.2.3. Seismic Signals
In this paper, seismic signals refer primarily to seismic waves and vibration signals. Bilal et al. [80] proposed a deep learning model batch normalized graph convolutional neural network for early earthquake detection from raw waveform data. Bao et al. [10] investigated an electromagnetic sensor to assess earthquakes in advance by collecting earthquake signals. Yu et al. [81] proposed a novel method based on DCNNs to identify and localise damages of building structures equipped with smart control devices. Unlike traditional DI algorithms, the proposed method runs directly on vibration signals captured from detected structures, avoiding extra time-consuming, denoising and handcrafted feature-selection procedures.
4.3. Social Media Data
With the development of smartphones, browsing social media platforms and posting information has become more prevalent. When encountering earthquake disasters, people post help messages or personal feelings on various social media platforms (e.g., Twitter, Sina Weibo, Facebook, and Instagram). Information such as text, images, videos, and locations obtained from social media platforms is called social media data. Nine articles in our review use social media data. The application of such data in EDA is mainly for disaster identification [82], sentiment analysis [14], and disaster assessment [83].
There are three advantages to using social media data. (1) This type of data can reflect disaster situations in near real time, which can help disaster response teams have more comprehensive information when making relevant decisions. (2) Collecting this kind of data makes it possible to obtain help messages in time and coordinate relevant resources to carry out the emergency rescue. (3) Rescue teams can not only learn about the situation in the disaster area from social media information but also be able to monitor the situation of some rumours in time to avoid further panic.
4.4. Discussion
Combined with Supplementary Table S2, the association between each data type and its corresponding algorithms are examined. The analysis reveals that remote sensing data are most utilised for the CNN algorithm, with 80% of applications. Among the 80 papers on seismic data, the percentage of CNN algorithms reaches 56%. Furthermore, out of the nine papers that incorporate social media data, CNN algorithms are adopted in seven of them, accounting for 44%.
To provide a more comprehensive overview of the application functions, advantages, and disadvantages of different data types in EDA, we present a detailed summary in Table 3. Remote sensing data are applied most, especially for damage detection and assessment, as well as secondary disaster assessment. Seismic data, the second most prevalent data type, are commonly used for earthquake prediction, localisation, and structural response prediction. Social media data are the least frequently used data type, primarily for disaster extraction, post-disaster sentiment analysis, and other related tasks.
Based on Table 3, we further generalise the characteristics of data sources in four aspects, including suitable application scopes, acquisition cost level, coverage level, and precision level of data, as shown in Table 4. The presented distribution of these differentiated data characteristics can support the conclusion of integrating multiple data to achieve better results. For instance, combining airborne images with optical satellite images can provide a more comprehensive view of post-earthquake building conditions. Likewise, merging DEM data with SAR data can enhance the accuracy of landslide mapping.
5. Assessment Models
Supplementary Table S3 classifies reviewed papers by assessment models, with a total of 289 papers, including 100 covering more than one algorithm. Algorithms adopted less than twice are classified as “other DL models”. This section provides an overview of commonly used models, including CNN, RNN, LSTM, GAN, and TL, and summarizes their hybrid use.
5.1. Convolutional Neural Network
According to the induction and analysis of the literature, we find that the most frequently used classical CNN architectures are AlexNet, VGGNet, ResNet, Inception, Xception, DenseNet, SqueezeNet, and MobileNet. To further distinguish their respective features, application functions, advantages, and disadvantages, we summarise these attributes in detail, as shown in Table 5.
The CNN algorithm is the most frequently used DL method in EDA. A total of 139 articles use CNN algorithms in this review. The CNN architectures used in the literature can be briefly summarised into classification, segmentation, and detection according to their functions, as shown in Table 6.
- Classification
The architecture of CNNs can extract the scale, translation, and rotation-tolerant features for classifying images or object categories [89]. From the literature, CNNs have shown excellent performance in image classification. Compared to other models, CNNs have greater accuracy in large-scale datasets. Yeum et al. [89] built a database of reconnaissance images after natural disasters (including earthquakes, hurricanes, and tornadoes). Then, they used CNNs for scene classification and object detection in an extensive collection of images. The results show a high classification accuracy. Duarte et al. [60] evaluated the performance of three multi-resolution CNN feature fusion methods for the image classification of post-earthquake building damages (debris and rubble piles). Such an undertaking is essential for assessing building safety and is greatly important to disaster management.
- 2.
- Segmentation
Remote sensing images often contain much valuable information that traditional object-oriented evaluation methods may ignore. The image segmentation function of CNN can extract the boundary information well, thus maximizing the use of information and improving the efficiency of EDA. Therefore, CNNs are widely used in EDA because of their advantages in image segmentation.
Chen and Yu [90] used the network structure adapted from PSPNet as a semantic segmentation model to construct a multi-task DL framework. They studied the problem of earthquake-induced building damage mapping. Compared to the original PSPNet detection effect, the shape of the damaged buildings detected by the proposed method is more consistent with the shape in the original ground truth image. Song et al. [91] introduced an efficient scheme combining the DeepLab v2 neural network and the Simple Linear Iterative Clustering (SLIC) super-pixel segmentation method to extract information about earthquake-damaged buildings. It mainly includes using a DeepLab v2 neural network to extract the initial damaged building areas, and then further using the SLIC method to extract the boundary information of the areas.
- 3.
- Detection
Usually, the difficulty of object detection lies in locating objects accurately in images or videos and achieving fast and effective large-scale object detection [92]. With the development of CNNs, the 2012 ImageNet Challenge became the turning point, and DCNN achieved large-scale object detection [93]. Since then, CNN-based object detection has become a hot research topic. Yeum et al. [89] studied the post-disaster spalling detection problem using CNN. High detection accuracy is achieved in the cases of post-earthquake columns and walls. Asif et al. [82] proposed an approach to analysing social media images for disaster recognition automatically, and an object detection model based on the YOLO algorithm was developed to detect disaster-related objects for emergency response.
In addition to object detection, text detection is also an essential application of CNN. After an earthquake, people often post related messages on social media platforms, and these text messages usually contain much valuable information, such as location and emotional information. Taking the 2013 Ya’an earthquake in China as an example, Yang et al. [94] used the advanced search function of Sina Weibo to obtain relevant data. Next, they processed the text information to construct a word vector list. Then, a trained CNN model was used to analyse the new text. Through text detection, the text information is classified into six categories: positive, neutral, angry, anxious, fearful, and sad. Xing et al. [95] proposed a character-level CNN (Char-CNN) model for social media data classification. For the Jiuzhaigou earthquake in China, the Char-CNN model has good classification performance in disaster-related text extraction. Such applications could be regarded as natural language processing research in EDA.
5.2. Multi-Layer Perceptron
In broad terms, there are 18 papers on MLP (12 on DNN and six on MLP). Prevailing discourses show that MLP is a reliable model for achieving short-text classification. Behl et al. [14] used MLP to classify tweets during disasters as “resource needs”, “resource availability”, and “others”. The model was applied to the Italian and Nepalese earthquake datasets and compared with four cutting-edge models (LR-TF, CNN-W, CNN-WF, and MLP-TF). The results show that the proposed models exhibit the best performance. Jain et al. [34] used MLP regression, RF regression, and support vector regression algorithms to analyse and predict earthquake magnitudes, and MLP regression outperforms the other algorithms.
Fayaz and Galasso [96] constructed a DNN framework for real-time on-site estimation of the acceleration response spectra of earthquake ground motions. Su et al. [97] developed a DNN model for evaluating earthquake disaster chains. The proposed DNN model performs better in chain disaster prediction than the three ML models. Kim et al. [58] introduced a probabilistic deep neural network (P-DNN) [98] model for predicting the structural response at a given earthquake intensity measure (IM). An adaptive algorithm using DNNs as a surrogate model was proposed for real-time assessment.
5.3. Generative Adversarial Network
GAN is a generative model based on a zero-sum game between a generator and a discriminator. The generator is used to generate lifelike samples from random noise and tries to fool the discriminator. The discriminator is used to discriminate whether the sample is real or generated by the generator. The generator and discriminator compete with each other until the discriminator cannot discriminate between real and generated images [99].
Providing auxiliary information (such as class labels) to GANs helps to improve the performance of GANs. For this reason, the conditional GAN (CGAN) is developed. The characteristic of CGAN is that both the generator and the discriminator are constrained by auxiliary information. The merits lie in reducing the stochasticity of the generated data and accelerating its training [19].
Five articles adopt the GAN algorithm, and two are about CGAN. Ding et al. [100] simulated the intensity measures (IMs) of aftershocks using the CGAN model. First, mainshock-aftershock (MS-AS) sequence-type ground motions were selected from the PEER NGA-West2 ground motion database. Then, the corresponding IMs of ground motions were calculated and used for the training of CGAN. In addition, the Adam algorithm was used to optimise the objective function update automatically. Ultimately, the CGAN model can predict most of the IMs of AS well compared to real data. Tilon et al. [101] used a state-of-the-art anomaly detection generative adversarial network (ADGAN) model for post-disaster damage detection. The primary advantage of ADGAN is that it can identify small anomalies in images. Additionally, the model could perform damage prediction only based on pre-disaster data, making it a reliable tool for pre-disaster preparedness and post-disaster emergency response and recovery.
5.4. Recurrent Neural Network
RNN is a neural network architecture that handles sequence information in the temporal dimension. It disentangles irregular input features by exploiting the main internal memory and changing the sequence of processes through recurrent layers [102].
The literature review shows that the most commonly used RNN model in EDA is the LSTM. As a particular type of RNN model, the LSTM can handle long-term dependencies [103]. In addition to the LSTM, two papers use gated recurrent unit (GRU), another variant of RNN that has many similarities to the LSTM. The GRU architecture is simpler than the LSTM, with only a reset gate and an update gate.
There are 18 articles on RNN (including LSTM, RNN, and GRU), which are mainly applied to probabilistic prediction in EDA. Huang et al. [18] used three RNNs (simple-RNN, LSTM, and GRU models) to predict the dynamic response of the co-seismic slope. Jena et al. [79] estimated the probability of earthquakes in Odisha, India, using the RNN model based on ten indicators. In the RNN model, the most valuable factors were sent first, and the least valuable ones were sent last. The prediction results show that the model achieves a prediction accuracy of 94%. Jena et al. [104] used the LSTM model to assess the seismic vulnerability of Indian regions. The seismic vulnerability factors were input into the LSTM model in order of importance from highest to lowest, and finally, a prediction accuracy of 87.8% is achieved. However, for future improvement, uncertainties still exist in the data dependence, accuracy, and modelling.
5.5. Transfer Learning
TL is developed primarily to improve the performance of CNN-based models. Compared to traditional learning methods, TL can be used in the case of a few datasets. Traditional ML methods try to train from scratch, while TL can transfer knowledge from previous tasks to target tasks through pre-trained models when having less high-quality data without training from scratch [105]. There are three main reasons for using a pre-trained model. At first, high-priced computational power is required when using large models for complex datasets. Secondly, the training process of the model is also time-consuming. Moreover, pre-trained models could also help the network generalize and speed up convergence [84].
There are two common strategies for TL in neural networks: feature extraction and fine-tuning. In feature extraction, a model trained from a source domain can capture features from a new domain without changing the pre-trained model parameters. Only the fully connected layers before output are trained for the new task, significantly reducing the training time and the number of epochs [47]. Fine-tuning allows modifying the pre-trained network parameters while learning the target task. Typically, parameters at the bottom layer of the network used for learning low-level features are frozen, and parameters at the top layer of the network used for learning high-level features are fine-tuned. This reduces the number of parameters to be trained and avoids overfitting, especially when the amount of data for the target task is not large enough. In practice, fine-tuning is more frequently adopted than feature extraction because it optimises the pre-trained network for the new task.
There are 14 articles on TL. Chen et al. [47] developed a workflow for automatically identifying soft-story buildings based on features extracted from 3D point clouds. TL was adopted because of the limited dataset. They selected three deep CNN models (VGGNet, Inception, and ResNet) for the study to implement TL in the target domain. The optimal CNN model for the proposed workflow was investigated by feature extraction and fine-tuning of the three models. Ultimately, it is found that VGGNet dominates in terms of precision, recall, and F1 score. Aside from the feature extraction results of VGGNet, the learning curves of all models show obvious overfitting. By comparing the naive CNN with VGGNet, it is revealed that the TL can reduce overfitting.
Xu et al. [106] proposed a post-earthquake multi-scene recognition (PEMSR) model based on a single shot multibox detector (SSD) approach. TL combined with data enhancement and balancing strategies are used in the model to solve the problem of insufficient and unbalanced data in the original dataset. The main function of TL here is to fine-tune the layers of the pre-trained model obtained by training the SSD method for class prediction and bounding box generation. Finally, TL greatly improves the overall accuracy of the PEMSR model.
5.6. Hybrid Models
In addition to applying a single DL model, some articles combine multiple DL models. A total of 31 articles use more than one research method. Aslam et al. [107] integrated three ML models, namely SVM, logistic regression (LR), and random forest (RF), with CNN models to form three hybrid models (CNN-SVM, CNN-LR, and CNN-RF). In the modelling process of the hybrid model, CNN is mainly responsible for automatically extracting valuable features from the raw data. Then, three ML classifiers are used to classify these features, and the landslide and non-landslide regions are distinguished accordingly. In terms of generating landslide susceptibility maps (LSMs), all hybrid models outperform single ML models and are more accurate than the individual CNN model. The combination of CNN and LR improves performance best among the three hybrid models.
Furthermore, using knowledge of physics can alleviate the overfitting problem of neural networks and reduce the need for large datasets, thereby improving model robustness and accuracy. Eshkevari et al. [108] combined DL with physics to develop a physics-based RNN to predict nonlinear structural responses. Zhang et al. [109] developed a physics-guided convolutional neural network (PhyCNN) to estimate seismic response. It is verified that the PhyCNN surpasses the non-physics-guided neural network.
5.7. Discussion
DL has demonstrated significant potential in facilitating rapid EDA, particularly in signal recognition, image classification, object detection, and other related tasks. The literature review shows that the most commonly used DL models in EDA include CNN, MLP, TL, RNN, MLP, GAN, as well as various hybrid models. We summarise the advantages, disadvantages, application functions, and application stages of these commonly used models, as shown in Table 7. CNN, MLP, RNN and TL are applied across all stages of earthquake assessment. Among these, CNNs are the most widely adopted algorithm for various assessment tasks. Each model has its unique strengths and weaknesses and can complement one another. Comparative evaluations are often engaged in model studies. Consequently, hybrid models account for a considerable proportion of EDA. In the future, as AI and computer technology continue to advance, the storage capacity and computing power of algorithms will inevitably improve, leading to better performance of DL for EDA.
The input data of CNN can be 2D images, 3D data, or 1D data. Remote sensing data, ground motion data, and social media data have been used as training data for CNNs. Remote sensing data are the most widely used data (52%), while social media data are the least used (3%). In terms of MLP algorithms, all three types of data are adopted, with ground motion data being used the most (61%) and social media data the least (5%). In the research on the RNN algorithm, three kinds of data are also used, among which the motion ground motion data are dominant (78%), and the social media data are the least used (11%). For TL studies, remote sensing data are the most (71%), and social media data are the least (7%). In the studies of GAN, only remote sensing data and ground motion data are involved, of which the ground motion data are up to 80%.
6. Assessment Stages
The earthquake development process can be divided into three stages, namely the pre-earthquake, during-earthquake, and post-earthquake stage, as per the prevailing discourses in earthquake engineering. The pre-earthquake stage is primarily focused on prevention measures, including building seismic resistance assessment, earthquake prediction, and localisation. Its function is targeted at preparation for the earthquake mitigation work. The during-earthquake stage begins with the occurrence of an earthquake and ends with the completion of emergency response efforts. It generally encompasses the determination of earthquake parameters, real-time disaster situation acquisition and analysis, and rapid detection and assessment of structural damage. The primary objective of this stage is to ensure rapid earthquake response, emergency rescue, and provision of temporary shelter. The post-earthquake stage involves secondary disaster evaluation, disaster area reconstruction, and post-earthquake damage assessment, with the main aim being to expedite the recovery of the affected region and help the affected population return to their normal lives as soon as possible.
According to the above concepts, we further elaborate on the evaluation work required at each stage. The pre-earthquake stage encompasses earthquake prediction and risk assessment, while the during-earthquake stage consists of damage detection, disaster analysis, earthquake localisation, and seismic data processing. The post-earthquake stage contains loss, safety, and secondary disaster assessment. In the research process, the training data are pre-earthquake and post-earthquake data, which are classified as multi-stage. Damage detection and damage assessment are classified based on whether they focus on detecting the presence of damage or measuring the severity of the damage, respectively. Supplementary Table S4 provides an overview of the four stages of EDA based on the time dimension.
6.1. Pre-Earthquake Stage
As shown in Supplementary Table S4, this section reviews the literature from the perceptive of the assessment stages of EDA.
6.1.1. Earthquake Prediction
Earthquake prediction is an essential component of EDA, with 27 articles in this specific field of the pre-earthquake stage. In academia and engineering practice, earthquake prediction usually contains earthquake probability estimation, earthquake early warning, earthquake damage prediction, and aftershock prediction. Currently, there are four main earthquake prediction methods, namely DL, which is the focus of this paper, mathematical analysis, precursors signal study, and ML [110]. Mathematical analysis uses mathematical tools for earthquake prediction [111]. Precursors signal study mainly refers to earthquake prediction based on electromagnetic signals [10,112], aerosol optical depth [113], the lithosphere-atmosphere-ionosphere [114], cloud images [115], etc. ML methods mainly refer to methods such as decision trees and SVMs [116], which are used to discuss data mining and time series analysis.
The advantage of the DL approach over the other three methods is that it can capture the complex nonlinear correlation between the various factors of the earthquake [110]. Ding et al. [35] used DNN and CGAN to predict aftershock spectral acceleration. Kuang et al. [117] used an FCN-based magnitude neural network (MagNet) for magnitude prediction. Jena et al. [78] used a CNN for earthquake probability estimation.
6.1.2. Risk Assessment
A total of 23 articles investigate risk assessment in the pre-earthquake stage. To assess the seismic risk of road network systems, Silva-Lopez et al. [118] developed a neural network surrogate model to quickly evaluate the performance of complex road networks and accurately estimate traffic disruptions caused by earthquakes.
To assess the seismic risk of buildings, Pelizari et al. [119] introduced a method for the automatic classification of structural features of buildings based on deep CNNs and street images. This study is valuable for the vulnerability analysis of buildings under earthquakes. Chen et al. [47] focused on the automatic classification of soft-story buildings. These buildings are characterised by inconsistent structural stiffness, inducing a greater risk of earthquakes.
To assess the seismic risk of bridges, Yoon et al. [55] proposed a method for damage detection and seismic resistance assessment based on UAVs. The method includes damage detection using the Mask R-CNN model and seismic resistance assessment using a finite element model based on the damage detection results.
To assess seismic risk in earthquake-prone regions, Jena et al. [120] developed a DL model for probabilistic assessment of the Palu earthquake in Indonesia. Two types of calculations were used: (1) Risk A was generated using an earthquake probability assessment (EPA), susceptibility to seismic amplification (SSA), and earthquake vulnerability assessment (EVA). (2) Risk B was generated using EDA, SSA, and EVA. By comparison, the results of risk B are more reasonable than risk A. This study is limited to a few specific factors due to data availability. However, the method is transferable and can be applied to other regions or other disasters with only minor modifications to the data.
6.2. During-Earthquake Stage
This paper holds that the during-earthquake stage is characterised by “real-time (or rapidity)”. Therefore, the rapid damage detection after an earthquake is considered to be in the during-earthquake stage. The main tasks are to rapidly localise earthquakes, detect damage, and analyse disaster situations in the during-earthquake stage. In addition, seismic data processing is also included in this stage, because efficient data processing is an essential part of the process to respond quickly to earthquakes.
6.2.1. Damage Detection
In our review, 36 articles investigate damage detection in the during-earthquake stage. The destructiveness of earthquakes is often reflected in the damage to buildings, such as cracks and collapses. Damage detection is a significant task in EDA and an important part of structural health monitoring. Damage detection of the structure allows further assessment of the damage’s location, extent, and remaining service life. Commonly used methods for damage detection can be divided into two categories: vision-based and vibration-based methods [121]. Vision-based methods mainly rely on damaged images for detection. In recent studies, the analysis of damaged images is highly reliant on DL algorithms, such as the YOLO algorithm [122], CNN algorithm [123,124], and GAN algorithm [101]. Figure 4 shows the general process for damage detection using DL models. Vibration-based methods mainly rely on the vibration signal obtained by the sensor. These vibration signals are used for damage detection and localisation through signal processing techniques, such as WT [125] and short-time Fourier transform [126]. Due to the relatively high installation cost of sensors, many buildings are not equipped with sensors. Therefore, vibration-based methods are often not suitable for damage detection problems caused by earthquakes. In addition, with the development of UAV and remote sensing technology, damaged images are more and more easily obtained. Therefore, the vision-based method is far superior to the vibration-based method.
A crucial task in damage detection is the detection of collapsed buildings. Earthquakes often lead to dilapidated and cluttered regions, and it is often difficult to distinguish collapsed buildings from complex backgrounds when using DL for collapse detection. Thereupon, Shi et al. [127] used an improved YOLOv4 algorithm for collapse detection. The improvements are mainly: (1) replace Resblock with ResNext block in CSPDarkNet53; and (2) replace the loss function with Focal-EOIU. These two improvements increase the average accuracy of YOLOv4 collapse detection from 88.23% to 93.76%.
6.2.2. Earthquake Localisation
Eleven papers were identified about earthquake localisation in the during-earthquake stage. Earthquake localisation refers to determining the location and time of energy release from an earthquake. DL can significantly reduce the localisation time compared to traditional methods that rely on manual selection.
Kriegerowski et al. [128] used a deep CNN model for earthquake localisation based on multistation full waveforms, which is suitable for accurate earthquake localisation problems. Zhang et al. [129] adopted an FCN to achieve the real-time localisation of earthquakes. The method takes three-component waveform data as input, and outputs a 3D image that can predict the probability of earthquake localisation.
6.2.3. Disaster Situation Analysis
Drawing upon the screened results, 14 articles are about disaster situation analysis in the during-earthquake stage. After the earthquake, in addition to obtaining relevant information from the official, we can also analyse the disaster information from social platforms. This paper focuses on the utilisation of DL algorithms to extract earthquake-related content from social media data for named entity recognition [103], as well as the analysis of road congestion [130] and public sentiment [94].
Taking the Jiuzhaigou earthquake as an example, Xing et al. [131] established a spatial distribution detection method for emergency information using blog posts published by users on Sina Weibo. (1) Char-CNNs were used as classifiers for text urgency scoring and classification. (2) according to the results of emergency classification, spatial autocorrelation analysis was carried out to determine the degree of earthquake impact in different regions. (3) the spatio-temporal analysis of earthquake emergency information was also carried out, which could assist in making emergency decisions. Taking the earthquake that occurred in Ya’an, China, in 2013 as a case study, Yang et al. [94] used a CNN model to extract and classify emotional information from social media data. Eliguzel et al. [103] introduced a named entity recognition (NER) method based on an RNN model to extract information related to the Nepal earthquake from Twitter. Named entity recognition refers to locating and classifying named entities in text into predefined entity categories [132]. The results of this study reveal that uploading relevant tweets to the model when an earthquake occurs can extract relevant location, people, and organisation information from the tweets with 92% accuracy.
6.2.4. Seismic Data Processing
Five articles are about seismic data processing in the during-earthquake stage. Random noise is unavoidably generated in seismic data acquisition due to anthropogenic or environmental influences. Seismic data processing therefore mainly refers to seismic data denoising. In addition, the review also includes waveform extraction and seismic imaging.
In terms of data denoising, Qian et al. [133] proposed a deep tensor convolutional neural network-based ground truth 3-D seismic random noise attenuation in the time-frequency domain. Dong et al. [134] proposed a multiscale spatial attention denoising network to tell weak reflected signals apart from strong seismic background noise. Zhou et al. [135] developed a deep denoising convolutional autoencoder network based on self-supervised learning to attenuate seismic random noise. In terms of waveform extraction, Xu et al. [40] proposed an automatic P-wave onset time picking method for mining-induced microseismic data based on a long short-term memory deep neural network. In terms of seismic imaging, Siahkoohi et al. [136] developed a systematic approach to translating uncertainty due to noise in seismic data to the confidence intervals of automatically tracked horizons in the image.
6.3. Post-Earthquake Stage
On the one hand, the assessment of the post-earthquake stage is mainly about the prevention and mitigation of secondary disasters. The first is the landslide susceptibility analysis [137,138]. Landslide susceptibility analysis is a crucial way to predict landslides after earthquakes. The process mainly collects landslide influence factors in landslide-prone regions, calculates the probability of landslide occurrence, and draws LSMs [139]. The second is the damage mapping for tsunamis [44]. On the other hand, the assessment of the post-earthquake stage also includes post-earthquake safety assessment and damage assessment.
6.3.1. Secondary Disaster Assessment
In our review, 33 papers are on secondary disaster assessment, 14 of which are about landslide susceptibility analysis and landslide prediction. The role of landslide susceptibility analysis is to quantify the spatial differences and distribution characteristics of landslide incidence. Gao and Ding [140] studied landslide susceptibility in Wenchuan, China, using a CNN model incorporating ML algorithms (SVMs, quadratic discriminant analysis, Bayesian optimised gradient boosting tree, and Bayesian optimised RF). Wei et al. [141] proposed a DL framework that combined spatial response features and ML classifiers (SR-ML) for landslide susceptibility analysis. Compared to the ML method, the proposed model is more reasonable and reliable in landslide susceptibility analysis, which can improve the accuracy of disaster prediction. Chowdhuri et al. [142] created LSMs using an ANN model and three novel DL approaches, namely deep boosting (DB), deep learning neural networks (DLNN), and the deep learning tree (DLT).
In addition, 12 of them are about the identification and extraction of EQILs. At present, landslide identification methods based on remote sensing are broadly classified into (1) visual interpretation, (2) change detection, (3) ML, and (4) DL. The features of the data and processing parameters are not required to be set artificially except for the necessary parameters in DL, which greatly enhances the portability of landslide detection [143]. Yu et al. [144] proposed a hierarchical attention deconvolution neural network, HADeenNet, which is specifically designed to detect landslides from high spatial resolution images. The method avoids the omission of small landslides. The traditional way of landslide extraction is a field survey, which is time consuming and labour intensive. Later, with the development of remote sensing technology, visual interpretation-based, object-based, and pixel-based methods appeared. Visual interpretation-based methods rely on human resources. Object-based methods cannot handle complex and large-scale data and are less efficient. Pixel-based methods are prone to noise and cannot fully use remote sensing data. Compared to the above methods, the DL-based landslide extraction approach can automatically extract features, which can both free up the workforce and improve accuracy to a certain extent. Yang et al. [145] used Mask R-CNN and background enhancement methods for landslide extraction, which can better distinguish background information from landslide information.
Two of them are about the damage mapping of EQITs. Take the 2011 Tohoku earthquake-tsunami as an example, Bai et al. [45] combined U-Net with satellite remote sensing damage mapping technology for tsunami damage mapping. At the pixel level, the damage categories were set to three categories, namely “wash away”, “collapse”, and “survival”. Finally, the verification shows that the proposed method achieves an overall accuracy of 70.9% on three damage categories. Sublime and Kalinicheva [46] proposed a damage mapping method that can perform quickly and efficiently without supervision based on the changes brought about by the 2011 Tohoku tsunami. Although the final result is not as good as supervised algorithms, it provides a good research idea.
6.3.2. Safety Assessment
Seven papers in our review focus on safety assessment. After an earthquake, a building needs to be assessed for safety before it can be returned to service. Therefore, assessing the safety of buildings is of great significance for post-earthquake resettlement and the reconstruction of disaster areas. The traditional building safety assessment is mainly an expert investigation method. The disadvantages of this method are that it is time-consuming, labour-intensive, subjective, and poses a potential threat to the personal safety of experts.
As a result, post-earthquake safety assessments based on DL have been widely studied. Tsuchimoto et al. [146] studied the problem of rapid post-earthquake safety assessment for high-rise buildings based on the collected sparse acceleration data. A CNN algorithm was used to classify the safety of buildings as safe, restricted use, and unsafe based on the inter-story drift angle. The model achieves an accuracy of more than 97.1%. Mangalathu and Burton [147] used LSTM to assess the safety of buildings based on the collected textual descriptions. The safety of the buildings was classified as apparently safe, restricted use, and obviously unsafe based on the damage condition and marked in green, yellow, and red, respectively. The model achieves an overall accuracy of 98%.
6.3.3. Loss Assessment
There are 25 papers related to loss assessment. Loss assessment mainly includes the assessment of economic losses, building damage, and casualties caused by the earthquake. The literature survey found that the current applications of DL in loss assessment focus mainly on the latter two cases.
- (1)
- Building Damage Assessment
Classifying the extent of damage to buildings and infrastructure caused by seismic events is essential for enhancing post-earthquake reconnaissance and ensuring safe and efficient recovery efforts. Regarding the classification standard of damage grades of buildings after earthquakes, the most commonly used damage grades are as follows. One of the earliest and most commonly used damages classification guidelines is the 1998 European Macroseismic Scale (EMS98) [148]. It indicates five damage grades, including negligible to slight damage (Grade 1), moderate damage (Grade 2), substantial to heavy damage (Grade 3), very heavy damage (Grade 4), and destruction (Grade 5), usually used for the damage classification of masonry and reinforced concrete buildings. EMS98 is mainly used for ground inspection. Since the building features extracted from remote sensing images differ from those observed in ground inspection, EMS98 guidelines do not apply to remote sensing data [32]. For wood frame buildings, the Japanese Prime Minister’s Office [149] proposed four damage levels: no damage, moderate damage, heavy damage, and major damage. For frame structures, the Architectural Association of Japan [150] proposed six damage ranks, namely no damage (Rank 0), negligible damage (Rank 1), slight damage (Rank 2), moderate damage (Rank 3), major damage (Rank 4), and collapse (Rank 5). According to China’s “Classification of earthquake damage to buildings and special structures”, earthquake damage to buildings could be divided into five levels: basically intact (including intact), minor damage, moderate damage, heavy damage, and collapse. Figure 5 shows the general process for damage assessment using DL models.
Damage assessment is one of the most critical tasks in EDA. Song et al. [91] established a damage assessment method combining the DeepLab v2 neural network, super-pixel segmentation, and mathematical morphology. The results indicate that the proposed method outperforms other methods. Thus, the method is expected to save much time by quickly assessing damaged buildings after an earthquake.
Due to the dense distribution, small size, and uneven data of satellite remote sensing optical images, Wang et al. [151] developed a two-stage assessment method for densely distributed small buildings. These two stages include YOLOv4-based object detection and SVM-based damage classification. The results show that the accuracy of object detection and damage classification assessment of buildings after the earthquake is 95.7% and 97.1%, respectively. Furthermore, the research results show that the method can identify and detect buildings on the boundary, densely distributed buildings, and occluded buildings. Therefore, this method could make up for the disadvantages of unbalanced optical image samples.
In addition to the above, damage assessment could also shorten the time of post-earthquake assessment through prediction. For the Bayrakli area of Izmir, Turkey, which was most severely affected by the Samos earthquake, Kaplan and Kaplan [152] proposed a post-earthquake structural damage prediction method based on response spectra. The main objective is to predict the damage to a building by comparing the fundamental vibration period estimated from the building height with the collected ground vibration response spectrum. The significance of the proposed method is that it can predict post-earthquake damage so that the damage assessment can be coordinated after the earthquake according to the order of priority of the predicted results. This method also allows the field assessment team to move directly to the buildings expected to suffer severe damage, significantly reducing the time for site investigation.
- (2)
- Personnel Casualty Assessment
The purpose of personnel casualty assessments is to predict the distribution of casualties and to rationally deploy rescue plans. Many factors cause death in earthquakes, but each factor has different effects on death. In the past, linear models were often used to determine the correlation between features and death. Jia et al. [153] used DL models to study the correlation between features and casualty and to assess the loss. First, RF, CART, and AdaBoost were used to evaluate the correlation between nine influencing factors and death. Then, RF was used to assess the relationship between 43 structural types and death. Finally, a four-layer back-propagation network was used to predict personnel casualty assessment. This study is invaluable for predicting earthquake fatalities and reducing personnel casualties.
6.4. Multi-Stage
Since pre-earthquake data are often difficult to obtain during EDA, many studies are based on post-earthquake data. However, there is no doubt that the efficiency and accuracy of EDA will be greatly improved if the data before and after the earthquake can be used at the same time. Therefore, this paper classifies EDA studies using simultaneous pre- and post-earthquake multi-temporal data as multi-stage studies.
A total of eight papers in this paper are concerned with multi-stage assessments. Ji et al. [154] used pre-earthquake and post-earthquake satellite images in a study on detecting collapsed buildings after an earthquake. Kalantar et al. [124] considered the multi-temporal data before and after the mainshock in building damage detection. Shen et al. [13] proposed a two-stage CNN for damage assessment. The first stage is mainly used for building segmentation. In the second stage, pre- and post-disaster images are used for damage assessment.
6.5. Discussion
We organise the bibliographic statistics by assessment stages, sub-stages, publications, models, and data types, as shown in Table 8 and Supplementary Table S4. The assessment sub-stages are listed in a timing sequence. We identify during- and post-earthquake stages as the most studied stages, and find that damage detection is the hot topic across all stages. Research on the probabilistic prediction of earthquakes (mainshocks), the most crucial aspect of the pre-earthquake stage, turns out to be relatively few. The three most researched assessment tasks are damage detection, damage assessment, and secondary disaster assessment. Remote sensing data is the dominant data type for these three tasks, while the CNN algorithm is the most commonly used DL method. DL methods have demonstrated advantages in seismic data processing (seismic denoising and image processing) and magnitude prediction. However, the reliability of neural network-based prediction models lacks scientific consensus and requires further verification through simulations to assess its accuracy, precision, and applicability.
6.6. The Application Framework of DL for EDA
Based on the analysis of application of DL in EDA from four dimensions, i.e., assessment objects, data types, assessment models, and assessment stages, its application framework could be further constructed accordingly, as shown in Figure 6. The key functions of EDA lie in prediction, detection, classification, identification, and assessment.
From the perspective of objects, the input of earthquake-related actions could be tectonic earthquakes, man-made earthquakes, and earthquake-induced secondary disasters, and the hazard-affected bodies could be buildings, infrastructures, and areas. From the data dimension, remote sensing data, seismic data, and social media data should be input for the corresponding detailed requirements of EDA functions, methods, and applications. Various DL models with different capacities in data processing are available for specific application scenes from the pre-earthquake stage, during-earthquake stage, or post-earthquake stage. These interrelated four dimensions synergistically describe the whole EDA process.
7. Challenges and Opportunities
7.1. Challenges
7.1.1. Collection of Training Data
Insufficient and unbalanced training data pose significant obstacles to using DL for EDA. Scholars have attempted to solve these data problems through three primary methods: data-level, algorithm-level, and hybrid methods [155]. Data-level methods aim to balance the class distribution in the training data using resampling methods. In contrast, algorithm-level methods assign different costs to samples from different classes. One of the most commonly used algorithm-level methods is the cost-sensitive method. Ensemble learning is another important method for improving the class imbalance problem [156].
Several approaches address the challenge of insufficient training data for DL models: (1) TL can be employed (refer to Section 5.5). (2) Researchers can take advantage of publicly available datasets. For example, Ci et al. [157] made available an open-source dataset consisting of over 13,000 optical aerial images of labelled damaged buildings, which can be downloaded for free from https://github.com/city292/build_assessment, accessed on 8 August 2022. Hong et al. [53] developed a benchmark dataset for highway crack segmentation to capture road damage under earthquake hazards, which is accessible at https://github.com/zhhongsh/UAV-Benchmark-Dataset-for-Highway-Crack-Segmentation, accessed on 8 August 2022. Cheng et al. [158] introduced a large-scale remote sensing image dataset, NWPU-RESISC45, containing 31,500 images with 700 images per class that cover 45 scene classes (see Table 2 for additional official websites and databases). (3) Data augmentation techniques can be used to increase the size of the dataset. Common data augmentation methods include flipping, rotation, random translation, image normalisation, and image upsampling and downsampling. (4) Combining DL with physical models can mitigate the reliance of DL on large-scale data.
In addition, data quality is another critical factor. Insufficient image resolution, limited information conveyed by images, and noise are among the key challenges. Advanced data collection techniques, such as mobile lidar scanning and LiDAR, can improve image resolution. Additionally, oblique views of buildings obtained from UAVs can compensate for the limitations of remote sensing and optical images. The fusion of multiple data can also be considered to take advantage of each data type (refer to Table 3). Moreover, social media data contain high levels of noise. For example, social media users are not representative of all the population affected. Therefore, cross-validation with information extracted by other means, such as alarm and fire calls, can improve data quality.
7.1.2. DL Models
- (1)
- Generalisation
The primary goal of developing relevant models is to contribute to earthquake prevention and mitigation efforts. Thus, the generalisation of the model is crucial. The inconsistency between the experimental environment and real-world conditions is the main factor that can affect the model’s generalisation. Earthquakes vary significantly in terms of their regions, magnitudes, and destructive powers, further adding to the complexity of generalisation.
The model’s parameter issues can also have an impact on generalisation. Therefore, it is essential to consider new activation functions, dropouts, and batch normalisation techniques to address these challenges. Ensemble learning is another approach that can improve a method’s performance by integrating multiple previously trained models. Furthermore, fine-tuning the model is also a critical tool to enhance its generalisation ability (see Section 5.5 for details).
- (2)
- Interpretability
A potential weakness for DL models is interpretability, meaning that it is difficult to explain how these high-performing models achieve these results. This lack of interpretability undermines the applicability of deep learning models, even in situations where it outperforms human experts [159]. One feasible solution is to adopt techniques from the field of computer vision. For example, differentiating the contributions of different components in a deep learning model by exploiting ablation experiments, or explaining the functionality of model components by visualization [19]. Another approach is to combine physics-based models with DL models to exploit the theoretical advantages of physics modelling for interpretability.
- (3)
- Uncertainty
Uncertainty can be described as a situation involving incomplete or unknown information [160]. Accurately dealing with associated uncertainties can be another future focus to achieve a good assessment in the field of EDA. To quantify uncertainty, three sources should be considered, including physical variability of equipment, data, and model error [161]. Traditional methods normally used statistical methods, the polynomial chaos expansion method, Perturbation method, and Monte Carlo simulation, which are common methods for uncertainty quantification. In DL, the Bayesian neural network is commonly used for uncertainty quantification. Additionally, other methods in Bayesian theory, Markov chain Monte Carlo (MCMC), Monte Carlo Dropout (MC dropout), etc., also play an essential role in assessing parameter uncertainty and model fitting.
7.2. Opportunities
7.2.1. New Data Sources
In response to the aforementioned data challenges, using new data sources in the future can also solve problems such as insufficient data or poor data quality. Emerging technologies, such as the Internet of Things (IoT), computer vision, and wireless remote sensing, can be leveraged as they develop. Online news data is a reliable source of disaster-related information. In wireless sensor networks and other relevant technologies deployed in disaster-affected areas, effective disaster response can be achieved by using web crawling or web scraping to obtain data information.
7.2.2. Multimodal Deep Learning
Currently, most models in EDA are developed for single-modal data, which can limit their performance due to insufficient training samples, especially in detection tasks. Multimodal DL has emerged as a promising solution, where the input data consists of training samples from multiple data sources.
Multimodal data has significant advantages, such as enabling heterogeneous data fusion to compensate for the lack of a single data source sample, as well as improving performance and reliability. However, our review finds that only ten articles consider the joint usage of multiple data, and most of them focus on 2D images. In the future, more consideration can be given to fusing various data types, including images, text, video, and 3D data. For example, post-earthquake damage assessment can benefit from combing social media text data with remote sensing images. Multimodal DL presents a promising avenue for further development in EDA.
7.2.3. New Concepts
The emerging concepts of knowledge graphs and digital twins have presented new opportunities for DL in assessing earthquake disasters. A knowledge graph is a structured representation of facts consisting of entities, relations, and semantic descriptions [162]. It enables the creation of a knowledge base and inference engine for earthquake disaster analysis involving DL, including mining and constructing relationships among various seismic-related factors, analysing the characteristics of seismic hazards, and using DL models for prediction [19]. Knowledge graphs are increasingly being applied in the seismic field.
With the rapid advancement of technologies such as the IoT, AI, and big data, digital twins have tremendous potential for further development. Digital twins can create virtual models based on real-time data from the physical world. Its value lies in providing a broader environment for deploying DL models. As digital twins offer a more comprehensive representation of the physical world, their integration with DL models can lead to more accurate and efficient EDA.
8. Conclusions
This paper presents a systematic review of the application of DL for EDA from four dimensions: assessment objects, data types, assessment methods, and assessment stages, and further discusses current challenges and opportunities. The review process follows a well-designed scientific methodology. The major conclusions of this research are summarised as follows.
(1) A statistical analysis of assessment objects is conducted, encompassing disaster objects (earthquakes and earthquake-induced secondary disasters) and physical objects (buildings, infrastructure, and areas affected by earthquakes). Based on this analysis, temporal trends and detailed function distributions of the assessment objects are examined. In terms of temporal trends, all objects show upward trends and earthquakes are always the primary focus for disaster objects. Buildings are the most researched physical object. However, further breakthroughs are anticipated in infrastructure and affected areas. In terms of function, probabilistic prediction is a major area of research for disaster objects, while damage detection is the focus for physical objects.
(2) We perform a preliminary statistical analysis of the data types, including remote sensing data (satellite images, aerial images, and point cloud data), seismic data, and social media data. We then generalise the advantages and disadvantages of each data type. Based on this, we further analyse their detailed characteristics across four dimensions. Currently, satellite images are the most popular data type in EDA. However, integrating multiple data types is expected to become a growing trend, as it allows complementary strengths and weaknesses to be leveraged.
(3) We carry out a bibliometric analysis of assessment models using CNN, MLP, GAN, RNN, TL, and hybrid models, including their sub-models. We further analyse their advantages, disadvantages, functions, and application stages in EDA. The CNN is currently the most widely adopted algorithm in EDA. However, the integration of DL models or DL with other methods (e.g., physics and ML) will be a crucial research trend.
(4) We conduct a detailed statistical classification of the sub-stages in the four assessment stages (pre-earthquake stage, during-earthquake stage, post-earthquake stage, and multi-stage) of the EDA. Additionally, we summarise the DL models and data types commonly used across all stages and sub-stages. During- and post-earthquake stages are the current focus of research. However, with the advancement of social awareness and technologies, pre-earthquake prediction is expected to gain more attention in order to unlock its potential functions.
(5) Challenges and opportunities are determined based on bibliometrics and discussions (see Section 3.6, Section 4.4, Section 5.7 and Section 6.5). Despite the advancements in DL, the complexity of neural networks and the uncertainty of earthquake hazards still pose significant challenges, including the collection of high-quality training data and the generalizability of models. Nevertheless, there are potential opportunities for future development, such as the integration of multimodal DL, knowledge graphs, and digital twins, which can enhance the accuracy and efficiency of EDA.
The main limitations of this paper are:
- (1)
- Its exclusive reliance on the WOS platform and the inclusion of only English literature.
- (2)
- Some relevant research may have been missed due to the possibility that certain articles’ topics (title, abstract, and keywords) did not include the search terms used.
DL has significantly advanced the technical capabilities of EDA, and further enhancements can be achieved through the development of multimodal DL, knowledge graphs, and digital twins, especially in the pre-earthquake stage and with regard to infrastructure and area assessment.
Supplementary Materials
The following supporting information can be downloaded at: https://www.mdpi.com/article/10.3390/rs15164098/s1, Table S1: Categorisation of reviewed papers by assessment objects; Table S2: Categorisation of reviewed papers by data types; Table S3: Categorisation of reviewed papers by assessment models; Table S4: Categorisation of reviewed papers by assessment stages. References [10,11,12,13,14,15,17,18,34,35,36,37,38,39,40,41,42,43,44,45,46,47,48,49,50,52,53,54,55,56,57,58,60,61,64,67,68,69,70,76,77,78,79,80,81,82,83,89,90,91,94,95,96,97,100,101,102,103,104,106,107,108,109,117,118,119,120,122,123,124,127,128,129,130,131,133,134,135,136,137,138,139,140,141,142,143,144,145,146,147,151,152,153,154,157,163,164,165,166,167,168,169,170,171,172,173,174,175,176,177,178,179,180,181,182,183,184,185,186,187,188,189,190,191,192,193,194,195,196,197,198,199,200,201,202,203,204,205,206,207,208,209,210,211,212,213,214,215,216,217,218,219,220,221,222,223,224,225,226,227,228,229,230,231,232,233,234,235,236,237,238,239,240,241,242,243,244,245,246,247,248,249,250,251,252,253,254,255] are cited in the Supplementary Materials.
Author Contributions
Conceptualization, J.J.; writing—original draft preparation, J.J. and W.Y.; writing—review and editing, J.J. and W.Y.; visualization, J.J. and W.Y. All authors have read and agreed to the published version of the manuscript.
Funding
This research was supported by the National Natural Science Foundation of China (Grant No. 51908523).
Data Availability Statement
Not applicable.
Conflicts of Interest
The authors declare no conflict of interest.
References
- Finazzi, F. Fulfilling the information need after an earthquake: Statistical modelling of citizen science seismic reports for predicting earthquake parameters in near realtime. J. R. Stat. Soc. Ser. A-Stat. Soc. 2020, 183, 857–882. [Google Scholar] [CrossRef]
- Ozerol, G.; Selcuk, S.A. Machine learning in the discipline of architecture: A review on the research trends between 2014 and 2020. Int. J. Archit. Comput. 2023, 21, 23–41. [Google Scholar] [CrossRef]
- Kumar, V.; Garg, M.L. Deep learning techniques and their applications: A short review. Biosci. Biotechnol. Res. Commun. 2018, 11, 699–709. [Google Scholar] [CrossRef]
- Dyrmann, M.; Karstoft, H.; Midtiby, H.S. Plant species classification using deep convolutional neural network. Biosyst. Biosyst. Eng. 2016, 151, 72–80. [Google Scholar] [CrossRef]
- Coskun, M.; Ucar, A.; Yildirim, O.; Demir, Y.; IEEE. Face Recognition Based on Convolutional Neural Network. In Proceedings of the 2017 International Conference On Modern Electrical And Energy Systems (MEES), Kremenchuk, Ukraine, 15–17 November 2017; pp. 376–379. [Google Scholar]
- Xu, Y.; Wang, Y.; Yuan, J.; Cheng, Q.; Wang, X.; Carson, P.L. Medical breast ultrasound image segmentation by machine learning. Ultrasonics 2019, 91, 1–9. [Google Scholar] [CrossRef] [PubMed]
- Nugraha, B.T.; Su, S.-F.; Fahmizal; IEEE. Towards Self-driving Car Using Convolutional Neural Network and Road Lane Detector. In Proceedings of the 2017 2nd International Conference on Automation, Cognitive Science, Optics, Micro Electro-Mechanical System, and Information Technology (Icacomit), Jakarta, Indonesia, 23–24 October 2017; pp. 65–69. [Google Scholar]
- LeCun, Y.; Bengio, Y.; Hinton, G. Deep learning. Nature 2015, 521, 436–444. [Google Scholar] [CrossRef] [PubMed]
- Xie, Y.; Ebad Sichani, M.; Padgett, J.E.; DesRoches, R. The promise of implementing machine learning in earthquake engineering: A state-of-the-art review. Earthq. Spectra 2020, 36, 1769–1801. [Google Scholar] [CrossRef]
- Bao, Z.; Zhao, J.; Huang, P.; Yong, S.; Wang, X.A. A Deep Learning-Based Electromagnetic Signal for Earthquake Magnitude Prediction. Sensors 2021, 21, 4434. [Google Scholar] [CrossRef]
- Chelidze, T.; Melikadze, G.; Kiria, T.; Jimsheladze, T.; Kobzev, G. Statistical and Non-linear Dynamics Methods of Earthquake Forecast: Application in the Caucasus. Front. Earth Sci. 2020, 8, 194. [Google Scholar] [CrossRef]
- Shao, J.; Tang, L.; Liu, M.; Shao, G.; Sun, L.; Qiu, Q. BDD-Net: A General Protocol for Mapping Buildings Damaged by a Wide Range of Disasters Based on Satellite Imagery. Remote Sens. 2020, 12, 1670. [Google Scholar] [CrossRef]
- Shen, Y.; Zhu, S.; Yang, T.; Chen, C.; Pan, D.; Chen, J.; Xiao, L.; Du, Q. BDANet: Multiscale Convolutional Neural Network with Cross-Directional Attention for Building Damage Assessment from Satellite Images. IEEE Trans. Geosci. Remote Sens. 2022, 60, 1–14. [Google Scholar] [CrossRef]
- Behl, S.; Rao, A.; Aggarwal, S.; Chadha, S.; Pannu, H.S. Twitter for disaster relief through sentiment analysis for COVID-19 and natural hazard crises. Int. J. Disaster Risk Reduct. 2021, 55, 102101. [Google Scholar] [CrossRef]
- Jena, R.; Pradhan, B.; Naik, S.P.; Alamri, A.M. Earthquake risk assessment in NE India using deep learning and geospatial analysis. Geosci. Front. 2021, 12, 10110. [Google Scholar] [CrossRef]
- Bai, Y.; Gao, C.; Singh, S.; Koch, M.; Adriano, B.; Mas, E.; Koshimura, S. A Framework of Rapid Regional Tsunami Damage Recognition from Post-event TerraSAR-X Imagery Using Deep Neural Networks. IEEE Geosci. Remote Sens. Lett. 2018, 15, 43–47. [Google Scholar] [CrossRef]
- Ghorbanzadeh, O.; Meena, S.R.; Shahabi Sorman Abadi, H.; Tavakkoli Piralilou, S.; Zhiyong, L.; Blaschke, T. Landslide Mapping Using Two Main Deep-Learning Convolution Neural Network Streams Combined by the Dempster-Shafer Model. IEEE J. Sel. Top. Appl. Earth Obs. Remote Sens. 2021, 14, 452–463. [Google Scholar] [CrossRef]
- Huang, Y.; Han, X.; Zhao, L. Recurrent neural networks for complicated seismic dynamic response prediction of a slope system. Eng. Geol. 2021, 289, 106198. [Google Scholar] [CrossRef]
- Ma, Z.; Mei, G. Deep learning for geological hazards analysis: Data, models, applications, and opportunities. Earth-Sci. Rev. 2021, 223, 103858. [Google Scholar] [CrossRef]
- Said, N.; Ahmad, K.; Riegler, M.; Pogorelov, K.; Hassan, L.; Ahmad, N.; Conci, N. Natural disasters detection in social media and satellite imagery: A survey. Multimed. Tools Appl. 2019, 78, 31267–31302. [Google Scholar] [CrossRef]
- Dikshit, A.; Pradhan, B.; Alamri, A.M. Pathways and challenges of the application of artificial intelligence to geohazards modelling. Gondwana Res. 2021, 100, 290–301. [Google Scholar] [CrossRef]
- Wu, C.; Li, X.; Chen, W.; Li, X. A Review of Geological Applications of High-Spatial-Resolution Remote Sensing Data. J. Circuits Syst. Comput. 2020, 29, 2030006. [Google Scholar] [CrossRef]
- Zhang, L.; Shen, J.; Zhu, B. A review of the research and application of deep learning-based computer vision in structural damage detection. Earthq. Eng. Eng. Vib. 2022, 21, 1–21. [Google Scholar] [CrossRef]
- Kerle, N.; Nex, F.; Gerke, M.; Duarte, D.; Vetrivel, A. UAV-Based Structural Damage Mapping: A Review. Isprs Int. J. Geo-Inf. 2020, 9, 14. [Google Scholar] [CrossRef]
- Zhong, C.; Liu, Y.; Gao, P.; Chen, W.; Li, H.; Hou, Y.; Nuremanguli, T.; Ma, H. Landslide mapping with remote sensing: Challenges and opportunities. Int. J. Remote Sens. 2020, 41, 1555–1581. [Google Scholar] [CrossRef]
- Mohan, A.; Singh, A.K.; Kumar, B.; Dwivedi, R. Review on remote sensing methods for landslide detection using machine and deep learning. Trans. Emerg. Telecommun. Technol. 2021, 32, e3998. [Google Scholar] [CrossRef]
- Koshimura, S.; Moya, L.; Mas, E.; Bai, Y. Tsunami Damage Detection with Remote Sensing: A Review. Geosciences 2020, 10, 177. [Google Scholar] [CrossRef]
- Jain, N.; Virmani, D.; Abraham, A. Tsunami in the last 15 years: A bibliometric analysis with a detailed overview and future directions. Nat. Hazards 2021, 106, 139–172. [Google Scholar] [CrossRef]
- Bao, H.; Zeng, C.; Peng, Y.; Wu, S. The use of digital technologies for landslide disaster risk research and disaster risk management: Progress and prospects. Environ. Earth Sci. 2022, 81, 1–18. [Google Scholar] [CrossRef]
- Jiao, P.; Alavi, A.H. Artificial intelligence in seismology: Advent, performance and future trends. Geosci. Front. 2020, 11, 739–744. [Google Scholar] [CrossRef]
- Tapeh, A.T.G.; Naser, M.Z. Artificial Intelligence, Machine Learning, and Deep Learning in Structural Engineering: A Scientometrics Review of Trends and Best Practices. Arch. Comput. Methods Eng. 2023, 30, 115–159. [Google Scholar] [CrossRef]
- Matin, S.S.; Pradhan, B. Challenges and limitations of earthquake-induced building damage mapping techniques using remote sensing images-A systematic review. Geocarto Int. 2022, 37, 6186–6212. [Google Scholar] [CrossRef]
- Shokri, M.; Tavakoli, K. A review on the artificial neural network approach to analysis and prediction of seismic damage in infrastructure. Int. J. Hydromechatron. 2019, 2, 178–196. [Google Scholar] [CrossRef]
- Jain, R.; Nayyar, A.; Arora, S.; Gupta, A. A comprehensive analysis and prediction of earthquake magnitude based on position and depth parameters using machine and deep learning models. Multimed. Tools Appl. 2021, 80, 28419–28438. [Google Scholar] [CrossRef]
- Ding, Y.; Chen, J.; Shen, J. Prediction of spectral accelerations of aftershock ground motion with deep learning method. Soil Dyn. Earthq. Eng. 2021, 150, 106951. [Google Scholar] [CrossRef]
- Perol, T.; Gharbi, M.; Denolle, M. Convolutional neural network for earthquake detection and location. Sci. Adv. 2018, 4, e1700578. [Google Scholar] [CrossRef] [PubMed]
- Wu, Y.; Wei, J.; Pan, J.; Chen, P. Research on Microseismic Source Locations Based on Deep Reinforcement Learning. IEEE Access 2019, 7, 39962–39973. [Google Scholar] [CrossRef]
- Wilkins, A.H.; Strange, A.; Duan, Y.; Luo, X. Identifying microseismic events in a mining scenario using a convolutional neural network. Comput. Geosci. 2020, 137, 104418. [Google Scholar] [CrossRef]
- Peng, G.; Tuo, X.; Shen, T.; Lu, J. Recognition of Rock Micro-Fracture Signal Based on Deep Convolution Neural Network Inception Algorithm. IEEE Access 2021, 9, 89390–89399. [Google Scholar] [CrossRef]
- Xu, H.; Zhao, Y.; Yang, T.; Wang, S.; Chang, Y.; Jia, P. An automatic P-wave onset time picking method for mining-induced microseismic data based on long short-term memory deep neural network. Geomat. Nat. Hazards Risk 2022, 13, 908–933. [Google Scholar] [CrossRef]
- Duan, Y.; Shen, Y.; Canbulat, I.; Luo, X.; Si, G. Classification of clustered microseismic events in a coal mine using machine learning. J. Rock Mech. Geotech. Eng. 2021, 13, 1256–1273. [Google Scholar] [CrossRef]
- Zhang, P.; Xu, C.; Ma, S.; Shao, X.; Tian, Y.; Wen, B. Automatic Extraction of Seismic Landslides in Large Areas with Complex Environments Based on Deep Learning: An Example of the 2018 Iburi Earthquake, Japan. Remote Sens. 2020, 12, 3992. [Google Scholar] [CrossRef]
- Li, Y.; Cui, P.; Ye, C.; Marcato Junior, J.; Zhang, Z.; Guo, J.; Li, J. Accurate Prediction of Earthquake-Induced Landslides Based on Deep Learning Considering Landslide Source Area. Remote Sens. 2021, 13, 3436. [Google Scholar] [CrossRef]
- Adriano, B.; Yokoya, N.; Xia, J.; Miura, H.; Liu, W.; Matsuoka, M.; Koshimura, S. Learning from multimodal and multitemporal earth observation data for building damage mapping. ISPRS J. Photogramm. Remote Sens. 2021, 175, 132–143. [Google Scholar] [CrossRef]
- Bai, Y.; Mas, E.; Koshimura, S. Towards Operational Satellite-Based Damage-Mapping Using U-Net Convolutional Network: A Case Study of 2011 Tohoku Earthquake-Tsunami. Remote Sens. 2018, 10, 1626. [Google Scholar] [CrossRef]
- Sublime, J.; Kalinicheva, E. Automatic Post-Disaster Damage Mapping Using Deep-Learning Techniques for Change Detection: Case Study of the Tohoku Tsunami. Remote Sens. 2019, 11, 1123. [Google Scholar] [CrossRef]
- Chen, P.-Y.; Wu, Z.Y.; Taciroglu, E. Classification of Soft-Story Buildings Using Deep Learning with Density Features Extracted from 3D Point Clouds. J. Comput. Civ. Eng. 2021, 35, 04021005. [Google Scholar] [CrossRef]
- Tsuchimoto, K.; Narazaki, Y.; Hoskere, V.; Spencer, B.F. Rapid postearthquake safety evaluation of buildings using sparse acceleration measurements. Struct. Health Monit.-Int. J. 2021, 20, 1822–1840. [Google Scholar] [CrossRef]
- Morales-Valdez, J.; Lopez-Pacheco, M.; Yu, W. Automated damage location for building structures using the hysteretic model and frequency domain neural networks. Struct. Control. Health Monit. 2020, 27, e2584. [Google Scholar] [CrossRef]
- Miao, Z.; Ji, X.; Wu, M.; Gao, X. Deep learning-based evaluation for mechanical property degradation of seismically damaged RC columns. Earthq. Eng. Struct. Dyn. 2022, 52, 2498–2519. [Google Scholar] [CrossRef]
- Yu, D.; He, Z. Digital twin-driven intelligence disaster prevention and mitigation for infrastructure: Advances, challenges, and opportunities. Nat. Hazards 2022, 112, 1–36. [Google Scholar] [CrossRef]
- Naser, M.Z. Enabling cognitive and autonomous infrastructure in extreme events through computer vision. Innov. Infrastruct. Solut. 2020, 5, 1–23. [Google Scholar] [CrossRef]
- Hong, Z.; Yang, F.; Pan, H.; Zhou, R.; Zhang, Y.; Han, Y.; Wang, J.; Yang, S.; Chen, P.; Tong, X.; et al. Highway Crack Segmentation from Unmanned Aerial Vehicle Images Using Deep Learning. IEEE Geosci. Remote Sens. Lett. 2022, 19, 1–5. [Google Scholar] [CrossRef]
- Mangalathu, S.; Jeon, J.-S. Ground Motion-Dependent Rapid Damage Assessment of Structures Based on Wavelet Transform and Image Analysis Techniques. J. Struct. Eng. 2020, 146, 04020230. [Google Scholar] [CrossRef]
- Yoon, S.; Spencer, B.F., Jr.; Lee, S.; Jung, H.-J.; Kim, I.-H. A novel approach to assess the seismic performance of deteriorated bridge structures by employing UAV-based damage detection. Struct. Control. Health Monit. 2022, 29, e2964. [Google Scholar] [CrossRef]
- Bernabe, S.; Gonzalez, C.; Fernandez, A.; Bhangale, U. Portability and Acceleration of Deep Learning Inferences to Detect Rapid Earthquake Damage from VHR Remote Sensing Images Using Intel OpenVINO Toolkit. IEEE J. Sel. Top. Appl. Earth Obs. Remote Sens. 2021, 14, 6906–6915. [Google Scholar] [CrossRef]
- Lu, X.; Xu, Y.; Tian, Y.; Cetiner, B.; Taciroglu, E. A deep learning approach to rapid regional post-event seismic damage assessment using time-frequency distributions of ground motions. Earthq. Eng. Struct. Dyn. 2021, 50, 1612–1627. [Google Scholar] [CrossRef]
- Kim, T.; Song, J.; Kwon, O.-S. Pre- and post-earthquake regional loss assessment using deep learning. Earthq. Eng. Struct. Dyn. 2020, 49, 657–678. [Google Scholar] [CrossRef]
- Dell’Acqua, F.; Gamba, P. Remote Sensing and Earthquake Damage Assessment: Experiences, Limits, and Perspectives. Proc. IEEE 2012, 100, 2876–2890. [Google Scholar] [CrossRef]
- Duarte, D.; Nex, F.; Kerle, N.; Vosselman, G. Multi-Resolution Feature Fusion for Image Classification of Building Damages with Convolutional Neural Networks. Remote Sens. 2018, 10, 1636. [Google Scholar] [CrossRef]
- Nex, F.; Duarte, D.; Tonolo, F.G.; Kerle, N. Structural Building Damage Detection with Deep Learning: Assessment of a State-of-the-Art CNN in Operational Conditions. Remote Sens. 2019, 11, 2765. [Google Scholar] [CrossRef]
- Kerle, N. Satellite-based damage mapping following the 2006 Indonesia earthquake-How accurate was it? Int. J. Appl. Earth Obs. Geoinf. 2010, 12, 466–476. [Google Scholar] [CrossRef]
- Brunner, D.; Lemoine, G.; Bruzzone, L. Earthquake Damage Assessment of Buildings Using VHR Optical and SAR Imagery. IEEE Trans. Geosci. Remote Sens. 2010, 48, 2403–2420. [Google Scholar] [CrossRef]
- Nava, L.; Bhuyan, K.; Meena, S.R.; Monserrat, O.; Catani, F. Rapid Mapping of Landslides on SAR Data by Attention U-Net. Remote Sens. 2022, 14, 1449. [Google Scholar] [CrossRef]
- Yang, F.; Jiang, Z.; Ren, J.; Lv, J. Monitoring, Prediction, and Evaluation of Mountain Geological Hazards Based on InSAR Technology. Sci. Program. 2022, 2022, 1–12. [Google Scholar] [CrossRef]
- Zhang, X.; Zeng, Q.; Jiao, J.; Zhang, J. Fusion of space-borne multi-baseline and multi-frequency interferometric results based on extended Kalman filter to generate high quality DEMs. ISPRS J. Photogramm. Remote Sens. 2016, 111, 32–44. [Google Scholar] [CrossRef]
- Shakeel, A.; Walters, R.J.; Ebmeier, S.K.; Al Moubayed, N. ALADDIn: Autoencoder-LSTM-Based Anomaly Detector of Deformation in InSAR. IEEE Trans. Geosci. Remote Sens. 2022, 60, 1–12. [Google Scholar] [CrossRef]
- Duarte, D.; Nex, F.; Kerle, N.; Vosselman, G. Detection of seismic facade damages with multi-temporal oblique aerial imagery. Giscience Remote Sens. 2020, 57, 670–686. [Google Scholar] [CrossRef]
- Xiu, H.; Shinohara, T.; Matsuoka, M.; Inoguchi, M.; Kawabe, K.; Horie, K. Collapsed Building Detection Using 3D Point Clouds and Deep Learning. Remote Sens. 2020, 12, 4057. [Google Scholar] [CrossRef]
- Seydi, S.T.; Rastiveis, H.; Kalantar, B.; Halin, A.A.; Ueda, N. BDD-Net: An End-to-End Multiscale Residual CNN for Earthquake-Induced Building Damage Detection. Remote Sens. 2022, 14, 2214. [Google Scholar] [CrossRef]
- Yang, C.; Guo, K.; Zhang, S.; Huang, Z. Status quo of China earthquake networks and analyses on its early warning capacity. Acta Seismol. Sin. 2015, 37, 508–515. [Google Scholar]
- Okada, Y.; Kasahara, K.; Hori, S.; Obara, K.; Sekiguchi, S.; Fujiwara, H.; Yamamoto, A. Recent progress of seismic observation networks in Japan—Hi-net, F-net, K-NET and KiK-net. Earth Planets Space 2004, 56, XV. [Google Scholar] [CrossRef]
- Mousavi, S.M.; Sheng, Y.; Zhu, W.; Beroza, G.C. STanford EArthquake Dataset (STEAD): A Global Data Set of Seismic Signals for AI. IEEE Access 2019, 7, 179464–179476. [Google Scholar] [CrossRef]
- Goulet, C.A.; Kishida, T.; Ancheta, T.D.; Cramer, C.H.; Darragh, R.B.; Silva, W.J.; Hashash, Y.M.A.; Harmon, J.; Parker, G.A.; Stewart, J.P.; et al. PEER NGA-East database. Earthq. Spectra 2021, 37, 1331–1353. [Google Scholar] [CrossRef]
- Haddadi, H.; Shakal, A.; Stephens, C.; Savage, W.; Huang, M.; Leith, W.; Parrish, J.; Borcherdt, R. Center for engineering strong-motion data (cesmd). In Proceedings of the 14th World Conference on Earthquake Engineering, Beijing, China, 12–17 October 2008; pp. 12–17. [Google Scholar]
- Yuan, X.; Tanksley, D.; Li, L.; Zhang, H.; Chen, G.; Wunsch, D. Faster Post-Earthquake Damage Assessment Based on 1D Convolutional Neural Networks. Appl. Sci. 2021, 11, 9844. [Google Scholar] [CrossRef]
- Yuan, X.; Tanksley, D.; Jiao, P.; Li, L.; Chen, G.; Wunsch, D. Encoding Time-Series Ground Motions as Images for Convolutional Neural Networks-Based Seismic Damage Evaluation. Front. Built Environ. 2021, 7, 660103. [Google Scholar] [CrossRef]
- Jena, R.; Pradhan, B.; Al-Amri, A.; Lee, C.W.; Park, H.-J. Earthquake Probability Assessment for the Indian Subcontinent Using Deep Learning. Sensors 2020, 20, 4369. [Google Scholar] [CrossRef]
- Jena, R.; Pradhan, B.; Alamri, A.M. Susceptibility to Seismic Amplification and Earthquake Probability Estimation Using Recurrent Neural Network (RNN) Model in Odisha, India. Appl. Sci. 2020, 10, 5355. [Google Scholar] [CrossRef]
- Bilal, M.A.; Ji, Y.; Wang, Y.; Akhter, M.P.; Yaqub, M. Early Earthquake Detection Using Batch Normalization Graph Convolutional Neural Network (BNGCNN). Appl. Sci. 2022, 12, 7548. [Google Scholar] [CrossRef]
- Yu, Y.; Wang, C.; Gu, X.; Li, J. A novel deep learning-based method for damage identification of smart building structures. Struct. Health Monit.-Int. J. 2019, 18, 143–163. [Google Scholar] [CrossRef]
- Asif, A.; Khatoon, S.; Hasan, M.M.; Alshamari, M.A.; Abdou, S.; Elsayed, K.M.; Rashwan, M. Automatic analysis of social media images to identify disaster type and infer appropriate emergency response. J. Big Data 2021, 8, 1–28. [Google Scholar] [CrossRef]
- Ahadzadeh, S.; Malek, M.R. Earthquake Damage Assessment in Three Spatial Scale Using Naive Bayes, SVM, and Deep Learning Algorithms. Appl. Sci. 2021, 11, 9737. [Google Scholar] [CrossRef]
- Alzubaidi, L.; Zhang, J.; Humaidi, A.J.; Al-Dujaili, A.; Duan, Y.; Al-Shamma, O.; Santamaria, J.; Fadhel, M.A.; Al-Amidie, M.; Farhan, L. Review of deep learning: Concepts, CNN architectures, challenges, applications, future directions. J. Big Data 2021, 8, 1–74. [Google Scholar] [CrossRef]
- Huang, G.; Liu, Z.; van der Maaten, L.; Weinberger, K.Q.; IEEE. Densely Connected Convolutional Networks. In Proceedings of the 30 th IEEE Conference on Computer Vision and Pattern Recognition (CVPR 2017), Honolulu, Hawaii, 21–26 July 2017; pp. 2261–2269. [Google Scholar]
- Khan, A.; Sohail, A.; Zahoora, U.; Qureshi, A.S. A survey of the recent architectures of deep convolutional neural networks. Artif. Intell. Rev. 2020, 53, 5455–5516. [Google Scholar] [CrossRef]
- Wang, W.; Yang, Y.; Wang, X.; Wang, W.; Li, J. Development of convolutional neural network and its application in image classification: A survey. Opt. Eng. 2019, 58, 040901. [Google Scholar] [CrossRef]
- Wang, W.; Hu, Y.; Zou, T.; Liu, H.; Wang, J.; Wang, X. A New Image Classification Approach via Improved MobileNet Models with Local Receptive Field Expansion in Shallow Layers. Comput. Intell. Neurosci. 2020, 2020, 1–10. [Google Scholar] [CrossRef]
- Yeum, C.M.; Dyke, S.J.; Ramirez, J. Visual data classification in post-event building reconnaissance. Eng. Struct. 2018, 155, 16–24. [Google Scholar] [CrossRef]
- Chen, F.; Yu, B. Earthquake-Induced Building Damage Mapping Based on Multi-Task Deep Learning Framework. IEEE Access 2019, 7, 181396–181404. [Google Scholar] [CrossRef]
- Song, D.; Tan, X.; Wang, B.; Zhang, L.; Shan, X.; Cui, J. Integration of super-pixel segmentation and deep-learning methods for evaluating earthquake-damaged buildings using single-phase remote sensing imagery. Int. J. Remote Sens. 2020, 41, 1040–1066. [Google Scholar] [CrossRef]
- Gu, J.; Wang, Z.; Kuen, J.; Ma, L.; Shahroudy, A.; Shuai, B.; Liu, T.; Wang, X.; Wang, G.; Cai, J.; et al. Recent advances in convolutional neural networks. Pattern Recognit. 2018, 77, 354–377. [Google Scholar] [CrossRef]
- Russakovsky, O.; Deng, J.; Su, H.; Krause, J.; Satheesh, S.; Ma, S.; Huang, Z.; Karpathy, A.; Khosla, A.; Bernstein, M.; et al. ImageNet Large Scale Visual Recognition Challenge. Int. J. Comput. Vis. 2015, 115, 211–252. [Google Scholar] [CrossRef]
- Yang, T.; Xie, J.; Li, G.; Mou, N.; Li, Z.; Tian, C.; Zhao, J. Social Media Big Data Mining and Spatio-Temporal Analysis on Public Emotions for Disaster Mitigation. ISPRS Int. J. Geo-Inf. 2019, 8, 29. [Google Scholar] [CrossRef]
- Xing, Z.; Zhang, X.; Zan, X.; Xiao, C.; Li, B.; Han, K.; Liu, Z.; Liu, J. Crowdsourced social media and mobile phone signaling data for disaster impact assessment: A case study of the 8.8 Jiuzhaigou earthquake. Int. J. Disaster Risk Reduct. 2021, 58, 102200. [Google Scholar] [CrossRef]
- Fayaz, J.; Galasso, C. A deep neural network framework for real-time on-site estimation of acceleration response spectra of seismic ground motions. Comput.-Aided Civ. Infrastruct. Eng. 2023, 38, 87–103. [Google Scholar] [CrossRef]
- Su, Y.; Rong, G.; Ma, Y.; Chi, J.; Liu, X.; Zhang, J.; Li, T. Hazard Assessment of Earthquake Disaster Chains Based on Deep Learning-A Case Study of Mao County, Sichuan Province. Front. Earth Sci. 2022, 9, 683903. [Google Scholar] [CrossRef]
- Kim, T.; Song, J.; Kwon, O.-S. Probabilistic evaluation of seismic responses using deep learning method. Struct. Saf. 2020, 84, 101913. [Google Scholar] [CrossRef]
- Wang, L.; Chen, W.; Yang, W.; Bi, F.; Yu, F.R. A State-of-the-Art Review on Image Synthesis with Generative Adversarial Networks. IEEE Access 2020, 8, 63514–63537. [Google Scholar] [CrossRef]
- Ding, Y.; Chen, J.; Shen, J. Conditional generative adversarial network model for simulating intensity measures of aftershocks. Soil Dyn. Earthq. Eng. 2020, 139, 106281. [Google Scholar] [CrossRef]
- Tilon, S.; Nex, F.; Kerle, N.; Vosselman, G. Post-Disaster Building Damage Detection from Earth Observation Imagery Using Unsupervised and Transferable Anomaly Detecting Generative Adversarial Networks. Remote Sens. 2020, 12, 4193. [Google Scholar] [CrossRef]
- Shakeel, M.; Nishida, K.; Itoyama, K.; Nakadai, K. 3D Convolution Recurrent Neural Networks for Multi-Label Earthquake Magnitude Classification. Appl. Sci. 2022, 12, 2195. [Google Scholar] [CrossRef]
- Eliguzel, N.; Cetinkaya, C.; Dereli, T. Application of named entity recognition on tweets during earthquake disaster: A deep learning-based approach. Soft Comput. 2022, 26, 395–421. [Google Scholar] [CrossRef]
- Jena, R.; Naik, S.P.; Pradhan, B.; Beydoun, G.; Park, H.-J.; Alamri, A. Earthquake vulnerability assessment for the Indian subcontinent using the Long Short-Term Memory model (LSTM). Int. J. Disaster Risk Reduct. 2021, 66, 102642. [Google Scholar] [CrossRef]
- Pan, S.J.; Yang, Q. A Survey on Transfer Learning. IEEE Trans. Knowl. Data Eng. 2010, 22, 1345–1359. [Google Scholar] [CrossRef]
- Xu, Z.; Chen, Y.; Yang, F.; Chu, T.; Zhou, H. A Postearthquake Multiple Scene Recognition Model Based on Classical SSD Method and Transfer Learning. ISPRS Int. J. Geo-Inf. 2020, 9, 238. [Google Scholar] [CrossRef]
- Aslam, B.; Zafar, A.; Khalil, U. Development of integrated deep learning and machine learning algorithm for the assessment of landslide hazard potential. Soft Comput. 2021, 25, 13493–13512. [Google Scholar] [CrossRef]
- Eshkevari, S.S.; Takac, M.; Pakzad, S.N.; Jahani, M. DynNet: Physics-based neural architecture design for nonlinear structural response modeling and prediction. Eng. Struct. 2021, 229, 111582. [Google Scholar] [CrossRef]
- Zhang, R.; Liu, Y.; Sun, H. Physics-guided convolutional neural network (PhyCNN) for data-driven seismic response modeling. Eng. Struct. 2020, 215, 110704. [Google Scholar] [CrossRef]
- Wang, Q.; Guo, Y.; Yu, L.; Li, P. Earthquake Prediction Based on Spatio-Temporal Data Mining: An LSTM Network Approach. IEEE Trans. Emerg. Top. Comput. 2020, 8, 148–158. [Google Scholar] [CrossRef]
- Kannan, S. Innovative Mathematical Model for Earthquake Prediction. Eng. Fail. Anal. 2014, 41, 89–95. [Google Scholar] [CrossRef]
- Dovbnya, B.V. On observation of ulf electromagnetic signals from remote earthquakes and distribution of their sources on the earth’s surface. Geodyn. Tectonophys. 2021, 12, 563–569. [Google Scholar] [CrossRef]
- Sekertekin, A.; Inyurt, S.; Yaprak, S. Pre-seismic ionospheric anomalies and spatio-temporal analyses of MODIS Land surface temperature and aerosols associated with 24 September 2013 Pakistan Earthquake. J. Atmos. Sol.-Terr. Phys. 2020, 200, 105218. [Google Scholar] [CrossRef]
- Zhao, S.; Shen, X.; Liao, L.; Zeren, Z. A lithosphere-atmosphere-ionosphere coupling model for ELF electromagnetic waves radiated from seismic sources and its possibility observed by the CSES. Sci. China-Technol. Sci. 2021, 64, 2551–2559. [Google Scholar] [CrossRef]
- Ding, Y.; Qi, Y.; Wu, L.; Mao, W.; Liu, Y. Discriminating the Multi-Frequency Microwave Brightness Temperature Anomalies Relating to 2017 Mw 7.3 Sarpol Zahab (Iran-Iraq Border) Earthquake. Front. Earth Sci. 2021, 9, 656216. [Google Scholar] [CrossRef]
- Samui, P.; Kim, D. Determination of reservoir induced earthquake using support vector machine and gaussian process regression. Appl. Geophys. 2013, 10, 229–234. [Google Scholar] [CrossRef]
- Kuang, W.; Yuan, C.; Zhang, J. Network-Based Earthquake Magnitude Determination via Deep Learning. Seismol. Res. Lett. 2021, 92, 2245–2254. [Google Scholar] [CrossRef]
- Silva-Lopez, R.; Baker, J.W.; Poulos, A. Deep Learning-Based Retrofitting and Seismic Risk Assessment of Road Networks. J. Comput. Civ. Eng. 2022, 36, 04021038. [Google Scholar] [CrossRef]
- Pelizari, P.A.; Geiss, C.; Aguirre, P.; Santa Maria, H.; Merino Pena, Y.; Taubenboeck, H. Automated building characterization for seismic risk assessment using street-level imagery and deep learning. ISPRS J. Photogramm. Remote Sens. 2021, 180, 370–386. [Google Scholar] [CrossRef]
- Jena, R.; Pradhan, B.; Beydoun, G.; Alamri, A.M.; Ardiansyah; Nizamuddin; Sofyan, H. Earthquake hazard and risk assessment using machine learning approaches at Palu, Indonesia. Sci. Total Environ. 2020, 749, 141582. [Google Scholar] [CrossRef] [PubMed]
- Mariniello, G.; Pastore, T.; Menna, C.; Festa, P.; Asprone, D. Structural damage detection and localization using decision tree ensemble and vibration data. Comput.-Aided Civ. Infrastruct. Eng. 2021, 36, 1129–1149. [Google Scholar] [CrossRef]
- Zou, D.; Zhang, M.; Bai, Z.; Liu, T.; Zhou, A.; Wang, X.; Cui, W.; Zhang, S. Multicategory damage detection and safety assessment of post-earthquake reinforced concrete structures using deep learning. Comput.-Aided Civ. Infrastruct. Eng. 2022, 37, 1188–1204. [Google Scholar] [CrossRef]
- Ghahremani, B.; Bitaraf, M.; Ghorbani-Tanha, A.K.; Fallahi, R. Structural damage identification based on fast S-transform and convolutional neural networks. Structures 2021, 29, 1199–1209. [Google Scholar] [CrossRef]
- Kalantar, B.; Ueda, N.; Al-Najjar, H.A.H.; Halin, A.A. Assessment of Convolutional Neural Network Architectures for Earthquake-Induced Building Damage Detection based on Pre- and Post-Event Orthophoto Images. Remote Sens. 2020, 12, 3529. [Google Scholar] [CrossRef]
- Amezquita-Sanchez, J.P.; Adeli, H. A new music-empirical wavelet transform methodology for time-frequency analysis of noisy nonlinear and non-stationary signals. Digit. Signal Process. 2015, 45, 55–68. [Google Scholar] [CrossRef]
- Ahmadi, H.R.; Mahdavi, N.; Bayat, M. A new index based on short time fourier transform for damage detection in bridge piers. Comput. Concr. 2021, 27, 447–455. [Google Scholar] [CrossRef]
- Shi, L.; Zhang, F.; Xia, J.; Xie, J.; Zhang, Z.; Du, Z.; Liu, R. Identifying Damaged Buildings in Aerial Images Using the Object Detection Method. Remote Sens. 2021, 13, 4213. [Google Scholar] [CrossRef]
- Kriegerowski, M.; Petersen, G.M.; Vasyura-Bathke, H.; Ohrnberger, M. A Deep Convolutional Neural Network for Localization of Clustered Earthquakes Based on Multistation Full Waveforms. Seismol. Res. Lett. 2019, 90, 510–516. [Google Scholar] [CrossRef]
- Zhang, X.; Zhang, J.; Yuan, C.; Liu, S.; Chen, Z.; Li, W. Locating induced earthquakes with a network of seismic stations in Oklahoma via a deep learning method. Sci. Rep. 2020, 10, 1941. [Google Scholar] [CrossRef]
- Yang, B.; Wang, S.; Zhou, Y.; Wang, F.; Hu, Q.; Chang, Y.; Zhao, Q. Extraction of road blockage information for the Jiuzhaigou earthquake based on a convolution neural network and very-high-resolution satellite images. Earth Sci. Inform. 2020, 13, 115–127. [Google Scholar] [CrossRef]
- Xing, Z.; Su, X.; Liu, J.; Su, W.; Zhang, X. Spatiotemporal Change Analysis of Earthquake Emergency Information Based on Microblog Data: A Case Study of the “8.8” Jiuzhaigou Earthquake. ISPRS Int. J. Geo-Inf. 2019, 8, 359. [Google Scholar] [CrossRef]
- Li, J.; Sun, A.; Han, J.; Li, C. A Survey on Deep Learning for Named Entity Recognition. IEEE Trans. Knowl. Data Eng. 2022, 34, 50–70. [Google Scholar] [CrossRef]
- Qian, F.; Liu, Z.; Wang, Y.; Zhou, Y.; Hu, G. Ground Truth-Free 3-D Seismic Random Noise Attenuation via Deep Tensor Convolutional Neural Networks in the Time-Frequency Domain. IEEE Trans. Geosci. Remote Sens. 2022, 60, 1–17. [Google Scholar] [CrossRef]
- Dong, X.; Lin, J.; Lu, S.; Wang, H.; Li, Y. Multiscale Spatial Attention Network for Seismic Data Denoising. IEEE Trans. Geosci. Remote Sens. 2022, 60, 1–17. [Google Scholar] [CrossRef]
- Zhou, H.; Guo, Y.; Guo, K. Seismic Random Noise Attenuation Using a Tied-Weights Autoencoder Neural Network. Minerals 2021, 11, 1089. [Google Scholar] [CrossRef]
- Siahkoohi, A.; Rizzuti, G.; Herrmann, F.J. Deep Bayesian inference for seismic imaging with tasks. Geophysics 2022, 87, S281–S302. [Google Scholar] [CrossRef]
- Habumugisha, J.M.; Chen, N.; Rahman, M.; Islam, M.M.; Ahmad, H.; Elbeltagi, A.; Sharma, G.; Liza, S.N.; Dewan, A. Landslide Susceptibility Mapping with Deep Learning Algorithms. Sustainability 2022, 14, 1734. [Google Scholar] [CrossRef]
- Liu, R.; Yang, X.; Xu, C.; Wei, L.; Zeng, X. Comparative Study of Convolutional Neural Network and Conventional Machine Learning Methods for Landslide Susceptibility Mapping. Remote Sens. 2022, 14, 321. [Google Scholar] [CrossRef]
- Yang, X.; Liu, R.; Yang, M.; Chen, J.; Liu, T.; Yang, Y.; Chen, W.; Wang, Y. Incorporating Landslide Spatial Information and Correlated Features among Conditioning Factors for Landslide Susceptibility Mapping. Remote Sens. 2021, 13, 2166. [Google Scholar] [CrossRef]
- Gao, Z.; Ding, M. Application of convolutional neural network fused with machine learning modeling framework for geospatial comparative analysis of landslide susceptibility. Nat. Hazards 2022, 113, 833–858. [Google Scholar] [CrossRef]
- Wei, R.; Ye, C.; Sui, T.; Ge, Y.; Li, Y.; Li, J. Combining spatial response features and machine learning classifiers for landslide susceptibility mapping. Int. J. Appl. Earth Obs. Geoinf. 2022, 107, 102681. [Google Scholar] [CrossRef]
- Chowdhuri, I.; Pal, S.C.; Janizadeh, S.; Saha, A.; Ahmadi, K.; Chakrabortty, R.; Islam, A.R.M.T.; Roy, P.; Shit, M. Application of novel deep boosting framework-based earthquake induced landslide hazards prediction approach in Sikkim Himalaya. Geocarto Int. 2022, 37, 12509–12535. [Google Scholar] [CrossRef]
- Yang, Z.; Xu, C. Efficient Detection of Earthquake-Triggered Landslides Based on U-Net plus plus: An Example of the 2018 Hokkaido Eastern Iburi (Japan) Mw=6.6 Earthquake. Remote Sens. 2022, 14, 2826. [Google Scholar] [CrossRef]
- Yu, B.; Xu, C.; Chen, F.; Wang, N.; Wang, L. HADeenNet: A hierarchical-attention multi-scale deconvolution network for landslide detection. Int. J. Appl. Earth Obs. Geoinf. 2022, 111, 102853. [Google Scholar] [CrossRef]
- Yang, R.; Zhang, F.; Xia, J.; Wu, C. Landslide Extraction Using Mask R-CNN with Background-Enhancement Method. Remote Sens. 2022, 14, 2206. [Google Scholar] [CrossRef]
- Tsuchimoto, K.; Narazaki, Y.; Spencer, B.F., Jr. Development and Validation of a Post-Earthquake Safety Assessment System for High-Rise Buildings Using Acceleration Measurements. Mathematics 2021, 9, 1758. [Google Scholar] [CrossRef]
- Mangalathu, S.; Burton, H.V. Deep learning-based classification of earthquake-impacted buildings using textual damage descriptions. Int. J. Disaster Risk Reduct. 2019, 36, 101111. [Google Scholar] [CrossRef]
- Grünthal, G. European Macroseismic Scale 1998; European Seismological Commission (ESC): Valletta, Malta, 1998. [Google Scholar]
- Kawai, A. Photo Album: Buildings Destructed in the Great Earthquake; Dai-San-Shokan: Tokyo, Japan, 1995; pp. 1–207. [Google Scholar]
- Okada, S.; Takai, N. Classifications of structural types and damage patterns of buildings for earthquake field investigation. J. Struct. Constr. Eng. 2000, 64, 65–72. [Google Scholar] [CrossRef]
- Wang, Y.; Cui, L.; Zhang, C.; Chen, W.; Xu, Y.; Zhang, Q. A Two-Stage Seismic Damage Assessment Method for Small, Dense, and Imbalanced Buildings in Remote Sensing Images. Remote Sens. 2022, 14, 1012. [Google Scholar] [CrossRef]
- Kaplan, O.; Kaplan, G. Response Spectra-Based Post-Earthquake Rapid Structural Damage Estimation Approach Aided with Remote Sensing Data: 2020 Samos Earthquake. Buildings 2022, 12, 14. [Google Scholar] [CrossRef]
- Jia, H.; Lin, J.; Liu, J. An Earthquake Fatalities Assessment Method Based on Feature Importance with Deep Learning and Random Forest Models. Sustainability 2019, 11, 2727. [Google Scholar] [CrossRef]
- Ji, M.; Liu, L.; Du, R.; Buchroithner, M.F. A Comparative Study of Texture and Convolutional Neural Network Features for Detecting Collapsed Buildings After Earthquakes Using Pre- and Post-Event Satellite Imagery. Remote Sens. 2019, 11, 1202. [Google Scholar] [CrossRef]
- Buda, M.; Maki, A.; Mazurowski, M.A. A systematic study of the class imbalance problem in convolutional neural networks. Neural Netw. 2018, 106, 249–259. [Google Scholar] [CrossRef]
- Sagi, O.; Rokach, L. Ensemble learning: A survey. Wiley Interdiscip. Rev.-Data Min. Knowl. Discov. 2018, 8, e1249. [Google Scholar] [CrossRef]
- Ci, T.; Liu, Z.; Wang, Y. Assessment of the Degree of Building Damage Caused by Disaster Using Convolutional Neural Networks in Combination with Ordinal Regression. Remote Sens. 2019, 11, 2858. [Google Scholar] [CrossRef]
- Cheng, G.; Han, J.; Lu, X. Remote Sensing Image Scene Classification: Benchmark and State of the Art. Proc. IEEE 2017, 105, 1865–1883. [Google Scholar] [CrossRef]
- Reichstein, M.; Camps-Valls, G.; Stevens, B.; Jung, M.; Denzler, J.; Carvalhais, N.; Prabhat. Deep learning and process understanding for data-driven Earth system science. Nature 2019, 566, 195–204. [Google Scholar] [CrossRef] [PubMed]
- Gärdenfors, P.; Sahlin, N.-E. Unreliable probabilities, risk taking, and decision making. Synthese 1982, 53, 361–386. [Google Scholar] [CrossRef]
- Abbaszadeh Shahri, A.; Shan, C.; Larsson, S. A Novel Approach to Uncertainty Quantification in Groundwater Table Modeling by Automated Predictive Deep Learning. Nat. Resour. Res. 2022, 31, 1351–1373. [Google Scholar] [CrossRef]
- Ji, S.; Pan, S.; Cambria, E.; Marttinen, P.; Yu, P.S. A Survey on Knowledge Graphs: Representation, Acquisition, and Applications. IEEE Trans. Neural Netw. Learn. Syst. 2022, 33, 494–514. [Google Scholar] [CrossRef]
- Aamir, M.; Ali, T.; Irfan, M.; Shaf, A.; Azam, M.Z.; Glowacz, A.; Brumercik, F.; Glowacz, W.; Alqhtani, S.; Rahman, S. Natural Disasters Intensity Analysis and Classification Based on Multispectral Images Using Multi-Layered Deep Convolutional Neural Network. Sensors 2021, 21, 2648. [Google Scholar] [CrossRef]
- An, L.; Zhang, J. Impact of Urbanization on Seismic Risk: A Study Based on Remote Sensing Data. Sustainability 2022, 14, 6132. [Google Scholar] [CrossRef]
- Bai, H.; Yu, H.; Yu, G.; Rocha, A.; Huang, X. Analysis on an Auto Increment Detection System of Chinese Disaster Weibo Text. J. Univers. Comput. Sci. 2020, 27, 230–252. [Google Scholar] [CrossRef]
- Chen, J.; Cho, Y.K. CrackEmbed: Point feature embedding for crack segmentation from disaster site point clouds with anomaly detection. Adv. Eng. Inform. 2022, 52, 101550. [Google Scholar] [CrossRef]
- Chowdhuri, I.; Pal, S.C.; Saha, A.; Chakrabortty, R.; Roy, P. Mapping of earthquake hotspot and coldspot zones for identifying potential landslide hotspot areas in the Himalayan region. Bull. Eng. Geol. Environ. 2022, 81, 257. [Google Scholar] [CrossRef]
- Di, H.; Li, Z.; Abubakar, A. Using relative geologic time to constrain convolutional neural network-based seismic interpretation and property estimation. Geophysics 2022, 87, IM25–IM35. [Google Scholar] [CrossRef]
- Ertuncay, D.; De Lorenzo, A.; Costa, G. Identification of Near-Fault Impulsive Signals and Their Initiation and Termination Positions with Convolutional Neural Networks. Geosciences 2021, 11, 388. [Google Scholar] [CrossRef]
- Fayaz, J.; Galasso, C. A generalized ground-motion model for consistent mainshock-aftershock intensity measures using successive recurrent neural networks. Bull. Earthq. Eng. 2022, 20, 6467–6486. [Google Scholar] [CrossRef]
- Hong, S.; Huyen-Tram, N.; Jung, J.; Ahn, J. Seismic Ground Response Estimation Based on Convolutional Neural Networks (CNN). Appl. Sci. -Basel 2021, 11, 10760. [Google Scholar] [CrossRef]
- Kuang, W.; Yuan, C.; Zhang, J. Real-time determination of earthquake focal mechanism via deep learning. Nat. Commun. 2021, 12, 1432. [Google Scholar] [CrossRef]
- Laurenti, L.; Tinti, E.; Galasso, F.; Franco, L.; Marone, C. Deep learning for laboratory earthquake prediction and autoregressive forecasting of fault zone stress. Earth Planet. Sci. Lett. 2022, 598, 117825. [Google Scholar] [CrossRef]
- Li, C.; Ji, D.; Zhai, C.; Ma, Y.; Xie, L. Vertical ground motion model for the NGA-West2 database using deep learning method. Soil Dyn. Earthq. Eng. 2023, 165, 107713. [Google Scholar] [CrossRef]
- Liao, W.-Y.; Lee, E.-J.; Mu, D.; Chen, P. Toward Fully Autonomous Seismic Networks: Backprojecting Deep Learning-Based Phase Time Functions for Earthquake Monitoring on Continuous Recordings. Seismol. Res. Lett. 2022, 93, 1880–1894. [Google Scholar] [CrossRef]
- Lilienkamp, H.; von Specht, S.; Weatherill, G.; Caire, G.; Cotton, F. Ground-Motion Modeling as an Image Processing Task: Introducing a Neural Network Based, Fully Data-Driven, and Nonergodic. Bull. Seismol. Soc. Am. 2022, 112, 1565–1582. [Google Scholar] [CrossRef]
- Matinfar, M.; Khaji, N.; Ahmadi, G. Deep convolutional generative adversarial networks for the generation of numerous artificial spectrum-compatible earthquake accelerograms using a limited number of ground motion records. Comput. -Aided Civ. Infrastruct. Eng. 2023, 38, 225–240. [Google Scholar] [CrossRef]
- Morisaki, Y.; Fujiu, M.; Suwa, T.; Furuta, R.; Takayama, J. Detection of Location from Kits Set Up by Vulnerable People during Earthquake Disasters with Communication Blackout: Study Using YOLOv5 Algorithm. Sustainability 2022, 14, 13895. [Google Scholar] [CrossRef]
- Ren, J.; Zhou, S.; Wang, J.; Yang, S.; Liu, C. Research on Identification of Natural and Unnatural Earthquake Events Based on AlexNet Convolutional Neural Network. Wirel. Commun. Mob. Comput. 2022, 2022, 1–9. [Google Scholar] [CrossRef]
- Sadhukhan, B.; Chakraborty, S.; Mukherjee, S. Predicting the magnitude of an impending earthquake using deep learning techniques. Earth Sci. Inform. 2022, 16, 803–823. [Google Scholar] [CrossRef]
- Shokouhi, P.; Girkar, V.; Riviere, J.; Shreedharan, S.; Marone, C.; Giles, C.L.; Kifer, D. Deep Learning Can Predict Laboratory Quakes From Active Source Seismic Data. Geophys. Res. Lett. 2021, 48, e2021GL093187. [Google Scholar] [CrossRef]
- Vemula, S.; Sreejaya, K.P.; Raghukanth, S.T.G. Neural Network-Based Subduction Ground Motion Model and Its Application to New Zealand and the Andaman and Nicobar Islands. J. Earthq. Eng. 2022, 27, 2863–2886. [Google Scholar] [CrossRef]
- Yang, X.; Chen, Y.; Teng, S.; Chen, G. A Novel Method for Predicting Local Site Amplification Factors Using 1-D Convolutional Neural Networks. Appl. Sci. 2021, 11, 11650. [Google Scholar] [CrossRef]
- Zhang, S.; Ku, B.; Ko, H. Learnable Maximum Amplitude Structure for Earthquake Event Classification. IEEE Geosci. Remote Sens. Lett. 2022, 19, 3005805. [Google Scholar] [CrossRef]
- Muenchmeyer, J.; Bindi, D.; Leser, U.; Tilmann, F. The transformer earthquake alerting model: A new versatile approach to earthquake early warning. Geophys. J. Int. 2021, 225, 646–656. [Google Scholar] [CrossRef]
- Aguilera, Q.; Lombardo, L.; Tanyas, H.; Lipani, A. On the prediction of landslide occurrences and sizes via Hierarchical Neural Networks. Stoch. Environ. Res. Risk Assess. 2022, 36, 2031–2048. [Google Scholar] [CrossRef]
- Fu, L.; Zhang, Q.; Wang, T.; Li, W.; Xu, Q.; Ge, D. Detecting slow-moving landslides using InSAR phase-gradient stacking and deep-learning network. Front. Environ. Sci. 2022, 10, 963322. [Google Scholar] [CrossRef]
- Fu, R.; He, J.; Liu, G.; Li, W.; Mao, J.; He, M.; Lin, Y. Fast Seismic Landslide Detection Based on Improved Mask R-CNN. Remote Sens. 2022, 14, 3928. [Google Scholar] [CrossRef]
- Ghorbanzadeh, O.; Blaschke, T.; Gholamnia, K.; Meena, S.R.; Tiede, D.; Aryal, J. Evaluation of Different Machine Learning Methods and Deep-Learning Convolutional Neural Networks for Landslide Detection. Remote Sens. 2019, 11, 196. [Google Scholar] [CrossRef]
- Liu, P.; Wei, Y.; Wang, Q.; Xie, J.; Chen, Y.; Li, Z.; Zhou, H. A Research on Landslides Automatic Extraction Model Based on the Improved Mask R-CNN. ISPRS Int. J. Geo-Inf. 2021, 10, 168. [Google Scholar] [CrossRef]
- Pang, D.; Liu, G.; He, J.; Li, W.; Fu, R. Automatic Remote Sensing Identification of Co-Seismic Landslides Using Deep Learning Methods. Forests 2022, 13, 1213. [Google Scholar] [CrossRef]
- Qiao, H.; Wa, X.; Wan, Y.; Li, S.; Zhang, W. A Novel Change Detection Method for Natural Disaster Detection and Segmentation from Video Sequence. Sensors 2020, 20, 5076. [Google Scholar] [CrossRef]
- Tang, X.; Tu, Z.; Wang, Y.; Liu, M.; Li, D.; Fan, X. Automatic Detection of Coseismic Landslides Using a New Transformer Method. Remote Sens. 2022, 14, 2884. [Google Scholar] [CrossRef]
- Wang, S.; Lin, X.; Qi, X.; Li, H.; Yang, J. Landslide susceptibility analysis based on a PSO-DBN prediction model in an earthquake-stricken area. Front. Environ. Sci. 2022, 10, 912523. [Google Scholar] [CrossRef]
- Xiong, Y.; Zhou, Y.; Wang, F.; Wang, S.; Wang, J.; Ji, J.; Wang, Z. Landslide Susceptibility Mapping Using Ant Colony Optimization Strategy and Deep Belief Network in Jiuzhaigou Region. IEEE J. Sel. Top. Appl. Earth Obs. Remote Sens. 2021, 14, 11042–11057. [Google Scholar] [CrossRef]
- Xu, Q.; Ouyang, C.; Jiang, T.; Yuan, X.; Fan, X.; Cheng, D. MFFENet and ADANet: A robust deep transfer learning method and its application in high precision and fast cross-scene recognition of earthquake-induced landslides. Landslides 2022, 19, 1617–1647. [Google Scholar] [CrossRef]
- Yi, Y.; Zhang, Z.; Zhang, W.; Jia, H.; Zhang, J. Landslide susceptibility mapping using multiscale sampling strategy and convolutional neural network: A case study in Jiuzhaigou region. Catena 2020, 195, 104851. [Google Scholar] [CrossRef]
- Zhang, S.; Bai, L.; Li, Y.; Li, W.; Xie, M. Comparing Convolutional Neural Network and Machine Learning Models in Landslide Susceptibility Mapping: A Case Study in Wenchuan County. Front. Environ. Sci. 2022, 10, 886841. [Google Scholar] [CrossRef]
- Zheng, H.; Liu, B.; Han, S.; Fan, X.; Zou, T.; Zhou, Z.; Gong, H. Research on landslide hazard spatial prediction models based on deep neural networks: A case study of northwest Sichuan, China. Environ. Earth Sci. 2022, 81, 258. [Google Scholar] [CrossRef]
- Nunez, J.; Catalan, P.A.; Valle, C.; Zamora, N.; Valderrama, A. Discriminating the occurrence of inundation in tsunami early warning with one-dimensional convolutional neural networks. Sci. Rep. 2022, 12, 10321. [Google Scholar] [CrossRef] [PubMed]
- Adha, A.; Pamuncak, A.; Qiao, W.; Laory, I. Automated building classification framework using convolutional neural network. Cogent Eng. 2022, 9, 2065900. [Google Scholar] [CrossRef]
- Alcantara, E.A.M.; Saito, T. Convolutional Neural Network-Based Rapid Post-Earthquake Structural Damage Detection: Case Study. Sensors 2022, 22, 6426. [Google Scholar] [CrossRef] [PubMed]
- Cardellicchio, A.; Ruggieri, S.; Leggieri, V.; Uva, G. View VULMA: Data Set for Training a Machine-Learning Tool for a Fast Vulnerability Analysis of Existing Buildings. Data 2022, 7, 4. [Google Scholar] [CrossRef]
- Chida, H.; Takahashi, N. Study on image diagnosis of timber houses damaged by earthquake using deep learning. Jpn. Archit. Rev. 2021, 4, 420–430. [Google Scholar] [CrossRef]
- Crawford, P.S.; Al-Zarrad, M.A.; Graettinger, A.J.; Hainen, A.M.; Back, E.; Powell, L. Rapid Disaster Data Dissemination and Vulnerability Assessment through Synthesis of a Web-Based Extreme Event Viewer and Deep Learning. Adv. Civ. Eng. 2018, 2018, 7258156. [Google Scholar] [CrossRef]
- Ding, J.; Zhang, J.; Zhan, Z.; Tang, X.; Wang, X. A Precision Efficient Method for Collapsed Building Detection in Post-Earthquake UAV Images Based on the Improved NMS Algorithm and Faster R-CNN. Remote Sens. 2022, 14, 663. [Google Scholar] [CrossRef]
- Ghione, F.; Maeland, S.; Meslem, A.; Oye, V. Building Stock Classification Using Machine Learning: A Case Study for Oslo, Norway. Front. Earth Sci. 2022, 10, 886145. [Google Scholar] [CrossRef]
- Gonzalez, D.; Rueda-Plata, D.; Acevedo, A.B.; Duque, J.C.; Ramos-Pollan, R.; Betancourt, A.; Garcia, S. Automatic detection of building typology using deep learning methods on street level images. Build. Environ. 2020, 177, 106805. [Google Scholar] [CrossRef]
- Hong, Z.; Yang, Y.; Liu, J.; Jiang, S.; Pan, H.; Zhou, R.; Zhang, Y.; Han, Y.; Wang, J.; Yang, S.; et al. Enhancing 3D Reconstruction Model by Deep Learning and Its Application in Building Damage Assessment after Earthquake. Appl. Sci. 2022, 12, 9790. [Google Scholar] [CrossRef]
- Hong, Z.; Zhong, H.; Pan, H.; Liu, J.; Zhou, R.; Zhang, Y.; Han, Y.; Wang, J.; Yang, S.; Zhong, C. Classification of Building Damage Using a Novel Convolutional Neural Network Based on Post-Disaster Aerial Images. Sensors 2022, 22, 5920. [Google Scholar] [CrossRef] [PubMed]
- Hu, Y.; Tang, H. On the Generalization Ability of a Global Model for Rapid Building Mapping from Heterogeneous Satellite Images of Multiple Natural Disaster Scenarios. Remote Sens. 2021, 13, 984. [Google Scholar] [CrossRef]
- Ji, M.; Liu, L.; Buchroithner, M. Identifying Collapsed Buildings Using Post-Earthquake Satellite Imagery and Convolutional Neural Networks: A Case Study of the 2010 Haiti Earthquake. Remote Sens. 2018, 10, 1689. [Google Scholar] [CrossRef]
- Li, J.; He, Z.; Zhao, X. A Data-Driven Building’s Seismic Response Estimation Method Using a Deep Convolutional Neural Network. IEEE Access 2021, 9, 50061–50077. [Google Scholar] [CrossRef]
- Lin, Q.; Ci, T.; Wang, L.; Mondal, S.K.; Yin, H.; Wang, Y. Transfer Learning for Improving Seismic Building Damage Assessment. Remote Sens. 2022, 14, 201. [Google Scholar] [CrossRef]
- Liu, C.; Sui, H.; Wang, J.; Ni, Z.; Ge, L. Real-Time Ground-Level Building Damage Detection Based on Lightweight and Accurate YOLOv5 Using Terrestrial Images. Remote Sens. 2022, 14, 2763. [Google Scholar] [CrossRef]
- Ma, H.; Liu, Y.; Ren, Y.; Wang, D.; Yu, L.; Yu, J. Improved CNN Classification Method for Groups of Buildings Damaged by Earthquake, Based on High Resolution Remote Sensing Images. Remote Sens. 2020, 12, 260. [Google Scholar] [CrossRef]
- Miura, H.; Aridome, T.; Matsuoka, M. Deep Learning-Based Identification of Collapsed, Non-Collapsed and Blue Tarp-Covered Buildings from Post-Disaster Aerial Images. Remote Sens. 2020, 12, 1924. [Google Scholar] [CrossRef]
- Park, J.A.; Liu, X.; Yeum, C.M.; Dyke, S.J.; Midwinter, M.; Choi, J.; Chu, Z.; Hacker, T.; Benes, B. Multioutput Image Classification to Support Postearthquake Reconnaissance. J. Perform. Constr. Facil. 2022, 36, 04022063. [Google Scholar] [CrossRef]
- Qing, Y.; Ming, D.; Wen, Q.; Weng, Q.; Xu, L.; Chen, Y.; Zhang, Y.; Zeng, B. Operational earthquake-induced building damage assessment using CNN-based direct remote sensing change detection on superpixel level. Int. J. Appl. Earth Obs. Geoinf. 2022, 112, 102899. [Google Scholar] [CrossRef]
- Rueda-Plata, D.; Gonzalez, D.; Acevedo, A.B.; Duque, J.C.; Ramos-Pollan, R. Use of deep learning models in street-level images to classify one-story unreinforced masonry buildings based on roof diaphragms. Build. Environ. 2021, 189, 107517. [Google Scholar] [CrossRef]
- Wang, C.; Antos, S.E.; Triveno, L.M. Automatic detection of unreinforced masonry buildings from street view images using deep learning-based image segmentation. Autom. Constr. 2021, 132, 103968. [Google Scholar] [CrossRef]
- Zhan, Y.; Liu, W.; Maruyama, Y. Damaged Building Extraction Using Modified Mask R-CNN Model Using Post-Event Aerial Images of the 2016 Kumamoto Earthquake. Remote Sens. 2022, 14, 1002. [Google Scholar] [CrossRef]
- Soleimani-Babakamali, M.H.; Esteghamati, M.Z. Estimating seismic demand models of a building inventory from nonlinear static analysis using deep learning methods. Eng. Struct. 2022, 266, 114576. [Google Scholar] [CrossRef]
- Alcantara, E.A.M.; Bong, M.D.; Saito, T. Structural Response Prediction for Damage Identification Using Wavelet Spectra in Convolutional Neural Network. Sensors 2021, 21, 6795. [Google Scholar] [CrossRef]
- Dang, H.V.; Raza, M.; Nguyen, T.V.; Bui-Tien, T.; Nguyen, H.X. Deep learning-based detection of structural damage using time-series data. Struct. Infrastruct. Eng. 2021, 17, 1474–1493. [Google Scholar] [CrossRef]
- Gao, Y.; Mosalam, K.M. PEER Hub ImageNet: A Large-Scale Multiattribute Benchmark Data Set of Structure Images. J. Struct. Eng. 2020, 146, 04020198. [Google Scholar] [CrossRef]
- Haciefendioglu, K.; Basaga, H.B.; Demir, G. Automatic detection of earthquake-induced ground failure effects through Faster R-CNN deep learning-based object detection using satellite images. Nat. Hazards 2021, 105, 383–403. [Google Scholar] [CrossRef]
- Ji, X.; Zhuang, Y.; Miao, Z.; Cheng, Y. Vision-based seismic damage detection and residual capacity assessment for an RC shaking table test structure. Earthq. Eng. Struct. Dyn. 2023, 52, 806–827. [Google Scholar] [CrossRef]
- Liu, H.; Zhang, Y. Deep learning-based brace damage detection for concentrically braced frame structures under seismic loadings. Adv. Struct. Eng. 2019, 22, 3473–3486. [Google Scholar] [CrossRef]
- Mondal, T.G.; Jahanshahi, M.R.; Wu, R.-T.; Wu, Z.Y. Deep learning-based multi-class damage detection for autonomous post-disaster reconnaissance. Struct. Control Health Monit. 2020, 27, e2507. [Google Scholar] [CrossRef]
- Ni, X.; Xiong, Q.; Kong, Q.; Yuan, C. Deep HystereticNet to predict hysteretic performance of RC columns against cyclic loading. Eng. Struct. 2022, 273, 115103. [Google Scholar] [CrossRef]
- Ogunjinmi, P.D.; Park, S.-S.; Kim, B.; Lee, D.-E. Rapid Post-Earthquake Structural Damage Assessment Using Convolutional Neural Networks and Transfer Learning. Sensors 2022, 22, 3471. [Google Scholar] [CrossRef]
- Pantoja-Rosero, B.G.; Oner, D.; Kozinski, M.; Achanta, R.; Fua, P.; Perez-Cruz, F.; Beyer, K. TOPO-Loss for continuity-preserving crack detection using deep learning. Constr. Build. Mater. 2022, 344, 128264. [Google Scholar] [CrossRef]
- Rezaie, A.; Godio, M.; Beyer, K. Investigating the cracking of plastered stone masonry walls under shear-compression loading. Constr. Build. Mater. 2021, 306, 124831. [Google Scholar] [CrossRef]
- Tang, Z.; Bao, Y.; Li, H. Group sparsity-aware convolutional neural network for continuous missing data recovery of structural health monitoring. Struct. Health Monit. -Int. J. 2021, 20, 1738–1759. [Google Scholar] [CrossRef]
- Xiong, C.; Zheng, J.; Xu, L.; Cen, C.; Zheng, R.; Li, Y. Multiple-Input Convolutional Neural Network Model for Large-Scale Seismic Damage Assessment of Reinforced Concrete Frame Buildings. Appl. Sci. 2021, 11, 8258. [Google Scholar] [CrossRef]
- Yang, W.; Zhang, X.; Luo, P. Transferability of Convolutional Neural Network Models for Identifying Damaged Buildings Due to Earthquake. Remote Sens. 2021, 13, 504. [Google Scholar] [CrossRef]
- Yuan, X.; Zhang, Y.; Lu, Q.; Zhang, S.; Liu, H.; Jin, M.; Xu, F. Cycle Performance of Aerated Lightweight Concrete Windowed and Windowless Wall Panel from the Perspective of Lightweight Deep Learning. Comput. Intell. Neurosci. 2022, 2022, 3968607. [Google Scholar] [CrossRef] [PubMed]
- Zhang, L.; Shen, J.; Zhu, B. A research on an improved Unet-based concrete crack detection algorithm. Struct. Health Monit. -Int. J. 2021, 20, 1864–1879. [Google Scholar] [CrossRef]
- Zheng, R.; Xiong, C.; Deng, X.; Li, Q.; Li, Y. Assessment of Earthquake Destructive Power to Structures Based on Machine Learning Methods. Appl. Sci. -Basel 2020, 10, 6210. [Google Scholar] [CrossRef]
- Fan, G.; Li, J.; Hao, H.; Xin, Y. Data driven structural dynamic response reconstruction using segment based generative adversarial networks. Eng. Struct. 2021, 234, 111970. [Google Scholar] [CrossRef]
- Al Duhayyim, M.; Malibari, A.A.; Alharbi, A.; Afef, K.; Yafoz, A.; Alsini, R.; Alghushairy, O.; Mohsen, H. Road Damage Detection Using the Hunger Games Search with Elman Neural Network on High-Resolution Remote Sensing Images. Remote Sens. 2022, 14, 6222. [Google Scholar] [CrossRef]
- An, H.; Lee, J.-H. Deep neural network for prediction of time-history seismic response of bridges. Struct. Eng. Mech. 2022, 83, 401–413. [Google Scholar] [CrossRef]
- Ansari, A.; Rao, K.S.; Jain, A.K.; Ansari, A. Deep learning model for predicting tunnel damages and track serviceability under seismic environment. Model. Earth Syst. Environ. 2022, 9, 1349–1368. [Google Scholar] [CrossRef]
- Cheraghzade, M.; Roohi, M. Deep learning for seismic structural monitoring by accounting for mechanics-based model uncertainty. J. Build. Eng. 2022, 57, 104837. [Google Scholar] [CrossRef]
- Li, C.; Li, H.; Chen, X. Fast seismic response estimation of tall pier bridges based on deep learning techniques. Eng. Struct. 2022, 266, 114566. [Google Scholar] [CrossRef]
- Nabian, M.A.; Meidani, H. Deep Learning for Accelerated Seismic Reliability Analysis of Transportation Networks. Comput. -Aided Civ. Infrastruct. Eng. 2018, 33, 443–458. [Google Scholar] [CrossRef]
- Pang, Y.; Yin, P.; Wang, J.; Wu, L. Integrated framework for seismic fragility assessment of cable-stayed bridges using deep learning neural networks. Sci. China-Technol. Sci. 2023, 66, 406–416. [Google Scholar] [CrossRef]
- Sajedi, S.; Liang, X. Filter Banks and Hybrid Deep Learning Architectures for Performance-Based Seismic Assessments of Bridges. J. Struct. Eng. 2022, 148, 04022196. [Google Scholar] [CrossRef]
- Ye, X.-W.; Ma, S.-Y.; Liu, Z.-X.; Ding, Y.; Li, Z.-X.; Jin, T. Post-earthquake damage recognition and condition assessment of bridges using UAV integrated with deep learning approach. Struct. Control Health Monit. 2022, 29, e3128. [Google Scholar] [CrossRef]
- Ghasemi, A.; Stephens, M.T. Building clustering for regional seismic response and damage analysis. Earthq. Spectra 2022, 38, 2941–2969. [Google Scholar] [CrossRef]
- Ji, K.; Zhu, C.; Yaghmaei-Sabegh, S.; Lu, J.; Ren, Y.; Wen, R. Site classification using deep-learning-based image recognition techniques. Earthq. Eng. Struct. Dyn. 2022, 52, 2323–2338. [Google Scholar] [CrossRef]
- Koukouraki, E.; Vanneschi, L.; Painho, M. Few-Shot Learning for Post-Earthquake Urban Damage Detection. Remote Sens. 2022, 14, 40. [Google Scholar] [CrossRef]
- Maqsoom, A.; Aslam, B.; Khalil, U.; Mehmood, M.A.; Ashraf, H.; Siddique, A. An integrated approach based earthquake risk assessment of a seismically active and rapidly urbanizing area in Northern Pakistan. Geocarto Int. 2022, 37, 16043–16073. [Google Scholar] [CrossRef]
- Xiong, C.; Li, Q.; Lu, X. Automated regional seismic damage assessment of buildings using an unmanned aerial vehicle and a convolutional neural network. Autom. Constr. 2020, 109, 102994. [Google Scholar] [CrossRef]
Figure 1.
Paper selection process. The asterisk from figure body automatically finds spelling variations. For example, assess* could find all articles that contain the term assess and assessment.
Figure 1.
Paper selection process. The asterisk from figure body automatically finds spelling variations. For example, assess* could find all articles that contain the term assess and assessment.

Figure 2.
Statistical analysis of search results: (a) Most contributed journals regarding DL for EDA and corresponding papers; (b) Annual publications on DL for EDA.
Figure 2.
Statistical analysis of search results: (a) Most contributed journals regarding DL for EDA and corresponding papers; (b) Annual publications on DL for EDA.

Figure 3.
Categorisation (a) and trend (b) chart of EDA’s assessment objects.

Figure 4.
The general process for damage detection using DL models.

Figure 5.
The general process for damage assessment using DL models.

Figure 6.
The application framework of DL for EDA from four dimensions.


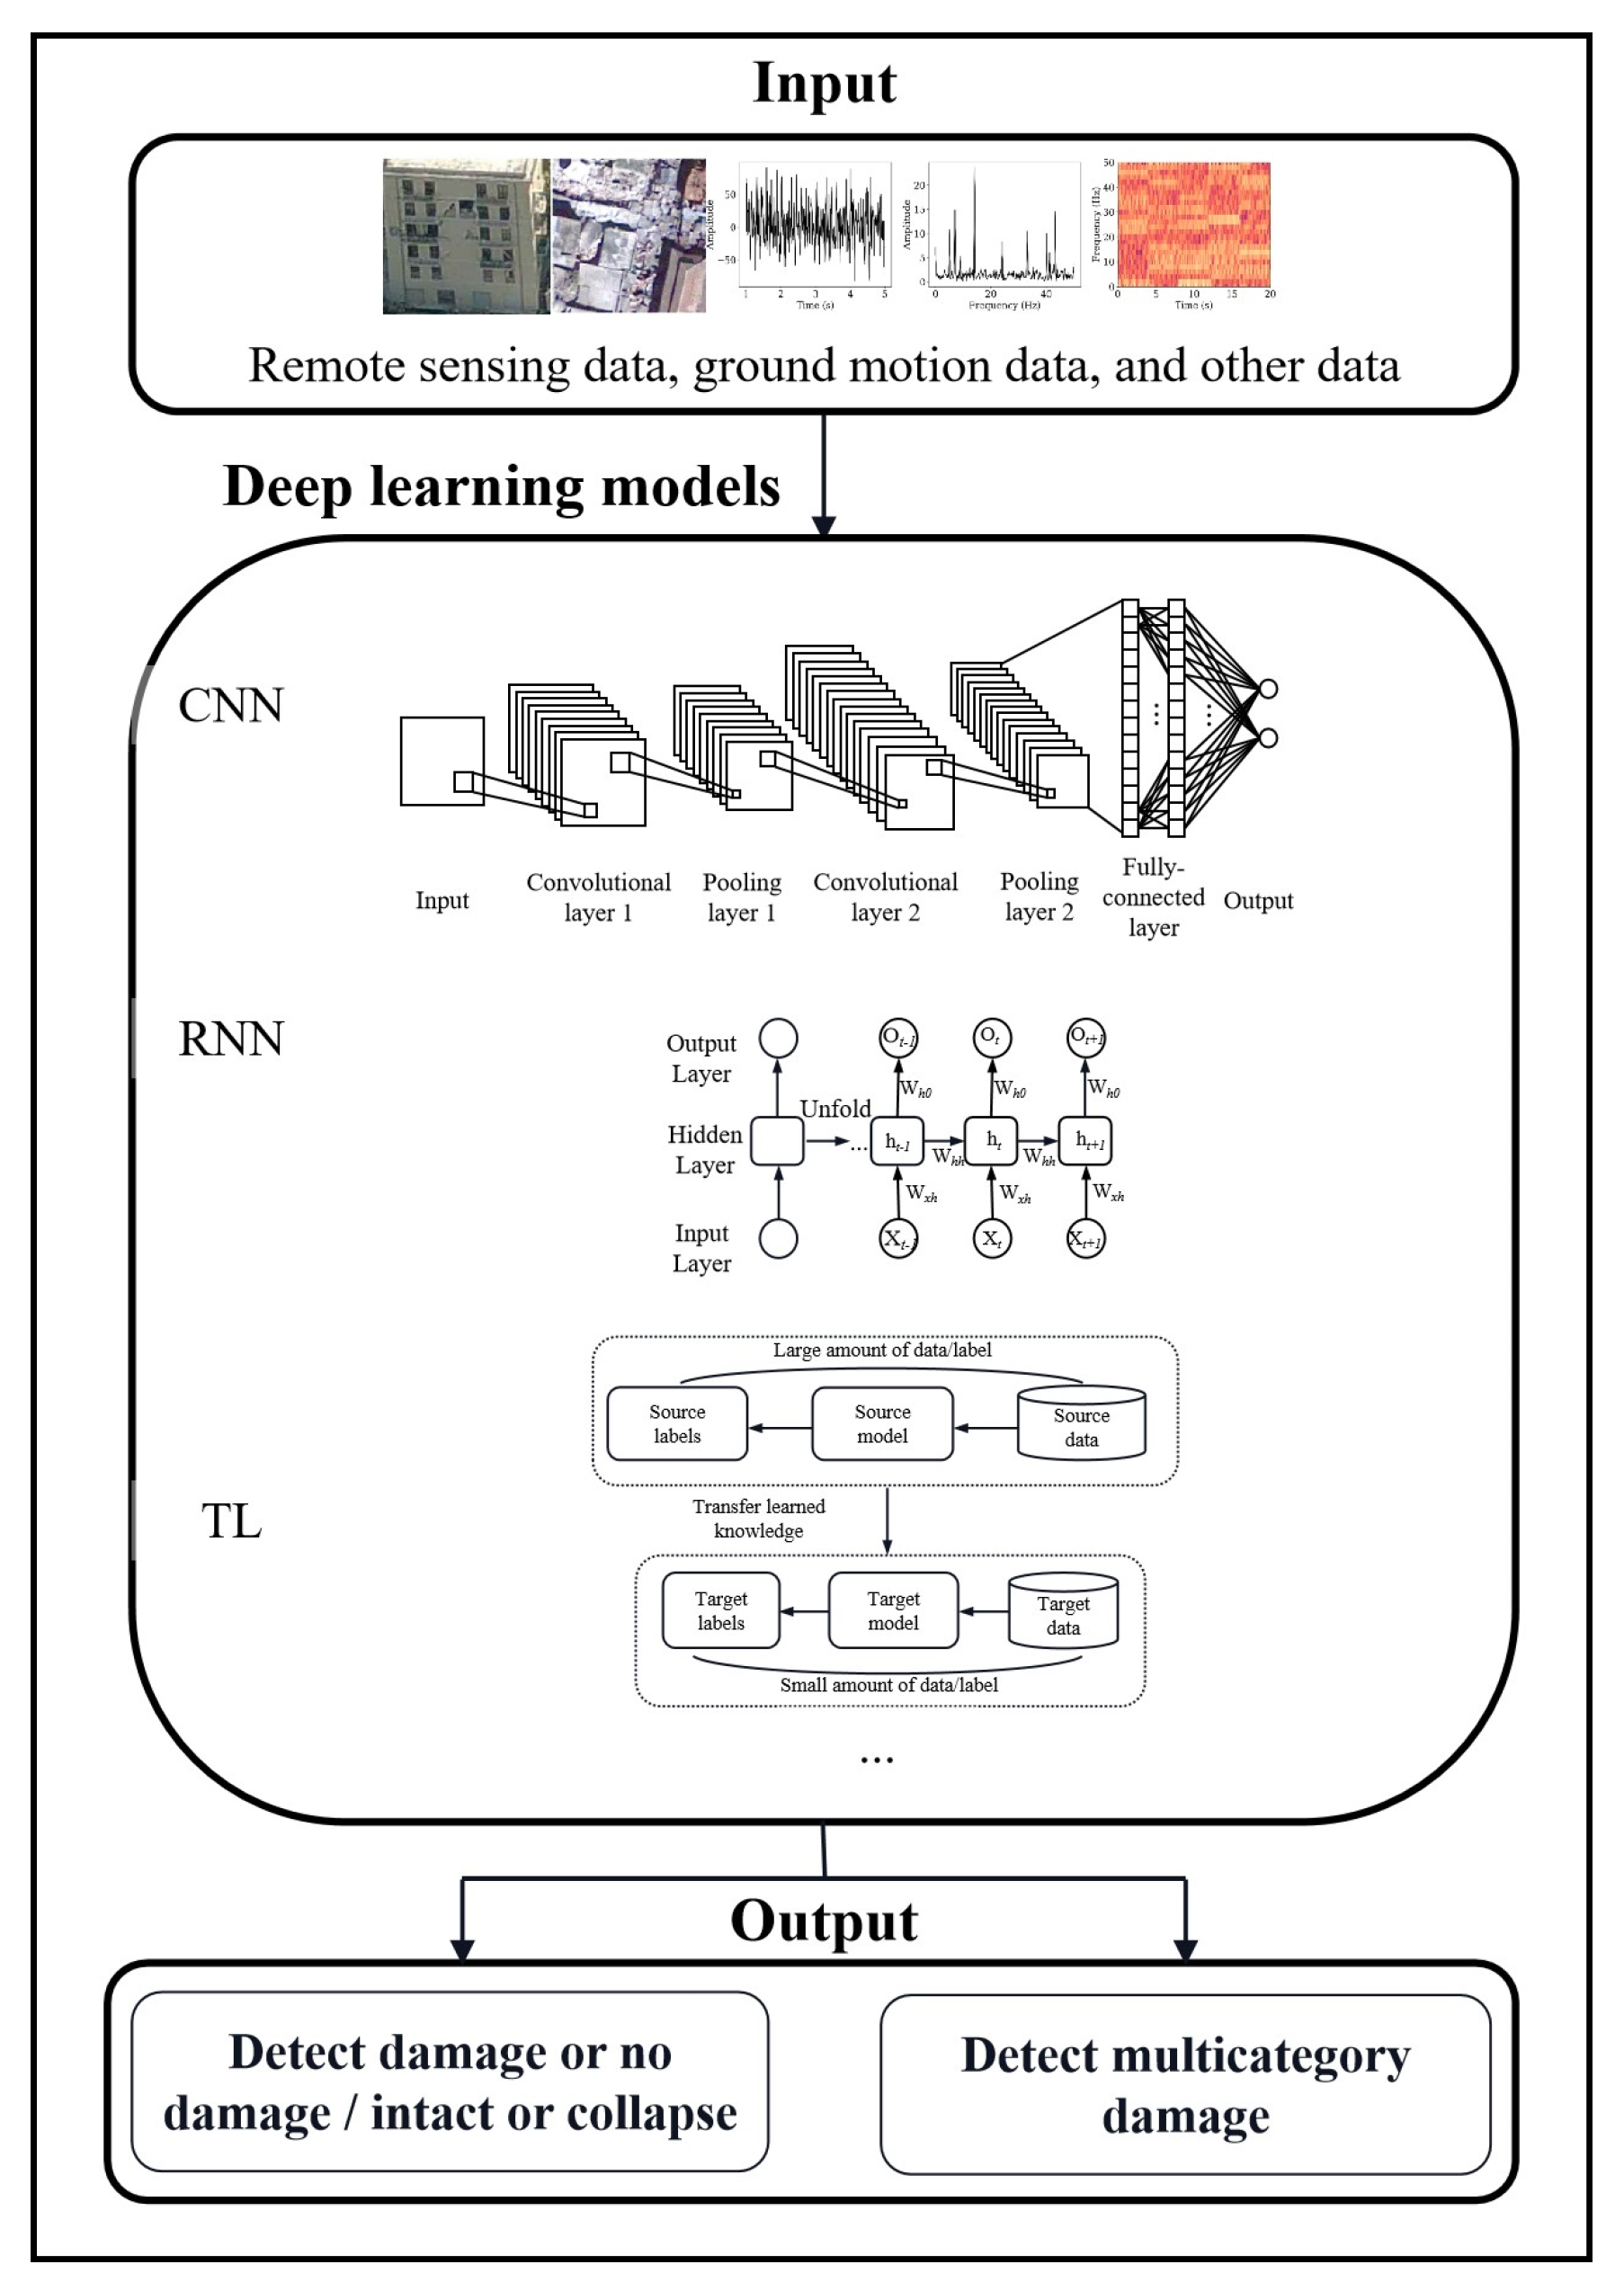
Table 1.
Detailed function distribution of EDA’s assessment objects.
| Assessment Objects | Categories | Application Stages | Functions |
|---|---|---|---|
| Earthquakes | Disaster object | Pre-earthquake stage | Probabilistic prediction and magnitude prediction |
| During-earthquake stage | Earthquake localisation, disaster situation analysis, and seismic data processing | ||
| Post-earthquake stage | Loss assessment | ||
| Earthquake-Induced Secondary Disasters | Disaster object | Post-earthquake stage | Probabilistic prediction, risk assessment, landslide extraction, damage detection, disaster identification, and landslide susceptibility mapping |
| Buildings Affected by Earthquakes | Physical object | Pre-earthquake stage | Risk assessment |
| During-earthquake stage | Damage detection and collapse detection | ||
| Post-earthquake stage | Safety and damage assessment | ||
| Infrastructure Affected by Earthquakes | Physical object | Pre-earthquake stage | Risk assessment |
| During-earthquake stage | Damage detection | ||
| Post-earthquake stage | Damage assessment | ||
| Regions Affected by Earthquakes | Physical object | Pre-earthquake stage | Risk assessment |
| During-earthquake stage | Damage detection | ||
| Post-earthquake stage | Multiple scene recognition and damage assessment |
Table 2.
Publicly available data sources for EDA.
| Data Sources | Data Types | Website |
|---|---|---|
| Pacific Earthquake Engineering Research Center (PEER) | Ground motion data | https://ngawest2.berkeley.edu/, accessed on 10 July 2022 |
| Kyoshin Network (K-NET); Kiban Kyoshin Network (KiK-net) | Strong-motion data | https://www.kyoshin.bosai.go.jp/, accessed on 10 July 2022 |
| Center for Engineering Strong Motion Data (CESMD) | Earthquake metadata, stations metadata, time series, and parametric data | http://www.strongmotioncenter.org, accessed on 10 July 2022 |
| Stanford Earthquake Dataset (STEAD) | Seismic signals | https://github.com/smousavi05/STEAD, accessed on 10 July 2022 |
| Southern California Earthquake Data Center (SCEDC) | Earthquake catalogue | https://github.com/tso1257771/ARRU_seismic_backprojection, accessed on 10 July 2022 |
| The United States Geological Survey (USGS) | Geological data | https://earthquake.usgs.gov/, accessed on 10 July 2022 |
| Geological Hazard Information for New Zealand (GeoNet) | https://www.geonet.org.nz, accessed on 10 July 2022 | |
| DIVA GIS | https://www.diva-gis.org/, accessed on 10 July 2022 | |
| China Unicom | Mobile phone signalling data | http://www.smartsteps.com/, accessed on 10 July 2022 |
| Purdue University, United States | Earthquake data | Datacenterhub.org, accessed on 10 July 2022 |
| Earthquake Engineering Research Institute (EERI) | http://www.eqclearinghouse.org/, accessed on 10 July 2022 | |
| xBD Dataset | Annotated high-resolution satellite imagery for building damage assessment | https://xview2.org/dataset, accessed on 10 July 2022 |
| Socioeconomic Data and Applications Center (SEDAC) | Population information | https://beta.sedac.ciesin.columbia.edu/, accessed on 10 July 2022 |
Table 3.
The advantages and disadvantages of several data types.
| Data Types | Data Sources | Advantages | Disadvantages | Application Functions |
|---|---|---|---|---|
| Satellite Data | Optical Remote Sensing Satellite | Optical satellite images are more accessible to interpret than other types. | Collecting images takes much time. Satellites are susceptible to weather conditions. The satellite can only obtain vertical images. | Damage detection and assessment |
| Synthetic Aperture Radar (SAR) | SAR is insensitive to atmospheric conditions and independent of solar irradiation. | It is hard to interpret and detect similar objects. | Damage detection and assessment | |
| Interferometric Synthetic Aperture Radar (InSAR) | InSAR data have wide spatial coverage, high spatial resolution, and high accuracy. | InSAR is greatly limited by geometrical distortions, atmospheric effects, and decorrelations. | Disaster detection | |
| Aerial Images | Unmanned Aerial Vehicle (UAV) | UAV images are cheaper and easier to obtain. The UAV can have a smaller ground sampling distance. UAVs are portable and flexible. It can focus only on areas of interest. | The coverage of UAVs is small. Rely on human control. | Damage detection and assessment |
| Aerial (Manned) Systems | Aerial (manned) systems allows for multi-view image capture. | Aerial (manned) systems do not enable rapid image capture after an earthquake. | Damage detection and assessment | |
| Point Cloud | LiDAR | LiDAR has a solid ability to obtain data with fast speed, and high precision. LiDAR can work all day without being affected by light. | LiDAR data are hard to interpret. | Building feature extraction |
| Seismic Signal | Monitoring Systems | It can record seismic signals. | The process of encoding ground motion data into images consumes a lot of time and resources. | Prediction, identification, and localisation of earthquakes and damage assessment |
| Social Media Data | Twitter, Sina Weibo, etc. | Social media information can reflect the disaster situation in near-real time and assist in making decisions. Rescue teams can obtain helpful information from social platforms in time to coordinate the rescue. It helps monitor rumours in time to avoid causing panic. | Social media data are only sometimes of high quality, accurate, or timely. | Disaster information extraction and sentiment analysis |
Table 4.
Characteristics of various data sources.
| Data Sources | Data Sub-Sources | Suitable Application Scopes | Acquisition Cost Level | Data Coverage Level | Data Precision Level |
|---|---|---|---|---|---|
| Optical Satellite | - | Well-lit areas | High | Large | High |
| Synthetic Aperture Radar (SAR) | Airborne SAR | Small-scale areas | Relatively High | Moderate | Relatively High |
| Space-Based SAR | Large-scale areas | High | Large | High | |
| Interferometric Synthetic Aperture Radar (InSAR) | - | Large-scale areas | High | Large | High |
| Unmanned Aerial Vehicle (UAV) | - | Hazardous areas and small-scale areas | Relatively Low | Relatively Small | Moderate |
| Aerial (Manned) Systems | - | Large-scale areas | High | Relatively Large | Relatively High |
| LiDAR | Airborne LiDAR | Large-scale areas | Relatively High | Moderate | Relatively High |
| Ground-Based LiDAR | Single building | Moderate | Relatively Small | High | |
| Vehicle-Mounted LiDAR | Boundary areas | Moderate | Small | Relatively High | |
| Monitoring Systems | - | All the earthquake areas | Low | Large | High |
| Social Media Platforms | Twitter, Sina Weibo, etc. | Internet users in earthquake-stricken areas | Low | Large | Relatively Low |
| Models | Dataset Example | Advantages and Disadvantages | Application Functions |
|---|---|---|---|
| AlexNet | ImageNet | AlexNet can effectively avoid the overfitting phenomenon. AlexNet is computationally intensive. | Damage identification |
| VGGNet | ImageNet | The structure is relatively simple. VGG is computationally intensive. | Damage identification; Damage assessment; Building classification; Disaster type identification |
| ResNet | ImageNet, CIFAR-10 | ResNet can solve the degradation problem caused by increasing the depth of the network. It explicitly preserves information through additive identity transformations, as many layers may contribute very little or no information. | Damage identification; Landslide detection |
| Inception (i.e., GoogLeNet) | ImageNet | Inception requires less computational cost. It can manage network resources more efficiently and enhance the learning ability of traditional CNNs. The heterogeneous topology of GoogleNet requires customisation from one module to another. A representation bottleneck can sometimes lead to the loss of useful information. | Damage identification; Damage assessment; Building classification; Signal recognition |
| Xception | ImageNet | Depthwise separable convolution is used instead of traditional convolution, thus reducing the number of parameters and computational complexity of the model more effectively. | Damage assessment; Building classification |
| DenseNet | CIFAR-10, CIFAR-100, ImageNet | It can solve the problem of gradient disappearance. Deeper layers can directly use the features extracted by some earlier layers through dense connections. It consumes a lot of memory. | Damage identification |
| SqueezeNet | ImageNet | SqueezeNet can simplify network complexity while maintaining high accuracy. | Damage identification |
| MobileNet | ImageNet | MobileNet can reduce the number of parameters and computational complexity with less loss of classification precision. | Damage assessment |
Table 6.
Summary of the functions of CNN architectures.
| Functions | Architectures |
|---|---|
| Classification | Inception (i.e., GoogLeNet), ResNet, and Xception DenseNet, SqueezeNet, MobileNet, AlexNet, and PointNet |
| Segmentation | FCN (including U-Net), PSPNet, and DeepLab |
| Detection | Mask R-CNN, Faster R-CNN, R-CNN, YOLO, and SSD |
Table 7.
The advantages, disadvantages, and application functions of several commonly used DL models [14,21].
| Models | Advantages | Disadvantages | Application Functions | Application Stages |
|---|---|---|---|---|
| Convolutional Neural Network (CNN) | It can extract advanced features. It can capture local geometric features and spatial patterns. | It can overfit the data. CNN requires an extensive training data set. | Detection (secondary disasters and damage); Segmentation of the captured features of damage; Classification of damaged images; Landslide susceptibility analysis; Damage assessment; Disaster prediction; Earthquake magnitude prediction | All stages |
| Multi-Layer Perceptron (MLP) | MLP can describe the complicated non-linear relations between the inputs and outputs. | It ignores the interdependencies among the input variables. | Landslide susceptibility mapping; Damage assessment; Earthquake prediction | All stages |
| Transfer Learning (TL) | It can avoid overfitting problems. It overcomes the problem of insufficient training data. TL can improve the generalisation of the model. | TL can lead to non-transferability or negative transfer across domains. | Damage detection; Damage assessment; Disaster identification | All stages |
| Recurrent Neural Network (RNN) | It captures temporal dynamics. | It brings a vanishing gradient and short-term dependency. It fails to represent, for a short time, rapidly changing and non-periodical data. | Structural response prediction; Damage classification; Damage detection; Earthquake prediction | All stages |
| Generative Adversarial Network (GAN) | The model reduces parameter tuning. The algorithm possesses an efficient unsupervised training approach It is more efficient than a single hidden layer. | Visualisation requires extra information processing. | Damage detection; Earthquake prediction | Pre-earthquake stage and during-earthquake stage |
| Autoencoder | It can cancel the noise in the image. | It proves to be efficient only when the reconstructing images are similar to training images. | EQIL prediction; Damage detection; Data denoising | During-earthquake stage and post-earthquake stage |
Table 8.
DL models and data types commonly used in all stages of assessment tasks.
| Assessment Stages | Assessment Sub-Stages | Models | Data Types |
|---|---|---|---|
| Pre-Earthquake Stage | Earthquake Prediction | CNN, MLP, RNN, LSTM, DNN, TL, and GAN | Ground motion data, earthquake catalogues, electromagnetic precursors, and seismic signals |
| Risk Assessment | CNN, DCNN, and LSTM | Ground motion data, UAV data, street-level images, point cloud data, and vehicle-mounted video | |
| During-earthquake Stage | Damage Detection | CNN, MLP, DNN, DCNN, TL, and GAN | Satellite images, UAV images, airborne images, aerial images, ground motion data, and seismic signals |
| Disaster Situation Analysis | CNN and RNN | Social media data | |
| Earthquake Localisation | CNN, DCNN, LSTM, and autoencoder | Seismic signal and ground motion data | |
| Seismic Data Processing | Autoencoder and CNN | Seismic signals | |
| Post-Earthquake Stage | Secondary Disaster Assessment | Mask R-CNN, CNN, DBN, RNN, LSTM, and autoencoder | Aerial images, ground motion data, satellite images, UAV data, and SAR data |
| Loss Assessment | CNN, DCNN, TL, and DNN | Ground motion data, social media data, and satellite images | |
| Safety Assessment | CNN, TL, and LSTM | Ground motion data, point cloud data, satellite images and aerial images | |
| Multi-Stage | - | DNN and CNN | Ground motion data, satellite images, point cloud data, and aerial images |
Disclaimer/Publisher’s Note: The statements, opinions and data contained in all publications are solely those of the individual author(s) and contributor(s) and not of MDPI and/or the editor(s). MDPI and/or the editor(s) disclaim responsibility for any injury to people or property resulting from any ideas, methods, instructions or products referred to in the content. |
© 2023 by the authors. Licensee MDPI, Basel, Switzerland. This article is an open access article distributed under the terms and conditions of the Creative Commons Attribution (CC BY) license (https://creativecommons.org/licenses/by/4.0/).
Share and Cite
MDPI and ACS Style
Jia, J.; Ye, W. Deep Learning for Earthquake Disaster Assessment: Objects, Data, Models, Stages, Challenges, and Opportunities. Remote Sens. 2023, 15, 4098. https://doi.org/10.3390/rs15164098
AMA Style
Jia J, Ye W. Deep Learning for Earthquake Disaster Assessment: Objects, Data, Models, Stages, Challenges, and Opportunities. Remote Sensing. 2023; 15(16):4098. https://doi.org/10.3390/rs15164098
Chicago/Turabian StyleJia, Jing, and Wenjie Ye. 2023. "Deep Learning for Earthquake Disaster Assessment: Objects, Data, Models, Stages, Challenges, and Opportunities" Remote Sensing 15, no. 16: 4098. https://doi.org/10.3390/rs15164098
Note that from the first issue of 2016, this journal uses article numbers instead of page numbers. See further details here.