

Monitoring of Land Cover and Vegetation Changes in Juhugeng Coal Mining Area Based on Multi-Source Remote Sensing Data

1
Aerospace Information Research Institute, Chinese Academy of Sciences, Beijing 100094, China
2
University of Chinese Academy of Sciences, Beijing 100049, China
3
Key Laboratory of Earth Observation of Hainan Province, Hainan Research Institute, Aerospace Information Research Institute, Chinese Academy of Sciences, Sanya 572029, China
*
Author to whom correspondence should be addressed.
Remote Sens. 2023, 15(13), 3439; https://doi.org/10.3390/rs15133439
Submission received: 13 April 2023
/
Revised: 4 July 2023
/
Accepted: 5 July 2023
/
Published: 7 July 2023
Abstract
:Coal is the most prevalent energy source in China and plays an important role in ensuring energy security. The continuous monitoring of coal mining activities is helpful to clarify the incremental space of coal production and establish a rational framework for future coal production capacity. In this study, a multi-source remote sensing approach utilizing SPOT 4, GF, and Landsat data is employed to monitor land cover and vegetation changes in the Juhugeng mining area of the Muli coalfield over a span of nearly 20 years. The analysis incorporates an object-oriented classification method and a vegetation parameter to derive insights. The findings reveal that the mining operations can be divided into two periods, since their initiation in 2003 until their cessation in 2021, with a dividing point around 2013/2014. The initial phase witnessed rapid and even accelerated expansion of the mine, while the subsequent phase was characterized by more stable development and the implementation of some restorative measures for the mine environment. Although the vegetation parameter, Fractional Vegetation Cover (FVC), indicates some reclamation efforts within the mining area, the extent of the reclaimed land remains limited. This study demonstrates the effective application of object-oriented classification in conjunction with the vegetation parameter FVC for monitoring coal mining areas.
1. Introduction
Coal is the most prevalent energy source in China and holds a prominent position in energy production and consumption. With the rapid development of the economy, coupled with the advancements in electric power, metallurgy, building materials, and chemical industries, China has become the largest coal consumer in the world [1,2]. While coal production is cost-effective and facilitates the generation of valuable energy, its extraction and utilization have significant environmental implications. Thus, it is necessary to comprehensively detect, inventory, monitor, and quantify active mining activities [3].
Ground information can be obtained from various observation methods, including ground survey, unmanned aerial vehicles (UAVs), and satellite remote sensing technology. Ground survey is a traditional method of surveying a mining site but is often time-consuming and inefficient [4]. UAVs have been gaining ground primarily in sectors such as agriculture, topography, and mining, having the advantages of cost-effectiveness, high accuracy, and time efficiency [5,6]. The use of UAVs in mining areas is developing rapidly [6,7,8]. However, UAV operations require flight permits from the civilian aviation authorities, which may pose logistical challenges. Additionally, due to limited battery life, UAVs need to perform multiple flight tasks to cover a large area [9].
Satellite remote sensing can offer high resolution spatial and temporal data for large-scale ground observations in a more efficient and economical way [10]. Landsat series satellites have provided massive moderate-resolution data since 1972, enabling various applications such as land cover classification, change detection, and vegetation monitoring [11,12,13,14]. Landsat imagery has proven to be effective in detecting and mapping opencast mining activities [15,16,17]. Nowadays, the available commercial high-resolution remote sensing satellite data, such as IKONOS [18,19], SPOT [20,21], and QuickBird [22,23], are increasingly used in the research of mining areas. Gaofen (GF) satellites, a series of Chinese Earth observation satellites equipped with diverse sensors, are more-often applied specifically in Chinese mining studies [24,25,26,27]. The use of high-resolution remote sensing imagery helps overcome the limitations of coarse resolution data, enabling the detection of small-scale features and the identification of detailed land cover classes [28,29].
Numerous studies have confirmed the importance of remote sensing technology in mining-related fields, including mineral exploration [30], detecting and monitoring coal fires [31], evaluating ground subsidence [32,33,34], mapping mined areas [35,36], quantifying the extent of mining activities [36,37], and monitoring the environmental impacts of surface coal mining [38,39,40].
Land disruption and degradation is one of the most obvious and major impacts of coal mining [3]. To address this, the extraction of land cover and change information plays a pivotal role in mining-related research, providing insights into the extent of degradation caused by mining activities [41]. Traditional machine learning methods have been widely used in this field, both for pixel-based and object-based classification [42,43]. Object-based maps generate less salt and pepper noise than pixel-level methods [44]. In recent years, with the development of deep learning, various networks have been used for the identification of mining areas, and various learning methods such as attention mechanism have been added to the models for identifying mining areas [25,26,45]. However, training of the models requires a large number of samples, which is a challenge for mining targets with limited available datasets.
The vegetation cover surrounding mining sites is closely associated with mining activities, and remote sensing-based vegetation parameters offer a valuable means of assessing the progress of mining expansion and reclamation [46]. FVC is an important parameter that is used to quantify surface vegetation cover, and satellite remote sensing technology provides a way to estimate the FVC [47,48,49]. Measures of FVC are widely used to monitor resource and ecosystem changes [50,51], perform carbon cycle studies [52], evaluate crop growth status [53], and assess land surface vegetation conditions [54]. The remote sensing-based monitoring of vegetation recovery following mining activities plays an important role in evaluating the effectiveness of reclamation efforts [35,55,56]. The acquired information is important for resource and environmental management. FVC serves as an indicator for the reclamation and rehabilitation of open pit mines [57].
The extraction activities within the Muli coalfield have caused damages to the local ecology, emphasizing the need for a comprehensive understanding of the area for the purpose of ecological reconstruction efforts. However, previous remote sensing studies in this area have primarily focused on evaluation of the ecological environment and large-scale vegetation cover assessment during specific years [58,59,60,61], with limited detailed information around the mine area.
This paper presents a case study focusing on the Juhugeng mining area, utilizing SPOT4, GF1, and GF6 data. An object-oriented classification method was employed to generate land cover maps and assess the spatial and temporal changes within the mining area. Additionally, the study calculated the FVC from 2003 to 2021 to visually illustrate the vegetation changes in the mining area. The shift in the FVC was analyzed, and the direct impacts of the mining activities, such as open pit mining and tailings accumulation, on vegetation were discussed.
2. Materials and Methods
2.1. Study Area
The Muli coalfield, located between longitudes 98°50′E and 100°50′E, and latitudes 37°30′N and 38°15′N, spans across Tianjun County, Gangca County, and Qilian County in the Qinghai Province. Encompassing an area of 112.6 km2, this coalfield comprises four opencast coal mine sites: Jiancang, Juhugeng, Duosuogongma, and Hushan. Recognized as a significant coal resource, the Juhugeng pit coal mine, located in close proximity to Muli Town in the northern part of Tianjun County, stands as the sole area that is rich in coking coal in Qinghai Province.
The Juhugeng mining area (Figure 1) is positioned within the jurisdiction of the Haixi Mongol and Tibetan Autonomous Prefecture, falling within the Qilian Mountains National Ecological Functional Zone. Located on a remote alpine plateau at an altitude exceeding 4000 m, this mining site is characterized by a prevalence of glacier terrain and average annual temperatures below 0°. The open pit mine was initiated in 2003 and underwent substantial expansion until 2013. It was not until 2020 that this misconduct came to light, leading to the cessation of coal development activities. The mining activities span part of the catchment of the Datong River, which is one of the sources of the Yellow River. The area impacted by the open pit mining operation includes alpine meadows which are a fragile ecological system [60].
2.2. Data
Since mineral development began in 2003, any long-term monitoring inevitably had to rely on earlier satellites such as SPOT4 to achieve consistent results [62]. A HRVIR sensor on board the SPOT 4 satellite provided 20 m resolution visual and infrared band images, and 10 m resolution panchromatic band imagery before GF-1 launched. The GF-1 and GF-6 satellites have the same spatial resolution, with 2 m panchromatic and 8 m multispectral cameras. Table 1 presents the SPOT4 and GF data collected for monitoring land cover at the mine site. China Remote Sensing Satellite Ground Station (RSGS), established and put into operation in 1986 [11,63], provides data, including those from SPOT and GF, which are used in this paper. Most of the remote sensing images selected in this study have a time lag of 3–4 years to ensure the changes in land cover. In terms of the different spatial resolution of SPOT data and GF data, the 2012 SPOT data and 2013 GF data were both used for better articulation of the results, despite the fact that there was only a 1-year time difference.
Landsat 5, 7, and 8 satellites have sufficient time-series data to cover the mining period, with a 16-day temporal resolution and 30 m spatial resolution. The datasets of Landsat 5, Landsat 7, and Landsat 8 was used depending on the particular year. The data were limited to between May and October, the general growing season of the local vegetation.
2.3. Methods
2.3.1. Technical Route
This study focused on long-term monitoring using multi-source remote sensing data which were collected with the aim of extracting information on land cover and vegetation changes in the Juhugeng mining area.
Based on SPOT and GF data, the approach to obtain land cover information was based on an object-oriented classification method, which mainly consisted of segmentation parameter configuration and feature selection. Land cover maps and transition matrix were generated for change analysis. Then, we combined information of FVC to analyze the development activities in the mining area and the impacts on the surrounding vegetation.
2.3.2. Object-Based Land Cover Information Extraction
We used a fractal net evolution approach (FNEA), generally used in geographical analysis, as the segmentation method for the high-resolution satellite imagery. The segmentation, based on the setting of the heterogeneity criterion weighted by the scale, shape, and compactness parameters, was aimed to minimize the average heterogeneity of segmented objects. The global heterogeneity is defined as follows:
where is the proportion and and represent spectral heterogeneity and shape heterogeneity, respectively.
The formula for spectral heterogeneity is:
where is the band weight, and represents band variance.
The formula for shape heterogeneity is:
The formula for compactness heterogeneity is:
The formula for smooth heterogeneity is:
where is the weight of compactness, represents the perimeter of the object, represents the area, and represents the shortest side length of the smallest external rectangle of the object.
Object-based classification methods provide a large number of spectral, spatial, and textual information features. Various features have their own characteristics in the mining area. Extracting the features and optimizing the combination is necessary to improve classification effectiveness and accuracy. Table 2 is the array of features selected for the classification.
A decision tree is a crucial algorithm in predictive models for machine learning. The Classification and Regression Tree (CART), first introduced by Leo Breiman et al. in 1984, is a type of decision tree. CART looks for the best homogeneity for child nodes under the criterion of the Gini index. As its name suggests, CART can solve both classification and regression predictive modeling issues, which means that it can handle both categorical and numerical variables. Advantages of CART include its nonparametric character, insensitivity to variables, and robustness to outliers [64]. Nowadays, the CART classifier is a useful classification tool in remote sensing studies [43,65].
Ground truth maps were generated by visual interpretation of remote sensing imagery based on previous reliable geological surveys [60,61], information from related authorities and websites, and expert knowledge. A total of 686 random validation points were generated based on the area proportion of each class for assessing accuracy.
2.3.3. Landsat Data-Based Fractional Vegetation Cover Estimation
The study used FVC for vegetation cover evaluation, which is generally defined as the ratio of the vertical projection area of above-ground vegetation organs on the ground to the total vegetation area [66]. Based on the Normalized Difference Vegetation Index (NDVI), FVC is mathematically expressed as follows [67]:
where NDVIsoil represents the NDVI value of bare soil and NDVIveg is the NDVI value of fully vegetated land. NDVI values were set at 5% and 95% confidence intervals for NDVIsoil and NDVIveg, respectively, to eliminate the noise interference, according to the histogram of NDVI data.
3. Results and Analysis
3.1. Suitable Parameters for Image Segmentation
A good segmentation result plays an essential part in the object-based classification hierarchy. Pre-processed GF-1 and GF-6 data were used for the 2013, 2016, 2019, and 2021 classifications. During this period, the mining area was extensively developed with several types of ground objects. The 2 m resolution imagery provides lots of details of the segmentation features.
Figure 2, Figure 3 and Figure 4 show the segmentation test results (standard false color) of several sites that are characteristic of the mining area. The ESP plugin helped to optimize the scale parameter. The following can be concluded from the line graph and segmentation test (Figure 2): (1) the coal storage area and some open pit sites are delineated at scale parameters of 950 and 600; (2) a large-scale restoration region can be distinguished at scale parameters of 820, but fragmented regions need further segmentation; (3) the scale parameter of 450 is almost capable of drawing an area where industrial and mining buildings are constructed; and (4) a separate building or small ecological restoration area is defined in the scale parameter interval of 290 to 360. The features of unexcavated coalface, unspoiled surface, and large water surface are quite different from the mining area, so the scale parameter is large. However, for contaminated water, the appropriate scale parameter has to be reduced from 1000 to 400. The segmentation of a relatively well-covered area of green vegetation requires a scale parameter that is even smaller than 280. In the 2019 GF-6 image, a new type of land cover emerged. The ground was covered with some obstructive materials, and this change often occurred on the side of a slope, delineated by the 210–280 scale parameter.
According to the definition of heterogeneity, both the shape parameter and compactness parameter are set by the method of control variables. The shape parameter was controlled by setting it to 0.9 in order to determine the optimal compactness parameter at a certain pre-experimental scale. Figure 5 shows that as the compactness parameter increases, there is a tendency to segment more compact objects. However, in the case of meadows or water areas where there are highly similar features, such a high compactness parameter is not necessary. Additionally, the diverse shape characteristics of mining areas suggest that excessive involvement of the compactness parameter is not required. Thus, we set . Figure 6 shows, in each row, the same segmentation scale with different shape parameters. It turns out that the number of objects tends to increase when the shape parameter is decreased. It is clear that band variants dominate the heterogeneity. However, the shape factor can help delineate a region of artificial structure with unique shape characteristics, so the shape factor was set to 0.3.
Due to significant variability in the optimal scale parameter for land cover within this segmentation, we employed a hierarchical structure for multi-resolution segmentation. This approach allows us to maximize the utilization of the optimal scale parameters and mitigate the issue of excessive fragmentation. The criteria are presented in Table 3.
3.2. Accuracy Assessment
To evaluate the accuracy of the classification results, we employed four classical metrics that are commonly used in remote sensing image classification: producer’s accuracy, user’s accuracy, overall accuracy, and kappa coefficient. The assessment was conducted using validation points, and the corresponding results are presented in Table 4 and Table 5.
The overall accuracy is above 84% and around 90% or higher in 2004, 2009, 2012, and 2013. Among all of the land cover types, buildings, coal storage, cover, and pristine area were mapped with a high level of accuracy. The division of open pits, tailings, and roads was somewhat lower in accuracy. A low accuracy may result from several factors: (1) the characteristics of these three land cover types are more difficult to distinguish, compared to others; (2) excessive or insufficient segmentation—over-segmentation can lead to fragmented objects and under-segmentation will group different covers together; and (3) lack of reliable ground truth data. The boundary between open pits and tailings is usually not obvious; although these two classes can be separated in land cover monitoring, treating them as one class is worthy of pondering.
We conducted an analysis of the accuracy evaluation for each land cover type. Buildings and cover exhibited a notable performance in both producer’s accuracy and user’s accuracy, owing to their distinctive characteristics in terms of artificial materials. The identification accuracy of coal stockpiles was generally good, with a slightly better performance in producer’s accuracy. In contrast, the recognition of water bodies did not meet our expectations, particularly in terms of producer’s accuracy. We attributed this to the inherent difficulty in distinguishing between coal and water bodies in the images, especially when water accumulated in mining pits during later stages of mining development. The open pit type showed higher user’s accuracy, while tailings demonstrated higher producer’s accuracy, which was advantageous for subsequent analysis. The evaluation accuracy of roads exhibited significant fluctuations across different years, and was directly influenced by the spatial resolution of the sensor. Additionally, the ambiguous distinction between roads that are specific to mining areas and industrial sites within the mining area contributed to this variation.
Further separating restored areas and pristine areas resulted in accuracies ranging from 83% to over 90% for user’s accuracy, but less than 75% for producer’s accuracy. This is due to the fact that replanted vegetation and land reclamation will try to recover the local native vegetation, and there is a high possibility of confusion from a single image.
3.3. Land Cover Change
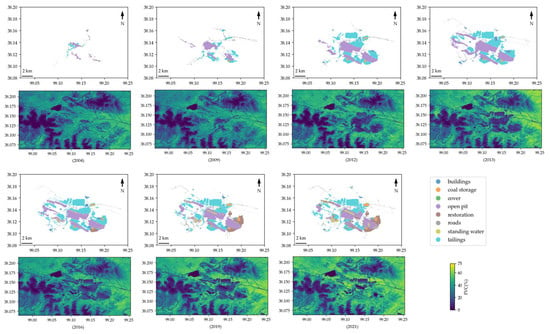
Figure 7 displays the land cover map for the years 2004, 2009, 2012, 2013, 2016, 2019, and 2021. In the map, the term ‘pristine area’ refers to an uninterrupted or ecologically restored region, while ‘restoration’ denotes areas that have undergone reclamation efforts. The category ‘cover’ represents artificial coverings, such as slope protection networks, which are employed as protective measures. The map demonstrates that the utilization of object-based classification has successfully reduced the presence of salt and pepper noise in the classification of the mined region. This reduction significantly enhances the accuracy and practicality of the classification results.
The Juhugeng coalfield commenced mining operations in 2003 and continued for over a decade. It was not until August 2020 that the government completely halted production activities. Situated near the town of Muli, the Juhugeng coal mine underwent rapid development on the flat terrain in the area, with the S207 motorway serving as a crucial transportation route. As underground coal reserves were accessed and infrastructure improved, the mining area gradually expanded and stabilized until 2013.
A comparison between 2004 and 2009 reveals the construction of an artificial river to divert water. Throughout the development process, there were minimal changes observed in the layout of the coal accumulation areas, buildings, and roads. It was only in 2016 that noticeable signs of land reclamation and ecological restoration became visible, with more prominent indications of reclamation at the mine’s edge being observed for 2019.
By 2016, the water catchment pits had reached a considerable scale, no longer resembling scattered puddles. This suggests the location of open pits and indicates that these pits may have been either out of use or abandoned.
Figure 8 illustrates the statistical information regarding the mining area. The mining area experienced rapid growth until 2013, reaching a size of approximately 36.5 km2. The average annual rates of change exhibited positive trends during the initial three time periods (2004–2009, 2009–2012, and 2012–2013). The expansion rate notably accelerated, with the growth area from 2012 to 2013 surpassing the total growth over the five-year period from 2004 to 2009. Subsequently, the total area of the mine remained within the range of from 35 km2 to 40 km2.
Regarding specific land cover types, open pits and gangue landfills played a significant role in the expansion of the mining area. However, between 2013 and 2016, the rate of change for all of the land cover types decreased, indicating a relatively slower pace of growth. The area covered by open pits exhibited negative growth, suggesting a shift from surface coal mining to deeper excavation. From 2016 to 2019, the restoration area expanded rapidly, contrasting with the trend that was observed for tailings. This pattern persisted until 2021. The proportion of land occupied by industrial buildings and coal accumulation areas remained relatively stable, with minimal changes.
Although the ecological improvement work recognized from the satellite images became larger in 2021 (reaching 20% of the total area), compared with 2016, the total area of the mine was steady, indicating that the environmental impacts caused by illegal mining would not be easily eliminated.
The numerical analysis is presented in the form of a matrix of change (Table 6). The diagonal cells represent areas with no change, while the others indicate that there have been some alterations between the two years.
The matrix tables, specifically Table 6a,b, provide clear insights into the changes among the different land covers. The diagonal cells in these tables, which correspond to almost all of the land cover types, indicate minimal changes, suggesting significant transformations in the mining area. The coal storage area exhibited relatively smooth variations, except for the period of 2013–2016, when new coal stockpiles emerged in the northeast and southwest regions in 2016. Open pits and tailings showed the most significant variations, with significant occupation of the pristine area. The substantial differences in size between the buildings and other ground features may contribute to the frequent changes that were observed. The initial land remediation efforts primarily focused on tailings piles and waste residue accumulation areas, followed by open pits.
The development of the mining industry had a noticeable impact on the land use and land cover in the mining areas. The progression of the mine area can be categorized into three distinct periods: (1) construction period, during which the mine area was in a state of expansion, growing slowly before 2009 and rapidly expanding and stabilizing in 2010–2014, while production activities were also in order; (2) production period, during which the mined area did not change much, from 2014 to 2020, and the mining of coal gradually moved from the surface to the depth of the underground, and during which certain land protection measures were taken at some locations due to the influence of government policies; (3) reclamation period, the central government issued a directive in 2020 to prohibit mining, after which the mine stopped working and land reclamation and ecological restoration were the main actions.
3.4. Vegetation Cover Changes
The FVC was estimated by utilizing the spatial distribution of the NDVI derived from the red and near-infrared channels of Landsat satellite observations. The study area is characterized by low temperatures, an alpine climate, widespread permafrost, and prolonged snow cover on the ground throughout the year, and NDVI estimates receive a large degree of influence from the local climate. Since Landsat satellites were continuously updated from 2003 to 2021, different satellite data products may also affect the data statistics, leading to some errors.
To mitigate these concerns, we employed the Google Earth Engine (GEE) platform to average the FVC values from all of the available cloud-free and unstriped Landsat data during the months of May and October for each year (as shown in Figure 9). This approach helped to minimize the impact of striping artifacts, with the exception of some areas in 2012 where only striped Landsat 7 images were accessible. Furthermore, potential inaccuracies arising from other factors that may affect the vegetation index, such as atmospheric conditions, were minimized through the averaging process.
In general, the mountains and water exhibited similar FVC values across different years, as depicted by the dark blue color. This similarity serves as a reference for observing other features. The yellow color observed in the eastern plateau suggests good vegetation quality in this flat area. However, a growing blue area in the middle of the region disrupts the greenery. A notable contrast can be observed between the FVC maps of 2003 and 2014. The blue area represents artificial disturbances on the map, aligning with the gradual expansion of open-pit mining and its consequent impact on the ecological vegetation. Step by step, the mining activities encroach upon and degrade the natural vegetation. Moreover, the overall vegetation condition in 2021 appears to be better than that in 2014. This improvement can be attributed to the efforts of mine land reclamation and environmental restoration, which have contributed to the recovery and enhancement of vegetation in the area.
To assess the annual variations in vegetation condition, the FVC values are classified into four categories: very low (0–20%), low (20–40%), medium (40–60%), and relatively high (60–100%). Table 7 presents the percentage of the area covered by each FVC class, while Figure 10 illustrates the areas corresponding to each FVC class in relation to the mining area. The impact of land cover change on the vegetation condition is limited to approximately 40 km2, as indicated by the right axis. Examining the period from 2003 to 2009, significant changes in the FVC can be observed, but afterward, the FVC situation remains relatively stable. This impression is primarily due to the FVC change in 2005. During this time, the medium FVC (40–60%) area increased by 76.6 km2, and the relatively high FVC (60–100%) area increased by 32.4 km2. However, both the medium and high FVC areas subsequently decreased by 89.3 km2 and 32.3 km2, respectively, between 2005 and 2006. This dramatic fluctuation surpasses the surface-level influence of land cover change. From 2011 to 2017, the top of the yellow bar gradually increased from 206.3 km2 to 259.87 km2, and then decreased to 189.1 km2 in 2021. The rate of change in the FVC area aligns with that of the mining area, indicating a consistent pattern of change between them.
To better observe the contribution of each landscape type to the FVC values, the average FVC values were calculated for each land cover type, as depicted in Figure 11. The light blue vertical dotted lines indicate the years when land cover classification results were obtained. It is evident that the results nearly encompass the entire development process of the mine, while the FVC line complements the cognition of the mine development. The dot plots, representing hills, plateaus, and water, along with the mean FVC values, exhibit a high degree of consistency. This alignment is also reflected in the maximum FVC values. These similar trends indicate that human factors have minimal influence on the FVC in these regions. In stark contrast, the FVC pattern in the mining area stands out. In the early years, the FVC of the mining area displays a consistent trend, providing evidence of human activity contributing to the decline in FVC.
The analysis of the average seasonal FVC reveals distinct trends in vegetation coverage within the mining area. From 2010 to 2014, there was a decline in vegetation coverage, followed by an upward trend from 2014 to 2020, and a rapid increase from 2020 to 2021. Figure 12, respectively, shows the linear rate of change in the average seasonal FVC in the first two periods and the relative growth rate in the last year. The purple areas in Figure 12a indicate a faster decline in vegetation coverage or a higher degree of damage compared to the average, while the yellow areas represent the opposite. This pattern aligns closely with the expansion of the mining area depicted in Figure 7 during the same period. Figure 12b showcases the relative increase rate. Yellow areas indicate better land restoration efforts, while purple areas indicate areas where restoration efforts are lacking. The reclamation area, as shown in Figure 12b, is particularly evident and primarily located on the slopes where gangue and waste slag have accumulated. In Figure 12c, the vegetation coverage of many sites increased rapidly from approximately 10% to 40–60%, and the focus of reclamation work gradually shifted to the open pits, indicating a spatial sequence of land consolidation efforts.
The surface coal mining activities in the Qilian Mountain areas have led to significant damages to native meadows, wetlands, and permafrost. The natural plateau climate in the region is primarily influenced by precipitation and temperature, which are the main drivers of vegetation activity [68]. TerraClimate data (https://www.nature.com/articles/sdata2017191 (accessed on 9 January 2018)) indicate a slight increase in annual average precipitation, minimum temperature and maximum temperature, wind speed, and downward solar radiation flux in the study area, although the trend is not statistically significant [69]. However, human activities, particularly mining, have been the primary determining factors causing severe ecological degradation. The FVC analysis reflects the corresponding performance based on different periods of mining activities. From 2003 to 2014, the mining was in a growth period, resulting in the excavation or covering of the fragile native ground surface, leading to a significant decline in the FVC. During the stabilization period from 2014 to 2020, land reclamation efforts in some areas caused some improvement in vegetation cover, mitigating the negative impact to some extent. The year 2020 marked a significant increase in FVC, which can be directly attributed to national policies focused on environmental protection and land reclamation.
Notably, the issuance of a directive in August 2014 mandated the complete cessation of mine production and the implementation of measures such as residue treatment and land remediation. In 2017, the central government of China launched a large-scale ecological protection initiative in the Qilian Mountain region, addressing the issues of ecological environment pollution. The performance of the FVC during these key time points further highlights the dominant role of anthropogenic factors, particularly policy interventions, in shaping reclaimed ecosystems [70].
Moreover, there is a high level of consistency between the FVC trends within the mining area and the events occurring at the mine, affirming the usability of FVC as a monitoring tool for mining activities.
4. Discussion
Since open pit mining requires the removal of the vegetation cover, this approach, which involves monitoring land cover and estimating the FVC concurrently, can offer a clear depiction of the progression of mining areas and the changes in vegetation cover. Consequently, it enables the effective monitoring of mine expansion and land reclamation, supplying timely and invaluable information to governmental entities and pertinent management agencies.
In contrast to previous studies conducted in this particular region, which relied on remote sensing techniques, the employment of high spatial resolution data in this investigation has facilitated a more comprehensive comprehension of ground conditions and generated more refined classification outcomes. Given the limited growing season, persistent surface snow cover, and inclement weather patterns prevalent in the study area, acquiring a consistent time series of cloud-free, high-quality imagery at regular intervals from a single high-resolution satellite sensor presented a challenge. Hence, three distinct types of satellite data were employed in this study: SPOT 4, GF-1, and GF-6. The incorporation of multi-source, high-resolution remote sensing data not only extends the temporal coverage but also reduces the time interval, resulting in satisfactory datasets that exhibit both high temporal and spatial resolutions. Although there exist variations in spatial resolution between the SPOT 4 data and GF 1/6 data, the SPOT 4 data were specifically used for monitoring the early stages of mine development, characterized by relatively uniform surface cover, thus mitigating the impact on the classification accuracy.
However, it is important to acknowledge certain limitations of this study. The analysis of the land cover changes solely relied on the results obtained from image classification, without the inclusion of field investigations, which is a notable constraint. Practical limitations prevented the conducting of fieldwork in this study. Nevertheless, credibility was maintained by referencing previous geological surveys, utilizing historical images from Google Earth, and leveraging expert knowledge to identify validation points derived from remote sensing. Furthermore, the impact of different classification methods on the classification results falls beyond the scope of this work.
In the study area, Landsat data spanning from 2003 to 2021 were utilized, providing an extensive temporal coverage for the continuous interannual monitoring of vegetation and facilitating the analysis of surface changes. Various Landsat satellite products were employed to assess vegetation cover, and a simple mean processing approach was applied to mitigate parameter errors arising from different satellite data. However, no additional processing was undertaken to address potential streaks in the data. Furthermore, the integration of other remote sensing data sources, such as synthetic aperture radar (SAR), could be considered for supplementary information to enhance this type of study. Moreover, the inclusion of nighttime data, thermal infrared data, or surface temperature data, which offer different aspects of mine-related information, could further enhance the investigation of mining area.
In the correlation analysis between the land cover and FVC, our main objective was to examine the spatial and temporal changes in vegetation resulting from mining activities, specifically distinguishing between pristine areas and replanted areas. However, it is important to note that this distinction alone cannot provide definitive evidence regarding the underlying causes of vegetation changes. To obtain a more comprehensive understanding and draw meaningful inferences, further field investigations are necessary, which can be combined with the results obtained from our analysis.
Our findings suggest that the impacts of surface mining have led to land degradation, but it is noteworthy that the vegetation has shown promising signs of reclamation efficiency within a relatively short period of time. However, given the temporal evolution of the vegetation, the linear trend observed within this limited timeframe might overestimate the overall success of the reclamation efforts. The time frame examined in this study only captures a short period of reclamation work, emphasizing the need for long-term monitoring of the vegetation dynamics in the reclaimed areas. Future research should focus on assessing the long-term effects and sustainability of reclamation, as this holds direct and significant implications for mining environment protection, land restoration, and ecosystem reconstruction.
5. Conclusions
This paper presents a comprehensive analysis of the Juhugeng mining area, providing a detailed examination of the mining activities and vegetation cover changes over a significant period, from 2003 to 2021. By generating land cover maps and FVC coverage maps for different years, we investigated the spatial and temporal dynamics of the mining area, the impact on local vegetation due to mining, and the progress of land reclamation efforts. The findings reveal a rapid expansion of the mining area and degradation of the vegetation cover since the commencement of mining in 2003. Particularly noteworthy is the period between 2009 and 2013, during which the mining development area more than tripled, and this expansion continued until 2014. However, since 2014, the mining area has stabilized while mining activities persist. Compliance with policy requirements led to some land reclamation efforts, resulting in a substantial increase in vegetation cover within a relatively short period of time.
This study serves as a compelling case study, providing valuable insights for future environmental remediation endeavors in the Juhugeng area. By demonstrating the feasibility of employing multi-source remote sensing satellite imagery to monitor land cover and vegetation changes, it provides a valuable reference for scholars and researchers who are interested in mine management and reclamation assessment using remote sensing technology. The findings and methodology presented in this study contribute to the broader understanding of the monitoring and evaluation of environmental impacts in mining areas, paving the way for more effective and sustainable mine management practices in the future.
Author Contributions
Conceptualization, F.H. and G.H.; methodology, F.H.; validation, F.H.; formal analysis, F.H.; investigation, F.H.; resources, G.W. and Y.P.; data curation, F.H.; writing—original draft preparation, F.H.; writing—review and editing, F.H., G.H. and Z.Z.; visualization, F.H.; supervision, G.H.; project administration, G.H. and G.W. All authors have read and agreed to the published version of the manuscript.
Funding
This research was funded by the Second Tibetan Plateau Scientific Expedition and Research Program (STEP), grant number 2019 QZKK030701; the Strategic Priority Research Program of the Chinese Academy of Sciences, grant number XDA19090300; and the National Natural Science Foundation of China, grant number 61731022.
Data Availability Statement
Not applicable.
Acknowledgments
The authors thank the anonymous reviewers and the editors for their valuable comments to improve our manuscript.
Conflicts of Interest
The authors declare no conflict of interest.
References
- Haibin, L.; Zhenling, L. Recycling Utilization Patterns of Coal Mining Waste in China. Resour. Conserv. Recycl. 2010, 54, 1331–1340. [Google Scholar] [CrossRef]
- Dai, S.; Ren, D.; Chou, C.-L.; Finkelman, R.B.; Seredin, V.V.; Zhou, Y. Geochemistry of Trace Elements in Chinese Coals: A Review of Abundances, Genetic Types, Impacts on Human Health, and Industrial Utilization. Int. J. Coal Geol. 2012, 94, 3–21. [Google Scholar] [CrossRef]
- Rathore, C.; Wright, R. Monitoring Environmental Impacts of Surface Coal-Mining. Int. J. Remote Sens. 1993, 14, 1021–1042. [Google Scholar] [CrossRef]
- Peng, Y.; He, G.; Zhang, Z.M.; Jiang, W.; Ouyang, Z.; Wang, G. Eco-Environment Dynamic Monitoring and Assessment of Rare Earth Mining Area in Southern Ganzhou Using Remote Sensing. Acta Ecol. Sin. 2016, 36, 1676–1685. [Google Scholar]
- Medinac, F.; Bamford, T.; Hart, M.; Kowalczyk, M.; Esmaeili, K. Haul Road Monitoring in Open Pit Mines Using Unmanned Aerial Vehicles: A Case Study at Bald Mountain Mine Site. Min. Metall. Explor. 2020, 37, 1877–1883. [Google Scholar] [CrossRef]
- Ren, H.; Zhao, Y.; Xiao, W.; Hu, Z. A Review of UAV Monitoring in Mining Areas: Current Status and Future Perspectives. Int. J. Coal. Sci. Technol. 2019, 6, 320–333. [Google Scholar] [CrossRef] [Green Version]
- Padró, J.-C.; Carabassa, V.; Balagué, J.; Brotons, L.; Alcañiz, J.M.; Pons, X. Monitoring Opencast Mine Restorations Using Unmanned Aerial System (UAS) Imagery. Sci. Total Environ. 2018, 657, 1602–1614. [Google Scholar] [CrossRef]
- Johansen, K.; Erskine, P.D.; McCabe, M.F. Using Unmanned Aerial Vehicles to Assess the Rehabilitation Performance of Open Cut Coal Mines. J. Clean. Prod. 2019, 209, 819–833. [Google Scholar] [CrossRef]
- Tong, X.; Liu, X.; Chen, P.; Liu, S.; Luan, K.; Li, L.; Liu, S.; Liu, X.; Xie, H.; Jin, Y.; et al. Integration of UAV-Based Photogrammetry and Terrestrial Laser Scanning for the Three-Dimensional Mapping and Monitoring of Open-Pit Mine Areas. Remote Sens. 2015, 7, 6635–6662. [Google Scholar] [CrossRef] [Green Version]
- Wu, Y.; Ma, W.; Su, Q.; Liu, S.; Ge, Y. Remote Sensing Image Registration Based on Local Structural Information and Global Constraint. J. Appl. Rem. Sens. 2019, 13, 016518. [Google Scholar] [CrossRef]
- He, G.; Zhang, Z.; Jiao, W.; Long, T.; Peng, Y.; Wang, G.; Yin, R.; Wang, W.; Zhang, X.; Liu, H.; et al. Generation of Ready to Use (RTU) Products over China Based on Landsat Series Data. Big Earth Data 2018, 2, 56–64. [Google Scholar] [CrossRef] [Green Version]
- Zeng, L.; Wardlow, B.; Xiang, D.; Hu, S.; Li, D. A Review of Vegetation Phenological Metrics Extraction Using Time-Series, Multispectral Satellite Data. Remote Sens. Environ. 2020, 237, 111511. [Google Scholar] [CrossRef]
- Long, T.; Zhang, Z.; He, G.; Jiao, W.; Tang, C.; Wu, B.; Zhang, X.; Wang, G.; Yin, R. 30 m Resolution Global Annual Burned Area Mapping Based on Landsat Images and Google Earth Engine. Remote Sens. 2019, 11, 489. [Google Scholar] [CrossRef] [Green Version]
- Cohen, W.B.; Goward, S.N. Landsat’s Role in Ecological Applications of Remote Sensing. BioScience 2004, 54, 535. [Google Scholar] [CrossRef]
- Vidal-Macua, J.J.; Nicolau, J.M.; Vicente, E.; Moreno-de las Heras, M. Assessing Vegetation Recovery in Reclaimed Opencast Mines of the Teruel Coalfield (Spain) Using Landsat Time Series and Boosted Regression Trees. Sci. Total Environ. 2020, 717, 137250. [Google Scholar] [CrossRef]
- Erener, A. Remote Sensing of Vegetation Health for Reclaimed Areas of Seyitomer Open Cast Coal Mine. Int. J. Coal Geol. 2011, 86, 20–26. [Google Scholar] [CrossRef]
- Almeida-Filho, R.; Shimabukuro, Y.E. Digital Processing of a Landsat-TM Time Series for Mapping and Monitoring Degraded Areas Caused by Independent Gold Miners, Roraima State, Brazilian Amazon. Remote Sens. Environ. 2002, 79, 42–50. [Google Scholar] [CrossRef]
- Demirel, N.; Düzgün, Ş.; Emil, M.K. Landuse Change Detection in a Surface Coal Mine Area Using Multi-Temporal High-Resolution Satellite Images. Int. J. Min. Reclam. Environ. 2011, 25, 342–349. [Google Scholar] [CrossRef]
- Pagot, E.; Pesaresi, M.; Buda, D.; Ehrlich, D. Development of an Object-oriented Classification Model Using Very High Resolution Satellite Imagery for Monitoring Diamond Mining Activity. Int. J. Remote Sens. 2008, 29, 499–512. [Google Scholar] [CrossRef]
- Yu, S.; Chen, Z.; Wang, Y. Application of Multi-Sensor Image in Monitoring Mining Activities and Related Environment Changes: A Case Study at Daye, Hubei, China. In Proceedings of the Remote Sensing of the Environment: 15th National Symposium on Remote Sensing of China, Guiyan City, China, 19–23 August 2006; p. 62000V. [Google Scholar]
- Charou, E.; Stefouli, M.; Dimitrakopoulos, D.; Vasiliou, E.; Mavrantza, O.D. Using Remote Sensing to Assess Impact of Mining Activities on Land and Water Resources. Mine Water Environ. 2010, 29, 45–52. [Google Scholar] [CrossRef]
- Demirel, N.; Emil, M.K.; Duzgun, H.S. Surface Coal Mine Area Monitoring Using Multi-Temporal High-Resolution Satellite Imagery. Int. J. Coal Geol. 2011, 86, 3–11. [Google Scholar] [CrossRef]
- Blahwar, B.; Srivastav, S.K.; de Smeth, J.B. Use of High-Resolution Satellite Imagery for Investigating Acid Mine Drainage from Artisanal Coal Mining in North-Eastern India. Geocarto Int. 2012, 27, 231–247. [Google Scholar] [CrossRef]
- Chen, L.; Letu, H.; Fan, M.; Shang, H.; Tao, J.; Wu, L.; Zhang, Y.; Yu, C.; Gu, J.; Zhang, N.; et al. An Introduction to the Chinese High-Resolution Earth Observation System: Gaofen-1~7 Civilian Satellites. J. Remote Sens. 2022, 2022, 9769536. [Google Scholar] [CrossRef]
- Chen, T.; Zheng, X.; Niu, R.; Plaza, A. Open-Pit Mine Area Mapping with Gaofen-2 Satellite Images Using U-Net+. IEEE J. Sel. Top. Appl. Earth Obs. Remote Sens. 2022, 15, 3589–3599. [Google Scholar] [CrossRef]
- Peng, Y.; Zhang, Z.; He, G.; Wei, M. An Improved GrabCut Method Based on a Visual Attention Model for Rare-Earth Ore Mining Area Recognition with High-Resolution Remote Sensing Images. Remote Sens. 2019, 11, 987. [Google Scholar] [CrossRef] [Green Version]
- Li, Q.; Chen, Z.; Zhang, B.; Li, B.; Lu, K.; Lu, L.; Guo, H. Detection of Tailings Dams Using High-Resolution Satellite Imagery and a Single Shot Multibox Detector in the Jing–Jin–Ji Region, China. Remote Sens. 2020, 12, 2626. [Google Scholar] [CrossRef]
- Schmidt, H.; Glaesser, C. Multitemporal Analysis of Satellite Data and Their Use in the Monitoring of the Environmental Impacts of Open Cast Lignite Mining Areas in Eastern Germany. Int. J. Remote Sens. 1998, 19, 2245–2260. [Google Scholar] [CrossRef]
- Hao, L.; Zhang, Z.; He, W.; Chen, T. Tailings Reservoir Recognition Factors of the High Resolution Remote Sensing Image in Southeastern Hubei. Remote Sens. Nat. Resour. 2012, 24, 154–158. [Google Scholar] [CrossRef]
- Volesky, J. Remote Sensing and Mineral Exploration in the Arabian Shield: The Wadi Bidah Mining District Example. Gondwana Res. 2001, 4, 198–200. [Google Scholar] [CrossRef]
- Mansor, S.B.; Cracknell, A.P.; Shilin, B.V.; Gornyi, V.I. Monitoring of Underground Coal Fires Using Thermal Infrared Data. Int. J. Remote Sens. 1994, 15, 1675–1685. [Google Scholar] [CrossRef]
- Ng, A.H.-M.; Chang, H.-C.; Ge, L.; Rizos, C.; Omura, M. Assessment of Radar Interferometry Performance for Ground Subsidence Monitoring Due to Underground Mining. Earth Planets Space 2009, 61, 733–745. [Google Scholar] [CrossRef] [Green Version]
- Yi, Z.; Liu, M.; Liu, X.; Wang, Y.; Wu, L.; Wang, Z.; Zhu, L. Long-Term Landsat Monitoring of Mining Subsidence Based on Spatiotemporal Variations in Soil Moisture: A Case Study of Shanxi Province, China. Int. J. Appl. Earth Obs. Geoinf. 2021, 102, 102447. [Google Scholar] [CrossRef]
- Ng, A.H.-M.; Ge, L.; Yan, Y.; Li, X.; Chang, H.-C.; Zhang, K.; Rizos, C. Mapping Accumulated Mine Subsidence Using Small Stack of SAR Differential Interferograms in the Southern Coalfield of New South Wales, Australia. Eng. Geol. 2010, 115, 1–15. [Google Scholar] [CrossRef]
- Zhao, Y.; Li, X.; Zhang, P.; Hu, Y.; Huang, L. Effects of Vegetation Reclamation on Temperature and Humidity Properties of a Dumpsite: A Case Study in the Open Pit Coal Mine of Heidaigou. Arid. Land Res. Manag. 2015, 29, 375–381. [Google Scholar] [CrossRef]
- Townsend, P.A.; Helmers, D.P.; Kingdon, C.C.; McNeil, B.E.; de Beurs, K.M.; Eshleman, K.N. Changes in the Extent of Surface Mining and Reclamation in the Central Appalachians Detected Using a 1976–2006 Landsat Time Series. Remote Sens. Environ. 2009, 113, 62–72. [Google Scholar] [CrossRef]
- Xie, L.; Wu, W.; Huang, X.; Ou, P.; Lin, Z.; Zhiling, W.; Song, Y.; Lang, T.; Huangfu, W.; Zhang, Y.; et al. Mining and Restoration Monitoring of Rare Earth Element (REE) Exploitation by New Remote Sensing Indicators in Southern Jiangxi, China. Remote Sens. 2020, 12, 3558. [Google Scholar] [CrossRef]
- Saini, V.; Gupta, R.P.; Arora, M.K. Environmental Impact Studies in Coalfields in India: A Case Study from Jharia Coal-Field. Renew. Sustain. Energy Rev. 2016, 53, 1222–1239. [Google Scholar] [CrossRef]
- Legg, C.A. Applications of Remote Sensing to Environmental Aspects of Surface Mining Operations in the United Kingdom. In Remote Sensing: An Operational Technology for the Mining and Petroleum Industries; Springer: Dordrecht, The Netherlands, 1990; pp. 159–164. ISBN 978-94-010-9746-8. [Google Scholar]
- Zawadzki, J.; Przezdziecki, K.; Miatkowski, Z. Determining the Area of Influence of Depression Cone in the Vicinity of Lignite Mine by Means of Triangle Method and LANDSAT TM/ETM plus Satellite Images. J. Environ. Manag. 2016, 166, 605–614. [Google Scholar] [CrossRef]
- Petja, B.; Twumasi, Y.; Tengbeh, G. The Use of Remote Sensing to Detect Asbestos Mining Degradation in Mafefe and Mathabatha, South Africa. In Proceedings of the 2006 IEEE International Symposium on Geoscience and Remote Sensing, IEEE, Denver, CO, USA, 31 July–4 August 2006; pp. 1591–1593. [Google Scholar]
- Schmid, T.; Rico, C.; Rodriguez-Rastrero, M.; Sierra, M.; Diaz-Puente, F.; Pelayo, M.; Milian, R. Monitoring of the Mercury Mining Site Almaden Implementing Remote Sensing Technologies. Environ. Res. 2013, 125, 92–102. [Google Scholar] [CrossRef]
- Zhang, Z.; He, G.; Wang, M.; Wang, Z.; Long, T.; Peng, Y. Detecting Decadal Land Cover Changes in Mining Regions Based on Satellite Remotely Sensed Imagery: A Case Study of the Stone Mining Area in Luoyuan County, SE China. Photogram Eng. Remote Sens. 2015, 81, 745–751. [Google Scholar] [CrossRef]
- Willhauck, G. Comparison of Object Oriented Classification Techniques and Standard Image Analysis for the Use of Change Detection between SPOT Multispectral Satellite Images and Aerial Photos. ISPRS J. Photogramm. Remote Sens. 2000, 33, 214–221. [Google Scholar]
- Wang, C.; Chen, T.; Plaza, A. MFE-ResNet: A New Extraction Framework for Land Cover Characterization in Mining Areas. Future Gener. Comput. Syst. 2023, 145, 550–562. [Google Scholar] [CrossRef]
- Hu, J.; Ye, B.; Bai, Z.; Feng, Y. Remote Sensing Monitoring of Vegetation Reclamation in the Antaibao Open-Pit Mine. Remote Sens. 2022, 14, 5634. [Google Scholar] [CrossRef]
- Xiao, J.; Moody, A. A Comparison of Methods for Estimating Fractional Green Vegetation Cover within a Desert-to-Upland Transition Zone in Central New Mexico, USA. Remote Sens. Environ. 2005, 98, 237–250. [Google Scholar] [CrossRef]
- Jia, K.; Liang, S.; Liu, S.; Li, Y.; Xiao, Z.; Yao, Y.; Jiang, B.; Zhao, X.; Wang, X.; Xu, S.; et al. Global Land Surface Fractional Vegetation Cover Estimation Using General Regression Neural Networks From MODIS Surface Reflectance. IEEE Trans. Geosci. Remote Sens. 2015, 53, 4787–4796. [Google Scholar] [CrossRef]
- Song, W.; Mu, X.; Ruan, G.; Gao, Z.; Li, L.; Yan, G. Estimating Fractional Vegetation Cover and the Vegetation Index of Bare Soil and Highly Dense Vegetation with a Physically Based Method. Int. J. Appl. Earth Obs. Geoinf. 2017, 58, 168–176. [Google Scholar] [CrossRef]
- Mu, X.; Song, W.; Gao, Z.; McVicar, T.R.; Donohue, R.J.; Yan, G. Fractional Vegetation Cover Estimation by Using Multi-Angle Vegetation Index. Remote Sens. Environ. 2018, 216, 44–56. [Google Scholar] [CrossRef]
- Zhang, X.; Liao, C.; Li, J.; Sun, Q. Fractional Vegetation Cover Estimation in Arid and Semi-Arid Environments Using HJ-1 Satellite Hyperspectral Data. Int. J. Appl. Earth Obs. Geoinf. 2013, 21, 506–512. [Google Scholar] [CrossRef]
- Xiao, Z.; Wang, T.; Liang, S.; Sun, R. Estimating the Fractional Vegetation Cover from GLASS Leaf Area Index Product. Remote Sens. 2016, 8, 337. [Google Scholar] [CrossRef] [Green Version]
- Dai, Z.; Ding, Y.; Xu, C.; Chen, Y.; Liu, L. Evaluation of the Impact of Crop Residue on Fractional Vegetation Cover Estimation by Vegetation Indices over Conservation Tillage Cropland: A Simulation Study. Int. J. Remote Sens. 2022, 43, 6463–6482. [Google Scholar] [CrossRef]
- Tu, Y.; Jia, K.; Liang, S.; Wei, X.; Yao, Y.; Zhang, X. Fractional Vegetation Cover Estimation in Heterogeneous Areas by Combining a Radiative Transfer Model and a Dynamic Vegetation Model. Int. J. Digit. Earth 2020, 13, 487–503. [Google Scholar] [CrossRef]
- Karan, S.K.; Kumar, A.; Samadder, S.R. Evaluation of Geotechnical Properties of Overburden Dump for Better Reclamation Success in Mining Areas. Environ. Earth Sci. 2017, 76, 770. [Google Scholar] [CrossRef]
- Swab, R.M.; Lorenz, N.; Byrd, S.; Dick, R. Native Vegetation in Reclamation: Improving Habitat and Ecosystem Function through Using Prairie Species in Mine Land Reclamation. Ecol. Eng. 2017, 108, 525–536. [Google Scholar] [CrossRef]
- Zhang, M.; Wang, J.; Li, S. Tempo-Spatial Changes and Main Anthropogenic Influence Factors of Vegetation Fractional Coverage in a Large-Scale Opencast Coal Mine Area from 1992 to 2015. J. Clean. Prod. 2019, 232, 940–952. [Google Scholar] [CrossRef]
- Suo, H.; Huang, Y.; Li, L. Remote Sensing Estimation of Vegetation Coverage in Muli Coal Mine Based on High-Fraction Data. Comput. Eng. Softw. 2019, 40, 153–155. [Google Scholar]
- Wu, C.; Zhang, X.; Wang, Y.; Li, R. Analysis of Vegetation Coverage Extraction and Time-Space Change in Muli Coalfield Based on Landsat Image. Geomat. Spat. Inf. Technol. 2020, 43, 67–72. [Google Scholar]
- Ma, S.; Li, S.; An, P.; Yang, W.; Xin, R. Remote sensing monitoring and quality evaluation for the mine geological environment of the Juhugeng coal mining area in Qinghai Province. Remote Sens. Land Resour. 2015, 27, 139–145. [Google Scholar] [CrossRef]
- He, F.; Liu, R.; Xu, Y.; Qiao, G.; Ke, H. Monitoring and evaluation of mine geological environment in the Muli coal mining area based on remote sensing. Geol. Bull. China 2018, 37, 2251–2259. [Google Scholar]
- Townshend, J.; Justice, C.; Li, W.; Gurney, C.; McManus, J. Global Land Cover Classification by Remote Sensing: Present Capabilities and Future Possibilities. Remote Sens. Environ. 1991, 35, 243–255. [Google Scholar] [CrossRef]
- He, G.; Wang, G.; Long, T.; Peng, Y.; Jiang, W.; Yin, R.; Jiao, W.; Zhang, Z. Opening and Sharing of Big Earth Observation Data: Challenges and Countermeasures. Bull. Chin. Acad. Sci. 2018, 33, 783–790. [Google Scholar]
- Timofeev, R. Classification and Regression Trees (CART) Theory and Applications. Master’s Thesis, Humboldt University, Berlin, Germany, 2004; p. 41. [Google Scholar]
- Otukei, J.R.; Blaschke, T. Land Cover Change Assessment Using Decision Trees, Support Vector Machines and Maximum Likelihood Classification Algorithms. Int. J. Appl. Earth Obs. Geoinf. 2010, 12, S27–S31. [Google Scholar] [CrossRef]
- Rouse, W.; Haas, R.H. Monitoring Vegetation Systems in the Great Plains with Erts. In Third Earth Resources Technology Satellite-1 Symposium; NASA: Washington, DC, USA, 1974; Volume 1, pp. 309–317. [Google Scholar]
- Gutman, G.; Ignatov, A. The Derivation of the Green Vegetation Fraction from NOAA/AVHRR Data for Use in Numerical Weather Prediction Models. Int. J. Remote Sens. 1998, 19, 1533–1543. [Google Scholar] [CrossRef]
- Nemani, R.R.; Keeling, C.D.; Hashimoto, H.; Jolly, W.M.; Piper, S.C.; Tucker, C.J.; Myneni, R.B.; Running, S.W. Climate-Driven Increases in Global Terrestrial Net Primary Production from 1982 to 1999. Science 2003, 300, 1560–1563. [Google Scholar] [CrossRef] [PubMed] [Green Version]
- Abatzoglou, J.T.; Dobrowski, S.Z.; Parks, S.A.; Hegewisch, K.C. TerraClimate, a High-Resolution Global Dataset of Monthly Climate and Climatic Water Balance from 1958–2015. Sci. Data 2018, 5, 170191. [Google Scholar] [CrossRef] [PubMed] [Green Version]
- Feng, Y.; Wang, J.; Bai, Z.; Reading, L. Effects of Surface Coal Mining and Land Reclamation on Soil Properties: A Review. Earth-Sci. Rev. 2019, 191, 12–25. [Google Scholar] [CrossRef]
Figure 1.
Location of the study area and standard false color GF1 image of the coal mine (2021). The upper right subfigure is the region of Qinghai Province, with the red line delineating the boundary of Tianjun County, and the red dot indicating the location of Muli Town.
Figure 1.
Location of the study area and standard false color GF1 image of the coal mine (2021). The upper right subfigure is the region of Qinghai Province, with the red line delineating the boundary of Tianjun County, and the red dot indicating the location of Muli Town.

Figure 2.
Test result for a site where land cover type includes coal storage, buildings, reclamation, and open pits. (a) Statistical analysis of variance; segmentation results using scale parameters of: (b) 600; (c) 450; (d) 360; and (e) 290. The yellow square highlights the region where the segmentation results exhibit more pronounced changes due to scale parameter variations. (c–e) represent magnified views of the yellow square in (b).

Figure 3.
Test result for a site that has water and tailings. (a) Statistical analysis of variance; segmentation results using scale parameters of: (b) 780; (c) 530; (d) 400; and (e) 280. Land cover type contains coal storage, buildings, restoration, and open pits. The yellow squares highlight the regions where the segmentation results exhibit more pronounced changes due to scale parameter variations.

Figure 4.
Test result for a site with lots of artificial coverings. (a) Statistical analysis of variance; segmentation results using scale parameters of: (b) 375; (c) 280; and (d) 210. The yellow squares highlight the regions where the segmentation results exhibit more pronounced changes due to scale parameter variations.

Figure 5.
Segmentation with varying compactness parameters: (a) compactness: 0.1; (b) compactness: 0.3; (c) compactness: 0.5; (d) compactness: 0.7; and (e) compactness: 0.9.
Figure 5.
Segmentation with varying compactness parameters: (a) compactness: 0.1; (b) compactness: 0.3; (c) compactness: 0.5; (d) compactness: 0.7; and (e) compactness: 0.9.

Figure 6.
Segmentation with varying shape parameters: (a) shape: 0.1; (b) shape: 0.3; (c) shape: 0.5; (d) shape: 0.7; and (e) shape: 0.9.
Figure 6.
Segmentation with varying shape parameters: (a) shape: 0.1; (b) shape: 0.3; (c) shape: 0.5; (d) shape: 0.7; and (e) shape: 0.9.

Figure 7.
Changes in Juhugeng mine in 2004, 2009, 2012, 2013, 2016, 2019, and 2021.

Figure 8.
Area statistics: (a) area of mine; (b) average annual change rates of main land cover types.
Figure 8.
Area statistics: (a) area of mine; (b) average annual change rates of main land cover types.

Figure 9.
Spatial distribution of averaged FVC from 2003 to 2021.

Figure 10.
The area of four FVC levels and total mining area.

Figure 11.
Yearly mean FVC for main land cover types in the study area.

Figure 12.
FVC trend in three periods: (a) FVC percentage decrease from 2010 to 2014; (b) FVC percentage increase from 2014 to 2020; (c) FVC relative increase rate between 2020 and 2021.
Figure 12.
FVC trend in three periods: (a) FVC percentage decrease from 2010 to 2014; (b) FVC percentage increase from 2014 to 2020; (c) FVC relative increase rate between 2020 and 2021.


Table 1.
SPOT 4, GF-1, and GF-6 data collection.
| Id | Satellite | Date |
|---|---|---|
| 1 | SPOT 4 | 15 June 2004 |
| 2 | SPOT 4 | 4 May 2009 |
| 3 | SPOT 4 | 10 November 2012 |
| 4 | GF-1 | 12 December 2013 |
| 5 | GF-1 | 16 November 2016 |
| 6 | GF-6 | 15 August 2019 |
| 7 | GF-1 | 3 June 2021 |
Table 2.
Selected features.
| Object Features | Feature | Formula |
|---|---|---|
| Layer Values | mean | |
| brightness | ||
| stddev | ||
| Geometry | length/width | |
| shape index | ||
| Texture | homogeneity | |
| contrast | ||
| entropy | ||
| stddev |
Table 3.
Criteria for setting segmentation parameters (GF-1 and GF-6 data).
| Parameter | Setting Value | Target Ground Object |
|---|---|---|
| Scale | 780~950 | pristine area, water |
| 400~530 | coal storage, water (with small area, probably polluted), open pits, tailing deposits | |
| 180~360 | restoration area, roads, buildings, area under a cover | |
| Shape | 0.3 | - |
| Compactness | 0.5 | - |
Table 4.
Producer’s and user’s accuracy of mapped cover class.
| (a) Producer’s and user’s accuracy of mapped cover class in 2004, 2009, 2012, and 2013 | ||||||||||||||||||||||||
| 2004 | 2009 | 2012 | 2013 | |||||||||||||||||||||
| Producer’s Accuracy | User’s Accuracy | Producer’s Accuracy | User’s Accuracy | Producer’s Accuracy | User’s Accuracy | Producer’s Accuracy | User’s Accuracy | |||||||||||||||||
| Buildings | 99.9 | 99.9 | 66.7 | 99.9 | 95.0 | 82.6 | 89.5 | 94.4 | ||||||||||||||||
| Coal storage | - | - | 99.9 | 99.9 | 92.3 | 92.3 | 90.9 | 66.7 | ||||||||||||||||
| Open pits | 80.8 | 87.5 | 77.8 | 93.3 | 81.8 | 91.5 | 78.2 | 93.7 | ||||||||||||||||
| Pristine area | 99.0 | 99.0 | 99.1 | 96.9 | 96.5 | 95.4 | 98.4 | 95.0 | ||||||||||||||||
| Roads | 71.4 | 99.9 | 77.8 | 99.9 | 38.5 | 55.6 | 87.5 | 66.7 | ||||||||||||||||
| Tailings | 92.3 | 60.0 | 83.6 | 83.6 | 89.7 | 83.4 | 87.0 | 81.1 | ||||||||||||||||
| Water | 66.7 | 99.9 | 84.6 | 78.6 | 73.3 | 73.3 | 80.0 | 88.9 | ||||||||||||||||
| (b) Producer’s and user’s accuracy of mapped cover class in 2016, 2019, and 2021 | ||||||||||||||||||||||||
| 2016 | 2019 | 2021 | ||||||||||||||||||||||
| Producer’s Accuracy | User’s Accuracy | Producer’s Accuracy | User’s Accuracy | Producer’s Accuracy | User’s Accuracy | |||||||||||||||||||
| Buildings | 84.8 | 84.8 | 82.8 | 82.8 | 94.1 | 94.1 | ||||||||||||||||||
| Coal storage | 99.9 | 92.0 | 92.0 | 92.0 | 99.9 | 92.0 | ||||||||||||||||||
| Cover | - | - | 85.7 | 81.8 | 87.5 | 99.9 | ||||||||||||||||||
| Open pit | 72.8 | 81.7 | 74.0 | 89.8 | 75.0 | 91.0 | ||||||||||||||||||
| Pristine area | 96.0 | 88.6 | 95.7 | 96.2 | 94.3 | 86.7 | ||||||||||||||||||
| Restoration | 55.6 | 83.3 | 72.3 | 85.0 | 58.1 | 94.3 | ||||||||||||||||||
| Roads | 91.7 | 84.6 | 99.9 | 72.7 | 58.8 | 62.5 | ||||||||||||||||||
| Tailings | 80.3 | 78.7 | 88.1 | 74.6 | 92.5 | 74.7 | ||||||||||||||||||
| Water | 69.0 | 90.9 | 82.8 | 77.4 | 87.5 | 94.6 | ||||||||||||||||||
Table 5.
Overall accuracy (OA) and kappa of mapped cover class.
| 2004 | 2009 | 2012 | 2013 | 2016 | 2019 | 2021 | |
|---|---|---|---|---|---|---|---|
| OA | 0.98 | 0.95 | 0.90 | 0.89 | 0.84 | 0.86 | 0.85 |
| Kappa | 0.84 | 0.86 | 0.86 | 0.85 | 0.79 | 0.82 | 0.81 |
Table 6.
Land cover transition matrix (unit:km2).
| (a) 2004–2009 land cover transition matrix | |||||||||
| Buildings | Coal Storage | Open Pits | Pristine Area | Tailings | Water | Total | |||
| Buildings | 0.015 | 0 | 0 | 0.000 | 0.005 | 0 | 0.020 | ||
| Open pits | 0.007 | 0.020 | 1.410 | 0.070 | 0.341 | 0 | 1.848 | ||
| Pristine area | 0.078 | 0.097 | 2.956 | 131.169 | 3.932 | 4.066 | 142.298 | ||
| Tailings | 0 | 0 | 0.546 | 0.076 | 0.236 | 0.060 | 0.918 | ||
| Water | 0.003 | 0 | 0 | 2.190 | 0.048 | 1.342 | 3.583 | ||
| Total | 0.103 | 0.117 | 4.912 | 133.505 | 4.563 | 5.468 | 148.667 | ||
| (b) 2009–2012 land cover transition matrix | |||||||||
| Buildings | Coal Storage | Open Pits | Tailings | Pristine Area | Water | Total | |||
| Buildings | 0.045 | 0 | 0.029 | 0.003 | 0.037 | 0.010 | 0.124 | ||
| Coal storage | 0 | 0.091 | 0.020 | 0.006 | 0 | 0 | 0.117 | ||
| Open pits | 0.003 | 0 | 4.427 | 0.203 | 0.298 | 0.008 | 4.938 | ||
| Tailings | 0.087 | 0.234 | 1.163 | 2.662 | 0.392 | 0.076 | 4.615 | ||
| Pristine area | 0.608 | 0.113 | 5.317 | 10.521 | 111.473 | 4.560 | 132.591 | ||
| Water | 0.004 | 0 | 0.240 | 0.295 | 3.205 | 1.705 | 5.448 | ||
| Total | 0.747 | 0.438 | 11.196 | 13.690 | 115.405 | 6.358 | 147.833 | ||
| (c) 2012–2013 land cover transition matrix | |||||||||
| Buildings | Coal Storage | Open Pits | Tailings | Pristine Area | Water | Total | |||
| Buildings | 0.450 | 0 | 0.016 | 0.173 | 0.123 | 0.000 | 0.763 | ||
| Coal storage | 0.000 | 0.295 | 0.000 | 0.149 | 0.006 | 0 | 0.451 | ||
| Open pits | 0.018 | 0.033 | 10.509 | 0.320 | 0.385 | 0.038 | 11.302 | ||
| Tailings | 0.558 | 0.087 | 1.580 | 10.830 | 0.712 | 0.049 | 13.817 | ||
| Pristine area | 0.326 | 0.001 | 3.121 | 5.450 | 105.576 | 0.885 | 115.360 | ||
| Water | 0.009 | 0 | 0.111 | 0.312 | 4.691 | 1.211 | 6.335 | ||
| Total | 1.363 | 0.416 | 15.338 | 17.233 | 111.493 | 2.184 | 148.026 | ||
| (d) 2013–2016 land cover transition matrix | |||||||||
| Buildings | Coal Storage | Open Pits | Restoration | Tailings | Pristine Area | Water | Total | ||
| Buildings | 0.814 | 0.002 | 0.020 | 0 | 0.313 | 0.223 | 0.001 | 1.373 | |
| Coal storage | 0.001 | 0.366 | 0.024 | 0.002 | 0.019 | 0.002 | 0 | 0.415 | |
| Open pits | 0.020 | 0.054 | 12.243 | 0 | 1.558 | 0.790 | 0.770 | 15.435 | |
| Tailings | 0.436 | 0.341 | 0.553 | 0.778 | 13.409 | 1.671 | 0.194 | 17.382 | |
| Pristine area | 0.322 | 0.003 | 1.092 | 0.022 | 3.049 | 106.117 | 1.344 | 111.950 | |
| Water | 0.005 | 0 | 0.035 | 0.014 | 0.087 | 0.841 | 1.233 | 2.215 | |
| Total | 1.598 | 0.766 | 13.967 | 0.816 | 18.435 | 109.645 | 3.542 | 148.770 | |
| (e) 2016–2019 land cover transition matrix | |||||||||
| Buildings | Coal Storage | Cover | Open Pits | Restoration | Tailings | Pristine Area | Water | Total | |
| Buildings | 0.823 | 0.004 | 0.027 | 0.008 | 0.123 | 0.306 | 0.138 | 0.005 | 1.434 |
| Coal storage | 0.000 | 0.674 | 0.031 | 0.005 | 0.008 | 0.042 | 0.000 | 0 | 0.762 |
| Open pits | 0.005 | 0.003 | 0.042 | 11.283 | 0.329 | 0.609 | 0.930 | 0.611 | 13.813 |
| Restoration | 0.000 | 0.004 | 0 | 0 | 0.770 | 0.002 | 0.008 | 0.014 | 0.798 |
| Tailings | 0.065 | 0.148 | 0.263 | 1.610 | 2.350 | 12.269 | 1.320 | 0.136 | 18.162 |
| Pristine area | 0.156 | 0.005 | 0.038 | 0.381 | 0.061 | 2.068 | 105.313 | 0.870 | 108.893 |
| Water | 0.034 | 0.000 | 0.017 | 0.212 | 0.002 | 0.096 | 1.225 | 1.917 | 3.504 |
| Total | 1.084 | 0.839 | 0.419 | 13.500 | 3.643 | 15.393 | 108.934 | 3.552 | 147.366 |
| (f) 2019–2021 land cover transition matrix | |||||||||
| Buildings | Coal Storage | Cover | Open Pits | Restoration | Tailings | Pristine Area | Water | Total | |
| Buildings | 0.554 | 0.006 | 0 | 0.004 | 0.036 | 0.269 | 0.175 | 0.011 | 1.056 |
| Coal storage | 0.005 | 0.762 | 0 | 0.012 | 0.050 | 0.005 | 0.002 | 0 | 0.835 |
| Cover | 0.004 | 0.010 | 0.004 | 0.024 | 0.062 | 0.236 | 0.073 | 0.000 | 0.414 |
| Open pits | 0.006 | 0.001 | 0.264 | 9.594 | 2.048 | 0.545 | 0.347 | 0.577 | 13.381 |
| Restoration | 0.004 | 0.020 | 0 | 0.137 | 3.294 | 0.096 | 0.041 | 0.008 | 3.600 |
| Tailings | 0.079 | 0.142 | 0.082 | 0.628 | 0.861 | 12.183 | 1.057 | 0.239 | 15.272 |
| Pristine area | 0.100 | 0.031 | 0.006 | 0.180 | 0.267 | 0.955 | 104.231 | 2.957 | 108.727 |
| Water | 0.004 | 0 | 0.001 | 0.105 | 0.067 | 0.062 | 0.578 | 2.637 | 3.455 |
| Total | 0.757 | 0.972 | 0.358 | 10.685 | 6.683 | 14.352 | 106.504 | 6.431 | 146.741 |
Table 7.
FVC classified area statistical percentage (%).
| Class | 2003 | 2004 | 2005 | 2006 | 2007 | 2008 | 2009 | 2010 | 2011 | 2012 |
|---|---|---|---|---|---|---|---|---|---|---|
| 0–20% | 27.48 | 29.62 | 20.93 | 29.49 | 25.86 | 27.72 | 28.59 | 23.55 | 22.21 | 27.21 |
| 20–40% | 39.51 | 39.04 | 22.17 | 42.08 | 30.59 | 40.35 | 44.19 | 27.56 | 26.10 | 26.67 |
| 40–60% | 32.98 | 31.29 | 49.24 | 28.32 | 43.39 | 31.91 | 27.20 | 47.71 | 50.90 | 45.96 |
| 60–100% | 0.03 | 0.05 | 7.66 | 0.10 | 0.15 | 0.02 | 0.02 | 1.18 | 0.78 | 0.16 |
| Class | 2013 | 2014 | 2015 | 2016 | 2017 | 2018 | 2019 | 2020 | 2021 | |
| 0–20% | 26.02 | 28.00 | 27.40 | 26.96 | 28.66 | 26.36 | 24.95 | 25.96 | 20.56 | |
| 20–40% | 26.83 | 27.06 | 29.65 | 30.48 | 32.20 | 32.19 | 25.48 | 33.00 | 23.72 | |
| 40–60% | 42.26 | 40.30 | 42.43 | 42.39 | 39.03 | 40.89 | 45.35 | 40.78 | 49.21 | |
| 60–100% | 4.89 | 4.64 | 0.52 | 0.18 | 0.11 | 0.55 | 4.22 | 0.27 | 6.51 |
Disclaimer/Publisher’s Note: The statements, opinions and data contained in all publications are solely those of the individual author(s) and contributor(s) and not of MDPI and/or the editor(s). MDPI and/or the editor(s) disclaim responsibility for any injury to people or property resulting from any ideas, methods, instructions or products referred to in the content. |
© 2023 by the authors. Licensee MDPI, Basel, Switzerland. This article is an open access article distributed under the terms and conditions of the Creative Commons Attribution (CC BY) license (https://creativecommons.org/licenses/by/4.0/).
Share and Cite
MDPI and ACS Style
Hong, F.; He, G.; Wang, G.; Zhang, Z.; Peng, Y. Monitoring of Land Cover and Vegetation Changes in Juhugeng Coal Mining Area Based on Multi-Source Remote Sensing Data. Remote Sens. 2023, 15, 3439. https://doi.org/10.3390/rs15133439
AMA Style
Hong F, He G, Wang G, Zhang Z, Peng Y. Monitoring of Land Cover and Vegetation Changes in Juhugeng Coal Mining Area Based on Multi-Source Remote Sensing Data. Remote Sensing. 2023; 15(13):3439. https://doi.org/10.3390/rs15133439
Chicago/Turabian StyleHong, Fangzhou, Guojin He, Guizhou Wang, Zhaoming Zhang, and Yan Peng. 2023. "Monitoring of Land Cover and Vegetation Changes in Juhugeng Coal Mining Area Based on Multi-Source Remote Sensing Data" Remote Sensing 15, no. 13: 3439. https://doi.org/10.3390/rs15133439
Note that from the first issue of 2016, this journal uses article numbers instead of page numbers. See further details here.