Article

Discussion on InSAR Identification Effectivity of Potential Landslides and Factors That Influence the Effectivity

1
Evaluation and Utilization of Strategic Rare Metals and Rare Earth Resource Key Laboratory of Sichuan Province, Sichuan Geological Survey, Chengdu 610081, China
2
Sichuan Intelligent Geological Big Data Co., Ltd., Chengdu 610081, China
*
Author to whom correspondence should be addressed.
Remote Sens. 2022, 14(8), 1952; https://doi.org/10.3390/rs14081952
Submission received: 31 March 2022 / Revised: 13 April 2022 / Accepted: 15 April 2022 / Published: 18 April 2022

Abstract

:
The southwest mountainous area of China is one of the areas with the most landslides in the world. In this paper, we used Ya’an City and Garzê Tibetan Autonomous Prefecture in Sichuan Province as the research areas to explore the identification application effects of large-area potential landslides using synthetic aperture radar (SAR) data with different wavelength types (Sentinel-1, ALOS-2), different processing methods (SBAS-InSAR, Stacking-InSAR), and different geological environmental conditions. The results show the following: (1) The effect of identifying landslides with different slope directions is largely affected by the satellite orbit direction; when we identify landslide hazards across a large area, the joint monitoring mode of ascending and descending orbit data is required. (2) The period of monitoring affects the identification effect of potential landslides when landslide identification is carried out in southwestern China; the InSAR monitoring period is recommended to be more than 2 years. (3) In different geological environmental regions, SBAS technology and Stacking technology have their own advantages; Stacking technology identifies more potential landslides, and SBAS technology identifies potential landslides with higher accuracy; (4) the degree of vegetation coverage has a great impact on the landslide identification effect of different SAR data sources. In low-density vegetation coverage areas, the landslide identification result using Sentinel-1 data seems to be better than the result using ALOS-2 data. In high-density vegetation coverage areas, the landslide identification result using ALOS-2 data is better than that using Sentinel-1 data.

Graphical Abstract

1. Introduction

In the mountainous areas of southwest China, due to active geological tectonic movements, coupled with the development of large-scale human engineering activities, such as hydropower stations, roads, and urban construction, there is a high incidence of landslides in the region, which has become one type of geohazard that requires more attention [1,2,3]. In addition, climate change has also led to a significant increase in landslides around the world in recent years [4,5]. How to effectively identify landslides in mountainous areas has become one of the key problems in the field of geohazard research all over the world [6].
At present, the technical methods widely used in landslide identification include optical satellite image remote sensing [7], UAV image remote sensing [8,9], airborne LiDAR and DEM [10,11,12,13], and InSAR monitoring [14,15,16,17,18,19,20,21,22,23,24,25,26]. Among them, after more than ten years of development and application, InSAR monitoring technology has gradually become an important technical method for landslide identification, due to its large-area, long-period, and high-resolution surface deformation information acquisition capability [14]. At present, InSAR monitoring technology has gradually developed from the early D-InSAR technology [11,14], which uses two SAR images to simply obtain differential information between two images, to the time-series InSAR technology, that uses multi-period SAR images and uses the least-squares method to solve the deformation information (TS-InSAR). Time-series InSAR technology includes Persistent Scatterer InSAR (PS-InSAR) [17,18,19], which uses high-coherence points (i.e., PS points) in the time domain for analysis, Stacking-InSAR, which performs a weighted average solution on the unwrapped phase to obtain the surface deformation rate [20,21], and SBAS-InSAR (Small Baselines Subset InSAR) [22,23,24], which improves coherence by limiting temporal and spatial baselines. Among them, Stacking-InSAR and SBAS-InSAR are considered to be the most suitable time-series InSAR processing methods for the identification of potential landslides in large areas, due to the speed and high accuracy of their processing [21].
The mountainous area of western China is very large, and there are various types of landforms, such as mountains, valleys, plateaus, and hills. The vegetation includes trees, shrubs, grasslands, etc., and the climate types include the Qinghai-Tibet Plateau climate and the subtropical monsoon climate. The Garzê Tibetan Autonomous Prefecture of Sichuan Province, located on the west side of the mountainous area in western China, has steep terrain, sparse vegetation, and large rivers, such as the Jinsha River and Dadu River. Ya’an City, located on the east side of Sichuan Province, has a relatively flat terrain, abundant rainfall, and dense vegetation. The two areas cover an area of 163,900 sq. km and have huge differences in topography, climate, vegetation, etc., and both have developed a large number of landslides. This article selects Ya’an City and Garzê Tibetan Autonomous Prefecture as the study areas to explore, under different types of SAR data (Sentinel-1, ALOS-2) and different geological environmental conditions, the application effect of processing methods (SBAS-InSAR, Stacking-InSAR) in the identification of potential landslides across large areas.

2. Study Area

The study area is located in the west of Sichuan Province, China, with the coordinate range of 97°23′E~102°29′E, 27°57′N~34°13′N, and includes 26 counties (cities, districts), with a total area of 163,900 sq. km (Figure 1). The study area is located in the transition zone from the southeast of the Qinghai-Tibet Plateau to the Sichuan Basin. Affected by the strong crustal activity of the Qinghai-Tibet Plateau, a series of large-scale active faults, such as the Jinsha River fault zone, the Garzê-Yushu-Xianshui River fault zone, and the Mt. Longmen fault zone, have developed in this area. There are many large rivers, such as Jinsha River, Yalong River, Xianshui River, and Dadu River, in the study area from west to east, spanning different geological tectonic units of the Qinghai-Tibet Plateau. The unique geographical and geological conditions make the topography of this area significantly different. Generally, the northwest side is higher, the southeast side is lower, and the middle is protruding. The highest peak of Mt. Minya Konka is 7556 m above sea level, and the largest relative height difference in the area is 6400 m.
According to the administrative divisions, the study area is divided into two parts: Garzê Prefecture (western region) and Ya’an City (eastern region). The two parts are quite different in topography, vegetation coverage, and climatic conditions. In geomorphology, Garzê Prefecture is mainly characterized by alpine canyon landforms and hilly plateau landforms (Figure 2), with large differences in terrain cuts. In the southern alpine valley landform area, the terrain incises deep, the height difference is large, the terrain is steep, and geohazards are relatively dense; in the northern hilly plateau region, the terrain is slightly incised, the height difference is small, and the landslides are not developed. Ya’an City is mainly composed of medium-alpine landforms and low-mountain hilly landforms (Figure 2). In the medium-alpine region, the terrain is heavily incised and landslides have developed. In the low-mountain hilly region, the terrain is slightly cut and landslides have not developed.
For meteorological conditions and vegetation coverage, Garzê Prefecture has a Qinghai-Tibet Plateau climate with less rainfall and has an average annual rainfall of 500 to 800 mm. The average annual rainfall in the Jinsha River Valley is even lower than 500 mm, and the rainfall is concentrated in the rainy season from May to October each year (Figure 3). The vegetation coverage in this area is low, and the vegetation is mainly low shrubs, bushes, and grasses. However, in the eastern area of Garzê Prefecture, due to the large annual rainfall, a small number of tall trees are also distributed. The Ya’an region has a humid subtropical monsoon climate with abundant rainfall, and has an average annual rainfall of 800 to 1600 mm (Figure 3). The main rainfall months are from June to October. It is called “Rain City”. The abundant rainfall makes the area densely vegetated, and the vegetation types are mainly tall trees and shrubs. This paper selects Landsat 8 satellite images from July to August 2021 as the data source and calculates the NDVI of Ya’an City and Garzê Prefecture. The average NDVI of Garzê Prefecture is 0.1705, and the average NDVI of Ya’an City is 0.1809, indicating that the vegetation coverage in Ya’an City is higher than that in Garzê Prefecture.

3. Materials and Methods

3.1. InSAR Data Source

The current mainstream satellite-borne SAR are equipped with C-, X-, and L-band sensors [27]. This study selected ESA’s Sentinel-1 satellite (carrying C-band, wavelength 5.6 cm) data and Japan’s ALOS-2 data (carrying L-band, wavelength 23.5 cm) as data sources.
Sentinel-1 data have the characteristics of wide image coverage, high temporal resolution, multiple polarization modes, and free access, which provide a guarantee for the identification and monitoring of large-scale landslides. The long wavelength of the ALOS-2 data greatly enhances the penetration of the ground vegetation cover, and ALOS-2 data also have stronger coherence than Sentinel-1 data in densely vegetated areas.
A total of 1425 scenes of Sentinel-1 images were collected in the study area (Table 1). The SAR data source contains Sentinel-1 data of more than 50 phases. Among them, the ascending data completely covers the study area, which requires 11 images (Figure 1). The acquisition time was from November 2017 to November 2020, with 782 scenes in total. The descending-orbit data completely covers the study area, which also requires 11 images. The acquisition time was from November 2017 to April 2021, with 643 scenes in total. A total of 195 scenes were acquired from ALOS-2 data in the study area, all of which are ascending orbit data, with a total of 23 image coverage areas, with a single image coverage area of 2–9 scenes. The data acquisition time is concentrated from January 2018 to July 2019.

3.2. Radar Data Processing Method

Radar data are mainly processed by SBAS-InSAR, Stacking-InSAR, and D-InSAR. The Sentinel-1 data are processed by SBAS-InSAR and Stacking-InSAR technologies, respectively. ALOS-2 data are limited by the data phase, and we mainly used the D-InSAR method for processing. The processing flow is shown in Figure 4.
D-InSAR is developed on the basis of traditional InSAR. It uses SAR data obtained at different times in the same area for differential interference processing and removes common variables in the two observation phases (flat effect, terrain phase, atmospheric delay, etc.) through differential processing to obtain the deformation phase, and then obtains surface deformation. This method can quickly obtain deformation field and is currently widely used in the acquisition of seismic coseismic deformation fields, extraction of mining subsidence areas, etc. However, because the method uses a small number of SAR images, various errors, such as surface topography errors, atmospheric disturbances, inaccurate orbit information, and noises have not been perfectly removed.
Time-series InSAR is the developed and optimized method of traditional D-InSAR technology. Compared with traditional D-InSAR technology, time-series InSAR can use more SAR images to overcome the influence of space-time de-coherence, atmospheric delay, orbital errors, etc. to obtain surface deformation. While time-series InSAR technology obtains high-precision surface-deformation information, it can also obtain monitoring results for long-term series of cumulative deformation, which greatly promotes the application of InSAR technology in the field of deformation monitoring. This study mainly focuses on the application effects of Stacking-InSAR and SBAS-InSAR technologies.

3.3. Identification of Potential Landslides

After obtaining the processed data results of Stacking-InSAR and SBAS-InSAR technologies, we used the results to identify potential landslides in mountainous areas and performed a field investigation on the identified potential landslides to evaluate the application effect of Stacking-InSAR and SBAS-InSAR technologies in the identification of potential landslides across large areas.
The core of InSAR technology lies in the measurement of surface deformation. Therefore, if we find that the deformation value is great in a mountainous area, we should first combine optical satellite images to determine whether the area has the terrain conditions for landslide development. Suitable terrain conditions mainly refer to two conditions. First, the slope has a relatively large terrain slope (the probability of landslides occurring on a near-horizontal slope (less than 10°) is extremely low. Second, on the leading edge of the slope, there are free faces exposing, or shearing out of, the sliding control surface. If the terrain condition is suitable for landslide development, then the next step should be to determine whether the surface deformation value in this area is caused by human engineering activities, such as road construction and mining, or other factors. If topographical conditions are met and no human engineering activities are found, we define the area where the surface deformation value suddenly changes as a potential landslide. The specific process is shown in Figure 5. The following three examples will be used to illustrate how to identify potential landslides in mountainous areas based on InSAR technology.
(1) The surface deformation value changes suddenly, but there are no suitable terrain conditions for the development of landslides, so the marked area cannot be considered as a potential landslide.
As shown in Figure 6a, the InSAR results show that there is ground deformation in a certain area of Tianquan County, Ya’an City, Sichuan Province (the area enclosed by the red line), and the maximum deformation rate is about −5 cm/year. The China GF-1 optical satellite image of the area on 1 February 2021 (Figure 6b), was also retrieved. The area is located on the southern side of the river. The terrain is relatively flat, with a slope of about 5 to 10°. The land-use type is cultivated land. In geology, this area belongs to the Quaternary alluvial–diluvial depositional layer. Therefore, theoretically, this area does not have the topographic and geological conditions for landslides, and its surface deformation may be caused by human activities of land cultivation, so this area cannot be identified as a potential landslide site.
(2) The sudden change in the surface deformation is caused by human engineering activities and cannot be considered as a potential landslide site.
As shown in Figure 7a, the InSAR results show that there is ground deformation in a certain area of Kangding City, Garzê Prefecture, Sichuan Province (the area enclosed by the red line), and the maximum deformation rate is about −8 cm/year. After retrieving the China GF-2 optical satellite image of the area on 30 September 2020 (Figure 7b), it is found that the front edge of the deformation area is located at the foot of the slope, and the trailing edge is located in the middle of the slope, with a slope of about 20 to 30°. This area satisfies the terrain conditions for landslides. However, according to optical satellite images, it can be found that a large number of winding roads and mining stepped platforms have been built on the slope surface. This area is an artificial open-pit mine. The surface deformation shown by the InSAR results is caused by human engineering activities, such as mining and road construction. Therefore, this area cannot be identified as a potential landslide site either.
(3) The sudden change in the ground deformation meets the conditions for the development of landslides, and the area is identified as a potential landslide site.
The InSAR results in Figure 8a show that there is surface deformation in a certain area of Danba County, Garzê Prefecture, Sichuan Province (the area enclosed by the red line), and the maximum deformation rate is about −7 cm/year. The China GF-2 optical satellite image of the region on 27 August 2020, was retrieved (Figure 8b). The front edge of the deformation zone is bounded by the east bank of the river, and the trailing edge is located in the middle of the slope, with a slope of about 30 to 35°. This area meets the topographic development conditions for landslides to occur; according to optical satellite images, it can be found that there are lots of deformation signs in the deformation zone. For example, gray-white fresh sliding signs can be seen on the front edge of the slope, and gray-white lower staggered sills can be seen in the rear of the slope in a chair-like distribution. Therefore, the surface deformation shown by the InSAR results may be caused by the overall sliding of the slope in this area, and this area can be identified as a potential landslide site.

4. Results

4.1. Number of Landslides Identified

A total of 327 potential landslides were identified in the study area using InSAR technology. After that, the researchers conducted on-site verification of 327 potential landslides and defined the potential landslides with obvious deformation characteristics found in the field investigation as the correct landslides identified by InSAR. There are a total of 250 landslides, and the specific distribution location is shown in Figure 9.

4.2. Results of Ascending and Descending Orbit Data

Based on 250 samples (the number of correct landslides from on-site verification), the number of potential landslides identified by InSAR technology using ascending orbit data and descending orbit data is counted (Figure 10). The results show that the number of landslides identified based on ascending orbit data is much higher than the number of landslides identified based on descending orbit data in the study area. The percentage of potential landslides identified by ascending data accounts for about 60%, and the percentage of landslides identified by descending orbit data accounts for about 40%.

4.3. Results of SBAS-InSAR and Stacking-InSAR

In order to compare the identification effect of potential landslides based on the results obtained by different time-series InSAR technologies, the number of potential landslides identified based on different InSAR technologies in the study area were counted, as shown in Figure 11. A total of 327 potential landslides were identified based on time-series InSAR technology, of which 292 were identified as potential landslides based on Stacking technology, and 221 were identified as correct landslides by on-site verification, with an accuracy rate of 75.6%. In total, 258 potential landslides were identified based on SBAS technology, among which 209 correct landslides were identified by on-site verification, and the accuracy rate was 81.0%.

5. Discussion

5.1. The Influence of Satellite Orbit Type on Landslide Identification

Due to the side-looking acquisition mode of SAR satellites, geometrical distortions, including layover and shadow, in mountainous areas are inevitable [28]. Geometric distortions can lead to landslides in blind areas that cannot be detected [29]. Taking Figure 12 as an example, the identifiable effects of landslides with different slope aspects in the ascending track data show significant differences. Landslide E can be effectively identified based on the results of the ascending track data, but the landslide is in a shaded area of the descending track data and cannot be effectively identified. The ascending orbits of the Sentinel data and ALOS-2 data are approximately from southeast to northwest, and the right view is imaged; the descending orbits are approximately from the northeast to the southwest, and the right view is imaged. Therefore, generally speaking, the ascending orbit data have a better monitoring effect on the eastward slope, and the descending orbit data have a better effect on the westward slope. Take the Jinsha River valley area (Figure 13) as an example: in the ascending orbit SAR data, the potential landslides of a, b, and c landslides are located in the overlapped area, causing the missed judgments of three potential landslides. However, in the descending orbit SAR data, the three potential landslides can be well identified, and the potential landslides of d and e landslides are located in the overlapped area. At the same time, statistics on the visibility of the entire study area based on the Sentinel-1 ascending/descending data (upper right corner of Figure 9). The normal visible area of the ascending orbit data in the statistics chart accounted for 90.96% of the total area, and the normal visible area of the descending orbit data accounted for 91.6% of the total area. It is found that single-orbit data can cover most of the study area; however, in the valley area along the river, due to the terrain slope and cutting depth, single-orbit data can often only cover one side of the valley, and the opposite side of the valley is seriously overlapped. Relying solely on single-orbit data will cause missed judgments of potential landslides in river valleys.
In order to reduce false-positive and false-negative potential landslides in mountainous areas, and to identify the distribution of potential landslides as much as possible, we recommend using the “ascending and descending orbit data joint monitoring model” (Figure 14), that is, the ascending and descending orbit data are simultaneously processed for landslide identification in the area.
Based on the “joint monitoring mode of ascending and descending orbit data”, the range of identification of potential landslides can be greatly expanded. For example, in Batang County in the Jinsha River Basin, Sentinel-1 data were used to identify and compare potential landslides based on the annual average deformation rate map obtained by SBAS technology (Figure 15). The ascending orbit data individually identified 11 landslides. The descending orbit data individually identified 9 landslides. The reason for the difference in the analysis data is that parts of the identified landslides are located in the overlapped area in the corresponding orbit data. Therefore, when conducting landslide investigations, it is recommended to use the ascending and descending orbit data to interpret and simultaneously avoid missed judgment of landslides. Meanwhile, in some areas, where the ascending and descending orbit data are monitored at the same time, the identification results can be mutually verified.

5.2. The Impact of the Monitoring Period on Landslide Identification

When time-series InSAR technology is used to identify potential landslides, the monitoring period generally ranges from 1 to 3 years. The research of existing scholars rarely involves analysis of the impact of the duration of the monitoring period on the identification effect of landslides. In order to verify this, we selected Danba County, Garzê Prefecture, where geohazards are relatively developed, as an example; we chose Sentinel-1 data with a monitoring period of 1, 2, and 3 years (Table 2) and used SBAS InSAR technology to carry out comparative analysis of the identification effect of landslides (Figure 16). Comparing the identification results (Table 2), for monitoring periods of 2 years (Figure 16b) and 3 years (Figure 16c), the locations and numbers of the identified landslides were almost the same (14 landslides); when the monitoring period was 1 year (Figure 16a), 12 landslides could be identified, and 2 landslides (Figure 16a,b) were missed. This is because the deformation of the two landslides was relatively small in the three-year monitoring period, and the deformation of the two landslides in the one-year monitoring period was not active or even did not occur.

5.3. The Influence of InSAR Processing Methods on Landslide Identification

Based on SBAS technology and Stacking technology, this paper discusses the comparison of the identification effect of potential landslides. We used 327 landslide samples, and the identification results of Stacking-InSAR and SBAS-InSAR technology were separately counted.
In the Garzê Prefecture, 209 potential landslides were identified based on Stacking technology; after on-site verification, 173 landslides were confirmed, and the accuracy of Stacking technology was 82.7%. Based on SBAS technology, 204 potential landslides were identified; after on-site verification, 171 landslides were confirmed, and the accuracy of SBAS technology was 83.8% (Figure 17). From the statistical results, it was found that the number of landslides identified by the two methods and the accuracy rates are relatively close in the Garzê Prefecture.
In the Ya’an area, 83 potential landslides were identified based on Stacking technology, and 48 landslides were confirmed by on-site verification; the accuracy of Stacking technology was 57.8%. In total, 54 potential landslides were identified based on SBAS technology, and 38 landslides were confirmed by on-site verification; the accuracy of SBAS technology was 70.3%. In contrast, in Ya’an City, the identification accuracy of SBAS technology is higher than that of Stacking technology, but the number of landslides identified by Stacking technology is greater than that of SBAS technology.
Stacking-InSAR and SBAS-InSAR are considered to be the most suitable time-series InSAR processing methods for the identification of potential landslides across large areas [21]. The results of this paper show that landslide identification based on SBAS and Stacking have their own advantages. Stacking identifies more potential landslides, and SBAS has higher accuracy in identifying potential landslides.

5.4. The Impact of Vegetation Coverage on Landslide Identification

SAR signals have different penetration capabilities in densely vegetated areas due to different microwave sensors equipped on the satellites. It is generally assumed that the longer the radar wavelength, the stronger the penetration capability of ground vegetation, and the SAR image is less affected by vegetation coverage [30]. Long-wavelength alos-2 data are effective in identifying potential landslides in vegetation-covered areas [31]. The Garzê Prefecture is dominated by shrubs, bushes, grasslands, and meadows, with local trees distributed, and the vegetation coverage is low. The Ya’an city area is dominated by tall trees and shrubs with high vegetation coverage. In this study, Garzê Prefecture (the low-density vegetation coverage area) and Ya’an City (the high-density vegetation coverage area) were used as experimental areas to explore the identification effects of Sentinel-1 data and ALOS-2 data in different vegetation coverage areas.
It can be seen from Figure 18 that in Garzê Prefecture, the coherence of ALOS-2 data at a time interval of 168 days is better than that of Sentinel-1 data at a time interval of 48 days (Figure 18a,b); however, this does not mean that ALOS-2 data is better than Sentinel-1 data when identifying potential landslides in this area. Due to the fact that the Sentinel-1 data have a higher temporal resolution, the SAR data with higher temporal resolution can reduce the change of ground features during the period of master and slave SAR images, thereby ensuring higher coherence in a shorter time interval. Figure 18e shows the distribution statistics of the coherence coefficient of the Sentinel-1 data in Garzê Prefecture, at different time intervals, without filtering. It can be seen that most of the coherence coefficients are greater than 0.4 with 48 days’ time interval. Therefore, we can still obtain good interference information when we use the time baseline threshold of 48 days in this area.
In the Ya’an city area, the coherence map of ALOS-2 data acquired by adaptive filtering at a time interval of 364 days is better than that of Sentinel-1 data at a time interval of 12 days using the same filtering method and filtering window (Figure 18c,d). In densely vegetated areas, the advantages of ALOS-2 data are clearly highlighted, and the L-band SAR data can maintain good coherence over a long period of time. Figure 18c,f show that in the same research area, due to the small deformation range of the landslide, if a larger filter window is selected, the deformation information of the landslide may be filtered. Therefore, a smaller filter window should be selected. Here, we used a 32 × 32 filter window at different time intervals based on the adaptive filtering method and obtained a statistical graph of the proportion of coherence coefficients. It can be seen that the proportion of correlation coefficients exceeding 0.4 declines sharply when the time interval exceeds 24 days, and combined with the analysis of Figure 18e, it is found that the area with correlation coefficients exceeding 0.4 is mainly concentrated in the urban area.
This work selects Batang County in Garzê Prefecture along the Jinsha River and Hanyuan County in Ya’an City along the Dadu River Basin as typical low-density vegetation coverage areas and high-density vegetation coverage areas to further compare the landslide identification effects of Sentinel-1 and ALOS-2 data in different vegetation coverage areas. Figure 19 shows the comparison of the landslide identification effect of the two types of data in the low-density vegetation coverage area. The 14 landslides with larger deformation in this area can be identified using ALOS-2 data and Sentinel-1 data. In addition, three relatively small detected landslides (H04, H16, H17) can be identified using Sentinel-1 data.
Then, we selected a typical local area, and the InSAR identification results based on ALOS-2 data and Sentinel-1 data, optical images, and on-site verification photos are shown in Figure 20. From the Stacking-InSAR results based on Sentinel-1 data, the H01~H07 landslides showed significant and strong deformation, and the deformation zone is basically consistent with the landslide boundary. However, the Stacking-InSAR results based on ALOS-2 data showed that the deformation zone boundary and the deformation value are relatively small, especially for H04 and H05 landslides. By on-site verification, the H01~H07 landslides do have different signs of deformation, such as road faults, house cracks, and small-scale collapses.
Therefore, since the revisited period of Sentinel-1 data is shorter than that of ALOS-2 data in low-density vegetation coverage areas, using Sentinel-1 data, which can obtain more phases of SAR images, is better than using ALOS-2 data in identifying landslides.
Taking Hanyuan County, Ya’an City, as a typical high-density vegetation coverage area, the Stacking-InSAR results of ALOS-2 data can identify six landslides with obvious deformation, and the boundary of the sliding zone is relatively clear (Figure 21a). The Stacking-InSAR results of Sentinel-1 data can only identify one landslide with obvious deformation (Figure 21b). One of typical landslides is selected as shown in Figure 22. From the ALOS-2 Stacking InSAR results, we can observe obvious deformation on the landslide. However, from the Sentinel-1 Stacking InSAR results, we cannot observe the deformation sign on the landslide. According to field surveys, there are many signs of deformation, such as house cracks and road faults on the landslide (Figure 22d–g). In general, due to the longer wavelength of ALOS-2 data, the capability to penetrate vegetation is relatively strong. In high-density vegetation coverage areas, InSAR results based on ALOS-2 data are better than Sentinel-1 data in identifying landslides.

6. Conclusions

The application effects of landslide identification with different data-processing methods in different environmental conditions are quite different. Through the above discussion, this paper mainly obtains the following preliminary conclusions:
(1)
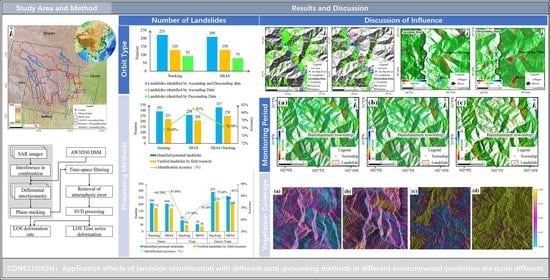
The flight direction and observation angle of the Sentinel-1A satellite with the ascending and descending orbit types are quite different, so the shaded and overlapping areas in the mountainous areas are distributed differently. Meanwhile, since the slope and aspect of landslides are also different, the identifiable effect of mountainous landslides is greatly affected by the type of satellite orbit. When identifying potential landslides in a wide area, in order to reduce false-negative identification, it is necessary to adopt the joint monitoring mode of ascending orbit and descending orbit data.
(2)
The length of the monitoring period affects the identification effect of potential landslides. When the monitoring period is 1 year, there are some missing landslides in the study area. This is because these unidentified landslides had been continuously deformed in the previous 2–3 years, but the deformation rate weakened, or even paused, in the last 1 year. Therefore, when the monitoring period is 2 years and 3 years, the identification results of landslides are basically the same, which are obviously better than those with a monitoring period of 1 year. Therefore, it is recommended that the InSAR monitoring period should not be less than 2 years when carrying out the identification of potential landslides in mountainous areas of southwest China.
(3)
For landslide identification, SBAS technology and Stacking technology have their own advantages. Stacking technology identified more potential landslides, and SBAS technology has higher accuracy in identifying potential landslides. Considering the accuracy of landslide identification and the rate of missed interpretation, it is recommended that the two methods can be used to process the SAR data in the area together, and the results can be combined to identify landslides.
(4)
The degree of vegetation coverage has a great influence on the landslide identification effect of different SAR data sources. In low-density vegetation coverage areas, Sentinel-1 data have high coherence within a time interval of ≤48 days; using Sentinel-1 data in low-density vegetation coverage areas is better than ALOS-2 in identifying landslides. In high-density vegetation coverage areas, Sentinel-1 data have a sharp decline in coherence at an interval of ≥24 days; the L-band of ALOS-2 data can maintain good coherence for a long period of time, and using ALOS-2 data in this area has a better landslide identification result than using Sentinel-1 data.

Author Contributions

Conceptualization, J.L. and C.Z.; data curation, J.D. and S.Z.; investigation, J.L., C.Z., B.L., L.Y. and S.Y.; methodology, J.L. and J.D.; writing—original draft preparation, S.Z. and X.M.; writing—review and editing, J.L., J.D. and C.Z. All authors have read and agreed to the published version of the manuscript.

Funding

This work was supported by funding of Sichuan Provincial Department of Natural Resources (No. 510201202076888).

Institutional Review Board Statement

Not applicable.

Informed Consent Statement

Not applicable.

Data Availability Statement

Sentinel-1 data in this study were provided by European Space Agency (ESA) through the Sentinel-1 Scientific Data Hub. ALOS-2 data were provided by the department of geological exploration management, Ministry of natural resources, China.

Acknowledgments

We are very grateful to the European Space Agency (ESA) for providing sentinel-1A data, and the Department of geological exploration management, Ministry of natural resources, China, for providing ALOS-2 data. We thank the reviewers and the editor for their constructive comments and suggestions, which would significantly improve this paper.

Conflicts of Interest

The authors declare no conflict of interest.

References

  1. Fan, X.; Xu, Q.; Scaringi, G.; Dai, L.; Li, W.; Dong, X.; Zhu, X.; Pei, X.; Dai, K.; Havenith, H.-B. Failure mechanism and kinematics of the deadly 24 June 2017 Xinmo landslide, Maoxian, Sichuan, China. Landslides 2017, 14, 2129–2146. [Google Scholar] [CrossRef]
  2. Zhao, B.; Zhang, H.; Liao, H.; Li, W.; Su, L.; He, W.; Zeng, L.; Qin, H.; Dhital, M. Emergency response to the reactivated Aniangzhai landslide resulting from a rainstorm-triggered debris flow, Sichuan Province, China. Landslides 2021, 18, 1115–1130. [Google Scholar] [CrossRef]
  3. Ouyang, C.; An, H.; Zhou, S.; Wang, Z.; Su, P.; Wang, D.; Cheng, D.; She, J. Insights from the failure and dynamic characteristics of two sequential landslides at Baige village along the Jinsha River, China. Landslides 2019, 16, 1397–1414. [Google Scholar] [CrossRef]
  4. Haque, U.; da Sliva, P.F.; Devoli, G.; Pilz, J.; Zhao, B.; Khaloua, A.; Wilopo, W.; Andersen, P.; Lu, P.; Lee, J.; et al. The human cost of global warming: Deadly landslides and their triggers (1995–2014). Sci. Total Environ. 2019, 682, 673–684. [Google Scholar] [CrossRef] [PubMed]
  5. Shan, W.; Hu, Z.; Guo, Y.; Zhang, C.; Wang, C.; Jiang, H.; Liu, Y.; Xiao, J. The impact of climate change on landslides in southeastern of high-latitude permafrost regions of China. Front. Earth Sci. 2015, 3, 7. [Google Scholar] [CrossRef] [Green Version]
  6. Si, A.; Zhang, J.; Tong, S.; Lai, Q.; Wang, R.; Li, N.; Bao, Y. Regional Landslide Identification Based on Susceptibility Analysis and Change Detection. Int. J. Geo-Inf. 2018, 7, 394. [Google Scholar] [CrossRef] [Green Version]
  7. Nichol, J.; Shaker, A.; Wong, M. Application of high-resolution stereo satellite images to detailed landslide hazard assessment. Geomorphology 2006, 76, 68–75. [Google Scholar] [CrossRef]
  8. Xu, Q.; Li, W.; Ju, Y.; Dong, X.; Peng, D. Multitemporal UAV-based photogrammetry for landslide detection and monitoring in a large area: A case study in the Heifangtai terrace in the Loess Plateau of China. J. Mt. Sci. 2020, 17, 1826–1839. [Google Scholar] [CrossRef]
  9. Cheng, Z.; Gong, W.; Tang, H.; Juang, C.H.; Deng, Q.; Chen, J.; Ye, X. UAV photogrammetry-based remote sensing and preliminary assessment of the behavior of a landslide in Guizhou, China. Eng. Geol. 2021, 289, 106172. [Google Scholar] [CrossRef]
  10. Jaboyedoff, M.; Oppikofer, T.; Abellán, A.; Derron, M.-H.; Loye, A.; Metzher, R.; Pedrazzini, A. Use of LiDAR in landslide investigations: A review. Nat. Hazards 2012, 61, 5–28. [Google Scholar] [CrossRef] [Green Version]
  11. Razak, K.; Straatsma, M.; van Westen, C.; Malet, J.-P.; De Jong, S. Airborne laser scanning of forested landslides characterization: Terrain model quality and visualization. Geomorphology 2011, 126, 186–200. [Google Scholar] [CrossRef]
  12. Claessens, L.; Heuvelink, G.B.M.; Schoorl, J.M.; Veldkamp, A. DEM resolution effects on shallow landslide hazard and soil redistribution modelling. Earth Surf. Processes Landf. 2005, 30, 461–477. [Google Scholar] [CrossRef]
  13. Pirasteh, S.; Li, J. Developing an algorithm for automated geometric analysis and classification of landslides incorporating LiDAR-derived DEM. Environ. Earth Sci. 2018, 77, 414. [Google Scholar] [CrossRef]
  14. Canuti, P.; Casagli, N.; Ermini, L.; Fanti, R.; Farina, P. Landslide activity as a geoindicator in Italy: Significance and new perspectives from remote sensing. Environ. Geol. 2004, 45, 907–919. [Google Scholar] [CrossRef]
  15. Rizo, V.; Tesauro, M. SAR Interferometry and Field Data of Randazzo Landslide (Eastern Sicily, Italy). Phys. Chem. Earth Part B-Hydrol. Ocean. Atmos. 2000, 25, 771–780. [Google Scholar] [CrossRef]
  16. Cascini, L.; Fornaro, G.; Peduto, D. Analysis at medium scale of low-resolution DInSAR data in slow-moving landslide-affected areas. J. Photogramm. Remote Sens. 2009, 64, 598–611. [Google Scholar] [CrossRef]
  17. Colesanti, C.; Wasowski, J. Investigating landslides with space-borne synthetic aperture radar (SAR) interferometry. Eng. Geol. 2006, 88, 173–199. [Google Scholar] [CrossRef]
  18. Tofani, V.; Raspini, F.; Catani, F.; Casagli, N. Persistent Scatterer Interferometry (PSI) Technique for Landslide Characterization and Monitoring. Remote Sens. 2013, 5, 1045–1065. [Google Scholar] [CrossRef] [Green Version]
  19. Rosi, A.; Tofani, V.; Tanteri, L.; Tacconi Stefanelli, C.; Agostini, A.; Catani, F.; Casagli, N. The new landslide inventory of Tuscany (Italy) updated with PS-InSAR: Geomorphological features and landslide distribution. Landslides 2018, 15, 5–19. [Google Scholar] [CrossRef] [Green Version]
  20. Dai, K.; Liu, G.; Li, Z.; Ma, D.; Wang, X.; Zhang, B.; Tang, J.; Li, G. Monitoring Highway Stability in Permafrost Regions with X-band Temporary Scatterers Stacking InSAR. Sensors 2018, 18, 1876. [Google Scholar] [CrossRef] [Green Version]
  21. Zhang, L.; Dai, K.; Deng, J.; Ge, D.; Liang, R.; Li, W.; Xu, Q. Identifying Potential Landslides by Stacking-InSAR in Southwestern China and Its Performance Comparison with SBAS-InSAR. Remote Sens. 2021, 13, 3662. [Google Scholar] [CrossRef]
  22. Berardino, P.; Fornaro, G.; Lanari, R.; Sansosti, E. A new algorithm for surface deformation monitoring based on small baseline differential SAR interferograms. IEEE Trans. Geosci. Remote Sens. 2002, 40, 2375–2383. [Google Scholar] [CrossRef] [Green Version]
  23. Yan, Y.; Doin, M.; Lopez-Quiroz, P.; Tupin, F.; Fruneau, B.; Pinel, V.; Trouve, E. Mexico City Subsidence Measured by InSAR Time Series: Joint Analysis Using PS and SBAS Approaches. IEEE J. Sel. Top. Appl. Earth Obs. Remote Sens. 2012, 5, 1312–1326. [Google Scholar] [CrossRef] [Green Version]
  24. Hu, B.; Wang, H.; Sun, Y.; Hou, J.; Liang, J. Long-Term Land Subsidence Monitoring of Beijing (China) Using the Small Baseline Subset (SBAS) Technique. Remote Sens. 2014, 6, 3648–3661. [Google Scholar] [CrossRef] [Green Version]
  25. Teatini, P.; Strozzi, T.; Tosi, L.; Wegmuller, U.; Werner, C.; Carbognin, L. Assessing short- and long-time displacements in the Venice coastland by synthetic aperture radar interferometric point target analysis. J. Geophys. Res.-Earth Surf. 2007, 112, F01012. [Google Scholar] [CrossRef] [Green Version]
  26. Zhang, Y.; Zhang, J.; Wu, H.; Lu, Z.; Sun, G. Monitoring of urban subsidence with SAR interferometric point target analysis: A case study in Suzhou, China. Int. J. Appl. Earth Obs. Geoinf. 2011, 13, 812–818. [Google Scholar] [CrossRef]
  27. UNAVCO. Synthetic Aperture Radar (SAR) Satellites [EB/OL]. Available online: https://www.unavco.org/instrumentation/geophysical/imaging/sar-satellites/sarsatellites.html (accessed on 24 December 2019).
  28. Wasowski, J.; Bovenga, F. Investigating landslides and unstable slopes with satellite Multi Temporal Interferometry: Current issues and future perspectives. Eng. Geol. 2014, 174, 103–138. [Google Scholar] [CrossRef]
  29. Dong, J.; Liao, M.; Xu, Q.; Zhang, L.; Tang, M.; Gong, J. Detection and displacement characterization of landslides using multitemporal satellite SAR interferometry: A case study of Danba County in the Dadu River Basin. Eng. Geol. 2018, 240, 95–109. [Google Scholar] [CrossRef]
  30. Wang, Y.; Liu, D.; Dong, J.; Zhang, L.; Guo, J.; Liao, M.; Gong, J. On the applicability of satellite SAR interferometry to landslide hazards detection in hilly areas: A case study of Shuicheng, Guizhou in Southwest China. Landslides 2021, 18, 2609–2619. [Google Scholar] [CrossRef]
  31. Liu, X.; Zhao, C.; Zhang, Q.; Lu, Z.; Li, Z.; Yang, C.; Zhu, W.; Liu-Zeng, J.; Chen, L.; Liu, C. Integration of Sentinel-1 and ALOS/PALSAR-2 SAR datasets for mapping active landslides along the Jinsha River corridor, China. Eng. Geol. 2021, 284, 106033. [Google Scholar] [CrossRef]
Figure 1. The location of the study area and the distribution range of SAR data.
Remotesensing 14 01952 g001
Figure 2. The topography of the study area.
Remotesensing 14 01952 g002
Figure 3. Rainfall distribution map in the study area.
Remotesensing 14 01952 g003
Figure 4. Flow chart of InSAR data processing in the study area.
Remotesensing 14 01952 g004
Figure 5. The identification flow chart of potential landslide based on InSAR technology.
Remotesensing 14 01952 g005
Figure 6. (a) Deformation map of the surface area from InSAR. (b) Optical satellite image of the ground deformation area on 1 February 2021.
Remotesensing 14 01952 g006
Figure 7. (a) Deformation map of the surface area from InSAR. (b) Optical satellite image of the ground deformation area on 30 September 2020.
Remotesensing 14 01952 g007
Figure 8. (a) Deformation map of the surface area from InSAR. (b) Optical satellite image of the ground deformation area on 27 August 2020.
Remotesensing 14 01952 g008
Figure 9. The overall distribution map of potential landslides identified in the study area. The upper-right corner is the statistics of the percentage of Sentinel-1 data visibility distribution area in the study area.
Remotesensing 14 01952 g009
Figure 10. Statistics of the number of landslides identified by ascending and descending orbit data in the study area.
Remotesensing 14 01952 g010
Figure 11. Statistics of landslide identification results by SBAS technology and Stacking technology in the study area.
Remotesensing 14 01952 g011
Figure 12. Schematic diagram of potential landslide identification in the ascending and descending track data (Red zone represents the location of the landslide. In the descending track data, the AB area is the area with good identification effect, and CD is the shaded area; in the ascending track data, CD is the area with good identification effect. area, AB is the shaded area).
Remotesensing 14 01952 g012
Figure 13. Sentinel-1 ascending orbit (left) and descending orbit (right) data visibility distribution map.
Remotesensing 14 01952 g013
Figure 14. Schematic map of joint monitoring mode of ascending and descending orbit data. (θ is the incidence angle of the Radar).
Remotesensing 14 01952 g014
Figure 15. Comparison of landslide identification results from ascending and descending orbit data.
Remotesensing 14 01952 g015
Figure 16. Comparison of deformation rate map and the identification results of different monitoring periods based on SBAS InSAR technology. (a) The monitoring period is one year; (b) the monitoring period is two years; (c) the monitoring period is three years.
Remotesensing 14 01952 g016
Figure 17. Statistics of landslide identification by SBAS technology and Stacking technology in different regions.
Remotesensing 14 01952 g017
Figure 18. (a,b) The correlation coefficient graphs generated by Sentinel-1 data in the same area, Garze Prefecture, respectively, at a summer interval of 48 days and the ALOS-2 data generated at a summer interval of 168 days, without filter processing; (c,d) correlation coefficient graphs obtained in the same area, the Ya’an city area, using the same filtering method and filtering window. The data are generated at 364-day interval of Sentinel-1 data and 12-day interval of ALSO-2 data in summer; (e) the picture shows the selected area (a) in which we used Sentinel-1 data to obtain the coherence statistics graph of different intervals of 7 May 2018~18 July 2018; (f) the picture shows the selected area (c) in which we used Sentinel-1 data to obtain the coherence statistics graph of different intervals between 10 November 2018 and 21 January 2019.
Remotesensing 14 01952 g018
Figure 19. Comparison of Stacking-InSAR results of different waveband data in low-density vegetation coverage areas (left is the result of Sentinel-1 data; right is the result of ALOS-2 data).
Remotesensing 14 01952 g019
Figure 20. InSAR identification results and on-site verification photos of the local area. (a) The result of ALOS-2 data; (b) the result of Sentinel-1 data; (c) optical satellite image of the area; (d) site photo of H03 landslides; (e) site photo of H04 landslides; (f) photo of deformation characteristic of H03 landslide; (g) photo of deformation characteristic of H01 landslide; (h) photo of deformation characteristic of H02 landslide; (i) photo of deformation characteristic of H05 landslide; (j) photo of deformation characteristic of H06 landslide; (k) photo of deformation characteristic of H07 landslide. Red arrows in (dh,k) indicate the sliding direction. Red arrows in (i,j) indicate the location of cracks.
Remotesensing 14 01952 g020
Figure 21. Comparison of Stacking-InSAR results of different waveband data in high-density vegetation coverage areas. (a) The result of Sentinel-1 data; (b) the result of ALOS-2 data).
Remotesensing 14 01952 g021
Figure 22. InSAR identification and on-site verification photos of a typical landslide. (a) the InSAR result of ALOS-2 data; (b) the InSAR result of Sentinel-1 data; (c) the optical satellite image of the landslide; (dg) photos showing the deformation characteristics of the landslide. Red arrows in (d,e,g) indicate the location of cracks.
Remotesensing 14 01952 g022
Table 1. Statistics of InSAR data sources in the study area.
SatelliteData Amount (Scene)Data Acquisition Time (Year, Month)Phases
AscendingDescendingSumAscendingDescending
Sentinel-17826431425November 2017–November 2020January 2018–April 202150–63
ALOS-2195/195January 2018–July 20192–5
Table 2. Statistics of identification results of potential landslides using SAR data with different time periods (Danba County).
TimeTime IntervalSAR Data PhaseNo. of Identified LandslidesNo. of Unidentified LandslidesAccuracy Rate (3-Year Results as Basis)
1 year11 September 2018–18 September 20192612285%
2 year11 September 2018–24 September 202052140100%
3 year9 September 2017–24 September 202092140100%
Publisher’s Note: MDPI stays neutral with regard to jurisdictional claims in published maps and institutional affiliations.

