


Swidden Agriculture Landscape Mapping Using MODIS Vegetation Index Time Series and Its Spatio-Temporal Dynamics in Northern Laos

1
Institute of Geographic Sciences and Natural Resources Research, Chinese Academy of Sciences, Beijing 100101, China
2
College of Resources and Environment, University of Chinese Academy of Sciences, Beijing 100049, China
*
Author to whom correspondence should be addressed.
Remote Sens. 2022, 14(23), 6173; https://doi.org/10.3390/rs14236173
Submission received: 12 October 2022
/
Revised: 3 December 2022
/
Accepted: 5 December 2022
/
Published: 6 December 2022
(This article belongs to the Special Issue Forest Disturbance Monitoring Using Satellite Remote Sensing)
Abstract
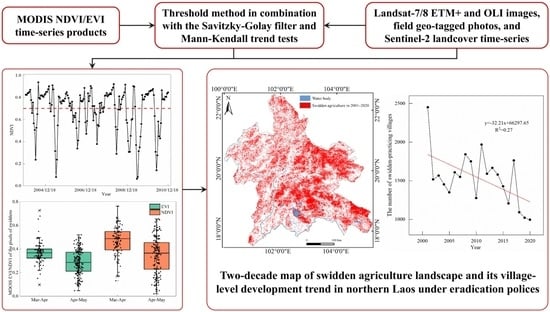
:Swidden agriculture or shifting cultivation is still being widely practiced in tropical developing countries and Laos has spared no effort to eradicate it since the mid-1990s. So far, the development of swidden agriculture in this land-locked mountainous country during the 2000–2020 bi-decade remains poorly examined. Moderate-resolution Imaging Spectroradiometer (MODIS) time-series products have shown potential in monitoring vegetative status; however, only extremely limited cases of remote sensing of swidden agriculture landscapes have been reported. Taking northern Laos as a study area and using 2001–2020 MODIS vegetation indices products, the Savitzky–Golay filter, the Mann–Kendall trend test and a threshold method were employed to delineate and monitor annual patterns and dynamics of swidden agriculture landscape at the village level. The results showed that: MODIS Normalized Difference Vegetation Index (NDVI) time series perform better in delineating the temporal development of swidden agriculture. The swidden agriculture landscape has shown a general descending trend in the past decades, especially in the 2010s, with an annual average of 14.70 × 10⁴ ha. The total number of swidden-practicing villages (or districts) also displayed a declining trend and there were 957 villages or 91 districts practicing it continuously between 2001 and 2020. An average of 32 villages per year or two districts per decade highlights the difficulty in ending swidden agriculture in Laos, although the government of Laos has established a number of policies for the eradication of swidden agriculture by 2020. This study provides a necessary methodological reference for monitoring a two-decade evolution and transformation of swidden agriculture in the tropics.
1. Introduction
As traditional land use in the tropical mountainous region, swidden agriculture or shifting cultivation has been widely practiced but with endless controversy on its sustainability for ages [1,2,3]. Description and field studies of this farming system can be traced back to the 18th century [4], including the earlier monographs of Skånska Resa (viz., Scanian Travels) of Carl Linnaeus in 1751 and The Malay Archipelago of Alfred Wallace in 1869. After two centuries, the FAO [5] for the first time appealed to end swidden agriculture. The 1992 United Nations Conference on Environment and Development (UNCED) further contributed to top-level designs for stopping swidden agriculture [6,7]. Then, the Alternatives to Slash-and-Burn (ASB) Partnership launched by the United Nations Development Programme (UNDP) in 1994 aimed to eradicate tropical swidden agriculture in a practical way [7,8]. However, the regaining of academic attention is related to the Intergovernmental Panel on Climate Change (IPCC) Fifth Assessment Reports [9] and sustainable development [10]. The watershed year could be the year 2008 when the UN Collaborative Programme on Reducing Emissions from Deforestation and Forest Degradation (REDD) in developing countries was launched and the ASB Partnership also evolved into the “Partnership of the Tropical Forest Margins” [7,11]. Highly connected with international forest initiatives, swidden agriculture has become the focus of debates on climate change and biodiversity [12,13]. Coincidentally, the 2007–2008 global financial crisis and subsequent broader economic downturn have brought severe consequences to those who live in or are on the verge of extreme poverty in the developing tropics [14]. In addition, swidden agriculture in transition also associates with poverty, hunger, and disease of the 2030 Sustainable Development Goals [15] and tropical biodiversity conservation [16]. Because of long-term neglect, the contribution of swidden agriculture to carbon emissions and its role in poverty alleviation and food security are still partially examined [17,18]. The deep and fundamental factor is the lack of regularly updated datasets due to the tardy progress in developing universal remote sensing algorithms [3].
Remote sensing could be an effective tool to detect swidden agriculture, while multiple-sourced and long-term satellite archives are indispensable for examining its dynamics [2,19]. Ever since the two iconic special issues on swidden agriculture by Human Ecology [20,21], the development of modified algorithms and generation of updated datasets at finer resolutions still progress slowly [13]. It is generally believed that this research status has a connection with the facts that tropical swidden plots are extensively fragmented (about one hectare), randomly scattered, and spatially independent in the hills and mountains (>200 m above sea level (masl)). They also, together with natural or secondary forests, form complex, dynamic, and diverse forest-swidden-fallow landscapes [22]. Presently, the development of novel algorithms as well as their monitoring and projection are the key aspects of swidden agriculture evolution and transformation [13,23]. Recently, a systematic review showed that Landsat family sensor images are the main data source for the remote sensing of swidden agriculture, accounting for over 60% of the 89 peer-reviewed journal articles [24]. In addition, unmanned aerial vehicles (UAVs [25]) and advanced satellite sensors (e.g., Sentinel-2 [13]) show greater potential than Landsat in delineating swiddens and fallows, but they cannot support historical evolution data backtracking. In contrast, MODIS Terra/Aqua has advantages over Landsat sensors including denser composite coverage and better spectral sensitivity [2,26]. In particular, the daily and near-daily revisits statistically increase the probability of clear or less cloud-contaminated ground observations. The value of MODIS time-series products for monitoring vegetation has been firmly established [27,28,29,30]; however, up to now, only an extremely limited number of cases for monitoring swidden agriculture at the landscape scale have been reported [22,31,32]. Although the retirement of Terra and Aqua is approaching, exploring the feasibility of two-decade MODIS vegetation indices for delineating swidden agriculture landscapes is still instructive and inspiring.
The Lao People’s Democratic Republic (Lao PDR or Laos), perhaps one of the most active countries aiming at eradicating swidden agriculture, is most frequently selected for developing algorithms for mapping swidden agriculture [24]. The topography of Laos is largely mountainous, especially in the north where hill and mountain landscapes widely extend, with the exception of the plains in Vientiane. Therefore, taken northern Laos (north of Borikhamxay Province) as a study area, using the 2001–2020 MODIS time-series (a total of 920) vegetation indices products, including the Normalized Difference Vegetation Index (NDVI), Enhanced Vegetation Index (EVI), and others, the Savitzky–Golay filter, the Mann–Kendall trend test, and a threshold method were employed to eliminate noise to exclude other factors from interfering the monitoring of vegetation change dynamics, select ground truth samples and delineate spatial and temporal patterns and dynamics of swidden agriculture landscape, followed by examining transformation trends at village scale. This study provides a methodological reference for monitoring a two-decade evolution and transformation of swidden agriculture in the tropics.
2. Study Area
Northern Laos covers eleven provinces (including Bokeo, Borikhamxay, Huaphanh, Luangnamtha, Luangprabang, Oudomxay, Phongsaly, Vientiane, Xayaboury, Xaysomboon and Xiengkhuang) and one prefecture (Vientiane, Figure 1), with the land area (15.46 × 10⁴ km2) accounting for 65.30% in the Lao PDR [33]. The largest and smallest provincial units are Vientiane (18,526 km2) and Vientiane Capital (3920 km2). The topography is largely hilly (200–500 masl, 18.84%) and rugged mountainous (>500 masl, 75.49%), with elevations above 200 masl reaching nearly 95%, typically characterized by steep terrain and narrow river valleys. The average is 769 masl and the area below 1500 masl holds 97.58%. The Annamese Range runs along the Laos-Vietnam border, while the Mekong River forms part of the border between Laos and Myanmar or Thailand. It has a tropical monsoon climate with a long dry season from November to April of next year. The annual average temperature is 25 °C [34], with about 34.3 °C in April (warmest) and 28.4 °C in January (coldest). Annual precipitation is 2000 mm with 90% in the rainy season. The vegetation mainly includes tropical montane forests, tropical monsoon forests, and deciduous forests. According to the global Sentinel-2 10 m Land Use/Land Cover (LULC) Timeseries, trees and rangeland accounted for 81.91% and 12.09%, respectively, in northern Laos in 2020 [35]. Swidden agriculture, uncontrolled fires, commercial and illegal logging, and fuelwood collection are threats to the forest [22].
Laos is the least populated and least densely populated country in Southeast Asia. Northern Laos has a small population of 4.25 billion (or 58.73%) and a population density of about 28 persons/km2 (less than the national level 31) in 2020. According to the 2020 statistics, over 60% of the Lao population distributes in rural areas, and the agricultural gross domestic product accounts for 16.51% [33]. The hilly and mountainous environments, distinct dry seasons, large proportion of ethnic groups (e.g., the Hmong and Khmu), and low agricultural potential facilitate the continuous development of swidden agriculture [31]. Shifting cultivators usually cut and slash primary or secondary vegetation and burn completely in the sunny noontime during the peak of the dry season, resulting in many small and scattered patches distinct from the forest in the hilly and/or mountainous environment. The year-by-year rotational slash-burn, cultivation, and fallow create complex landscapes among the forest, swidden, and fallow. In the mid-1990s, the Government of the Lao PDR began to set consecutive goals of eradicating swidden agriculture by 2000 [36], later 2010 [37], and 2020 [38]. Over the past decades, market integration and the development of non-agricultural sectors have seen swidden agriculture largely replaced by commercial production (including banana, maize, and rubber) [39].
3. Materials and Methods
3.1. MODIS Vegetation Indices Products and Preprocessing
To delineate monthly to annual development of swidden agriculture landscape (Figure 2), the 2001–2020 MODIS NDVI (MOD13Q1 V006, 16d and 250 m) and surface reflectance products (MOD09A1 V006, 8d and 500m) over northern Laos (h27v07 and h27v06) were freely gathered from the National Aeronautics and Space Administration (NASA) Alaska Satellite Facility (ASF) Distributed Active Archive Center (DAAC, https://ladsweb.modaps.eosdis.nasa.gov/search/, accessed on 15 July 2021). Among them, MOD09A1 data products have data missing on day of year (DOY) 169 in 2001 and Near Infrared (NIR) anomalies on DOY 001 and 017 in 2007. The MODIS Reprojection Tool is applied to composite MOD09A1 and MOD13Q1 with the same projected coordinate system (UTM48N). MOD09A1 is preprocessed into 16d in line with MOD13Q1 to depict the temporal development of varied stages (e.g., slashing and burning) of swidden agriculture [40]. Then, the surface reflectance of Blue (459~479 nm), Red (620~670 nm), NIR 1 (841~876 nm), NIR 2 (1230~1250 nm), Shortwave Infrared (SWIR) 1 (1628~1652 nm), and SWIR-2 (2105~2155 nm) bands were used to calculate NDVI [41], EVI [42], Land Surface Water Index (LSWI [43]), and Normalized Burn Ratio (NBR [44]). The equations for calculating vegetation indices were listed below:
where , , , , , and refer to the surface reflectance of the Blue, Red, NIR1, NIR2, SWIR1, and SWIR2 bands. The values of the four vegetation indices range from +1.0 to −1.0.
Firstly, time-series NDVI, EVI, and other indices were consistently harmonized to delineate seasonal and phenological vegetation development using the Savitzky–Golay filter method. The filtering method performs well in smoothing out noise due to cloud contamination or atmospheric variability and reflecting long-term changes and/or local abrupt variations [27]. Secondly, the Mann–Kendall (MK) trend test was used to screen out potentially qualified samples (pixels) via the evaluation of the changing trend of vegetation indices at the 95% significance level [45]. Then, the samples of swidden agriculture landscapes were further selected based on their spectral characteristics during the dry season. The threshold values are determined based on the statistics of the selected pixels of freshly opened swiddens during the critical period before and after slash and burn. Finally, the threshold method was applied for the detection of the annual distribution of the swidden agriculture landscape between 2001 and 2020.
3.2. Landsat-8 Surface Reflectance and Sampling Selection
Landsat family sensors’ 30 m imagery is often applied as ground truth data for validating classification results derived from MOIDS time-series vegetation indices [31,46,47]. The justification is mainly because Landsat imagery has already been proven useful for mapping swidden agriculture [24]. When we carried out a sample selection of newly opened swiddens, only those with larger patches were considered, albeit the difference between MODIS and Landsat imagery regarding the pixel size. Meanwhile, there have been challenged to collecting ground truth samples in situ in the past twenty years. Similarly, the accessibility of users to historical finer and long-term satellite imagery via Google Earth is limited. Then, Landsat imagery can be a good choice for sample selection.
In this study, the level-2 surface reflectance products of Landsat scenes over northern Laos (Figure 1) were gathered from the United States Geological Survey (USGS) Earth Resources Observation and Science (EROS) Center Science Processing Architecture (ESPA) on Demand Interface (https://espa.cr.usgs.gov/index/, accessed on 13 October 2021) for the selection of validation samples. The images consist of two parts. Part one is the usage of imagery across northern Laos acquired in the same year (2013), including path/row 130/046 (April 6), 129/045 (September 11), and 128/047 (October 6), with the cloud coverage (CC) of 6.04%, 7.12%, and 13.51%, respectively. The three scenes cover the northernmost, westernmost, and southeastern parts of the study area, which fully considers the latitudinal and longitudinal landscape differences. Part two is the usage of images of path/row 129/046 acquired on 3 May 2003 (CC = 13%), 29 March 2008 (CC = 7%), 25 April 2012 (CC = 2%), 28 April 2016 (CC = 4.59%), and 9 May 2020 (CC = 14.97%), which give full consideration to annual variation. It should be noted that the extent of 129/046 is only a path/row located within entire Laos. Then, cloud-free pixels displaying the features of being cleared (e.g., slashing, drying, and burning), cropping (including harvesting), and fallowing on the natural color composites (SWIR-NIR-Red) were carefully compared and selected based on our earlier fieldwork in Mainland Southeast Asia [13].
3.3. Sentinel-2 10 m Land Use and Land Cover Products
The datasets of 2017–2021 Sentinel-2 10 m LULC Timeseries in the format of GeoTIFF are freely available to the scientific community via Environmental Systems Research Institute (ESRI) (https://www.arcgis.com/apps/instant/media/index.html?appid=fc92d38533d440078f17678ebc20e8e2, (accessed on 15 November 2021)). The five-year datasets comprise water, trees, grass, flooded vegetation, crops, rangeland, built area, bare ground, snow/ice and clouds. Annual LULC products have an average accuracy of 85~89% [35]. The type of trees covers any significant clustering of tall (~4.572 m or higher) dense vegetation including industrial tree plantations. The built area consists of man-made structures including paved roads and railways and other large homogenous impervious surfaces. Moreover, water refers to rivers, ponds, lakes, oceans, and flooded salt plains. The 2017–2021 maximum distribution map of waterbodies was utilized as an auxiliary mask to eliminate the target pixels showing abrupt changes due to the expansion or reduction of the water surface. The area statistics of trees and rangeland were also used in the study area. In addition, the 5338 village-level shapefile data were gathered from the Ministry of Agriculture and Forestry (MAF).
3.4. Samples Selection of Swidden Agriculture Landscape Using the Mann-Kendall Trend Test
(1) Curves construction and harmonization of time-series vegetation indices
MODIS time-series vegetation indices (e.g., NDVI, EVI, LSWI, and NBR) curves during 2001–2020 were established using the layer stacking tool via ENVI 5.3. Then, the Savitzky–Golay filter, as a convolutional smoothing method using the least-squares-fit to calculate derivatives of the time-series dataset, was applied to smooth out noise. We generated improved time series of vegetation indices for swidden agriculture landscapes as the filter eliminates abnormal values due to abrupt changes and/or cloud contamination. Abrupt changes might be caused by the slash and burn of secondary and/or primary forests or the rapid rise or fall of the water surface of rivers and/or lakes. The equation is given below [22,27].
where Y and Y* represent the original and estimated values, j represents the jth data in the time series to be modeled, Ci represents the filtering coefficient of the ith data, and N represents a rectangular window (4 × 4) of a fixed moving window.
(2) Sample selection based on the Mann–Kendall trend test
Target pixels of swidden agriculture landscapes were defined according to their temporal dynamics, especially in the duration between February and April due to slash and burn. Based on the fact that swidden agriculture is featured by rotational cycles of pre-slash, slashing, drying, and burning of vegetation, the pixels of swidden agriculture landscape undergo abrupt decrement in vegetation indices during the dry season [45]. The Mann–Kendall trend tests were consistently carried out via MATLAB 2018a. The formulas of the Mann–Kendall trend test are listed below [48]. First, the statistics (S) of the Mann–Kendal trend test are computed as follows.
where n represents the number of the time series, xi and xj denotes the value at timings i and j. Both negative and positive S indicate that there is a decreasing or increasing trend. m is the number of tied groups, and ti is the number of observations in the ith (tied) group.
Next, S is tested by Z.
If Z is greater than the critical value (1.96) of a standard normal distribution at the significance level (95%), it indicates a statistically significant positive or negative trend in the data series. Here, only the pixels (samples) showing an abrupt decline in the vegetation indices time series are kept. It should be noted that these samples were characterized by two or more slash-burns during the recent two decades. Finally, we selected 50 of the target pixels that are evenly distributed in northern Laos to delineate the temporal variations in MODIS time series (e.g., NDVI and EVI) of swidden agriculture, especially during the dry season (Figure 3). Comparisons show that NDVI and EVI perform much better than those of NBR, LSWI, SWIR1 and NIR2 in describing the temporal changes of slash and burn based on the selected pixels of swidden agriculture. Similarly, the threshold ranges of NDVI and EVI were further determined.
4. Results and Analysis
4.1. Threshold Ranges of Vegetation Indices for Detecting Swidden Agriculture Landscape
As swidden agriculture shows drastic temporal variations in spectral features, threshold ranges of NDVI/EVI for detecting swidden agriculture landscape between February and April were determined with the selected 50 pixels during 2004–2010 (Figure 3). A 16d interval might cause maximum MODIS NDVI and/or EVI beyond one month, which brings about obvious variations during slash and burn. Here, NDVI and EVI were statistically calculated in consecutive two months based on the abrupt changes in vegetation indices, e.g., February–March, March–April, and April–May. The rule of a sharp decrease in NDVI and EVI during the period of slash and burn or before cultivating crops is often applied to detect newly opened swiddens in that very year [40]. Next, threshold ranges of MODIS NDVI and EVI between February and May 2001–2020, in particular those in March–April and April–May, were consistently determined. Concerning the issues of spanning two consecutive months due to 16d interval of MODIS composites (e.g., the product of DOY 113) and temporal variations in vegetation growth, statistics (e.g., the averages) of minimum values of NDVI and EVI after the abrupt change in either March–April or April–May were calculated to determine the threshold ranges for identifying swidden agriculture landscape. To ensure the stability of threshold ranges, five-year, ten-year, and twenty-year averages of NDVI and EVI during the periods of March–April and April–May were calculated accordingly (Table 1 and Figure 4). Lastly, the threshold ranges of NDVI and EVI of swiddens are 0.47 (±0.02) and 0.35 (±0.02) in March–April and 0.36 (±0.03) and 0.29 (±0.02) in April–May, respectively. The pixels with NDVI and/or EVI less than or equal to the aforementioned threshold ranges were labeled as a swidden agriculture landscape in 2001–2020. MODIS NDVI and EVI are able to detect the growth status and vegetation coverage of regional vegetation, and EVI is more capable of correcting and eliminating the effects of soil background and aerosols. However, the NDVI values are always larger than those of EVI in the same time period mainly due to the variations in fractional vegetation cover [49].
According to the availability of cloud-free or low-cloud-content Landsat imagery, then the resultant MODIS-derived maps of the swidden agriculture landscape in 2003, 2008, 2012, 2013, 2016, and 2020 were selected for accuracy assessment via a confusion matrix. With the Landsat-based samples of swiddens including newly burned plots and cultivated fields, Table 2 shows the evaluation results via a confusion matrix. In contrast, NDVI-based mapping of the swidden agriculture landscape has a larger average overall classification accuracy of 79% and an average Kappa coefficient is 0.59, showing moderate to substantial reliability. Given the coarse spatial resolution of MODIS data products, the evaluation results are practicable at regional to global scales. In addition, considering the spatial heterogeneity, temporal complexity, and landscape diversity of swidden agriculture [24], the NDVI-based threshold method has greater potential in monitoring swidden agriculture at the landscape scale for the entire study period.
4.2. Annual Changes in Swidden Agriculture Landscape in Northern Laos
With the 2001–2020 MODIS NDVI time series, annual maps of the swidden agriculture landscape were consistently extracted and statistically calculated via the ArcGIS 10.6 platform. The spatial pattern of the swidden agriculture landscape was significantly more prevalent in the southeast than that in the northwest. The annual average area was 14.70 × 10⁴ ha in northern Laos. In particular, Huaphanh Province had the highest area percentage of swidden agriculture landscape (13.94%). This was followed by those in Borikhamxay Province (12.78%), Phongsaly Province (11.90%), and Luangprabang Province (10.62%). By contrast, Vientiane Capital had the lowest percentage (1.14%). Numerically, the swidden agriculture landscape showed a general decline trend during the last two decades, with a nearly 13.80% reduction in the second decade. Five-year averages also showed that a continuous increase was observed during 2001–2015 and a sharp decrease in the last one (Figure 5).
Annual variations in the swidden agriculture landscape were huge in northern Laos (Figure 6a) and among provincial units (Figure 6b–d). Firstly, it declined sharply from 22.87 × 10⁴ ha in 2001 to 10.55 × 10⁴ ha in 2005 in the entire study area, with a reduction of over 53.87%. The noticeable reduction in 2005 may be related to the National Growth and Poverty Reduction Strategy launched in the previous year, which attempts to make efforts to stabilize swidden agriculture across the country. Secondly, swidden agriculture exhibited a tendency to increase and then decrease every other year between 2005 and 2009, with the maximum (21.25 × 10⁴ ha) in 2008 during half of the 2000s. It should be noted that swidden agriculture exhibited a sharp fall in 2010 while the distribution area shrank to its weakest level in the 2010s. For example, the 2010 area of the swidden agriculture landscape declined by over 54% compared with that in 2008. We thus cautiously believe that the general decreasing trend in the development of the swidden agriculture landscape was closely connected with the policies of eradicating swidden agriculture proposed in the Eighth Party Conference by 2010. Although this national goal had not yet been fully accomplished within the prescribed time limit, several villages had successfully facilitated the stop or transformation of swidden agriculture. However, the decline in swidden agriculture ended with a rebound growth next year mostly due to the discontinuity of governmental policy. For example, the endeavor of stabilizing swidden agriculture was not emphasized much in Lao official documents in 2011. In addition, the decline of rubber latex prices may also be an important factor as the smallholders of rubber plantations are more dependent on swidden agriculture. More specifically, there was a steady development of the swidden agriculture landscape in the first half of the 2010s. With the goal postponed by 2020, a generally consistent declining trend in the swidden agriculture landscape was seen since 2016, with the exception of 2017. Regarding the contributors to the decrease in the years 2016–2020, this is an important issue that needs to be carefully examined in the near future with multi-sourced input data such as household interviews and the policies of shifting cultivation eradication in northern Laos. Currently, we cautiously believe that the dominant factor could be the top-down eradication policies of the central government in Laos.
4.3. Village-Level Changes in Swidden Agriculture Landscape in Northern Laos
Swidden agriculture landscape was detected in all provinces of northern Laos over the last two decades, which still highlights the universality and necessity of this traditional farming (Figure 7). Huaphanh, Borikhamxay, Phongsaly, Luangprabang, Xaysomboon, Xiengkhuang, and Xayaboury opened swiddens with an annual average of over 1.00 × 10⁴ ha and Huaphanh had the largest (2.00 × 10⁴ ha). In contrast, the quantity in the other four provinces was below the average level and Vientiane Capital had the least (0.17 × 10⁴ ha). Similarly, the twelve provincial units all displayed varying degrees of decreasing trends in the swidden agriculture landscape. The annual fluctuation of the swidden agriculture landscape was huge in all provinces (especially Huaphanh) with the exception of Vientiane Capital before 2017. Then, this farming was kept at a low level. Annual areas of the swidden agriculture landscape showed similar changing patterns among Luangnamtha, Bokeo, Oudomxay and Xayaboury. For example, swidden agriculture had obviously declined since 2008.
Similar zonal statistics calculation shows that a swidden agriculture landscape was detected in all districts (99) of northern Laos. However, 91 of them always kept this farming. Among them, Phonhong District in Vientiane Province reported 13 times the practicing of swidden agriculture in twenty years. Besides, the area of swidden agriculture in the Xamneua District of Huaphanh Province decreased the most, or 5.66 ×10³ ha, followed by 4.54 × 10³ ha in the Kasy District of Vientiane Province. It should be noted that the swidden agriculture landscape in the Hinherb District (Vientiane Province), Ngeun District (Xayaboury Province), Khounkham District (Borikhamxay Province), Phonhong District (Vientiane Province) ended in 2018. Compared with the number of swidden districts in 2001, there was a reduction of 3% in 2002, 3% in 2010, and 8% in 2019. In other words, only two districts stopping swidden agriculture in each decade highlight the difficulty in ending swidden agriculture in Laos.
The number of villages that were detected with the emergence of swidden agriculture decreased in the last two decades (Figure 8), from 1637 in the 2000s to 1432 in the 2010s. However, swidden agriculture was continuously practiced in a total of 957 villages, or nearly accounting for 39.05% of the total. These villages had a total area of 14.56 × 10⁴ ha in 2001 and 5.94 × 10⁴ ha in 2020, showing a notable decreasing trend (59.21%). Among them, the area used for swidden agriculture of the village Xieng Nuea, Phongsaly Province dropped by 0.19 × 10⁴ ha, and nearly 54.50% in the last twenty years. Second, nearly 51.41% of the villages had an area reduction of over 50% during 2001–2020. Among them, 66 villages (including Korhai of Borikhamxay Province, or 6.90%) declined by over 90%, and about 492 villages (including Namleom of Huaphanh Province, or 51.41%) had more than half of decreased area of swidden agriculture in the period. About 210 villages (including Viengsamai of Luangprabang Province, or 22%) decreased by 10–50%, followed by 241 (including Pamaekkouy of Luangnamtha Province, or 25.18%) villages less than 10%. Finally, swidden agriculture showed an increasing trend in 14 villages, including Phonhxai of Huaphanh Province, Maknaotai of Vientiane Capital, Huoisieth of Borikhamxay Province, Houayhip of Luangprabang Province, Xongtai of Luangprabang Province, and Phava of Huaphanh Province. Although the increase in swidden agriculture plays an insignificant role in affecting the general trend of decline, the underlying factors behind are not clear and need to be pressingly investigated.
Further statistical analyses were added based on the time nodes of key policies on the eradication of swidden agriculture during 2001–2020 (Table 3). Firstly, with the launch of the National Poverty Eradication Programme (NPEP) in 2003 and the National Growth and Poverty Eradication Strategy in 2004 by the Lao PDR, the number of villages practicing swidden agriculture in 2005 declined by 1101 compared with that in 2001, with the corresponding area of 12.35 × 10⁴ ha. These villages are mainly concentrated in Luangprabang Province (205 villages or 18.6% including Navat), Phongsaly Province (153 villages or 13.8% including Narm Hounh), Huaphanh Province (150 villages or 13.6% including Huana), Oudomxay Province (141 villages or 12.8% including Mukton), Xiengkhuang Province (124 villages or 11.2% including Korsanh), and Xayaboury Province (116 villages or 10.50% including Khueng). Secondly, to meet the goal of entirely eliminating swidden agriculture in the Eighth Conference of the Lao People’s Revolutionary Party by 2010, 1174 villages in total discontinued swidden agriculture that year. However, 735 out of the 1174 villages re-practiced swidden agriculture in 2011, with a rehabilitation rate of 62.61%. Finally, statistics show that 1455 villages or about 59.30% of the villages in northern Laos no longer practiced swidden agriculture in 2020. Meanwhile, swidden agriculture was stopped in 1318 villages out of 1455 or 90.58% of them between 2018 and 2020. It again shows that the Lao government’s policies are crucial for the elimination of swidden agriculture.
Annual variations in the number of villages practicing swidden agriculture in northern Laos were also noticeable during 2001–2020. Compared with that in 2001, swidden-practicing villages fell by nearly 45% in 2005, 48% in 2010, and 59% in 2020. Within 1455 villages, the most reduction of swidden agriculture landscape was seen in 2020. In other words, the quantity of swidden-practicing villages decreased, with an average of 32 each year. Among them, larger reductions were seen in 2002, 2010, and 2018, accounting for 38%, 27%, and 38%, respectively, compared with those of the previous year. Because of annual fluctuation, there were also increments in swidden-practicing villages in 2006, 2011 and 2017 compared with those of the prior year, namely 19% (or 259), 54% (or 691), and 46% (or 555), respectively. About 1084 villages (43.69%) in northern Laos stopped swidden agriculture over 10 times during 2001–2020, followed by 300 villages (12.09%) five to ten times, and 110 villages (4.43%) with less than five (Table 4).
5. Discussion
5.1. Potential and Limitations of MODIS Vegetation Indices in Mapping Swidden Agriculture Landscape
Swidden agriculture landscape covers the full process ranging from slash-burn, cultivation, and fallow [2], which comprises complex land cover mosaics featured by agricultural production and forest recovery [50]. This study highlights the potential of MODIS NDVI time-series products in mapping the swidden agriculture landscape in northern Laos. It is also based on the spectral changes in the period of slash and burn during the dry season. However, the coarse spatial resolution may limit the effectiveness of mapping the exact boundary of slashed and burned pixels of swidden agriculture [31,51]. In addition, the aerosol effects have an impact on the performance of vegetation indices in tropical mountainous settings where there is a high aerosol load. The better stability of MODIS NDVI over EVI ensure that NDVI-derived results on swidden agriculture landscape perform better in northern Laos [52]. Our study shows the promising potential of MODIS time-series vegetation indices in monitoring the landscape changes in swidden agriculture within the tropics in the early two decades of this century. However, it requires that more ground samples be extensively gathered via varied spatiotemporal resolution remotely sensed data to improve the algorithms across the tropical regions.
Next, the threshold method is straightforward but is highly dependent on local conditions [51,53]. As swidden agriculture shows great diversity across the tropics [54], there are huge variations in the fuel load among different plots and phenology of slash and burn due to inter-annual climate change [55]. Although the determination of threshold ranges is simple and feasible, the value ranges should be seriously defined in other regions. Since the fact that swidden agriculture is always opened in the secondary and/or primary forest, value ranges of varied vegetation indices between pre-slash and burn also fluctuate. We appeal more attention could be paid to define the development of commonly used vegetation indices using various satellite imagery. In addition, the accurate evaluation of MODIS classification results at 250 m or 500 m resolutions is usually challenged. This is also true for the monitoring of swidden agriculture because of the lack of cadastral and statistical information [21,56]. Landsat and other medium-resolution images are always employed for validating the accuracy of MODIS-extracted results. It should be noted that there are temporal differences between MODIS annual results and single-date ground truth based on Landsat images. Moreover, the mixed pixel effects of MODIS results on swidden agriculture also challenge the accuracy of Landsat-derived ground truth data.
5.2. Enhancing Remote Sensing of Swidden Agriculture in Transition in the Tropics
Swidden agriculture is continuously practiced in the tropics [13], despite intervention from all sides via policy-making, alternative development, and the introduction of other land use techniques [57,58]. Under the context of climate change, swidden agriculture is no longer merely a traditional food production system for remote uplanders or a unique cultural identity of local ethnic groups. The carbon emissions or budget in tropical forest changes due to slash-burns and fallow calls for in-depth analyses of tropical swidden agriculture. This is also true for the improvement of shifting cultivators’ livelihoods to meet the Sustainable Development Goals (SDGs). Swidden agriculture in transition has thus gained increasing concerns from scientific community and decision-makers. It is not hard to understand that the dynamics of swidden agriculture clearly reflect the social and political shifts in perspective towards this traditional practice [59]. More multidisciplinary studies are expected to figure out the spatial and temporal dynamics and their effects and mechanisms of swidden agriculture in transition. Among them, remote sensing of swidden agriculture is the first and key step to generate fundamental thematic datasets in recent decades.
Taking Laos, for example, swidden agriculture is highly concerning because of its forest-dominant land cover especially in its northern part under the context of the implementation of the United Nations Collaborative Programme on Reducing Emissions from Deforestation and Forest Degradation in Developing Countries (UN-REDD Programme). It makes the country a valuable partner for developed nations looking for less expensive solutions to cut carbon dioxide emissions. To maximize the value of the secondary or primary forests, the Lao Government has put up a variety of regulations and policies to stabilize or end swidden agriculture over the past decades. This research remains a methodological test study aiming at probing into the potential of MODIS data products in mapping swidden agriculture landscapes in the tropics. Moreover, it shows a generally decreasing trend of swidden agriculture. However, more details about the changing swidden agriculture in the tropical highlands remain understudied. For instance, what are the differences in landscape patterns of swidden agriculture in transition across the tropics in the past decades? Under the constraints of man-land relations caused by population growth and land use policies, what are the changing characteristics of swidden and/or fallow patches? Additionally, how does the fallow period change? These pixel- to patch-level examinations of swidden agriculture in transition may not be accomplished using moderate to coarse satellite imagery, either Landsat or MODIS. Presently, Sentinel-2 A/B launched in 2015/2017 can be a robust and consistent data option for finer mapping of swidden agriculture [24]. However, to our best knowledge, no Sentinel-2-based analysis on an algorithm developing for monitoring tropical-swidden agriculture has been reported.
6. Conclusions
Can MODIS vegetation indices be applied to detect swidden agriculture? How did swidden agriculture develop in the past two decades under the national policies of eradication in northern Laos? To answer the questions, MODIS vegetation indices time-series data during 2001–2020 were gathered to generate annual maps of swidden agriculture landscape with threshold method and then applied to examine the spatial and temporal dynamics, in particular at the village-level and annual scale. The main conclusions are: Firstly, MODIS NDVI/EVI time series hold the potential in delineating the temporal development of the entire process of slash and burn in northern Laos. However, the NDVI time series performs better in detecting and mapping the swidden agriculture landscapes. Secondly, annual variations in the swidden agriculture landscape were huge in northern Laos, with an annual average of 14.70 × 10⁴ ha. However, it showed a declining trend during the last two decades, in particular, in the second half of the 2010s. Thirdly, swidden agriculture had been continuously practiced in 957 villages, or 91 districts during the last two decades, especially in villages in the northwest. The total number of swidden-practicing villages (or districts) showed a declining trend. The average of 32 villages per year or two districts per decade highlights the difficulty in ending swidden agriculture in Laos, although the government of the Lao PDR has established a number of policies for the eradication of swidden agriculture by 2020.
Author Contributions
Conceptualization, supervision, project administration, and funding acquisition, P.L.; methodology, validation, formal analysis, data curation, writing—original draft preparation, writing—review and editing, and visualization, P.L and Y.Y. All authors have read and agreed to the published version of the manuscript.
Funding
This research was funded by the National Natural Science Foundation of China under Grant [No.: 41971242] and Youth Innovation Promotion Association of the Chinese Academy of Sciences under Grant [No.: 2020055].
Data Availability Statement
The data that support the findings of this study will be available on request from the corresponding author.
Conflicts of Interest
The authors declare no conflict of interest.
References
- van Vliet, N.; Mertz, O.; Heinimann, A.; Langanke, T.; Pascual, U.; Schmook, B.; Adams, C.; Schmidt-Vogt, D.; Messerli, P.; Leisz, S.; et al. Trends, drivers and impacts of changes in swidden cultivation in tropical forest-agriculture frontiers: A global assessment. Glob. Environ. Change 2012, 22, 418–429. [Google Scholar] [CrossRef]
- Li, P.; Feng, Z.; Jiang, L.; Liao, C.; Zhang, J. A review of swidden agriculture in Southeast Asia. Remote Sens. 2014, 6, 1654–1683. [Google Scholar] [CrossRef] [Green Version]
- Heinimann, A.; Mertz, O.; Frolking, S.; Egelund Christensen, A.; Hurni, K.; Sedano, F.; Parsons Chini, L.; Sahajpal, R.; Hansen, M.; Hurtt, G. A global view of shifting cultivation: Recent, current, and future extent. PLoS ONE 2017, 12, e184479. [Google Scholar] [CrossRef] [PubMed] [Green Version]
- Dove, M.R. The view of swidden agriculture, by the early naturalists Linnaeus and Wallace. In Shifting Cultivation and Environmental Change: Indigenous People, Agriculture and Forest Conservation; Cairns, M.F., Ed.; Routledge: New York, NY, USA, 2015; pp. 3–24. [Google Scholar]
- FAO Staff. Shifting cultivation. Unasylva 1957, 11, 9–11. [Google Scholar]
- Agenda 21. United Nations Conference on Environment & Development; United Nations: Rio de Janerio, Brazil, 1992; p. 351. [Google Scholar]
- Tomich, T.P.; Timmer, D.W.; Velarde, S.J.; Alegre, J.; Areskoug, V.; Cash, D.W.; Cattaneo, A.; Ericksen, P.; Joshi, L.; Kasyoki, J.; et al. Integrative science in practice: Process perspectives from ASB, the Partnership for the Tropical Forest Margins. Agric. Ecosyst. Environ. 2007, 121, 269–286. [Google Scholar] [CrossRef] [Green Version]
- Brady, N.C. Alternatives to slash-and-burn: A global imperative. Agric. Ecosyst. Environ. 1996, 58, 3–11. [Google Scholar] [CrossRef]
- Porter, J.R.; Challinor, A.J.; Henriksen, C.B.; Howden, S.M.; Martre, P.; Smith, P. Invited review: Intergovernmental Panel on Climate Change, agriculture, and food-A case of shifting cultivation and history. Glob. Change Biol. 2019, 25, 2518–2529. [Google Scholar] [CrossRef]
- Dasgupta, R.; Dhyani, S.; Basu, M.; Kadaverugu, R.; Hashimoto, S.; Kumar, P.; Johnson, B.A.; Takahashi, Y.; Mitra, B.K.; Avtar, R.; et al. Exploring Indigenous and Local Knowledge and Practices (ILKPs) in Traditional Jhum Cultivation for Localizing Sustainable Development Goals (SDGs): A Case Study from Zunheboto District of Nagaland, India. Environ. Manag. 2021. [Google Scholar] [CrossRef]
- Mertz, O. Trends in shifting cultivation and the REDD mechanism. Curr. Opin. Environ. Sust. 2009, 1, 156–160. [Google Scholar] [CrossRef]
- Pollini, J. Agroforestry and the search for alternatives to slash-and-burn cultivation: From technological optimism to a political economy of deforestation. Agric. Ecosyst. Environ. 2009, 133, 48–60. [Google Scholar] [CrossRef]
- Li, P.; Xiao, C.; Feng, Z. Swidden agriculture in transition and its roles in tropical forest loss and industrial plantation expansion. Land Degrad. Dev. 2022, 33, 388–392. [Google Scholar] [CrossRef]
- Lin, J.Y. The Impact of the Financial Crisis on Developing Countries; License: CC BY 3.0 IGO; World Bank: Washington, DC, USA, 2008; Available online: https://openknowledge.worldbank.org/handle/10986/26129 (accessed on 1 April 2022).
- Dressler, W.; Wilson, D.; Clendenning, J.; Cramb, R.; Mahanty, S.; Lasco, R.; Keenan, R.; To, P.; Gevana, D. Examining how long fallow swidden systems impact upon livelihood and ecosystem services outcomes compared with alternative land-uses in the uplands of Southeast Asia. J. Dev. Eff. 2015, 7, 210–229. [Google Scholar] [CrossRef]
- Reang, D.; Hazarika, A.; Sileshi, G.W.; Pandey, R.; Das, A.K.; Nath, A.J. Assessing tree diversity and carbon storage during land use transitioning from shifting cultivation to indigenous agroforestry systems: Implications for REDD+ initiatives. J. Environ. Manag. 2021, 298, 113470. [Google Scholar] [CrossRef] [PubMed]
- Silva, J.M.N.; Carreiras, J.M.B.; Rosa, I.; Pereira, J.M.C. Greenhouse gas emissions from shifting cultivation in the tropics, including uncertainty and sensitivity analysis. J. Geophys. Res. 2011, 116, 1–21. [Google Scholar] [CrossRef] [Green Version]
- Borah, J.R.; Evans, K.L.; Edwards, D.P. Quantifying carbon stocks in shifting cultivation landscapes under divergent management scenarios relevant to REDD+. Ecol. Appl. 2018, 28, 1581–1593. [Google Scholar] [CrossRef] [PubMed]
- Dutrieux, L.P.; Jakovac, C.C.; Latifah, S.H.; Kooistra, L. Reconstructing land use history from Landsat time-series: Case study of a swidden agriculture system in Brazil. Int. J. Appl. Earth Obs. 2016, 47, 112–124. [Google Scholar]
- Mertz, O.; Padoch, C.; Fox, J.; Cramb, R.A.; Leisz, S.J.; Lam, N.T.; Vien, T.D. Swidden change in Southeast Asia: Understanding causes and consequences. Hum. Ecol. 2009, 37, 259–264. [Google Scholar] [CrossRef]
- Van Vliet, N.; Mertz, O.; Birch-Thomsen, T.; Schmook, B. Is there a continuing rationale for swidden cultivation in the 21st century? Hum. Ecol. 2013, 41, 1–5. [Google Scholar] [CrossRef]
- Tottrup, C.; Rasmussen, M.S.; Eklundh, L.; Jönsson, P. Mapping fractional forest cover across the highlands of mainland Southeast Asia using MODIS data and regression tree modelling. Int. J. Remote Sens. 2010, 28, 23–46. [Google Scholar] [CrossRef]
- Decuyper, M.; Chávez, R.O.; Lohbeck, M.; Lastra, J.A.; Tsendbazar, N.; Hackländer, J.; Herold, M.; Vågen, T. Continuous monitoring of forest change dynamics with satellite time series. Remote Sens. Environ. 2022, 269, 112829. [Google Scholar] [CrossRef]
- Jiang, N.; Li, P.; Feng, Z. Remote sensing of swidden agriculture in the tropics: A review. Int. J. Appl. Earth Obs. 2022, 112, 102876. [Google Scholar] [CrossRef]
- Cummings, A.R.; Karale, Y.; Cummings, G.R.; Hamer, E.; Moses, P.; Norman, Z.; Captain, V. UAV-derived data for mapping change on a swidden agriculture plot: Preliminary results from a pilot study. Int. J. Remote Sens. 2017, 38, 2066–2082. [Google Scholar] [CrossRef]
- Wu, G.; De Leeuw, J.; Skidmore, A.K.; Prins, H.H.T.; Liu, Y. Comparison of MODIS and Landsat TM5 images for mapping tempo-spatial dynamics of Secchi disk depths in Poyang Lake National Nature Reserve, China. Int. J. Remote Sens. 2008, 29, 2183–2198. [Google Scholar] [CrossRef]
- Chen, J.; Jönsson, P.; Tamura, M.; Gu, Z.; Matsushita, B.; Eklundh, L. A simple method for reconstructing a high-quality NDVI time-series data set based on the Savitzky–Golay filter. Remote Sens. Environ. 2004, 91, 332–344. [Google Scholar] [CrossRef]
- Kim, S.; Prasad, A.K.; El-Askary, H.; Lee, W.; Kwak, D.; Lee, S.; Kafatos, M. Application of the Savitzky-Golay filter to land cover classification using temporal MODIS vegetation indices. Photogramm. Eng. Remote Sens. 2014, 80, 675–685. [Google Scholar] [CrossRef] [Green Version]
- Tsalyuk, M.; Kelly, M.; Getz, W.M. Improving the prediction of African savanna vegetation variables using time series of MODIS products. ISPRS J. Photogramm. 2017, 131, 77–91. [Google Scholar] [CrossRef] [Green Version]
- Cao, R.; Chen, Y.; Shen, M.; Chen, J.; Zhou, J.; Wang, C.; Yang, W. A simple method to improve the quality of NDVI time-series data by integrating spatiotemporal information with the Savitzky-Golay filter. Remote Sens. Environ. 2018, 217, 244–257. [Google Scholar] [CrossRef]
- Hurni, K.; Hett, C.; Heinimann, A.; Messerli, P.; Wiesmann, U. Dynamics of shifting cultivation landscapes in northern Lao PDR between 2000 and 2009 based on an analysis of MODIS time series and Landsat images. Hum. Ecol. 2013, 41, 21–36. [Google Scholar] [CrossRef] [Green Version]
- Padoch, C.; Coffey, K.; Mertz, O.; Leisz, S.J.; Fox, J.; Wadley, R.L. The demise of swidden in Southeast Asia? Local realities and regional ambiguities. Geogr. Tidsskr.-Dan. J. Geogr. 2007, 107, 29–41. [Google Scholar] [CrossRef]
- Lao Statistics Bureau. Vientiane Capital: Laos Statistical Information Service. In Statistical Yearbook 2021; Lao Statistics Bureau: Vientiane, Laos, 2022. [Google Scholar]
- Chaplot, V.; Khampaseuth, X.; Valentin, C.; Bissonnais, Y.L. Interrill erosion in the sloping lands of northern Laos subjected to shifting cultivation. Earth Surf. Proc. Land. 2007, 32, 415–428. [Google Scholar] [CrossRef]
- Karra, K.; Kontgis, C.; Statman-Weil, Z.; Mazzariello, J.C.; Mathis, M.; Brumby, S.P. Global land use/land cover with Sentinel 2 and deep learning. In Proceedings of the 2021 IEEE International Geoscience and Remote Sensing Symposium IGARSS, Brussels, Belgium, 11–16 July 2021; IEEE: Brussels, Belgium, 2021; pp. 4704–4707. [Google Scholar]
- Keonuchan, K. The Adoption of New Agricultural Practices in Northern Laos: A Political Ecology of Shifting Cultivation. Doctoral Dissertation; University of Sydney: Sydney, Australia, 2000; p. 225. [Google Scholar]
- Lao PDR. National Poverty Eradication Programme (NPEP); Lao PDR: Vientiane, Laos, 2003. [Google Scholar]
- MAF. Framework of Strategic Vision on Forest Resources Management to the Year 2020; Ministère de l’Agriculture et des Forêts: Vientiane, Laos, 2000.
- Thanichanon, P.; Schmidt-Vogt, D.; Epprecht, M.; Heinimann, A.; Wiesmann, U. Balancing cash and food: The impacts of agrarian change on rural land use and wellbeing in Northern Laos. PLoS ONE 2018, 13, e209166. [Google Scholar] [CrossRef]
- Kanemaru, K.; Muhammad, R.; Hirota, I. Analysis of Monsoon Climate Variability for Swidden Agriculture in Northern Laos. In Integrated Studies of Social and Natural Environmental Transition in Laos. Advances in Asian Human-Environmental Research; Yokoyama, S., Okamoto, K., Takenaka, C., Hirota, I., Eds.; Springer: Tokyo, Japan, 2014; pp. 85–97. [Google Scholar]
- Tucker, C.J. Remote sensing of leaf water content in the near infrared. Remote Sens. Environ. 1980, 10, 23–32. [Google Scholar] [CrossRef]
- Huete, A.R.; Liu, H.; van Leeuwen, W.J.D. The use of vegetation indices in forested regions: Issues of linearity and saturation. IGARSS’97. In Proceedings of the 1997 IEEE International Geoscience and Remote Sensing Symposium Proceedings. Remote Sensing-A Scientific Vision for Sustainable Development, 3–8 August 1997, Singapore; IEEE: Singapore, 1997; Volume 4, pp. 1966–1968. [Google Scholar]
- Xiao, X.; Hollinger, D.; Aber, J.; Goltz, M.; Davidson, E.A.; Zhang, Q.; Moore, B. Satellite-based modeling of gross primary production in an evergreen needleleaf forest. Remote Sens. Environ. 2004, 89, 519–534. [Google Scholar] [CrossRef]
- García, M.J.L.; Caselles, V. Mapping burns and natural reforestation using Thematic Mapper data. Geocarto Int. 1991, 6, 31–37. [Google Scholar] [CrossRef]
- Verma, R.; Dutta, S. Vegetation dynamics from denoised NDVI using empirical mode decomposition. J. Indian Soc. Remote 2013, 41, 555–566. [Google Scholar] [CrossRef]
- Boschetti, L.; Roy, D.P.; Giglio, L.; Huang, H.; Zubkova, M.; Humber, M.L. Global validation of the collection 6 MODIS burned area product. Remote Sens. Environ. 2019, 235, 111490. [Google Scholar] [CrossRef] [PubMed]
- Huang, X.; Liang, T.; Zhang, X.; Guo, Z. Validation of MODIS snow cover products using Landsat and ground measurements during the 2001–2005 snow seasons over northern Xinjiang, China. Int. J. Remote Sens. 2011, 32, 133–152. [Google Scholar] [CrossRef]
- Kendall, M.G. A new measure of rank correlation. Biometrika 1938, 30, 81–93. [Google Scholar] [CrossRef]
- Kim, J.; Kang, S.; Seo, B.; Narantsetseg, A.; Han, Y. Estimating fractional green vegetation cover of Mongolian grasslands using digital camera images and MODIS satellite vegetation indices. GIScience Remote Sens. 2020, 57, 49–59. [Google Scholar] [CrossRef]
- Hett, C.; Castella, J.; Heinimann, A.; Messerli, P.; Pfund, J. A landscape mosaics approach for characterizing swidden systems from a REDD+ perspective. Appl. Geogr. 2012, 32, 608–618. [Google Scholar] [CrossRef]
- Das, P.; Mudi, S.; Behera, M.D.; Barik, S.K.; Mishra, D.R.; Roy, P.S. Automated mapping for long-term analysis of shifting cultivation in Northeast India. Remote Sens. 2021, 13, 1066. [Google Scholar] [CrossRef]
- Grogan, K.; Fensholt, R. Exploring patterns and effects of aerosol quantity flag anomalies in MODIS surface reflectance products in the tropics. Remote Sens. 2013, 5, 3495–3515. [Google Scholar] [CrossRef]
- Li, P.; Feng, Z. Extent and area of swidden in Montane Mainland Southeast Asia: Estimation by multi-step thresholds with Landsat-8 OLI data. Remote Sens. 2016, 8, 44. [Google Scholar] [CrossRef] [Green Version]
- Dove, M.R. Swidden Agriculture in Indonesia: The Subsistence Strategies of the Kalimantan Kant’; Walter de Gruyter: Berlin, Germany, 1985. [Google Scholar]
- Carmenta, R.; Vermeylen, S.; Parry, L.; Barlow, J. Shifting cultivation and fire policy: Insights from the Brazilian Amazon. Hum. Ecol. 2013, 41, 603–614. [Google Scholar] [CrossRef]
- Schmidt-Vogt, D.; Leisz, S.J.; Mertz, O.; Heinimann, A.; Thiha, T.; Messerli, P.; Epprecht, M.; Cu, P.V.; Chi, V.K.; Hardiono, M.; et al. An assessment of trends in the extent of swidden in Southeast Asia. Hum. Ecol. 2009, 37, 269–280. [Google Scholar] [CrossRef]
- Nath, A.J.; Reang, D.; Sileshi, G.W. The shifting cultivation juggernaut: An attribution problem. Glob. Chall. 2022, 6, 2200051. [Google Scholar] [CrossRef]
- Rodríguez-Robayo, K.J.; Méndez-López, M.E.; Molina-Villegas, A.; Juárez, L. What do we talk about when we talk about milpa? A conceptual approach to the significance, topics of research and impact of the mayan milpa system. J. Rural. Stud. 2020, 77, 47–54. [Google Scholar] [CrossRef]
- Das, D. The Politics of Swidden Farming: Environment and Development in Eastern India; Anthem Press: London, UK, 2018. [Google Scholar]
Figure 1.
Maps showing the provinces, topography and footprints of Landsat and MODIS scenes of northern Laos.
Figure 1.
Maps showing the provinces, topography and footprints of Landsat and MODIS scenes of northern Laos.

Figure 2.
The workflow for mapping swidden agriculture landscape (SAL) using time-series MODIS vegetation indices in northern Laos.
Figure 2.
The workflow for mapping swidden agriculture landscape (SAL) using time-series MODIS vegetation indices in northern Laos.

Figure 3.
Temporal variations in NDVI, EVI, LSWI, NBR, and NIR/SWIR bands based on the selected samples (pixels) during 2004–2010.
Figure 3.
Temporal variations in NDVI, EVI, LSWI, NBR, and NIR/SWIR bands based on the selected samples (pixels) during 2004–2010.

Figure 4.
Box plots of MODIS NDVI and EVI of newly opened swiddens in March–April and April–May during 2001–2020.
Figure 4.
Box plots of MODIS NDVI and EVI of newly opened swiddens in March–April and April–May during 2001–2020.

Figure 5.
Maps of swidden agriculture landscape (SAL) in northern Laos at an interval of five years.
Figure 5.
Maps of swidden agriculture landscape (SAL) in northern Laos at an interval of five years.

Figure 6.
Annual changes in swidden agriculture landscape (SAL) in northern Laos and among provincial units during 2001–2020. Note that (a) refers to annual changes in SAL in the entire study area, while (b–d) represent those in four provinces in northern Laos.
Figure 6.
Annual changes in swidden agriculture landscape (SAL) in northern Laos and among provincial units during 2001–2020. Note that (a) refers to annual changes in SAL in the entire study area, while (b–d) represent those in four provinces in northern Laos.

Figure 7.
Statistics of annual number of villages and districts with swidden agriculture landscape (SAL) in northern Laos during 2001–2020.
Figure 7.
Statistics of annual number of villages and districts with swidden agriculture landscape (SAL) in northern Laos during 2001–2020.

Figure 8.
Annual dynamics of swidden agriculture landscape (SAL) at the village level in northern Laos during 2001–2020.
Figure 8.
Annual dynamics of swidden agriculture landscape (SAL) at the village level in northern Laos during 2001–2020.


Table 1.
Threshold ranges of NDVI and EVI of swidden agriculture during the dry seasons of 2001–2020.
Table 1.
Threshold ranges of NDVI and EVI of swidden agriculture during the dry seasons of 2001–2020.
| 2001–2010 | 2011–2020 | 2001–2020 | ||||
|---|---|---|---|---|---|---|
| March–April | April–May | March–April | April–May | March–April | April–May | |
| EVI | 0.3668 | 0.3055 | 0.3718 | 0.2709 | 0.3676 | 0.2892 |
| NDVI | 0.4558 | 0.3629 | 0.4940 | 0.3307 | 0.4683 | 0.3469 |
Table 2.
Validation results of swidden agriculture landscape (SAL) via confusion matrix based on Landsat imagery.
Table 2.
Validation results of swidden agriculture landscape (SAL) via confusion matrix based on Landsat imagery.
| Landsat Path/Row and Classes | NDVI-Based Mapping of SAL | EVI-Based Mapping of SAL | |||||
|---|---|---|---|---|---|---|---|
| Swidden | Non-Swidden | Total | Swidden | Non-Swidden | Total | ||
| 130/046 (2013) | Swidden | 123 | 0 | 123 | 66 | 0 | 66 |
| Non-swidden | 90 | 223 | 313 | 147 | 223 | 370 | |
| Total | 213 | 223 | 436 | 213 | 223 | 436 | |
| Overall accuracy | 79.36% | 66.28% | |||||
| Kappa | 0.58 | 0.31 | |||||
| 128/047 (2013) | Swidden | 114 | 0 | 114 | 108 | 0 | 108 |
| Non-swidden | 70 | 188 | 258 | 76 | 188 | 264 | |
| Total | 184 | 188 | 372 | 184 | 188 | 372 | |
| Overall accuracy | 81.18% | 79.57% | |||||
| Kappa | 0.62 | 0.59 | |||||
| 129/045 (2013) | Swidden | 78 | 0 | 78 | 50 | 0 | 50 |
| Non-swidden | 48 | 108 | 156 | 76 | 108 | 184 | |
| Total | 126 | 108 | 234 | 126 | 108 | 234 | |
| Overall accuracy | 79.49% | 67.52% | |||||
| Kappa | 0.60 | 0.38 | |||||
| 129/046 (2003) | Swidden | 159 | 1 | 160 | 148 | 1 | 149 |
| Non-swidden | 104 | 249 | 353 | 115 | 249 | 364 | |
| Total | 263 | 250 | 513 | 263 | 250 | 513 | |
| Overall accuracy | 79.53% | 77.39% | |||||
| Kappa | 0.59 | 0.55 | |||||
| 129/046 (2008) | Swidden | 200 | 1 | 201 | 154 | 0 | 154 |
| Non-swidden | 133 | 320 | 453 | 179 | 321 | 500 | |
| Total | 333 | 321 | 654 | 333 | 321 | 654 | |
| Overall accuracy | 79.51% | 72.63% | |||||
| Kappa | 0.59 | 0.46 | |||||
| 129/046 (2012) | Swidden | 245 | 1 | 246 | 144 | 0 | 144 |
| Non-swidden | 185 | 423 | 608 | 286 | 424 | 710 | |
| Total | 430 | 424 | 854 | 430 | 424 | 854 | |
| Overall accuracy | 78.22% | 66.51% | |||||
| Kappa | 0.57 | 0.33 | |||||
| 129/046 (2016) | Swidden | 174 | 0 | 174 | 66 | 0 | 66 |
| Non-swidden | 124 | 299 | 423 | 232 | 299 | 531 | |
| Total | 298 | 299 | 597 | 298 | 299 | 597 | |
| Overall accuracy | 79.23% | 61.14% | |||||
| Kappa | 0.58 | 0.22 | |||||
| 129/046 (2020) | Swidden | 99 | 0 | 99 | 37 | 1 | 38 |
| Non-swidden | 69 | 153 | 222 | 131 | 152 | 283 | |
| Total | 168 | 153 | 321 | 168 | 153 | 321 | |
| Overall accuracy | 78.50% | 58.88% | |||||
| Kappa | 0.58 | 0.21 | |||||
Table 3.
Statistics of villages and districts which stop or restart swidden agriculture related to the arrangement of the national policy of eradicating shifting cultivation in Laos during 2001–2020.
Table 3.
Statistics of villages and districts which stop or restart swidden agriculture related to the arrangement of the national policy of eradicating shifting cultivation in Laos during 2001–2020.
| 2005 | 2010 | 2018–2020 | Swidden Agriculture Restart in 2011 | |||||
|---|---|---|---|---|---|---|---|---|
| Count | Percent/% | Count | Percent/% | Count | Percent/% | Count | Percent/% | |
| Villages | 1350 | 55.08 | 1174 | 47.90 | 1318 | 53.77 | 735 | 62.61 |
| Districts | 2 | 2.02 | 3 | 3.03 | 4 | 4.04 | 3 | 100.00 |
Table 4.
Statistics of districts and villages stopping swidden agriculture.
| 0 | 1–5 Years | 5–10 Years | 10–20 Years | |||||
|---|---|---|---|---|---|---|---|---|
| Count | Percent/% | Count | Percent/% | Count | Percent/% | Count | Percent/% | |
| Villages | 957 | 38.57 | 110 | 4.43 | 300 | 12.09 | 1084 | 43.69 |
| Districts | 91 | 91.92 | 3 | 3.03 | 5 | 5.05 | 0 | 100 |
Publisher’s Note: MDPI stays neutral with regard to jurisdictional claims in published maps and institutional affiliations. |
© 2022 by the authors. Licensee MDPI, Basel, Switzerland. This article is an open access article distributed under the terms and conditions of the Creative Commons Attribution (CC BY) license (https://creativecommons.org/licenses/by/4.0/).
Share and Cite
MDPI and ACS Style
Li, P.; Yang, Y. Swidden Agriculture Landscape Mapping Using MODIS Vegetation Index Time Series and Its Spatio-Temporal Dynamics in Northern Laos. Remote Sens. 2022, 14, 6173. https://doi.org/10.3390/rs14236173
AMA Style
Li P, Yang Y. Swidden Agriculture Landscape Mapping Using MODIS Vegetation Index Time Series and Its Spatio-Temporal Dynamics in Northern Laos. Remote Sensing. 2022; 14(23):6173. https://doi.org/10.3390/rs14236173
Chicago/Turabian StyleLi, Peng, and Yin Yang. 2022. "Swidden Agriculture Landscape Mapping Using MODIS Vegetation Index Time Series and Its Spatio-Temporal Dynamics in Northern Laos" Remote Sensing 14, no. 23: 6173. https://doi.org/10.3390/rs14236173
Note that from the first issue of 2016, this journal uses article numbers instead of page numbers. See further details here.