

Oriented Ship Detection Based on Intersecting Circle and Deformable RoI in Remote Sensing Images

1
School of Artificial Intelligence, Hebei University of Technology, Tianjin 300401, China
2
Hebei Data Driven Industrial Intelligent Engineering Research Center, Tianjin 300401, China
3
School of Statistics and Data Science, Nankai University, Tianjin 300071, China
*
Author to whom correspondence should be addressed.
Remote Sens. 2022, 14(19), 4749; https://doi.org/10.3390/rs14194749
Submission received: 25 August 2022
/
Revised: 16 September 2022
/
Accepted: 19 September 2022
/
Published: 22 September 2022
(This article belongs to the Special Issue Artificial Intelligence-Driven Methods for Remote Sensing Target and Object Detection)
Abstract
:Ship detection is an important topic in the task of understanding remote sensing images. One of the challenges for ship detection is the large length–width ratio of ships, which may weaken the feature extraction ability. Simultaneously, ships inclining in any direction is also a challenge for ship detection in remote sensing images. In this paper, a novel Oriented Ship detection method is proposed based on an intersecting Circle and Deformable region of interest (OSCD-Net), which aims at describing the characteristics of a large length–width ratio and arbitrary direction. OSCD-Net is composed of two modules: an intersecting circle rotated detection head (ICR-head) and a deformable region of interest (DRoI). The ICR-head detects a horizontal bounding box and an intersecting circle to obtain an oriented bounding box. DRoI performs three RoIAlign with different pooled sizes for each feature candidate region. In addition, the DRoI module uses transformation and deformation operations to pay attention to ship feature information and align feature shapes. OSCD-Net shows promising performance on public remote sensing image datasets.
1. Introduction
Remote sensing technology, as one of the core earth observation technologies, plays an important role in the progress of human science and technology. At present, remote sensing technology involves many fields, such as land and marine resource surveys, urban change and vegetation surveys, port detection and so on. Benefiting from the development of remote sensing technology, there are more and more remote sensing images of ship, which makes ship detection develop rapidly. However, because the direction of the ship is usually inclined in any direction and the length–width ratio of the ship is overlarge, this task is quite challenging.
Object detection has always been an important task in the field of remote sensing technology. In recent years, with the development of deep learning, many researchers [1,2,3,4,5,6] have made great contributions to object detection in remote sensing images. However, ships manifest some special characteristics (complex background, different sizes, inclination at any angle, obvious geometry, etc.) in remote sensing images compared with other objects, which makes detection more difficult. Therefore, according to the characteristics of ships, many meaningful methods have been proposed. The factors that make the background of ship images complex and diverse include ports, ocean, land, weather conditions and day and night conditions. Aiming at the complex background of ships in remote sensing images, many researchers use feature fusion [7,8,9], attention mechanism [10,11,12] and other methods [13,14,15] in popular object detection [16,17,18,19,20] methods to enhance the features of ships and make the detection effect better. The types of ships or the height of aerial photos make the sizes of ships different in remote sensing images, and the unique geometry of ships will also increase the difficulty of the task. Therefore, many researchers have conducted significant research on the size of ships. For example, Xie et al. [21] and Kan et al. [22] conducted a profound study on small ship detection; Zhu et al. [23] and Sun et al. [24] used the anchor-free method to alleviate the problems caused by ship scale; Chen et al. [25] used a multiscale adaptive recalibration network to detect multiscale and arbitrarily oriented ships. Affected by the shooting angle or geographic environment, many ships tilt at any angle, and using the horizontal box will lead to too much redundant information. More seriously, if the targets are densely arranged, the intersection over union (IoU) of adjacent targets may be too large, which may lead to missed detection (Figure 1a). Therefore, the oriented bounding box is more suitable for rotated object detection (Figure 1b). In order to solve the problem of object rotation, researchers have performed a lot of meaningful research on the problem of rotated object detection [26,27,28,29,30]. How to represent orientation information is a difficulty in rotated object detection. In view of this difficulty, many researchers have made many contributions. For example, some researchers obtained object rotation information by detecting the rotation angle of an object relative to the horizontal axis of the image [23,27,31]; Xu et al. [32] use eight-parameter representation to obtain rotation information of the object; Liu et al. [33] use trilateral representation to detect rotating rectangles; Xue et al. [34,35] also regard angle information as classification information. Therefore, ship detection is suitable for rotated object detection. Many researchers have performed some interesting research in the field of rotated ship detection. For example, Shao et al. [36] proposed a rotated balanced feature-aligned network; Cui et al. and Yu et al. [37,38] used the anchor-free method to detect rotated ships; Zhu et al. [39] proposed a rotated RetinaNet with considerable accuracy.
However, the ship in the remote sensing image also has obvious geometry, and the object rotation is still a problem worthy of discussion. For the method [37,40] of using rotation angle to detect directional ships, there is a boundary discontinuity problem [34], and the characteristics may be the same for some specific angles, which makes the learning unstable. The eight-parameter method [32,41] has the problem of too many parameters. In addition, in order to alleviate the resistance in water, the ship design is mostly a slender shape, which makes the length–width ratio overlarge, resulting in difficult feature extraction.
In this paper, we propose the OSCD-Net to solve the problems of ship inclination in any direction and an overlarge length–width ratio. OSCD-Net contains two modules: intersecting circle rotated detection head (ICR-head) and deformable region of interest (DRoI). In ICR-head, we intersect an oriented bounding box by detecting a horizontal rectangle, a circle and incline direction prediction. In addition, ICR-head also uses the form of double-heads [42] to reduce the coupling between classification and regression tasks. At the same time, we are inspired by the RoI poolings of different pooled sizes method of R2CNN [26] in the field of text detection. This method can effectively solve the problem of a too large length–width ratio of text by turning the feature pool into different proportions of region of interest poolings. This method may also be applicable to ship detection. However, the ship length–width ratio is far less than that of words. Therefore, according to the characteristics of ships, we designed a DRoI module. DRoI performs three RoIAlign [43] with different pooled sizes for each feature candidate region, and a self offset matrix is used to enhance the feature information of ship. Then, the deformation operation is carried out to obtain three features of the same size and concatenate them.
In summary, our main contributions are as follows:
- We develop an intersecting circle rotated detection head for detecting rotated ships in remote sensing images. This detection head is also suitable for detecting other rotated targets.
- We designed a DRoI module, which can obtain features of different pooled sizes. DRoI is used to solve the problem that the ship length–width ratio is overlarge.
- A new end-to-end algorithm framework for oriented ship detection in remote sensing images.
2. Methods
This section describes OSCD-Net for ship detection, which contains the overall architecture of OSCD-Net, ICR-Head, deformable RoI module, multitask loss, and inference stage.
2.1. Overall Architecture of OSCD-Net
The OSCD-Net’s main framework is depicted in Figure 2. As the baseline of our network, we use the two-stage detector Faster R-CNN [17]. The reason why the two-stage network is selected is that the two-stage network’s module is disassembled more carefully, and the space for change is large according to the characteristics of the object compared with other methods. OSCD-Net recodes the rotated ship labels and then extracts the feature map. We use the better performing ResNet-101 [44] as the backbone network. The residual structure of ResNet can solve the problem of gradient disappearance or gradient explosion caused by network deepening. For feature enhancement and adaptation to multi-scale ships, FPN [45] is also used in our network. The feature maps can be obtained by ResNet and FPN. The feature map is then forwarded to the region proposal network (RPN) network to acquire the RoI. The DRoI module then pools the feature map and RoI into three deformable features and uses transformation and deformation operations to transform and deform the features before fusing them. Finally, ICR-head is used for classification and regression and obtains a rotated rectangle by detecting a circle, a horizontal rectangle and incline direction prediction.
2.2. ICR-Head
ICR-head is a rotated detection head, which obtains a rotated rectangle by detecting a circle, a horizontal rectangle, and incline direction prediction. In addition, in order to alleviate the coupling between classification and location, we use double-head structures in ICR-head. Classification and incline direction prediction is performed utilizing fc-head. Conv-head is used to perform regression tasks. Here, we mainly describe three parts: obtaining a rotated rectangle through a horizontal rectangle and an intersecting circle (RHC), the encoding and decoding of a rotated rectangle and the use of double-heads in ICR-head.
2.2.1. Obtaining a Rotated Rectangle
If the rotated box label of a regular inclined object (rectangle-like) is known, the horizontal box label, which is the circumscribed horizontal rectangle of the spinning box, may be simply acquired and is unique. If we know a regular rectangle, on the other hand, we try to find its inscribed rectangle (a rectangle whose four vertices are on its edges). As long as we use the rectangle’s center point as the the center of a circle, we can draw a circle intersecting the rectangle’s four edges, link these intersections and obtain the normal rectangle’s inscribed rectangle. Because the diameter of a circle to any point on the circumference is a right triangle. However, the circle intersects with the regular rectangle, and the inscribed rectangle is not one, but four (Figure 3a). If a circle is drawn from the top edge of a regular rectangle to its first intersection, only two rectangles are produced (Figure 3b). Therefore, when using a binary classification, we can determine a unique inclined rectangle, which is the target box we want. The final representation parameters are , where is the center point of the horizontal rectangle and also the center of a circle. w and h are the width and length of the horizontal rectangle, respectively. R is the distance from the vertex of the upper corner of the rectangle to the intersection of the circle and the uppermost edge of the rectangle, which can determine the only circle. S is the inclined direction prediction of the inclined rectangle, which can determine the only rotated box.
2.2.2. Encode and Decode
At present, the annotation form of most labels for rotated object detection are or , no matter which annotation is used, they can be converted to each other. Where is the angle of the ship relative to the horizontal axis of the image, and () is vertex coordinates. Here, we recode to obtain :
Decode is what we know to solve , where , let and X is unknown, as shown in Figure 3b.
According to , , with formula:
Formula (4) can be converted into a binary quadratic equation:
The solution is:
Obviously, and . Therefore, we use as the boundary to define S. When the predicted value of S is 1, . When the predicted value of S is 0,
Finally, the coordinates of the horizontal rectangle ABCD can be obtained according to :
and the coordinates of the rotated rectangle EFGH can be obtained according to ABCD and as follows:
The meaning of each parameter is shown in Figure 4:
2.2.3. Double-Heads
Full connection is sensitive to spatial location and is more suitable for classification tasks, while convolution has a better effect on object information extraction and is suitable for regression tasks [42]. Because there are both classification parameters and regression parameters in our rotated box coding method, in order to reduce the coupling between the classification and regression tasks, we use two branches to detect classification and regression respectively. The fc-head is used for the confidence and inclination direction S of the ship. We use conv-head to predict horizontal rectangles and R. In Figure 5, we show the specific process of ICR-head. The fc-head structure uses two full connection layers connected in series. The conv-head structure uses conv to convert the feature map to and finally avgpool it to . The features extracted by classification and regression are different. Using two branches is beneficial for different detection heads to pay more attention to their own tasks.
2.3. Deformable RoI
In the traditional two-stage object detection algorithm, the region proposal output through the RPN network is mapped into the feature map, and RoI will be pooled into feature areas using RoI pooling or RoIAlign. However, because the length–width ratio of ships is usually too large, the features of ships cannot be evenly obtained by pooling them into feature areas. Therefore, we use RoIAlign to divide the region of interest in the feature map into feature regions with three different dimensions: and (Figure 6). The reason for this is that the 3:1 ratio can adapt to most ships, so that their features can be extracted evenly. Secondly, the grid divides the feature into 49 parts, and the grid divides the feature map into 48 parts. We fill a zero pixel behind it to obtain 49 parts, so as to deform it into a grid and fuse the three feature maps. In the process of fusion, we use transformation and deformation operations. Transformation uses a self-learning offset matrix to pay attention to the useful information in the feature map. The specific steps are shown in Figure 7a. Deformation is to squeeze or into one dimension, followed by a pixel, then expand it into two-dimensional features (see Figure 7b). The expression of the transformation and deformation operation is as follows:
where is self-learning attention matrix, and is the weight ratio of this matrix. i is the index, and . represents the features of different shapes after pooling. The multiplication of these three parameters indicates the transformation operation. is the supplementary 0 pixel point. is a deformation operation designed to rearrange the features of each small part to form a size. ∑ means concatenate the three features.
2.4. Multitask Loss
OSCD-Net is a two-stage network. The first stage is RPN, which is used to extract candidate regions. The loss here is the same as in [17]:
Here, and are the number of total proposals and positive proposals in a mini-batch fed into the head. i is the index of an anchor and p is the predicted probability. is the ground-truth label, the positive sample is 1 and the negative sample is 0. In the second stage, there is the loss of classification and orientation parameters , of which the fc-head loss is:
where is a classification loss used to judge the confidence of the ships, and is used to identify unique box. s is the predicted value, and is the ground-truth label. The conv-head loss is:
in which
where is the loss for horizontal box regression, is the normalization of the ground-truth of the horizontal box regression and is the predicted value. is the ground-truth of the intersection circle, and r is the predicted value. is a super parameter used to balance the total loss.
The total loss is:
In the experiment, the values of , , and were 1, 2, and 1.
2.5. Inference
In the inference stage, we first use horizontal NMS to eliminate some candidate boxes, and then use directional NMS to further screen the candidate boxes. In the process of inference, we find that there is no solution for ships placed horizontally. Through analysis, the reason is that , which leads to the non-intersection of the predicted circle and the regular rectangle on the vertical edge, as shown in Figure 8a. The blue box is the ground-truth label. At this time, the circumscribed circle of the ground-truth is just tangent to the horizontal rectangle. When the predicted R is slightly larger, the circle and the horizontal rectangle cannot intersect (see the red circle of Figure 8a), resulting in no solution. For this case, we treat as equal to 0. At this time, . What is drawn here is a parallelogram, as shown in Figure 8b. When calculating the IoU, find its minimum circumscribed rectangle. The entire process of the OSCD-Net is briefly summarized in Algorithm 1.
| Algorithm 1 The pseudocode for OSCD-Net. |
|
3. Experiment
In this section, we first introduce the experimental datasets, evaluation metrics and implementation details in detail. Then, we conducted an ablation study to analyze our ICR-head and DRoI mouble. Finally, we compare other recent methods with several examples.
3.1. Datasets
- (1)
- HRSC2016 [46]: HRSC2016 is a public dataset of remotely sensed ships, including 1070 pictures and 2976 examples. The pictures are collected from Google Earth. There are 2886 ships standing under the port with complex background, including warships, aircraft carriers, cargo ships, fishing boats, etc. The image resolution ranges from 2 m to 0.4 m, and the image size ranges from to , most of which are larger than . In the experiment, we use the HRSC official division of the trainset and the testset. A total of 646 pictures are used for training, and 444 pictures are used for testing.
- (2)
- DOTA-Ship: DOTA [47] is a large-scale dataset with 15 object categories for object detection in remote sensing images. It uses four vertex coordinates for annotation and contains 2806 aerial images from different sensors and platforms. The size of the images ranges from around 800 × 800 to 4000 × 4000 pixels. For DOTA-Ship, we manually extract all ship images on the DOTA trainset and verset, with a total of 434 images, including 39028 instances. We randomly divided the trainset and testset according to the ratio of 6:4. During the training, we cut the picture to 1000 × 1000 pixels.
- (3)
- SSDD+ [14]: SSDD is the first dataset published at home and abroad for ship object detection in SAR images. There are a total of 12 images and 2456 images for each ship. In order to detect ship targets with rotating frame, the label of SSDD is improved, and the rotation angle information is added on the basis of category and position. This data set is called SSDD+. In order to verify the robustness of our algorithm, we also use SAR images to evaluate the algorithm, using SSDD+ with rotation annotation. We randomly divided the trainset and testset according to the ratio of 7:3.
3.2. Evaluation Metrics
For the detection accuracy of ship inspection, we use the average accuracy (mAP) as the evaluation standard, which is consistent with Pascal VOC 2007 (AP(07)) [48] and VOC 2012(AP(12)). AP is the average value of precision based on different recall rates. The form of Precision and Recall is as follows:
Here, TP, FP and FN represent the number of correct numbers, false positives and false negatives, respectively. TP means that the intersection over union (IoU) between the predicted bounding box and the object is higher than 0.5. AP and is defined as:
where p represents precision, r represents recall and p is a function that takes r as a parameter, which is equal to taking the area under the curve. AP(07) is used to select the precision maximum value of 11 points with recall greater than 0–1 and then take the average. Compared with AP(07), the recall of AP(12) is no longer 11 points, but all recall values. In order to highlight the gains achieved by our method over the current existing similar techniques, we added the Precision (P), Recall (R) and F1-Score (F1) evaluation metrics. F1 is the harmonic mean of the Precision and Recall, which is defined as:
3.3. Training Details
In order to verify the effectiveness of our innovation, we used ResNet-101 and FPN in the feature extraction, which can be consistent with other methods. We use ResNet-101 pretrained on ImageNet as the feature extractor. Our network is based on the pytoch framework and trained on two NVIDIA Geforce GTX 2080 Ti GPUs. We use the SGD optimizer [49] to optimize our network. The momentum and weight attenuation are set to 0.9 and , respectively. The initial learning rate is , and the learning rate is reduced once every 10 iterations. For the HRSC2016 and DOTA-Ship datasets, our training model is 20 K steps, and the learning rate decays in {14 K, 18 K}. For the SSDD+ dataset, our training model is 12K steps, and the learning rate decays in {8 K, 10 K}.
3.4. Ablation Study
In order to verify the effectiveness of our method as a directional object regression method, we designed the same Faster R-CNN + FPN as baseline, using five parameters (Figure 9a), eight parameters (Figure 9b) and our representation (Figure 9c) as the output parameters of the model to detect rotating ships. Table 1 shows the number of prediction parameters of three different rotated object detection methods and their effects on HRSC2016 dataset. RHC is our representative method, which is to obtain a rotated rectangle through a horizontal rectangle and an intersecting circle. In Faster R-CNN + five parameters (FP), we obtained an AP(07) of 80.9%. Here, the five parameters are . is the center of the rotating ship, and w and h are the width and length of the ship, respectively. is the included angle between the rectangle and the positive half-axis of the X-axis. The range of is . For eight parameters (EP), the representation is . are the parameters of the horizontal boxm and are the offset of the orientation box from the horizontal box. For specific operations, please refer to [32]. The mAP of Faster R-CNN + EP is 88.2%. Compared with Faster R-CNN + FP, the mAP of Faster R-CNN + EP is improved by 7.3%, so it is usually better to use boundary information than angle information to detect directional objects. However, its parameters have also increased. Faster R-CNN + RHC is our representation. We use five regression variables and one classification variable (S) to obtain a orientation box. Compared with method of five parameters, we did not increase the number of regression parameters but only added a classification variable. However, we greatly increase the accuracy, with a 7.7% improvement for mAP. Meanwhile, compared with the Faster R-CNN + EP, we reduce the number of regression parameters from eight to five, and mAP is also increased slightly. Moreover, the accuracy of S is more than 98.9%. Therefore, the increase in S will hardly affect our accuracy. This experiment proves that our method has a good improvement in precision compared with the FP method. At the same time, compared with the EP method, we predict fewer parameters, and the accuracy of our method has also been slightly improved. It is worth noting that we have added a classification parameter, but it is easier to perform the classification task than the regression task.
Simultaneously, we also designed the ablation study of each module, which is based on Faster R-CNN + RHC, as shown in Table 2. ICR-head uses the form of double-heads on the basis of Faster-RCNN + RHC. From the experimental results, double-heads improves the AP(12) of our method by 2.89%, which indicates that branch decoupling is more suitable for our detection head. The addition of the DRoI module also further improves the AP. It can be seen from the experiment that both the ICR-head and DRoI modules play a role in the network model, and mAP reaches the highest value when they are used at the same time. In addition, we comparatively show some of the effective detection results in Figure 10. It can be seen from this experiment that Faster-RCNN OBB’s angle prediction is not very accurate, leading to the offset of some detection boxes. There are also some small ships missing detection. When we use ICR-head, the inclination angle of the ship is more accurate, and some small ships can be detected. As can be seen from the last column, the boundary of the ship is proposed more accurately after the DRoI module is added. For some slender ships, the IoU of the ground truth and detection results is improved. In this ablation experiment, we found that ICR-head can more accurately capture the position information of the ship, so as to improve the AP. The DRoI module can further refine the boundary information, and is more accurate for ship detection with a large aspect ratio.
3.5. Comparison with Others
In this part, we use AP(07) and AP(12) to compare our method on three datasets, and partial detection results of each dataset. In addition, we also draw the precision–recall curves of the partial comparison method.
1. Experiments on HRSC2016: To further prove the effectiveness of the proposed OSCD-Net, we compared it with other deep learning ship detection methods popular in recent years: Faster R-CNN oriented bounding box (OBB), RetinaNet OBB, R2CNN [26], RRPN [31], RoI transformer [27], Gliding vertex [32], CSL [34] and RITSD [50], as shown in Table 3. Among them, except R2CNN, all use data enhancement. The main data enhancement methods are horizontal flip and vertical flip, random rotation, random clipping, deformation and scaling. It is worth noting that all detectors adopt ResNet-101 pretrained on the ImageNet, except for RRPN adopting VGG-16 [51]. In addition, except for R2CNN and RRPN, FPN structure is used for others. It can be seen from the experiment that the mAP of adding OBB directly on Faster-RCNN and RetinaNet is low. The structures of R2CNN and RRPN are so simple that the mAP is not high. RoI transform proposes a rotated RoI, which makes the AP(07) reach 86.22% and the AP(12) reach 87.18%. Gliding vertex uses the offset of the vertex instead of the angle on the basis of Faster R-CNN, and the AP(07) reaches 88.20%. CSL uses angle classification instead of traditional , and AP(07) reaches 89.62%. RITSD adds the third stage of rotation on the basis of the traditional second stage, and the AP(07) reaches 89.70% and the AP(12) reaches 92.98%. Our OSCD-Net reaches 89.98% in AP(07) and 93.52% in AP(12). Experiments indicate that, compared with the recently proposed deep learning object detection methods, OSCD-Net has an advanced performance. Except for taking AP as the evaluation metric, we also added the comparison method with Precision, Recall and F1. As shown in Table 4, compared with other methods, OSCD-Net has obvious advantages in Precision and Recall. In Figure 11, we show the results of some comparison methods. Among them, the yellow box is the detection box, and the blue box and the red box are some ships that we manually marked as inaccurate detection and missing detection, respectively. Faster R-CNN OBB and the RoI transformer use FP representation to detect rotating rectangles, and it can be found that there are many ships with inaccurate detection in these two methods. In the third panel of Figure 11, the RoI transformer and Gliding vertex are missed when the two ships are close to each other. In addition, we also show the precision–recall curves of Faster R-CNN OBB, Retinanet OBB, RoI transformer and Gliding vertex, as shown in Figure 12.
2. Experiments on DOTA-Ship: Compared with the HRSC2016 dataset, the ships in DOTA-Ship are smaller and more dense, which makes the detection task more challenging. We randomly divided the DOTA-Ship dataset into a 6:4 trainset and testset. Table 5 shows the comparison and ablation experiments of our method on DOTA-Ship. Here, we compare our method with Faster R-CNN OBB, R2CNN, RRPN, RoI transform and Gliding vertex. These methods all use data enhancement and FPN structure, except R2CNN, and the backbone network is ResNet-101. OSCD-Net adds ICR-head to the baseline and OSCD-Net adds ICR-head and DRoI module. The results indicate that the mAP of our method is also significantly improved compared with other popular ship detection methods. Compared with baseline (Faster R-CNN OBB), our method is improved by 9.46% in the DOTA-Ship dataset. In Table 6, we conducted a comparative experiment on the DOTA-Ship dataset with Precision, Recall and F1 as evaluation standards. Our method has obvious advantages in Recall and higher Precision than other methods. In Figure 13, we show the comparison of detection results of some methods on DOTA-ship dataset. We can find that the detection boxes of Faster R-CNN OBB have a significant offset in the first two figures, which will lead to the reduction in the IoU. However, using edges to detect rotating ships does not have such a problem. Both the RoI transformer and Gliding vertex have a serious problem of missing detection. OSCD-Net can also miss for partial small and dense ships, but this is less of a problem than other methods. We also show the precision–recall curves on the DOTA-Ship dataset in Figure 14.
3. Experiments on SSDD+: Because the SSDD+ is an SAR image dataset and the SAR image has the characteristics of inconsistent azimuth and range resolution, prominent target geometric characteristics, strong noise, low definition and large image difference when the pitch angle and azimuth angle change, the SSDD+ dataset tests the robustness of the model. We adopt the data enhancement strategy of image flipping. We randomly divided the SSDD+ dataset into a 7:3 train set and test set. The comparison methods and experimental parameters here are the same as in the DOTA-Ship dataset. As shown in Table 7, compared with other popular ship detection methods, the mAP of our method is also significantly improved. OSCD-Net adds ICR-head to baseline and OSCD-Net adds ICR-head and the DRoI module. In Table 8, the recall of OSCD-Net is higher than other methods, and the precision is also higher than other methods except Gliding vertex. In the precision–recall curves on the SSDD+ dataset (Figure 15), the precision of our method is worse than other methods when the recall is low. However, with the improvement in the recall, the precision of our method gradually exceeds that of other methods. Our method is also better than the other methods in terms of the F1, which is the standard to measure the combination of precision and recall. In the resulting images of the comparison (Figure 16), Faster R-CNN OBB and the RoI transformer detect multiple ships as one because many ships are close to each other in the first image. This is due to feature extraction errors. Although the Gliding vertex is able to extract features correctly, there is a missing detection. In the second picture, the missed detection of Faster R-CNN OBB is serious, and the detection of RoI transformer and Gliding vertex targets is not accurate enough (marked with blue box). The OSCD-Net detection results are obviously close to the real marking of ships and less redundant information.
It can be seen from the comparative experiment that the accuracy of our model has been improved on the three datasets. In addition, we show the partial testset results of the three datasets in Figure 17. It can be seen from the renderings of the testset that in HRSC2016 and SSDD+, the detection results of our network are relatively good, and most pictures can be detected correctly. However, for dense and small ships in the DOTA-Ship dataset, our network has missed detections. This may be because our network is not very suitable for small and dense ships. We will try our best to overcome this problem in the follow-up work.
4. Conclusions
Because deep learning is able to automatically learn the essential features of a large amount of data, it has achieved good results in the field of computer vision and image processing. The same is true for ship detection in the field of remote sensing. In this paper, a novel oriented ship detection method is proposed based on a intersecting circle and a deformable RoI. Ships in remote sensing images have the problems of inclination in any direction and large length–width ratios. To address these problems, ICR-head and a DRoI module were designed by us. ICR-head is a rotated detection head, which can obtain the rotation information of the ship. DRoI pools candidate features into multiple shapes and recombines features through transformation and deformation operations, so as to solve the problem of the large length–width ratio of ships.
Our method focuses on solving the ship’s arbitrary tilt and excessive length–width ratio. We are also solving the problem from a geometric point of view. In the future, we will try to solve the two challenges of arbitrary ship tilt and excessive length–width ratio at the feature point of view. Of course, these are not the only challenges of ship detection. The complexity of the background and the size of the ship are also important challenges in ship inspection. This is also one of the main tasks of our future work. With the continuous development of remote sensing technology, whether in optical remote sensing image or SAR remote sensing image, there are a lot of data available for us to use. There is a certain similarity as long as it is the same species. We believe that remote sensing image ship detection has a good prospect in the future.
Author Contributions
All authors have made significant contributions to this work. J.Z. and R.H. proposed the method and wrote the paper; R.H. and B.P. provided suggestions and designed the experiments; Y.L. and B.P. revised the paper. All authors have read and agreed to the published version of the manuscript.
Funding
This work was supported in part by the National Natural Science Foundation of China under the Grant 62001252; the Beijing-Tianjin-Hebei Basic Research Cooperation Project under the Grant F2021203109; the Natural Science Foundation of Hebei Province of China under the Grant F2020202008; and the Scientific and Technological Research Project of Hebei Province Universities and Colleges under the Grant ZD2021311.
Data Availability Statement
No new data were created or analyzed in this study.
Acknowledgments
The author thanks the anonymous reviewers for their valuable comments and the editors for their support of the work.
Conflicts of Interest
The authors declare no conflict of interest.
References
- Zou, Z.; Shi, Z. Random Access Memories: A New Paradigm for Target Detection in High Resolution Aerial Remote Sensing Images. IEEE Trans. Image Process. 2018, 27, 1100–1111. [Google Scholar] [CrossRef] [PubMed]
- Wang, C.; Bai, X.; Wang, S.; Zhou, J.; Ren, P. Multiscale visual attention networks for object detection in VHR remote sensing images. IEEE Geosci. Remote Sens. Lett. 2018, 16, 310–314. [Google Scholar] [CrossRef]
- Liu, E.; Zheng, Y.; Pan, B.; Xu, X.; Shi, Z. DCL-Net: Augmenting the Capability of Classification and Localization for Remote Sensing Object Detection. IEEE Trans. Geosci. Remote Sens. 2021, 59, 7933–7944. [Google Scholar] [CrossRef]
- Yu, Y.; Wang, J.; Qiang, H.; Jiang, M.; Tang, E.; Yu, C.; Zhang, Y.; Li, J. Sparse anchoring guided high-resolution capsule network for geospatial object detection from remote sensing imagery. Int. J. Appl. Earth Obs. Geoinf. 2021, 104, 102548. [Google Scholar] [CrossRef]
- Yuan, H.; Huang, K.; Ren, C.; Xiong, Y.; Duan, J.; Yang, Z. Pomelo Tree Detection Method Based on Attention Mechanism and Cross-Layer Feature Fusion. Remote Sens. 2022, 14, 3902. [Google Scholar] [CrossRef]
- Dong, X.; Qin, Y.; Gao, Y.; Fu, R.; Liu, S.; Ye, Y. Attention-Based Multi-Level Feature Fusion for Object Detection in Remote Sensing Images. Remote Sens. 2022, 14, 3735. [Google Scholar] [CrossRef]
- Li, Q.; Mou, L.; Liu, Q.; Wang, Y.; Zhu, X.X. HSF-Net: Multiscale Deep Feature Embedding for Ship Detection in Optical Remote Sensing Imagery. IEEE Trans. Geosci. Remote Sens. 2018, 56, 7147–7161. [Google Scholar] [CrossRef]
- Zhou, Q.; Song, F.; Chen, Z.; Zhang, R.; Jiang, P.; Lei, T. Harbor Ship Detection Based on Channel Weighting and Spatial Information Fusion. J. Phys. Conf. Ser. 2021, 1738, 012057. [Google Scholar] [CrossRef]
- Li, X.; Li, D.; Liu, H.; Wan, J.; Chen, Z.; Liu, Q. A-BFPN: An Attention-Guided Balanced Feature Pyramid Network for SAR Ship Detection. Remote Sens. 2022, 14, 3829. [Google Scholar] [CrossRef]
- Zhao, Y.; Zhao, L.; Xiong, B.; Kuang, G. Attention Receptive Pyramid Network for Ship Detection in SAR Images. IEEE J. Sel. Top. Appl. Earth Obs. Remote Sens. 2020, 13, 2738–2756. [Google Scholar] [CrossRef]
- Nie, X.; Duan, M.; Ding, H.; Hu, B.; Wong, E.K. Attention Mask R-CNN for Ship Detection and Segmentation from Remote Sensing Images. IEEE Access 2020, 8, 9325–9334. [Google Scholar] [CrossRef]
- Hu, J.; Zhi, X.; Shi, T.; Zhang, W.; Cui, Y.; Zhao, S. PAG-YOLO: A Portable Attention-Guided YOLO Network for Small Ship Detection. Remote Sens. 2021, 13, 3059. [Google Scholar] [CrossRef]
- Yao, Y.; Jiang, Z.; Zhang, H.; Zhao, D.; Cai, B. Ship detection in optical remote sensing images based on deep convolutional neural networks. J. Appl. Remote Sens. 2017, 11, 042611. [Google Scholar] [CrossRef]
- Li, J.; Qu, C.; Shao, J. Ship detection in SAR images based on an improved faster R-CNN. In Proceedings of the 2017 SAR in Big Data Era: Models, Methods and Applications (BIGSARDATA), Beijing, China, 13–14 November 2017; pp. 1–6. [Google Scholar] [CrossRef]
- Tang, G.; Zhuge, Y.; Claramunt, C.; Men, S. N-YOLO: A SAR Ship Detection Using Noise-Classifying and Complete-Target Extraction. Remote Sens. 2021, 13, 871. [Google Scholar] [CrossRef]
- Girshick, R. Fast R-CNN. In Proceedings of the IEEE International Conference on Computer Vision (ICCV), Santiago, Chile, 7–13 December 2015; pp. 1440–1448. [Google Scholar]
- Ren, S.; He, K.; Girshick, R.; Sun, J. Faster R-CNN: Towards Real-Time Object Detection with Region Proposal Networks. In Proceedings of the Advances in Neural Information Processing Systems; Cortes, C., Lawrence, N., Lee, D., Sugiyama, M., Garnett, R., Eds.; Curran Associates, Inc.: New York, NY, USA, 2015; Volume 28. [Google Scholar]
- Redmon, J.; Divvala, S.; Girshick, R.; Farhadi, A. You Only Look Once: Unified, Real-Time Object Detection. In Proceedings of the 2016 IEEE Conference on Computer Vision and Pattern Recognition (CVPR), Las Vegas, NV, USA, 27–30 June 2016; pp. 779–788. [Google Scholar] [CrossRef]
- Liu, W.; Anguelov, D.; Erhan, D.; Szegedy, C.; Reed, S.; Fu, C.Y.; Berg, A.C. SSD: Single Shot MultiBox Detector. In Proceedings of the Computer Vision—ECCV 2016; Leibe, B., Matas, J., Sebe, N., Welling, M., Eds.; Springer International Publishing: Cham, Switzerland, 2016; pp. 21–37. [Google Scholar]
- Lin, T.Y.; Goyal, P.; Girshick, R.; He, K.; Dollar, P. Focal Loss for Dense Object Detection. In Proceedings of the IEEE International Conference on Computer Vision (ICCV), Venice, Italy, 22–29 October 2017. [Google Scholar]
- Xie, X.; Li, L.; An, Z.; Lu, G.; Zhou, Z. Small Ship Detection Based on Hybrid Anchor Structure and Feature Super-Resolution. Remote Sens. 2022, 14, 3530. [Google Scholar] [CrossRef]
- Jin, K.; Chen, Y.; Xu, B.; Yin, J.; Wang, X.; Yang, J. A Patch-to-Pixel Convolutional Neural Network for Small Ship Detection With PolSAR Images. IEEE Trans. Geosci. Remote Sens. 2020, 58, 6623–6638. [Google Scholar] [CrossRef]
- Zhu, M.; Hu, G.; Zhou, H.; Wang, S.; Feng, Z.; Yue, S. A Ship Detection Method via Redesigned FCOS in Large-Scale SAR Images. Remote Sens. 2022, 14, 1153. [Google Scholar] [CrossRef]
- Sun, Z.; Dai, M.; Leng, X.; Lei, Y.; Xiong, B.; Ji, K.; Kuang, G. An Anchor-Free Detection Method for Ship Targets in High-Resolution SAR Images. IEEE J. Sel. Top. Appl. Earth Obs. Remote Sens. 2021, 14, 7799–7816. [Google Scholar] [CrossRef]
- Chen, C.; He, C.; Hu, C.; Pei, H.; Jiao, L. MSARN: A Deep Neural Network Based on an Adaptive Recalibration Mechanism for Multiscale and Arbitrary-Oriented SAR Ship Detection. IEEE Access 2019, 7, 159262–159283. [Google Scholar] [CrossRef]
- Jiang, Y.; Zhu, X.; Wang, X.; Yang, S.; Li, W.; Wang, H.; Fu, P.; Luo, Z. R2CNN: Rotational region CNN for orientation robust scene text detection. arXiv 2017, arXiv:1706.09579. [Google Scholar]
- Ding, J.; Xue, N.; Long, Y.; Xia, G.S.; Lu, Q. Learning RoI Transformer for Oriented Object Detection in Aerial Images. In Proceedings of the 2019 IEEE/CVF Conference on Computer Vision and Pattern Recognition (CVPR), Long Beach, CA, USA, 16–17 June 2019; pp. 2844–2853. [Google Scholar] [CrossRef]
- Han, J.; Ding, J.; Xue, N.; Xia, G.S. ReDet: A Rotation-equivariant Detector for Aerial Object Detection. In Proceedings of the 2021 IEEE/CVF Conference on Computer Vision and Pattern Recognition (CVPR), Long Beach, CA, USA, 16–17 June 2021; pp. 2785–2794. [Google Scholar] [CrossRef]
- Yang, X.; Yang, X.; Yang, J.; Ming, Q.; Wang, W.; Tian, Q.; Yan, J. Learning High-Precision Bounding Box for Rotated Object Detection via Kullback-Leibler Divergence. In Proceedings of the Advances in Neural Information Processing Systems; Ranzato, M., Beygelzimer, A., Dauphin, Y., Liang, P., Vaughan, J.W., Eds.; Curran Associates, Inc.: New York, NY, USA, 2021; Volume 34, pp. 18381–18394. [Google Scholar]
- Li, L.; Zhou, Z.; Wang, B.; Miao, L.; Zong, H. A Novel CNN-Based Method for Accurate Ship Detection in HR Optical Remote Sensing Images via Rotated Bounding Box. IEEE Trans. Geosci. Remote Sens. 2021, 59, 686–699. [Google Scholar] [CrossRef]
- Ma, J.; Shao, W.; Ye, H.; Wang, L.; Wang, H.; Zheng, Y.; Xue, X. Arbitrary-Oriented Scene Text Detection via Rotation Proposals. IEEE Trans. Multimed. 2018, 20, 3111–3122. [Google Scholar] [CrossRef]
- Xu, Y.; Fu, M.; Wang, Q.; Wang, Y.; Chen, K.; Xia, G.S.; Bai, X. Gliding Vertex on the Horizontal Bounding Box for Multi-Oriented Object Detection. IEEE Trans. Pattern Anal. Mach. Intell. 2021, 43, 1452–1459. [Google Scholar] [CrossRef] [PubMed]
- Liu, Q.; Xiang, X.; Yang, Z.; Hu, Y.; Hong, Y. Arbitrary Direction Ship Detection in Remote-Sensing Images Based on Multitask Learning and Multiregion Feature Fusion. IEEE Trans. Geosci. Remote Sens. 2021, 59, 1553–1564. [Google Scholar] [CrossRef]
- Yang, X.; Yan, J. Arbitrary-oriented object detection with circular smooth label. In Proceedings of the European Conference on Computer Vision; Springer: Cham, Switzerland, 2020; pp. 677–694. [Google Scholar]
- Yang, X.; Hou, L.; Zhou, Y.; Wang, W.; Yan, J. Dense Label Encoding for Boundary Discontinuity Free Rotation Detection. In Proceedings of the 2021 IEEE/CVF Conference on Computer Vision and Pattern Recognition (CVPR), Nashville, TN, USA, 20–25 June 2021; pp. 15814–15824. [Google Scholar] [CrossRef]
- Shao, Z.; Zhang, X.; Zhang, T.; Xu, X.; Zeng, T. RBFA-Net: A Rotated Balanced Feature-Aligned Network for Rotated SAR Ship Detection and Classification. Remote Sens. 2022, 14, 3345. [Google Scholar] [CrossRef]
- Cui, Z.; Leng, J.; Liu, Y.; Zhang, T.; Quan, P.; Zhao, W. SKNet: Detecting Rotated Ships as Keypoints in Optical Remote Sensing Images. IEEE Trans. Geosci. Remote Sens. 2021, 59, 8826–8840. [Google Scholar] [CrossRef]
- Yu, Y.; Yang, X.; Li, J.; Gao, X. A Cascade Rotated Anchor-Aided Detector for Ship Detection in Remote Sensing Images. IEEE Trans. Geosci. Remote Sens. 2022, 60, 1–14. [Google Scholar] [CrossRef]
- Zhu, M.; Hu, G.; Zhou, H.; Wang, S.; Zhang, Y.; Yue, S.; Bai, Y.; Zang, K. Arbitrary-Oriented Ship Detection Based on RetinaNet for Remote Sensing Images. IEEE J. Sel. Top. Appl. Earth Obs. Remote Sens. 2021, 14, 6694–6706. [Google Scholar] [CrossRef]
- Pan, Z.; Yang, R.; Zhang, Z. MSR2N: Multi-Stage Rotational Region Based Network for Arbitrary-Oriented Ship Detection in SAR Images. Sensors 2020, 20, 2340. [Google Scholar] [CrossRef]
- Ran, B.; You, Y.; Li, Z.; Liu, F. Arbitrary-Oriented Ship Detection Method Based on Improved Regression Model for Target Direction Detection Network. In Proceedings of the IGARSS 2020—2020 IEEE International Geoscience and Remote Sensing Symposium, Waikoloa, HI, USA, 26 September–2 October 2020; pp. 964–967. [Google Scholar] [CrossRef]
- Wu, Y.; Chen, Y.; Yuan, L.; Liu, Z.; Wang, L.; Li, H.; Fu, Y. Rethinking Classification and Localization for Object Detection. In Proceedings of the 2020 IEEE/CVF Conference on Computer Vision and Pattern Recognition (CVPR), Seattle, WA, USA, 13–19 June 2020; pp. 10183–10192. [Google Scholar] [CrossRef]
- He, K.; Gkioxari, G.; Dollar, P.; Girshick, R. Mask R-CNN. In Proceedings of the IEEE International Conference on Computer Vision (ICCV), Venice, Italy, 22–29 October 2017. [Google Scholar]
- He, K.; Zhang, X.; Ren, S.; Sun, J. Deep residual learning for image recognition. In Proceedings of the IEEE Conference on Computer Vision and Pattern Recognition, Las Vegas, NV, USA, 27–30 June 2016; pp. 770–778. [Google Scholar]
- Lin, T.Y.; Dollár, P.; Girshick, R.; He, K.; Hariharan, B.; Belongie, S. Feature Pyramid Networks for Object Detection. In Proceedings of the 2017 IEEE Conference on Computer Vision and Pattern Recognition (CVPR), Honolulu, HI, USA, 21–26 July 2017; pp. 936–944. [Google Scholar] [CrossRef]
- Liu, Z.; Wang, H.; Weng, L.; Yang, Y. Ship Rotated Bounding Box Space for Ship Extraction From High-Resolution Optical Satellite Images with Complex Backgrounds. IEEE Geosci. Remote Sens. Lett. 2017, 13, 1074–1078. [Google Scholar] [CrossRef]
- Xia, G.S.; Bai, X.; Ding, J.; Zhu, Z.; Belongie, S.; Luo, J.; Datcu, M.; Pelillo, M.; Zhang, L. DOTA: A Large-Scale Dataset for Object Detection in Aerial Images. In Proceedings of the 2018 IEEE/CVF Conference on Computer Vision and Pattern Recognition, Salt Lake City, UT, USA, 18–23 June 2018; pp. 3974–3983. [Google Scholar] [CrossRef]
- Everingham, M.; Van Gool, L.; Williams, C.K.; Winn, J.; Zisserman, A. The pascal visual object classes (voc) challenge. Int. J. Comput. Vis. 2010, 88, 303–338. [Google Scholar] [CrossRef]
- Bottou, L. Stochastic Gradient Descent Tricks. In Neural Networks: Tricks of the Trade, 2nd ed.; Montavon, G., Orr, G.B., Müller, K.R., Eds.; Springer: Berlin/Heidelberg, Germany, 2012; pp. 421–436. [Google Scholar] [CrossRef] [Green Version]
- Wang, T.; Li, Y. Rotation-Invariant Task-Aware Spatial Disentanglement in Rotated Ship Detection Based on the Three-Stage Method. IEEE Trans. Geosci. Remote Sens. 2022, 60, 1–12. [Google Scholar] [CrossRef]
- Simonyan, K.; Zisserman, A. Very Deep Convolutional Networks for Large-Scale Image Recognition. arXiv 2014, arXiv:1409.1556. [Google Scholar]
Figure 1.
(a) The situation of missed detection due to too dense targets. The yellow box indicates the detected targets, and the red box indicates the missed targets. (b) The result of using the oriented bounding box.
Figure 1.
(a) The situation of missed detection due to too dense targets. The yellow box indicates the detected targets, and the red box indicates the missed targets. (b) The result of using the oriented bounding box.

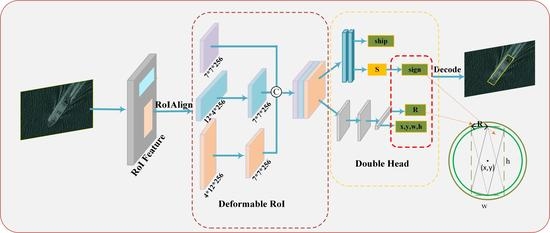
Figure 2.
Overview of the our proposed OSCD-Net. Feature extraction and RPN are located on the left. The DRoI module is an intermediate grid rectangle used for enhancement to form the final detection feature. ICR-head on the right is used to detect the horizontal rectangle and a circle, which is decoded into a rotating rectangular box.

Figure 3.
(a) The circle marked with the radius of the circle. The circle and the horizontal rectangle will intersect into four inclined rectangles. (b) The vertex of the horizontal rectangle and the intersection with the circle, and explains that there are only two inclined rectangles using AF to draw the circle.

Figure 4.
Schematic diagram of the rectangle in the coordinate axis. are known, and vertex coordinates (A, B, C, D, E, F, G, H) are unknown.
Figure 4.
Schematic diagram of the rectangle in the coordinate axis. are known, and vertex coordinates (A, B, C, D, E, F, G, H) are unknown.

Figure 5.
Illustration of the process of the ICR-head module. Each part is marked in the red box on the right.
Figure 5.
Illustration of the process of the ICR-head module. Each part is marked in the red box on the right.

Figure 6.
Illustration of process of DRoI module. DRoI module uses three transformation operations and two deformation operations. Transformation operation and deformation operation are circled with red frames.
Figure 6.
Illustration of process of DRoI module. DRoI module uses three transformation operations and two deformation operations. Transformation operation and deformation operation are circled with red frames.

Figure 7.
(a) The step of transformation operation; (b) The process of deformation operation.

Figure 8.
(a) The case where the short side of the horizontal rectangle does not intersect the circle. (b) The parallelogram obtained by connecting the midpoint and intersection of the short side of the horizontal rectangle.
Figure 8.
(a) The case where the short side of the horizontal rectangle does not intersect the circle. (b) The parallelogram obtained by connecting the midpoint and intersection of the short side of the horizontal rectangle.

Figure 9.
(a) The tilt target represented by ; (b) the tilt target represented by ; (c) the tilt target represented by .
Figure 9.
(a) The tilt target represented by ; (b) the tilt target represented by ; (c) the tilt target represented by .

Figure 10.
Comparison of ablation study methods. In the first column, we mark the ground truth with green boxes. The second column shows the detection results of Faster-RCNN OBB. The detection result in blue boxes are the effect of our use of ICR-head. In the last column, the yellow box shows the detection results used by both the DRoI module and ICR-head.

Figure 11.
Comparison experiment detection results on HRSC2016 dataset. The green box in the first column represents the ground truth. The yellow box indicates the detection result. The red box indicates the missed detection area, and the blue box indicates the inaccurate detection area. (a) The detection result of Faster R-CNN. (b) The detection result of RoI transformer. (c) The detection result of Gliding vertex. (d) The detection result of OSCD-Net.

Figure 12.
Precision–recall curve of different methods on the HRSC2016 dataset.

Figure 13.
Comparison of experiment detection results on the DOTA-Ship dataset. The green box in the first column represents the ground truth. The yellow box indicates the detection result. The red box indicates the missed detection area, and the blue box indicates the inaccurate detection area. (a) The detection result of Faster R-CNN. (b) The detection result of RoI transformer. (c) The detection result of Gliding vertex. (d) The detection result of OSCD-Net.

Figure 14.
Precision–recall curve of different methods on the DOTA-Ship dataset.

Figure 15.
Precision–recall curve of different methods on the SSDD+ dataset.

Figure 16.
Comparison of experiment detection results on the SSDD+ dataset. The green box in the first column represents the ground truth. The yellow box indicates the detection result. The red box indicates the missed detection area, and the blue box indicates the inaccurate detection area. (a) The detection result of Faster R-CNN. (b) The detection result of RoI transformer. (c) The detection result of Gliding vertex. (d) The detection result of OSCD-Net.

Figure 17.
Some detection results on the test datasets.


Table 1.
Performance comparison of Faster R-CNN under different rotated box representations. The highest value is indicated by bold numbers (%).
Table 1.
Performance comparison of Faster R-CNN under different rotated box representations. The highest value is indicated by bold numbers (%).
| Method | Num | S | AP(07) | AP(12) |
|---|---|---|---|---|
| Faster R-CNN+FP | 5 | - | 80.9 | 82.9 |
| Faster R-CNN+EP | 8 | - | 88.20 | 89.0 |
| Faster R-CNN+RHC (ours) | 5 | 98.9 | 88.6 | 89.2 |
Table 2.
Ablation study of OSCD-Net on the HRSC2016 dataset. The highest value is indicated by bold numbers (%).
Table 2.
Ablation study of OSCD-Net on the HRSC2016 dataset. The highest value is indicated by bold numbers (%).
| RHC | ICR-Head | DRoI | AP(07) | AP(12) |
|---|---|---|---|---|
| √ | 88.60 | 89.21 | ||
| √ | √ | 89.17 | 92.10 | |
| √ | √ | 89.21 | 91.73 | |
| √ | √ | √ | 89.98 | 93.52 |
Table 3.
Performance evaluation of nine different methods on HRSC2016 dataset. The highest value is indicated by bold numbers (%).
Table 3.
Performance evaluation of nine different methods on HRSC2016 dataset. The highest value is indicated by bold numbers (%).
| Method | Data Aug | Backbone | FPN | AP(07) | AP(12) |
|---|---|---|---|---|---|
| Faster R-CNN OBB | √ | ResNet101 | √ | 80.90 | 82.91 |
| RetinaNet OBB | √ | ResNet101 | √ | 79.17 | 82.10 |
| R2CNN | - | ResNet101 | - | 72.36 | 74.35 |
| RRPN | √ | VGG16 | - | 79.60 | - |
| RoI transformer | √ | ResNet101 | √ | 86.22 | 87.18 |
| Gliding vertex | √ | ResNet101 | √ | 88.20 | 89.02 |
| CSL | √ | ResNet101 | √ | 89.62 | - |
| RITSD | √ | ResNet101 | √ | 89.70 | 92.98 |
| OSCD-Net (ours) | √ | ResNet101 | √ | 89.90 | 93.52 |
Table 4.
Performance evaluation with Precision(P), Recall(R) and F1 on the HRSC2016 dataset. The highest value is indicated by bold numbers (%).
Table 4.
Performance evaluation with Precision(P), Recall(R) and F1 on the HRSC2016 dataset. The highest value is indicated by bold numbers (%).
| Method | P | R | F1 |
|---|---|---|---|
| Faster R-CNN OBB | 86.24 | 87.17 | 86.70 |
| RetinaNet OBB | 87.12 | 85.21 | 86.15 |
| RoI transformer | 88.01 | 90.15 | 89.07 |
| Gliding vertex | 89.81 | 92.67 | 91.22 |
| OSCD-Net (ours) | 90.12 | 94.54 | 92.27 |
Table 5.
Performance evaluation of nine different methods on DOTA-Ship dataset. The highest value is indicated by bold numbers (%).
Table 5.
Performance evaluation of nine different methods on DOTA-Ship dataset. The highest value is indicated by bold numbers (%).
| Method | Data Aug | FPN | AP(07) |
|---|---|---|---|
| Faster R-CNN OBB | √ | √ | 58.49 |
| RetinaNet OBB | √ | √ | 56.21 |
| R2CNN | - | - | 52.12 |
| RoI transformer | √ | √ | 63.75 |
| Gliding vertex | √ | √ | 66.53 |
| OSCD-Net (ours) | √ | √ | 67.62 |
| OSCD-Net (ours) | √ | √ | 67.95 |
Table 6.
Performance evaluation with Precision(P), Recall(R) and F1 on the DOTA-Ship dataset. The highest value is indicated by bold numbers (%).
Table 6.
Performance evaluation with Precision(P), Recall(R) and F1 on the DOTA-Ship dataset. The highest value is indicated by bold numbers (%).
| Method | P | R | F1 |
|---|---|---|---|
| Faster R-CNN OBB | 62.92 | 70.19 | 66.36 |
| RetinaNet OBB | 62.81 | 68.25 | 65.42 |
| RoI transformer | 64.89 | 75.10 | 69.62 |
| Gliding vertex | 69.01 | 77.50 | 73.01 |
| OSCD-Net (ours) | 69.04 | 78.15 | 73.31 |
Table 7.
Performance evaluation of nine different methods on the SSDD+ dataset. The highest value is indicated by bold numbers (%).
Table 7.
Performance evaluation of nine different methods on the SSDD+ dataset. The highest value is indicated by bold numbers (%).
| Method | Data Aug | FPN | AP(07) | AP(12) |
|---|---|---|---|---|
| Faster R-CNN OBB | √ | √ | 75.95 | 77.45 |
| RetinaNet OBB | √ | √ | 69.17 | 72.18 |
| R2CNN | - | - | 67.78 | 68.95 |
| RoI transformer | √ | √ | 78.32 | 79.82 |
| Gliding vertex | √ | √ | 81.22 | 83.20 |
| OSCD-Net(ours) | √ | √ | 81.01 | 83.49 |
| OSCD-Net(ours) | √ | √ | 82.90 | 84.52 |
Table 8.
Performance evaluation with Precision(P), Recall(R) and F1 on the SSDD+ dataset. The highest value is indicated by bold numbers (%).
Table 8.
Performance evaluation with Precision(P), Recall(R) and F1 on the SSDD+ dataset. The highest value is indicated by bold numbers (%).
| Method | P | R | F1 |
|---|---|---|---|
| Faster R-CNN OBB | 85.24 | 83.42 | 84.32 |
| RetinaNet OBB | 84.10 | 81.93 | 83.00 |
| RoI transformer | 88.23 | 87.15 | 87.69 |
| Gliding vertex | 90.04 | 88.24 | 89.13 |
| OSCD-Net (ours) | 89.25 | 90.45 | 89.85 |
Publisher’s Note: MDPI stays neutral with regard to jurisdictional claims in published maps and institutional affiliations. |
© 2022 by the authors. Licensee MDPI, Basel, Switzerland. This article is an open access article distributed under the terms and conditions of the Creative Commons Attribution (CC BY) license (https://creativecommons.org/licenses/by/4.0/).
Share and Cite
MDPI and ACS Style
Zhang, J.; Huang, R.; Li, Y.; Pan, B. Oriented Ship Detection Based on Intersecting Circle and Deformable RoI in Remote Sensing Images. Remote Sens. 2022, 14, 4749. https://doi.org/10.3390/rs14194749
AMA Style
Zhang J, Huang R, Li Y, Pan B. Oriented Ship Detection Based on Intersecting Circle and Deformable RoI in Remote Sensing Images. Remote Sensing. 2022; 14(19):4749. https://doi.org/10.3390/rs14194749
Chicago/Turabian StyleZhang, Jun, Ruofei Huang, Yan Li, and Bin Pan. 2022. "Oriented Ship Detection Based on Intersecting Circle and Deformable RoI in Remote Sensing Images" Remote Sensing 14, no. 19: 4749. https://doi.org/10.3390/rs14194749
Note that from the first issue of 2016, this journal uses article numbers instead of page numbers. See further details here.