Mapping Frozen Ground in the Qilian Mountains in 2004–2019 Using Google Earth Engine Cloud Computing
by
 , and
, and
Yuan Qi
1, 
Shiwei Li
2,
Youhua Ran
1,
Hongwei Wang
1,
Jichun Wu
3,
Xihong Lian
1,4 and
Dongliang Luo
3,* 1
Key Laboratory of Remote Sensing of Gansu Province, Northwest Institute of Eco-Environment and Resources, Chinese Academy of Sciences, Lanzhou 730000, China
2
Piesat Information Technology Co., Ltd., Beijing 100000, China
3
State Key Laboratory of Frozen Soil Engineering, Northwest Institute of Eco-environment and Resources, Chinese Academy of Sciences, Lanzhou 730000, China
4
University of Chinese Academy of Sciences, No.19A Yuquan Road, Beijing 100049, China
*
Author to whom correspondence should be addressed.
Remote Sens. 2021, 13(1), 149; https://doi.org/10.3390/rs13010149
Submission received: 24 November 2020
/
Revised: 30 December 2020
/
Accepted: 31 December 2020
/
Published: 5 January 2021
(This article belongs to the Special Issue Recent Advances in Cryospheric Sciences)
Abstract
:The permafrost in the Qilian Mountains (QLMs), the northeastern margin of the Qinghai–Tibet Plateau, changed dramatically in the context of climate warming and increasing anthropogenic activities, which poses significant influences on the stability of the ecosystem, water resources, and greenhouse gas cycles. Yet, the characteristics of the frozen ground in the QLMs are largely unclear regarding the spatial distribution of active layer thickness (ALT), the maximum frozen soil depth (MFSD), and the temperature at the top of the permafrost or the bottom of the MFSD (TTOP). In this study, we simulated the dynamics of the ALT, TTOP, and MFSD in the QLMs in 2004–2019 in the Google Earth Engine (GEE) platform. The widely-adopted Stefan Equation and TTOP model were modified to integrate with the moderate-resolution imaging spectroradiometer (MODIS) land surface temperature (LST) in GEE. The N-factors, the ratio of near-surface air to ground surface freezing and thawing indices, were assigned to the freezing and thawing indices derived with MODIS LST in considerations of the fractional vegetation cover derived from MODIS normalized difference vegetation index (NDVI). The results showed that the GEE platform and remote sensing imagery stored in Google cloud could be quickly and effectively applied to obtain the spatial and temporal variation of permafrost distribution. The area with TTOP < 0 °C is 8.4 × 10⁴ km2 (excluding glaciers and lakes) and accounts for 46.6% of the whole QLMs, the regional mean ALT is 2.43 ± 0.44 m, while the regional mean MFSD is 2.54 ± 0.45 m. The TTOP and ALT increase with the decrease of elevation from the sources of the sub-watersheds to middle and lower reaches. There is a strong correlation between TTOP and elevation (slope = −1.76 °C km−1, p < 0.001). During 2004–2019, the area of permafrost decreased by 20% at an average rate of 0.074 × 10⁴ km2·yr−1. The regional mean MFSD decreased by 0.1 m at a rate of 0.63 cm·yr−1, while the regional mean ALT showed an exception of a decreasing trend from 2.61 ± 0.45 m during 2004–2005 to 2.49 ± 0.4 m during 2011–2015. Permafrost loss in the QLMs in 2004–2019 was accelerated in comparison with that in the past several decades. Compared with published permafrost maps, this study shows better calculation results of frozen ground in the QLMs.
1. Introduction
Permafrost (perennially frozen ground) is thermally defined as soil or rock maintaining 0 °C for at least two consecutive years [1]. It is a product of long-term climate change and geological evolution and distributes from high latitudes to mid to low-latitudes with high elevations across the world [2,3]. The seasonally frozen ground freezes in the winter and thaws in the summer, while the active layer is that portion of the soil above permafrost that thaws during the summer and freezes again. The thermal state of frozen ground was usually represented by two key indicators: the mean annual temperature at the top of the permafrost or the bottom of maximum frozen soil depth (MFSD) (TTOP) (usually at depth of 1–3 m), and the temperature at the depth of zero annual amplitude (TZAA) (with temperature amplitude within 0.1 °C and usually at the depth of 10–25 m) [1,4,5,6,7]. Over the past three or four decades, permafrost has experienced wide degradation in the context of climate warming and increasing anthropogenic activities, which is characterized by rising of ground temperatures, increasing of active layer thickness (ALT), decreasing of maximum frozen soil depth (MFSD), as well as the disappearance of isolated permafrost [3,8,9,10,11,12,13]. The variation in permafrost exerts significant influences on the alterations of hydrological cycles [14,15,16], thermokarst-inducing processes [17], exacerbation of biogeochemical cycles [18,19], changes in landscapes and geomorphologies [17,20], as well as losses of stabilization of surface hydrothermal dynamics [21,22]. The degradation of permafrost and its adverse consequences have attracted widespread attention from stakeholders in governmental policy and planning and residents, as well as among scientific communities.
With an average altitude exceeding 4000 m above sea level, the Tibetan Plateau (TP) is well known as “the Third Pole” and “the Asian Towers” [23,24,25,26] and ranks as the largest expanse of mountain permafrost across the world. Located in the northeastern margin of the TP, the Qilian Mountains (QLMs) is a representative area of mountain permafrost in the TP [27,28,29]. The permafrost in the QLMs belongs to the sub-region of the Qilian-Altun Mountains of the TP permafrost region [30]. The permafrost in the QLMs has suffered dramatic and severe degradation in the past decades, which has been mostly recognized by in situ observations at sparsely- and unevenly-deployed sites [9,13], despite that the exact distribution of the thermal state of permafrost was rarely revealed for the whole TP. Although there are a variety of practices related to permafrost investigations, modeling, and mapping in the QLMs [31,32,33,34], the detailed spatial distribution of permafrost temperature, ALT, and MFSD in this specific region remains largely unavailable. The lack of convincible permafrost maps may hinder relevant studies on eco-environment management and natural resources [35].
The traditional permafrost research was based mainly on long-term field observations [4,10,36], indirect obtaining of the thermal state of permafrost with freezing and thawing indices on the ground surface [37,38], and sometimes numerical simulations and machine learning [39,40]. The traditional technical processes of remote sensing analysis are to first acquire and store data, and then perform preprocessing, extract information, analyze geoscientific issues, and extract thematic information using relevant algorithm and methods. The disadvantages of traditional remote sensing are difficulty in data collection, request of large storage capacity, and low processing efficiency in large-scale geoscientific analysis and applications. Some permafrost studies utilizing remote sensing techniques need to download and store remote sensing datasets [39]. In the context of the era of big data, data acquisition, processing, calculation, and analysis in the Google Earth Engine (GEE) cloud have powerful and stable capabilities [41,42]. GEE is an essentially cloud-based platform that can be used to access and seamlessly process massive freely available satellite datasets, including datasets acquired by moderate-resolution imaging spectroradiometer (MODIS), and Landsat and Sentinel imagery, as well as high-performance parallel computing [42]. Recently, there has been a significant increase in efforts of geoscientific applications with GEE, including crop mapping [43], forest management [44], wetland inventory [45], settlement and population mapping [46], as well as surface water extraction [47,48,49].
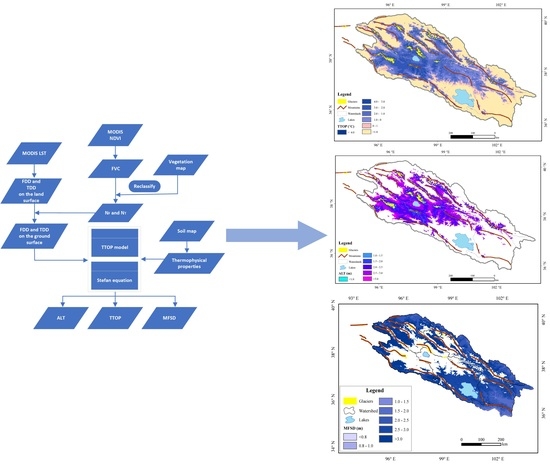
In this study, we tried to map ALT, MFSD, and the mean annual temperature at the top of permafrost or the bottom of MFSD (TTOP) in the QLMs using the MODIS land surface temperature (LST) along with soil and vegetation maps with the Google Earth Engine (GEE) platform. Firstly, we obtained the daily MODIS LST and calculated the freezing and thawing indices on the land surface (FIL and TIL). Secondly, we obtained the ground surface freezing and thawing indices (FIG and TIG) by incorporating the FIL and TIL and the N-factors [50]. The N-factors, the ratio of near-surface air to ground surface freezing or thawing indices, were assigned in considerations of the classification of vegetation coverage calculated with MODIS normalized difference vegetation index (NDVI). Then, we calculated the TTOP, ALT, and MFSD by incorporating FIG and TIG as well as soil information with the TTOP model [51] and Stefan Equation [52]. This study is likely to facilitate related research on ecosystem service and may help stakeholders in government policy and planning in the QLMs.
2. Materials and Methods
2.1. Study Region
The QLMs is surrounded by the Altun Mountains in the west, the Qaidam and the Gonghe basins in the south, and the Hexi Corridor in the north. It is clamped by several sets of NNW-oriented large faults composed of parallel mountain chains and broad valleys. Governments and scientific communities have paid more and more attention to the QLMs since serious eco-environmental issues have weakened the role of the ecological barrier of the QLMs [35]. There are several confusing definitions regarding the geographical extent of the Qilian Mountains owing to no official delineating. In this study, we delineated the boundary of the QLMs in consideration of the mountain trends around this area and the division principles of other people (Figure 1). According to our watershed division principle, the latitude ranges from 35°49′N to 40°01′N and the longitude ranges from 94°23′E to 103°58′E in the QLMs, encompassing an area of 18.22 × 10⁴ km2. The altitude in the QLMs ranges from 1576 m to 5763 m and is averaged at 3586 m [27], which is low in the surroundings and high in the central part, especially at the mountaintops. The QLMs is roughly composed of six watersheds and serves as the sources of six rivers, i.e., the Datong River ranking the second-order tributary of the Yellow River, the Shule River, the Shiyang River, the Heihe River, the Qinghai Lake, and the Qaidam Basin. There are two relatively large lakes in the QLMs—one is the Qinghai Lake, ranking as the largest lake across China with a surface area of 4829 km2 and lake level of 3198 m; and the other is the Hala Lake, with a surface area of 595.9 km2 and lake level of 4081 m, as obtained from the long-term sequence dataset of lake areas on the TP for 1970–2013 [53].
The climate continentality index is lower in the western parts and highest in the eastern parts owing to spatial differentiation of precipitation and moisture conditions. The climate is humid in the eastern parts of the QLMs, which is abundant in rainfall, affected by the southeast and southwest monsoons. On the contrary, the climate is sub-arid and extremely arid in the western parts of the QLMs, such as the source region of the Shule River [8], which is characterized by annual precipitation lower than 400 mm and even 200 mm. Affected by the spatial differentiation of the climate continentality index, the surface vegetation in the QLMs is mainly dominated by alpine meadow and alpine paludal meadow in the east, alpine steppe in the central parts, and alpine steppe and even desert steppe in the southwest. The main vegetation in the QLMs is composed of Kobresia pygmaea, Kobresia humilis, Kobresia bellardii and Kobresia capillifolia dotted with Carex moorcroftii, Coelnema dradaroides, and Przewalskia tanguia [57].
The permafrost in the QLMs is mostly controlled by elevations, which have the characteristic of declining in continuity with the lowering of altitude, and distributes in high mountains at elevations exceeding 3600 m, as well as valleys and basins with favorable moisture conditions and vegetation cover as low as 3400 m [6,7,8,9,13]. With a decrease in precipitation and an increase in aridity from east to west, the lower limits of permafrost decline at a rate of 150 m per degree [6]. However, organic layers, fine-grained materials, and relatively high ground ice complicate the development of permafrost at local scales. The thermal state of permafrost at specific in situ sites was obtained by measurements of ground temperature after borehole drillings. For example, the mean annual ground temperature around the depth of zero annual amplitude was revealed to be above −2 °C in the upper reaches of the Heihe River [13,55], in the source regions of the Datong River [9,58], and the source region of the Shule River [8]. Just to resemble other regions on the TP, the permafrost in the QLMs is susceptible to climate changes and anthropogenic activities, as confirmed by recent observations and simulations [10,13,27,32,56,59,60]. Meanwhile, related permafrost geohazards, such as the thaw slumps, were accelerated at many regions in the context of permafrost degradation along with climate warming [61]. Although permafrost maps had been compiled in parts of the QLMs in the past [27,32,62,63], the accurate sketching of the thermal state of permafrost for the whole QLMs is still unknown.
2.2. Methods
2.2.1. Stefan Equation
The Stefan Equation [52] was widely applied to calculate ALT and MFSD. In this study, ALT and MFSD were calculated from the variants of the Stefan Equations (1) and (2) using the ground surface thawing index and freezing index, respectively, as follows:
or
where the edaphic factor E is the catch-all scaling parameter, which is described as follows:
or
where kt and kf are the thawed and frozen thermal conductivities of the soils, respectively; w is soil water content; is soil bulk density; L is latent heat; and and are the ground surface thawing and freezing indices, respectively. The soil thermal properties, mainly the thawed and frozen thermal conductivities, were prescribed with the empirical values according to Xu et al. [64] as well as soil properties (soil types, soil density, and soil water content). The soil properties, including the soil bulk density as well as sand, clay, and silt content, were extracted from the soil map of China at a scale of 1,000,000 from the Second National Soil Survey [65].
2.2.2. TTOP Model
As TZAA could be associated with TTOP through temperature gradient (usually 0.2–0.4 °C) [66], we revealed the thermal state of frozen ground in the QLMs by calculating TTOP in this study. Here, we employed the TTOP model, which correlates to the ground surface freezing and thawing indices, and was conceptualized by Smith and Riseborough (1996, 2002), to reveal the thermal state of frozen ground in the QLMs. The TTOP model used to reveal the TTOP value is shown in the following equations [51]:
where is the ratio of thermal conductivity of the soils in thawed and frozen states, which represents the influence of ground thermal properties [67]. and represent the freezing index and thawing index on the ground surface, respectively, and P is the annual period (365 d). The soil thermal conductivities were assigned in consideration of the soil types and relevant thermal conductivities. If , the relevant grid point will be identified as permafrost and Equation (5) will be used to calculate TTOP; otherwise, it will be identified as seasonally frozen ground and Equation (6) will be employed. Equations (5) and (6) take into account the thermal offset effect [68] with freezing and thawing indices in the lower atmosphere linked to values at the ground surface using the N-factors. In this study, the N-factors were considered when calculating the ground surface freezing and thawing indices with the land surface freezing and thawing indices.
2.3. Data
2.3.1. MODIS LST
The main input for the Stefan Equation and the TTOP model is the reprocessed LST products with a spatial resolution of 1 km2 obtained from the Moderate Resolution Imaging Spectroradiometers (MODIS) onboard Terra and Aqua satellites launched in 2000 and 2002, respectively. The two satellites include two daytime and two night-time measurements, which serve as the maximum and minimum LSTs to calculate daily LST [69]. As a result of data scarcity caused by insufficient and uneven distributions, we treated MOD11A1 (daily LST from Terra) and MYD11A1 (daily LST from Aqua) with a spatial resolution of 1 km2 as the daytime and nighttime LST. To supplement the deficient, missing, or unacceptable data caused by the presence of clouds, the presence of dust in the atmosphere, and sensor failure [70], an 8 d average value around a specific day was assigned to the missing value, then the daily LST was calculated using the diurnal or nocturnal LSTs [69,71]. The gap-filling algorithm is shown as follows [71]:
Ts = 0.18 × Terra_day + 0.269 × Terra_night + 0.143 × Aqua_day+ 0.435 × Aqua_night + 0.896
After obtaining the daily LST, we used the following equations to calculate the freezing and thawing indices on the land surface:
Here, and are the freezing and thawing indices derived from LST products, respectively; is the nominal daily LST; is the freezing point (usually defined as 0 °C); and is the average daily LST. As a result of the complex influence of surface characteristics, the mean annual ground surface temperature varies greatly even in the same geographical unit with consistent elevation and similar vegetation [72]. The insulating effects of snow cover in the winter and vegetation cover in the summer cause a large temperature deviation between ground surface temperature and the near-surface or land surface temperatures. However, previous studies demonstrated that the near-surface air temperature is linearly correlated to the land surface temperature [73,74]. Moreover, the mean annual or freezing and thawing indices of the near-surface are approximately consistent with those of the land surface on the TP [74]. Therefore, we approximated LST as the near-surface air temperature. After calculating the freezing and thawing indices with MODIS LST, we used the N-factors to substitute the freezing and thawing indices on the ground surface (the depth of 0–5 cm), which is the true upper thermal boundary of the permafrost [74]. Afterward, the ground surface thawing index and freezing index are calculated as follows:
Here, the N-factors were selected from the documentations in consideration of similar surface characteristics [75,76,77], which is described in Section 2.3.2.
2.3.2. Surface Vegetation and the N-Factors
The surface vegetation in the QLMs mainly consists of the alpine steppe in the western part and alpine meadow or alpine paludal meadow in the eastern part. Meanwhile, in the southern parts of the QLMs, there is a large area covered with desertification or bare ground surface. The freezing and thawing indices calculated with MODIS LST cannot be directly used for mapping or simulating permafrost distribution unless the substitution of N-factors is applied, as the energy exchange between the ground surface temperature and the near-surface is quite complex [74]. Therefore, we calculated the fractional vegetation cover (FVC) with the MODIS normalized difference vegetation index (NDVI) and then assigned the N-factors to each grid point in consideration of the FVC. In this study, we first reclassified the NDVI into five classes (0–0.2, 0.2–0.4, 0.4–0.6, 0.6–0.8, and 0.8–1.0), and then assigned the thawing N-factors of 0.5, 0.6, 0.7, 0.8, and 0.9, as well as freezing N-factors of 1.5, 1.2, 1.0, 0.9, and 0.8, to each grid point in consideration of vegetation differences, as the freezing and thawing N-factors for the surface characteristics on the TP are generally within 0.5–0.8 and 0.9–1.5, respectively [72,75,77]. The FVC is computed as follows:
When calculating the FVC, we adopted NDVI with cumulative probabilities of 5% and 95% as NDVImin and NDVImax, respectively, which were selected with reference to previous studies (e.g., Li et al. [78]). The FVC in the QLMs was calculated with the MODIS NDVI.
2.3.3. Google Earth Engine
The data used to calculate the frozen ground parameters and vegetation index were all stored in Google cloud. GEE consists of a multi-petabyte analysis-ready data catalog, including the MODIS LST and NDVI products used in this study, co-located with a high-performance, intrinsically parallel computation service [41]. All the data preprocesses and information extraction of remote sensing images and the calculations of frozen ground parameters were accessed and controlled through an Internet-accessible application programming interface (API) and an associated web-based interactive development environment (IDE) that enables rapid prototyping and visualization of results. The algorithms related to calculations of ALT, TTOP, and MFSD were compiled with JavaScript through the API and IDE.
2.3.4. Validation
The overall accuracy of calculated TTOP and ALT was evaluated with mean absolute error (MAE), root mean square error (RMSE), and mean bias error (MBE), as described in Willmott and Matsuura [79]. The calculations were verified with the in situ observations of permafrost temperatures and ALT and the previous compilation of permafrost maps containing the QLMs (Figure 1). There are sparse and uneven observations of permafrost temperatures and ALT in the QLMs over the past one or two decades, especially in the source regions of the Datong River and the upper reaches of the Heihe River, as well as the source regions of the Shule River [13,54,58]. We compared the calculated values with observations and found that the correlation between TTOP and ALT and altitude is significant (Figure 2). Besides, we found that the MAE, RMSE, and MBE for these comparisons are 0.58, 0.19, and 0.19, respectively. The validation shows that the calculation accuracy of permafrost temperature and active layer based on the Stefan Equation and the TTOP model is high, which is in line with the actual situation.
3. Results
3.1. Comparisons to Other Permafrost Maps
The four widely used permafrost maps—Global permafrost zonation index (1 km) [80], New Permafrost Distribution on the Qinghai-Tibet Plateau (NPD) [71], and Northern Hemisphere Permafrost Map (GlobalPF) [81]—were also compared in this study. In general, the calculated permafrost extent is consistent with these widely used permafrost maps in most parts, especially in the central parts of the Qilian Mountains. Compared with the results calculated in this study, other published permafrost maps tend to overestimate the permafrost extent in the western parts that were generally covered with sparse alpine steppe and underestimate the permafrost extent in the eastern parts that were covered with dense alpine meadow and paludal meadow (Table 1, Figure 3).
The difference between the newly complied permafrost in the QLMs of this study was compared with other calculated results based on the confusion matrix and its derived index Kappa coefficient. Overall, two classifications of permafrost and no permafrost were performed, with three comparable results (Table 2). The assessment demonstrates that all the calculated permafrost temperatures were generally in agreement with the permafrost map as compiled by Zou et al., (2017) (with Kappa coefficient of 0.811) and Obu et al., (2019) (with Kappa coefficient of 0.780). The standard estimator of the Kappa coefficient indicates that there is a good agreement between the TTOP derived from the GlobalPF map and the MALST in this study (Figure 4).
3.2. Spatial Distribution of TTOP
The TTOP of the six watersheds in the QLMs averaged throughout 2004–2019 is shown in Figure 4. The area with negative TTOP is 8.4 × 10⁴ km2, which accounts for about 46.6% of the whole QLMs. Meanwhile, the area with positive TTOP is 9.3 × 10⁴ km2 and accounts for about 51.2% of the whole area. Other parts of the QLMs are covered by glaciers and lakes. The areal percentage of permafrost with negative TTOP is highest in the Heihe River watershed, indicating that the permafrost is relatively thermally-stable in the Heihe River watershed. The TTOP in permafrost regions of the QLMs is averaged at −1.43 °C and generally increases from the source regions of all six watersheds to the periphery regions, which follows the undulating terrains and the changes of altitude. It is not difficult to find that the TTOP is highly correlated with altitude in the QLMs. The higher the altitude, the lower the TTOP. The TTOP is relatively lower in the watershed boundary as the altitudes are relatively higher. For the watersheds of the Shule River and the Qaidam Basin, the TTOP increases from about −4 °C in the central parts to above 0 °C in the western parts along the mountain ridge. On the contrary, the TTOP generally increases from about −3 °C in the central parts to above 0 °C in the eastern parts for the watersheds of the Shiyang and Datong rivers. There is no permafrost distribution in the watershed of the Qinghai Lake owing to the influence of relatively low elevation. However, the TTOP is generally below 0 °C around the Hala Lake, which is a closed lake basin with a depth of 65 m in the western QLMs [82], with some exceptions of positive TTOP distributed in the near-shore. With the altitude rising from around 4071 m at the surface of the Hala Lake to over 5400 m in the mountain ridges, the TTOP generally decreases from about 0 °C to about −4 °C.
The permafrost loss in the QLMs was accelerated throughout 2004–2019. The areas covered by permafrost in the QLMs are 8.92 × 10⁴, 8.54 × 10⁴, 8.59 × 10⁴, and 7.74 × 10⁴ km2 during 2004–2005, 2006–2010, 2011–2015, and 2016–2019, respectively (Figure 5). The permafrost decreased by 0.38 × 10⁴ km2 from 2004–2005 to 2006–2010, and remained stable from 2006–2010 to 2011–2015, but decreased dramatically by 0.85 × 10⁴ km2 from 2011–2015 to 2016–2019. The mean annual air temperature decreased slightly at a rate of −0.1 °C·yr−1 from 2006 to 2012, which likely resulted in the slight increase of permafrost area in 2011–2015 as a result of the lag in the response of frozen ground to climate change. Overall, the permafrost in the QLMs degraded by 1.18 × 10⁴ km2 at a rate of 0.074 km2·y−1 from 2004 to 2019, accounting for about 20.0% of the total area.
3.3. Spatial Distribution of ALT
The ALT in the QLMs averaged over 2004–2019 is shown in Figure 6. In general, the calculated ALT in the QLMs ranges from 0.4 m to 3.6 m and is averaged at 2.51 ± 0.45 m. For the area around Hala Lake, the ALT decreases from 3.0 m near the lakeshore to less than 1.0 m away from the lake basin. The ALT distributed around Hala Lake is larger than 2.0 m. Resembling the spatial distribution of TTOP, the ALT is generally as thin as <1.0 m in the central parts, especially in the mountain ridges where the rivers originate, and gradually thickens to larger than 3.0 m towards the downstream of each watershed. It should be noted that, at the mountain ridges of the QLMs, there are some areas covered with LST that are lower than 0 °C all the time, indicating they are perennially covered by glaciers. We exclude these areas when calculating as they could not be treated as permafrost. Besides, there is no ALT value available for the central parts of the QLMs.
Although the permafrost in the QLMs varied considerably during 2004–2019 (Figure 5), the regional mean active layer thickness did not simultaneously change dramatically (Figure 7). The average ALT in the QLMs was 2.61 m, 2.59 m, 2.49 m, and 2.6 m over each five-year period of 2004–2005, 2006–2010, 2011–2015, and 2016–2019, respectively. However, the insignificant change of regional mean ALT may be because the permafrost with thicker ALT disappeared in the same period.
3.4. Spatial Distribution of MFSD
The spatial distribution of the MFSD in the seasonally frozen ground in the QLMs differs significantly from that of the ALT. As shown in Figure 8, the MFSD decreases from above 3.0 m to about 1.5 m in the seasonally frozen ground mainly located in the periphery of permafrost regions. The farther away from the permafrost regions, the smaller the MFSD. In the central parts of the QLMs, the MFSD values are only available in the lower valleys of the rivers, but are not available in most parts of this area as it is almost all covered by permafrost.
Unlike the trend of regional average ALT, the MFSD in the QLMs averaged over 2004–2019 showed a decreasing trend (Figure 9). The average MFSD was 2.68 ± 0.48 m, 2.57 ± 0.49 m, 2.58 ± 0.44 m, and 2.58 ± 0.48 m during 2004–2005, 2006–2010, 2011–2015, and 2016–2019, respectively.
4. Discussions
4.1. Comparisons to Published Permafrost Maps
The difference between the permafrost area in the QLMs calculated in this study and that extracted from others was compared (Table 1 and Table 2). The permafrost area calculated by Obu et al., (2019) is 16,054.9 km2 more than that in this study, while the permafrost area calculated by Zou et al., (2017) is almost the same as that in this study and only 904.0 km2 less than the results presented in this study as a whole. Overall, the overestimation area of GlobalPF [81] compared with this study is much larger than the underestimation area, while the overestimation area of NPD [71] almost equals the underestimation area in the QLMs.
We also compared the spatial distribution of the TTOP value calculated in this study with Obu et al., 2019, the recent well-known permafrost mapping practice at the hemispheric scale, which calculated the permafrost temperature as well. Our results indicate that the calculated TTOP in this study is generally consistent with the observed values (Figure 3). The TTOP derived from Obu et al., (2019) tends to underestimate the TTOP by an average of 1.98 °C in comparison with this study (Figure 10). The deviation may be different N-factors assigned in this study when using the satellite-derived LST to calculate the freezing and thawing indices in consideration of the thermal influences of complex surface characteristics, such as the snow cover in winter and vegetation cover in summer [66,75,76]. As a temperature at the vegetation cover in the summer or the snow cover in the winter, LST generally responds quickly to solar radiation and has a larger variation amplitude than the near-surface air and the ground surface temperature [74]. Previous studies at in situ sites with consistent surface characteristics on the northeastern TP demonstrated that the average thawing N-factor was about 0.52 and the average freezing N-factor was about 1.01 [74]. Nonetheless, as the surface characteristics are very complex over different ecoregions [75], the freezing and thawing N-factors may vary from place to place. Therefore, to improve the accuracy of calculations of TTOP or ALT, more field observations of the land surface, near-surface air, and ground surface temperatures are expected to be carried out in association with the complex surface vegetation, substrates, and microtopography [50,76,83]. Especially, the correlation between the freezing and thawing N-factors and the satellite-derived vegetation index associated with in situ investigations of surface temperatures and surface characteristics should be explored in the TP in detail in the future.
4.2. Correlation between Permafrost and Topography
Permafrost in the TP has long been recognized as high-altitudinal permafrost, which is mainly controlled by high altitudes and topography, owing to its average altitude exceeding 4000 m and being far away from the main body of Eurasia permafrost zones [2,28,80,84]. One of the concepts most closely related to high-altitudinal permafrost is the lower limits of permafrost, which is complicated by the relationships between timberline, snow line, glacier, and permafrost environments in the mid-latitudes [85]. The lower limits of high-altitudinal permafrost differ significantly from heterogeneous geographic backgrounds. For example, the lower limit at Xidatan, the northern boundary of the main body of the TP, was reported to be 4395 m in 2003 [86], while the lower limits of permafrost in the eastern parts differ significantly from those in the western parts [6,7,13].
In general, the permafrost in the QLMs was categorized as mountain permafrost [28,87], although the regionalization system of permafrost in the TP is still controversial, while the altitude was considered as the most influential factor determining the spatial distribution of permafrost. The large deviation of permafrost distributed in the eastern and western parts of the QLMs was revealed by extensive field investigations [6,7,9,88] under the complex influences of climate continentality index, the contrast in precipitation, as well as landscapes. However, the main factors causing the spatial distribution of permafrost were considered to be altitude and topography [8]. As shown in Figure 11, TTOP with isotherm of 0 °C in the QLMs is generally consistent with the altitudinal belt of 3600–4000 m, which means that the lower limits of permafrost fall within the altitudinal belt of 3600 m and 4000 m and are similar to previous studies [6,7,13]. The lower limits of permafrost in the QLMs could be revealed by the correlation analysis between altitude and TTOP, ALT, and MFSD. Figure 11a,b indicate that the vertical lapse rate of the TTOP in permafrost regions decreases at a rate of −1.76 °C km−1, while that in seasonally frozen ground decreases at a rate of −6.04 °C km−1. Most grid points with negative TTOP fall within the altitude of 3500 m and 5500 m, some grid points with negative TTOP are located in the eastern parts with altitudes lower than 3500 m, which could be distributed in the lower valleys with alpine paludal meadow and relatively thick peaty layer [62], which could better “protect” permafrost [13,56]. Most of the grid points with positive values are located below 3000 m and fall within the altitude below 4500 m, with some exceptions in the western high mountain peaks. All these correlation analyses demonstrate that the permafrost temperatures in the QLMs are strongly elevation-dependent, although permafrost may occur at some spots with favorable moisture conditions and fine-grained soil textures in the isolated patches permafrost regions dominated by seasonally frozen ground [8,58].
However, the TTOP in the QLMs is negatively correlated with elevation, longitude, and latitude based on multiple linear regression (Equation (10)). This demonstrates that the pattern of the permafrost on the QLMs coincides with the three-fold zonation, which is closely related to mountain permafrost as proposed by Cheng [2,89].
Meanwhile, the correlation coefficients are 0.31, −0.17, and −0.78 between TTOP and longitude, latitude, and altitude, respectively. This means that the TTOP is positively correlated with longitude, but negatively correlated with latitude and altitude. The ALT in the QLMs shows a similar spatial characteristic to the TTOP, which is strongly dependent on the altitude (Figure 11c). The correlation coefficients between ALT and longitude, latitude, and altitude are 0.23, −0.35, and −0.82, respectively.
4.3. Response of Permafrost to Climate Change
Resembling other regions, the permafrost in the QLMs has been degrading seriously in the context of climate warming and increasing anthropogenic activities for more than half a century. From the 1960s to the 2000s, the permafrost in the QLMs was reported to shrink by 2.63 × 10⁴ km2 [34]. Simulated results demonstrated that the rate of permafrost loss has accelerated recently [27,32]. Our study demonstrates that the acceleration of permafrost loss from 2004 to 2019 was evidenced as well. As the permafrost simulated by models changed dramatically from year to year, we compared the areal change of permafrost variation for every five years. The comparisons of permafrost variation in the QLMs indicate that the permafrost loss was even faster than ever. The change of permafrost area in the QLMs remained relatively stable from 2006–2010 to 2011–2015 (Figure 5), possibly owing to a slight decrease of mean annual air temperature, the so-called stagnation of warming, from 2006 to 2012 in the QLMs. However, the continuous increase of mean annual air temperature after 2012 induced a dramatic decrease in the permafrost area, which indicates a continuing warming trend.
5. Summary and Conclusions
In this study, we utilized the Stefan Equation and the TTOP model to calculate the spatial distribution of TTOP, ALT, and MFSD in the QLMs from 2004 to 2019. The freezing and thawing indices were calculated with MODIS-derived LST. Afterward, the ground surface freezing and thawing indices were calculated in consideration of the N-factors assigned with varied fractional vegetation cover derived from MODIS NDVI. All preprocesses and simulations related to the MODIS datasets were compiled with JavaScript language in the GEE platform.
The simulated permafrost extent occupies an area of 8.4 × 10⁴ km2 (excluding glaciers and lakes) and accounts for 46.6% of the whole region. The simulated ALT is regionally averaged over 2.43 ± 0.44 m, while the simulated MFSD is 2.54 ± 0.45 m. The area of permafrost decreased by 1.18 × 10⁴ km2 at an average rate of 0.074 × 10⁴ km2·yr−1 from 2004 to 2019. The simulated permafrost extent in the QLMs is in good agreement with the published permafrost maps (such as Zou et al., (2017) and Obu et al., (2019), with Kappa coefficient of 0.811 and 0.780) and with a higher confidence level. However, to improve the simulation quality, more field investigations should be carried out concerning the differences between near-surface air temperature, LST, and ground surface temperature in association with the observed and satellite-derived vegetation index in the study region.
Author Contributions
Y.Q., Y.R., and D.L. jointly conceived and designed the experiments; Y.Q., S.L., H.W., X.L., and D.L. developed the processing program and wrote the paper; S.L., H.W., and X.L. jointly performed the experiments and analyzed data; Y.Q., Y.R., J.W., and D.L. reviewed and edited the paper as supervisors. All authors have read and agreed to the published version of the manuscript.
Funding
This research was funded by the Strategic Priority Research Program of the Chinese Academy of Sciences (XDA20100101), and supported by the National Key Research and Development Program of China (Grant No. 2019YFC0507404).
Institutional Review Board Statement
Not applicable.
Informed Consent Statement
Not applicable.
Data Availability Statement
The data presented in this study are available on request from the corresponding author.
Conflicts of Interest
The authors declare no conflict of interest.
References
- Everdingen, V. Multi-Language Glossary of Permafrost and Related Ground-Ice Terms; National Snow and Ice Data Center: Boulder, CO, USA, 2005; p. 90. [Google Scholar]
- Cheng, G. Problems on Zonation of High-Altitude Permafrost. Acta Geogr. Sin. 1984, 39, 185–193. [Google Scholar]
- Ran, Y.; Li, X.; Cheng, G. Climate warming over the past half century has led to thermal degradation of permafrost on the Qinghai–Tibet Plateau. Cryosphere 2018, 12, 595–608. [Google Scholar] [CrossRef] [Green Version]
- Wu, Q.; Zhang, T.; Liu, Y. Thermal state of the active layer and permafrost along the Qinghai-Xizang (Tibet) Railway from 2006 to 2010. Cryosphere 2012, 6, 607–612. [Google Scholar] [CrossRef] [Green Version]
- Luo, D.; Jin, H.; Jin, X.; He, R.; Li, X.; Muskett, R.R.; Marchenko, S.S.; Romanovsky, V.E. Elevation-dependent thermal regime and dynamics of frozen ground in the Bayan Har Mountains, northeastern Qinghai-Tibet Plateau, SW China. Permafr. Periglac. Process. 2018, 29, 257–270. [Google Scholar] [CrossRef]
- Wu, J.; Sheng, Y.; Yu, H.; Li, J. Permafrost in the middle-east section of Qilian Mountains (I): Distribution of permafrost. J. Glaciol. Geocryol. 2007, 29, 418–425. [Google Scholar]
- Wu, J.; Sheng, Y.; Yu, H.; Li, J. Permafrost in the middle-east section of Qilian Mountains (II): Characters of permafrost. J. Glaciol. Geocryol. 2007, 29, 426–432. [Google Scholar]
- Wu, J.; Sheng, Y.; Li, J.; Wang, J. Permafrost in Source Areas of Shule River in Qilian Mountains. Acta Geogr. Sin. 2009, 64, 571–580. [Google Scholar]
- Wang, S.; Sheng, Y.; Wu, J.; Li, J.; Chen, J. The characteristics and changing tendency of permafrost in the source regions of the Datong River, Qilian Mountains. J. Glaciol. Geocryol. 2015, 37, 27–37. [Google Scholar]
- Cheng, G.; Zhao, L.; Li, R.; Wu, X.; Sheng, Y.; Hu, G.; Zou, D.; Jin, H.; Li, X.; Wu, Q. Characteristic, changes and impacts of permafrost on Qinghai-Tibet Plateau. Chinese Sci. Bull. 2019, 64, 2783–2795. [Google Scholar] [CrossRef] [Green Version]
- Biskaborn, B.K.; Smith, S.L.; Noetzli, J.; Matthes, H.; Vieira, G.; Streletskiy, D.A.; Schoeneich, P.; Romanovsky, V.E.; Lewkowicz, A.G.; Abramov, A.; et al. Permafrost is warming at a global scale. Nat. Commun. 2019, 10, 264. [Google Scholar] [CrossRef] [Green Version]
- Wu, Q.; Hou, Y.; Yun, H.; Liu, Y. Changes in active-layer thickness and near-surface permafrost between 2002 and 2012 in alpine ecosystems, Qinghai–Xizang (Tibet) Plateau, China. Glob. Planet. Chang. 2015, 124, 149–155. [Google Scholar] [CrossRef]
- Cao, B.; Zhang, T.; Peng, X.; Mu, C.; Wang, Q.; Zheng, L.; Wang, K.; Zhong, X. Thermal Characteristics and Recent Changes of Permafrost in the Upper Reaches of the Heihe River Basin, Western China. J. Geophys. Res. Atmos. 2018, 123, 7935–7949. [Google Scholar] [CrossRef]
- Peng, X.; Zhang, T.; Frauenfeld, O.W.; Wang, S.; Qiao, L.; Du, R.; Mu, C. Northern Hemisphere greening in association with warming permafrost. J. Geophys. Res. Biogeosciences 2020, 125, 125. [Google Scholar] [CrossRef]
- Way, R.G.; Lewkowicz, A.G.; Zhang, Y. Characteristics and fate of isolated permafrost patches in coastal Labrador, Canada. Cryosphere 2018, 12, 2667–2688. [Google Scholar] [CrossRef] [Green Version]
- Way, R.G.; Lewkowicz, A.G. Environmental controls on ground temperature and permafrost in Labrador, northeast Canada. Permafr. Periglac. Process. 2018, 29, 73–85. [Google Scholar] [CrossRef]
- Nitzbon, J.; Westermann, S.; Langer, M.; Martin, L.C.P.; Strauss, J.; Laboor, S.; Boike, J. Fast response of cold ice-rich permafrost in northeast Siberia to a warming climate. Nat. Commun. 2020, 11, 2201. [Google Scholar] [CrossRef]
- Wang, T.; Yang, D.; Yang, Y.; Piao, S.; Li, X.; Cheng, G.; Fu, B. Permafrost thawing puts the frozen carbon at risk over the Tibetan Plateau. Sci. Adv. 2020, 6, eaaz3513. [Google Scholar] [CrossRef]
- Mu, C.; Schuster, P.F.; Abbott, B.W.; Kang, S.; Guo, J.; Sun, S.; Wu, Q.; Zhang, T. Permafrost degradation enhances the risk of mercury release on Qinghai-Tibetan Plateau. Sci. Total. Environ. 2020, 708, 135127. [Google Scholar] [CrossRef]
- Zhang, Z.; Wang, M.; Wu, Z.; Liu, X. Permafrost Deformation Monitoring Along the Qinghai-Tibet Plateau Engineering Corridor Using InSAR Observations with Multi-Sensor SAR Datasets from 1997–2018. Sensors 2019, 19, 5306. [Google Scholar] [CrossRef] [Green Version]
- Guo, D.; Yang, M.; Wang, H. Characteristics of land surface heat and water exchange under different soil freeze/thaw conditions over the central Tibetan Plateau. Hydrol. Process. 2011, 25, 2531–2541. [Google Scholar] [CrossRef]
- Stiegler, C.; Johansson, M.; Christensen, T.R.; Mastepanov, M.; Lindroth, A. Tundra permafrost thaw causes significant shifts in energy partitioning. Tellus B Chem. Phys. Meteorol. 2016, 68, 1. [Google Scholar] [CrossRef] [Green Version]
- Yao, T.; Thompson, L.; Yang, W.; Yu, W.; Gao, Y.; Guo, X.; Yang, X.; Duan, K.; Zhao, H.; Xu, B.; et al. Different glacier status with atmospheric circulations in Tibetan Plateau and surroundings. Nat. Clim. Chang. 2012, 2, 663–667. [Google Scholar] [CrossRef]
- Immerzeel, W.W.; Van Beek, L.P.; Bierkens, M.F. Climate change will affect the Asian water towers. Science 2010, 328, 1382–1385. [Google Scholar] [CrossRef] [PubMed]
- Xu, X.; Lu, C.; Shi, X.; Gao, S. World water tower: An atmospheric perspective. Geophys. Res. Lett. 2008, 35, 20815. [Google Scholar] [CrossRef]
- Yao, T.; Wu, G.; Xu, B.; Wang, W.; Gao, J.; An, B. Asian Water Tower Change and Its Impacts. Bull. Chin. Acad. Sci. 2019, 34, 1203–1209. [Google Scholar] [CrossRef]
- Zhao, S.; Cheng, W.; Zhou, C.; Chen, X.; Chen, J. Simulation of decadal alpine permafrost distributions in the Qilian Mountains over past 50 years by using Logistic Regression Model. Cold Reg. Sci. Technol. 2012, 73, 32–40. [Google Scholar] [CrossRef]
- Ran, Y.; Li, X.; Cheng, G.; Zhang, T.; Wu, Q.; Jin, H.; Jin, R. Distribution of Permafrost in China: An Overview of Existing Permafrost Maps. Permafr. Periglac. Process. 2012, 23, 322–333. [Google Scholar] [CrossRef]
- Li, S.; Cheng, G. Map of Permafrost on Qinghai-Tibetan Plateau (1:3,000,000); Gansu Culture Press: Lanzhou, China, 1996. [Google Scholar]
- Zhou, Y.; Qiu, G.; Guo, D.; Cheng, G.; Li, S. Geocryology in China; Science Press: Beijing, China, 2000; p. 450. [Google Scholar]
- Cheng, W.; Zhao, S.; Zhou, C.; Chen, X. Simulation of the Decadal Permafrost Distribution on the Qinghai-Tibet Plateau (China) over the Past 50 Years. Permafr. Periglac. Process. 2012, 23, 292–300. [Google Scholar] [CrossRef]
- Zhao, S.; Zhang, S.; Cheng, W.; Zhou, C. Model Simulation and Prediction of Decadal Mountain Permafrost Distribution Based on Remote Sensing Data in the Qilian Mountains from the 1990s to the 2040s. Remote Sens. 2019, 11, 183. [Google Scholar] [CrossRef] [Green Version]
- Guo, D.; Wang, H. Simulation of permafrost and seasonally frozen ground conditions on the Tibetan Plateau, 1981-2010. J. Geophys. Res. Atmos. 2013, 118, 5216–5230. [Google Scholar] [CrossRef]
- Wang, X.; Chen, R.; Han, C.; Yang, Y.; Liu, J.; Liu, Z.; Song, Y. Response of frozen ground under climate change in the Qilian Mountains, China. Quat. Int. 2019, 523, 10–15. [Google Scholar] [CrossRef]
- Li, X.; Gou, X.; Wang, N.; Sheng, Y.; Jin, H.; Qi, Y.; Song, X.; Hou, F.; Li, Y.; Zhao, C.; et al. Tightening ecological management facilitates green development in the Qilian Mountains. Chin. Sci. Bull. 2019, 64, 2928–2937. [Google Scholar] [CrossRef] [Green Version]
- Zhongqiong, Z.; Qingbai, W.; Guanli, J.; Siru, G.; Ji, C.; Yongzhi, L. Changes in the permafrost temperatures from 2003 to 2015 in the Qinghai-Tibet Plateau. Cold Reg. Sci. Technol. 2020, 169, 102904. [Google Scholar] [CrossRef]
- Liu, L.; Luo, D.; Wang, L.; Huang, Y.; Chen, F. Variability of soil freeze depth in association with climate change from 1901 to 2016 in the upper Brahmaputra River Basin, Tibetan Plateau. Theor. Appl. Clim. 2020, 142, 19–28. [Google Scholar] [CrossRef]
- Shi, Y.; Niu, F.; Lin, Z.; Luo, J. Freezing/thawing index variations over the circum-Arctic from 1901 to 2015 and the permafrost extent. Sci. Total. Environ. 2019, 660, 1294–1305. [Google Scholar] [CrossRef]
- Ran, Y.; Li, X.; Cheng, G.; Nan, Z.; Che, J.; Sheng, Y.; Wu, Q.; Jin, H.; Luo, D.; Tang, Z.; et al. Mapping the permafrost stability on the Tibetan Plateau for 2005–2015. Sci. China Earth Sci. 2020, 63, 1–18. [Google Scholar] [CrossRef]
- Wang, T.; Yang, D.; Fang, B.; Yang, W.; Qin, Y.; Wang, Y. Data-driven mapping of the spatial distribution and potential changes of frozen ground over the Tibetan Plateau. Sci. Total. Environ. 2019, 649, 515–525. [Google Scholar] [CrossRef]
- Gorelick, N.; Hancher, M.; Dixon, M.; Ilyushchenko, S.; Thau, D.; Moore, R. Google Earth Engine: Planetary-scale geospatial analysis for everyone. Remote Sens. Environ. 2017, 202, 18–27. [Google Scholar] [CrossRef]
- Shelestov, A.; Lavreniuk, M.; Kussul, N.; Novikov, A.; Skakun, S. Exploring Google Earth Engine Platform for Big Data Processing: Classification of Multi-Temporal Satellite Imagery for Crop Mapping. Front. Earth Sci. 2017, 5, 17. [Google Scholar] [CrossRef] [Green Version]
- Xiong, J.; Thenkabail, P.; Tilton, J.; Gumma, M.; Teluguntla, P.; Oliphant, A.; Congalton, R.; Yadav, K.; Gorelick, N. Nominal 30-m Cropland Extent Map of Continental Africa by Integrating Pixel-Based and Object-Based Algorithms Using Sentinel-2 and Landsat-8 Data on Google Earth Engine. Remote Sens. 2017, 9, 1065. [Google Scholar] [CrossRef] [Green Version]
- Chen, B.; Xiao, X.; Li, X.; Pan, L.; Doughty, R.; Ma, J.; Dong, J.; Qin, Y.; Zhao, B.; Wu, Z.; et al. A mangrove forest map of China in 2015: Analysis of time series Landsat 7/8 and Sentinel-1A imagery in Google Earth Engine cloud computing platform. ISPRS J. Photogramm. Remote Sens. 2017, 131, 104–120. [Google Scholar] [CrossRef]
- Mahdianpari, M.; Brisco, B.; Granger, J.E.; Mohammadimanesh, F.; Salehi, B.; Banks, S.; Homayouni, S.; Bourgeau-Chavez, L.; Weng, Q. The Second Generation Canadian Wetland Inventory Map at 10 Meters Resolution Using Google Earth Engine. Can. J. Remote Sens. 2020, 46, 360–375. [Google Scholar] [CrossRef]
- Patel, N.N.; Angiuli, E.; Gamba, P.; Gaughan, A.; Lisini, G.; Stevens, F.R.; Tatem, A.J.; Trianni, G. Multitemporal settlement and population mapping from Landsat using Google Earth Engine. Int. J. Appl. Earth Obs. Geoinformation 2015, 35, 199–208. [Google Scholar] [CrossRef] [Green Version]
- Luo, D.-L.; Jin, H.-J.; Du, H.-Q.; Li, C.; Ma, Q.; Duan, S.-Q.; Li, G.-S. Variation of alpine lakes from 1986 to 2019 in the Headwater Area of the Yellow River, Tibetan Plateau using Google Earth Engine. Adv. Clim. Chang. Res. 2020, 11, 11–21. [Google Scholar] [CrossRef]
- Donchyts, G.; Baart, F.; Winsemius, H.; Gorelick, N.; Kwadijk, J.; Van De Giesen, N. Earth’s surface water change over the past 30 years. Nat. Clim. Chang. 2016, 6, 810–813. [Google Scholar] [CrossRef]
- Wang, C.; Jia, M.; Chen, N.; Wang, W. Long-Term Surface Water Dynamics Analysis Based on Landsat Imagery and the Google Earth Engine Platform: A Case Study in the Middle Yangtze River Basin. Remote Sens. 2018, 10, 1635. [Google Scholar] [CrossRef] [Green Version]
- Lunardini, V.J. Theory of n-factors and correlation of data. In Proceedings of the Third International Conference on Permafrost, Edmonton, AB, Canada, 10–13 July 1978; pp. 40–46. [Google Scholar]
- Smith, M.W.; Riseborough, D.W. Permafrost monitoring and detection of climate change. Permafr. Periglac. Process. 1996, 7, 301–309. [Google Scholar] [CrossRef]
- Lunardini, V.J. Heat Transfer in Cold Climates; Van Nostrand Reinhold Company: New York, NY, USA, 1981. [Google Scholar]
- Zhang, G.; Yao, T.; Piao, S.; Bolch, T.; Xie, H.; Chen, D.; Gao, Y.; O’Reilly, C.M.; Shum, C.K.; Yang, K.; et al. Extensive and drastically different alpine lake changes on Asia’s high plateaus during the past four decades. Geophys. Res. Lett. 2017, 44, 252–260. [Google Scholar] [CrossRef] [Green Version]
- Cao, B.; Gruber, S.; Zhang, T.; Li, L.; Peng, X.; Wang, K.; Zheng, L.; Shao, W.; Guo, H. Spatial variability of active layer thickness detected by ground-penetrating radar in the Qilian Mountains, Western China. J. Geophys. Res. Earth Surf. 2017, 122, 574–591. [Google Scholar] [CrossRef]
- Wang, Q.; Zhang, T.; Wu, J.; Peng, X.; Zhong, X.; Mu, C.; Wang, K.; Wu, Q.; Cheng, G. Investigation on permafrost distribution over the upper reaches of the Heihe River in the Qilian Mountains. J. Glaciol. Geocryol. 2013, 35, 19–29. [Google Scholar]
- Wang, Q.; Jin, H.; Zhang, T.; Cao, B.; Peng, X.; Wang, K.; Xiao, X.; Guo, H.; Mu, C.; Li, L. Hydro-thermal processes and thermal offsets of peat soils in the active layer in an alpine permafrost region, NE Qinghai-Tibet plateau. Glob. Planet. Chang. 2017, 156, 1–12. [Google Scholar] [CrossRef]
- Chen, G.; Peng, M.; Huang, R.; Lu, X. Vegetation characteristics and its distribution of Qilian Mountain region. Acta Bot. Sin. 1994, 36, 63–72. [Google Scholar]
- Li, J.; Sheng, Y.; Chen, J.; Zhang, B.; Wu, J.; Zhang, X. Characteristics of ground temperatures and influencing factors of permafrost development and distribution in the Source Region of Datong River. Prog. Geogr. 2011, 30, 827–836. [Google Scholar]
- Qin, Y.; Lei, H.; Yang, D.; Gao, B.; Wang, Y.; Cong, Z.; Fan, W. Long-term change in the depth of seasonally frozen ground and its ecohydrological impacts in the Qilian Mountains, northeastern Tibetan Plateau. J. Hydrol. 2016, 542, 204–221. [Google Scholar] [CrossRef]
- Zhao, L.; Zou, D.; Hu, G.; Du, E.; Pang, Q.; Xiao, Y.; Li, R.; Sheng, Y.; Wu, X.; Sun, Z.; et al. Changing climate and the permafrost environment on the Qinghai–Tibet (Xizang) plateau. Permafr. Periglac. Process. 2020, 31, 396–405. [Google Scholar] [CrossRef]
- Mu, C.; Shang, J.; Zhang, T.; Fan, C.; Wang, S.; Peng, X.; Zhong, W.; Zhang, F.; Mu, M.; Jia, L. Acceleration of thaw slump during 1997–2017 in the Qilian Mountains of the northern Qinghai-Tibetan plateau. Landslides 2020, 17, 1051–1062. [Google Scholar] [CrossRef]
- Li, J.; Sheng, Y.; Chen, J.; Zhang, B.; Wu, J.; Zhang, X. Modeling permafrost temperature distribution and analyzing zoning characteristics of permafrost in the source region of the Datong River. J. China Univ. Min. Technol. 2012, 41, 145–152. [Google Scholar]
- Li, J.; Sheng, Y.; Wu, J.; Wang, J.; Zhang, B.; Ye, B.; Zhang, X.; Qin, X. Application of the equivalent-elevation approach to alpine permafrost distribution models in the upper reaches of the Shule River, Qilian Mountains. J. Glaciol. Geocryol. 2011, 33, 357–363. [Google Scholar]
- Xu, X.; Wang, J.; Zhang, L. Physics of Frozen Soil; Science Publish House: Beijing, China, 2010; p. 351. [Google Scholar]
- Shi, X.; Yu, D.; Warner, E.; Pan, X.; Petersen, G.; Gong, Z.; Weindorf, D. Soil database of 1:1,000,000 digital soil survey and reference system of the Chinese genetic soil classification system. Soil Horizons 2004, 45, 129–136. [Google Scholar] [CrossRef]
- Smith, M.W.; Riseborough, D.W. Climate and the limits of permafrost: A zonal analysis. Permafr. Periglac. Process. 2002, 13, 1–15. [Google Scholar] [CrossRef]
- Riseborough, D.; Shiklomanov, N.; Etzelmuller, B.; Gruber, S.; Marchenko, S. Recent advances in permafrost modelling. Permafr. Periglac. Process. 2008, 19, 137–156. [Google Scholar] [CrossRef]
- Romanovsky, V.E.; Osterkamp, T.E. Interannual variations of the thermal regime of the active layer and near-surface permafrost in northern Alaska. Permafr. Periglac. Process. 1995, 6, 313–335. [Google Scholar] [CrossRef]
- Ran, Y.; Li, X.; Jin, R.; Guo, J. Remote Sensing of the Mean Annual Surface Temperature and Surface Frost Number for Mapping Permafrost in China. Arctic Antarct. Alp. Res. 2015, 47, 255–265. [Google Scholar] [CrossRef] [Green Version]
- Ghafarian Malamiri, H.; Rousta, I.; Olafsson, H.; Zare, H.; Zhang, H. Gap-Filling of MODIS Time Series Land Surface Temperature (LST) Products Using Singular Spectrum Analysis (SSA). Atmosphere 2018, 9, 334. [Google Scholar] [CrossRef] [Green Version]
- Zou, D.; Zhao, L.; Sheng, Y.; Chen, J.; Hu, G.; Wu, T.; Wu, J.; Xie, C.; Wu, X.; Pang, Q.; et al. A new map of permafrost distribution on the Tibetan Plateau. Cryosphere 2017, 11, 2527–2542. [Google Scholar] [CrossRef] [Green Version]
- Luo, D.; Liu, L.; Jin, H.; Wang, X.; Chen, F. Characteristics of ground surface temperature at Chalaping in the Source Area of the Yellow River, northeastern Tibetan Plateau. Agric. For. Meteorol. 2020, 281, 107819. [Google Scholar] [CrossRef]
- Luo, D.L.; Jin, H.J.; He, R.X.; Wang, X.F.; Muskett, R.R.; Marchenko, S.S.; Romanovsky, V.E. Characteristics of water-heat exchanges and inconsistent surface temperature changes at an elevational permafrost site on the Qinghai-Tibet Plateau. J. Geophys. Res. Atmos. 2018, 123, 10057–10075. [Google Scholar] [CrossRef]
- Luo, D.; Jin, H.; Marchenko, S.S.; Romanovsky, V.E. Difference between near-surface air, land surface and ground surface temperatures and their influences on the frozen ground on the Qinghai-Tibet Plateau. Geoderma 2018, 312, 74–85. [Google Scholar] [CrossRef]
- Yin, G.; Niu, F.; Lin, Z.; Luo, J.; Liu, M. Effects of local factors and climate on permafrost conditions and distribution in Beiluhe basin, Qinghai-Tibet Plateau, China. Sci. Total. Environ. 2017, 581-582, 472–485. [Google Scholar] [CrossRef]
- Klene, A.E.; Nelson, F.E.; Shiklomanov, N.I.; Hinkel, K.M. The N-factor in Natural Landscapes: Variability of Air and Soil-Surface Temperatures, Kuparuk River Basin, Alaska, U.S.A. Arctic Antarct. Alp. Res. 2001, 33, 140–148. [Google Scholar] [CrossRef]
- Luo, D.; Jin, H.; Wu, Q.; Bense, V.F.; He, R.; Ma, Q.; Gao, S.; Jin, X.; Lu, L. Thermal regime of warm-dry permafrost in relation to ground surface temperature in the Source Areas of the Yangtze and Yellow rivers on the Qinghai-Tibet Plateau, SW China. Sci. Total. Environ. 2018, 618, 1033–1045. [Google Scholar] [CrossRef] [PubMed]
- Li, M.; Wu, B.; Yan, C.; Zhou, W. Estimation of Vegetation Fraction in the Upper Basin of Miyun Reservoir by Remote Sensing. Resour. Sci. 2004, 26, 153–159. [Google Scholar]
- Willmott, C.J.; Matsuura, K. Advantages of the mean absolute error (MAE) over the root mean square error (RMSE) in assessing average model performance. Clim. Res. 2005, 30, 79–82. [Google Scholar] [CrossRef]
- Gruber, S. Derivation and analysis of a high-resolution estimate of global permafrost zonation. Cryosphere 2012, 6, 221–233. [Google Scholar] [CrossRef] [Green Version]
- Obu, J.; Westermann, S.; Bartsch, A.; Berdnikov, N.; Christiansen, H.H.; Dashtseren, A.; Delaloye, R.; Elberling, B.; Etzelmüller, B.; Kholodov, A.; et al. Northern Hemisphere permafrost map based on TTOP modelling for 2000–2016 at 1km2 scale. Earth-Sci. Rev. 2019, 193, 299–316. [Google Scholar] [CrossRef]
- Yan, D.; Wünnemann, B. Late Quaternary water depth changes in Hala Lake, northeastern Tibetan Plateau, derived from ostracod assemblages and sediment properties in multiple sediment records. Quat. Sci. Rev. 2014, 95, 95–114. [Google Scholar] [CrossRef]
- Karunaratne, K.; Burn, C. Freezing n-factors in discontinuous permafrost terrain, Takhini River, Yukon Territory, Canada. In Proceedings of the 8th International Conference on Permafrost, Zurich, Switzerland, 21–25 July 2003; University of Zurich: Irchel, Switzerland, 2003; pp. 519–524. [Google Scholar]
- Jin, H.; Luo, D.; Wang, S.; Lü, L.; Wu, J. Spatiotemporal variability of permafrsot degradation on the Qinghai-Tibet Plateau. Sci. Cold Arid Reg. 2011, 3, 281–305. [Google Scholar] [CrossRef]
- French, H.M. The Periglacial Environment, 4th ed.; John Wiley & Sons Ltd: Hoboken, NJ, USA, 2018; p. 515. [Google Scholar]
- Nan, Z.; Gao, Z.; Li, S.; Wu, T. Permafrost changes in the northern limit of permafrost on the Qinghai-Tibet Plateau in the last 30 years. Acta Geogr. Sin. 2003, 58, 817–823. [Google Scholar]
- Harris, S.A.; Brouchkov, A.; Guodong, C. Geocryology: An. Introduction to Frozen Ground, 1st ed.; CRC Press: Boca Raton, FL, USA, 2018; p. 810. [Google Scholar]
- Wang, S.; Chen, X.; Zhang, Z. Permafrost distribution in the Dabanshan Pass Section of Ning-Zhang highway in Eastern Qilian Mountains. J. Glaciol. Geocryol. 1995, 17, 184–188. [Google Scholar]
- Cheng, G.; Dramis, F. Distribution of mountain permafrost and climate. Permafr. Periglac. Process. 1992, 3, 83–91. [Google Scholar] [CrossRef]
Figure 1.
Geographical background of the Qilian Mountains. QHL and Har L denote the Qinghai Lake and Hala Lake, respectively. BH and ALT denote the boreholes and active layer thickness sites used to validate the model in this study, respectively, which were mainly collected from documents [6,7,13,54,55,56].

Figure 2.
Comparisons of calculated temperature at the top of the permafrost or the bottom of the maximum frozen soil depth (MFSD) (TTOP) and measured TTOP (a), as well as calculated active layer thickness (ALT) and measured ALT (b), in the Qilian Mountains. Red line and dashed line demonstrate the linear trend and 1:1, respectively.

Figure 3.
Comparisons of calculated permafrost extent to the published permafrost maps of NPD (TP) (a) and GlobalPF (b) in the Qilian Mountains. NPD (TP) indicates the permafrost map compiled by Zou et al., 2017; GlobalPF indicates the permafrost map compiled by Obu et al., 2019; and TTOP indicates the permafrost map compiled in this study. 0 and 1 represent permafrost and no permafrost, respectively. The first and second numeric numbers indicate published permafrost maps and the calculated results in this study, respectively.

Figure 4.
Spatial distribution of the TTOP in the Qilian Mountains averaged during 2004–2019.

Figure 5.
Permafrost variations indicated by the TTOP in the Qilian Mountains from 2004 to 2019.

Figure 6.
Spatial distribution of the active layer thickness (ALT, m) in the Qilian Mountains.

Figure 7.
Temporal variations of active layer thickness (ALT, m) in the Qilian Mountains from 2004 to 2019.
Figure 7.
Temporal variations of active layer thickness (ALT, m) in the Qilian Mountains from 2004 to 2019.

Figure 8.
Spatial distribution of maximum frozen soil depth (MFSD, m) in the Qilian Mountains.

Figure 9.
Spatiotemporal variations of maximum frozen soil depth (MFSD, m) in the Qilian Mountains from 2004 to 2019.
Figure 9.
Spatiotemporal variations of maximum frozen soil depth (MFSD, m) in the Qilian Mountains from 2004 to 2019.

Figure 10.
Correlation of the TTOP between GlobalPF [74] and this study (QLM_TTOP).
Figure 10.
Correlation of the TTOP between GlobalPF [74] and this study (QLM_TTOP).

Figure 11.
Correlation between altitude (H) and the temperature at the top of the permafrost (a) or the bottom of maximum frozen soil depth (b) (TTOP), active layer thickness (ALT) (c), and maximum frozen soil depth (MFSD) (d) in the Qilian Mountains.
Figure 11.
Correlation between altitude (H) and the temperature at the top of the permafrost (a) or the bottom of maximum frozen soil depth (b) (TTOP), active layer thickness (ALT) (c), and maximum frozen soil depth (MFSD) (d) in the Qilian Mountains.


Table 1.
Comparisons of permafrost area in this study and three published permafrost maps in the Qilian Mountains.
Table 1.
Comparisons of permafrost area in this study and three published permafrost maps in the Qilian Mountains.
| GPF–TTOP(km2) | NPD–TTOP (km2) | TTOP–GPF (km2) | TTOP–NPD (km2) | |
|---|---|---|---|---|
| Difference | 17,961.2 | 8556.7 | 1906.3 | 9460.7 |
| Difference/TTOP (%) | 9.86% | 4.70% | 1.05% | 5.19% |
Table 2.
Kappa coefficients of the NPD_TP and GlobalPF and this study. The first column presents the calculated result in this study, and the rows present the classification in NPD_TP and GlobalPF, respectively.
Table 2.
Kappa coefficients of the NPD_TP and GlobalPF and this study. The first column presents the calculated result in this study, and the rows present the classification in NPD_TP and GlobalPF, respectively.
| NTP_TP | GlobalPF | |||||
|---|---|---|---|---|---|---|
| 0 | 1 | Sum | 0 | 1 | Sum | |
| 0 | 69,910 | 8797 | 78,707 | 96,407 | 22,990 | 119,397 |
| 1 | 6562 | 78,042 | 84,604 | 1956 | 103,236 | 105,192 |
| Sum | 76,472 | 86,839 | 163,311 | 98,363 | 126,226 | 224,589 |
| Kappa | 0.811 | 0.780 | ||||
Note: NPD_TP denotes new permafrost distribution on the Tibetan Plateau [71] and GlobalPF denotes the northern hemisphere permafrost map compiled by Obu et al., (2019). 0 and 1 represent permafrost and no permafrost, respectively.
Publisher’s Note: MDPI stays neutral with regard to jurisdictional claims in published maps and institutional affiliations. |
© 2021 by the authors. Licensee MDPI, Basel, Switzerland. This article is an open access article distributed under the terms and conditions of the Creative Commons Attribution (CC BY) license (http://creativecommons.org/licenses/by/4.0/).
Share and Cite
MDPI and ACS Style
Qi, Y.; Li, S.; Ran, Y.; Wang, H.; Wu, J.; Lian, X.; Luo, D. Mapping Frozen Ground in the Qilian Mountains in 2004–2019 Using Google Earth Engine Cloud Computing. Remote Sens. 2021, 13, 149. https://doi.org/10.3390/rs13010149
AMA Style
Qi Y, Li S, Ran Y, Wang H, Wu J, Lian X, Luo D. Mapping Frozen Ground in the Qilian Mountains in 2004–2019 Using Google Earth Engine Cloud Computing. Remote Sensing. 2021; 13(1):149. https://doi.org/10.3390/rs13010149
Chicago/Turabian StyleQi, Yuan, Shiwei Li, Youhua Ran, Hongwei Wang, Jichun Wu, Xihong Lian, and Dongliang Luo. 2021. "Mapping Frozen Ground in the Qilian Mountains in 2004–2019 Using Google Earth Engine Cloud Computing" Remote Sensing 13, no. 1: 149. https://doi.org/10.3390/rs13010149
Note that from the first issue of 2016, this journal uses article numbers instead of page numbers. See further details here.