A Partition-Based Detection of Urban Villages Using High-Resolution Remote Sensing Imagery in Guangzhou, China


1
State Key Laboratory of Resources and Environmental Information System, Institute of Geographic Sciences and Natural Resources Research, Chinese Academy of Sciences, Beijing 100101, China
2
College of Resources and Environment, University of Chinese Academy of Sciences, Beijing 100190, China
*
Author to whom correspondence should be addressed.
†
These authors contributed equally to this work.
Remote Sens. 2020, 12(14), 2334; https://doi.org/10.3390/rs12142334
Submission received: 10 June 2020
/
Revised: 9 July 2020
/
Accepted: 17 July 2020
/
Published: 21 July 2020
Abstract
:High-resolution remotely sensed imageries have been widely employed to detect urban villages (UVs) in highly urbanized regions, especially in developing countries. However, the understanding of the potential impacts of spatially and temporally differentiated urban internal development on UV detection is still limited. In this study, a partition-strategy-based framework integrating the random forest (RF) model, object-based image analysis (OBIA) method, and high-resolution remote sensing images was proposed for the UV-detection model. In the core regions of Guangzhou, four original districts were re-divided into five new zones for the subsequent object-based RF-detection of UVs with a series features, according to the different proportion of construction lands. The results show that the proposed framework has a good performance on UV detection with an average overall accuracy of 90.23% and a kappa coefficient of 0.8. It also shows the possibility of transferring samples and models into a similar area. In summary, the partition strategy is a potential solution for the improvement of the UV-detection accuracy through high-resolution remote sensing images in Guangzhou. We suggest that the spatiotemporal process of urban construction land expansion should be comprehensively understood so as to ensure an efficient UV-detection in highly urbanized regions. This study can provide some meaningful clues for city managers identifying the UVs efficiently before devising and implementing their urban planning in the future.
1. Introduction
Over the past half-century, urbanization has brought about irreversible changes worldwide, which have promoted social development and human progress [1,2]. However, it has also led to the problem of informal urban settlements (IUS) such as slums and urban villages (UVs) [3]. Besides poor infrastructure and typical morphological characteristics such as high density, small roof sizes, low building heights, less green space, and irregular patterns within cities, IUSs are also characterized by a large amount of floating and low-income population, as well as poor sanitation and disordered security in many megacities, especially in some developing countries [4,5,6,7,8,9]. Therefore, it is essential for city managers to obtain reliable and timely information of these IUSs within the cities before making effective policies for promoting sustainable urban development by means of reconstructing these IUSs [10,11].
Although IUSs appear as a worldwide phenomenon, it is a challenge to develop a universal definition of IUS because of different contexts between regions or countries, such as culture, social system, and geography [12,13]. In China, the term “urban village” is often used to describe the IUSs derived from villages near built-up areas while farmlands surrounding the villages were gradually swallowed up under the process of China urbanization, and the residences remained [14]. Besides unsanitary conditions, poor structural quality of housing, overcrowding, and insecure residential status [11,15], UVs, as the remainder of the rural-to-urban transformation, have moderate socioeconomic levels which are higher than that of the countryside, although lower than that of planned urban areas [12,16]. It has been widely acknowledged that IUSs differently appear in many cities, regions, or countries [12], however, the IUSs’ differences within the city caused by changes in planning policies during the urbanization process and the location relative to the urban expansion center, which are also significant for the accurate detection of IUSs, have often been neglected in the past.
With the increasing demand for large-scale monitoring in IUSs, remote sensing technologies, in particular high-resolution imagery, are widely used in retrieving and mapping IUSs [11,13,17]. Traditionally, the mapping of IUSs is implemented through visual interpretation based on remote sensing imageries by manual digitizing, which can provide high-quality maps of IUSs [12,17,18]. However, it relies on the experience of people who carry out the work and is labor intensive. It is also difficult to extract IUSs by pixel-based image analysis [12]. UVs are integral and complex communities with dense buildings; however, the pixel-based approach cannot consider the IUSs or the building as a whole [19].
In recent years, object-based image analysis (OBIA) has been a dominant paradigm in IUSs detection with high-resolution images [12,15]. This approach can fully utilize implicit information in the image and establish spatial context, and is thus widely used for detecting urban targets [12,19,20,21,22]. For example, by referring to Hofmann’s work [22], Kohli and her team proposed a generic slum ontology framework, and proved the potential of the OBIA method to detect slums under this framework. Their experiment in three subsets of Ahmedabad showed final accuracies ranging from 47% to 68% [23,24]. Similar methods were implemented for slums and UV detection in other cities, with an accuracy of over 68% [21,25,26]. For OBIA, image segmentation which can produce segments that correspond with target objects for subsequent analysis is a vital prerequisite [27]. Several studies focused on the optimal building or UV segmentation, such as using auxiliary data, combining spectral and spatial information and semantic image segmentation with convolutional neural networks (CNN), and these methods achieved significant effects [15,21,27,28,29]. Additionally, scene-based classification has made great advancements in UV detection in recent years [5]. A scene is a user-defined image block with various objects. Similarly, scene-based classification has an advantage in complex structures [30]. Huang and his team conducted a systematic study of scene-based methods for detecting UVs in Shenzhen and Wuhan with a kappa value of over 0.82 [5,31,32]. Liu also proposed a scene-based framework to implement dominant urban land use identification (including UVs) of the Haizhu District, Guangzhou, and the kappa value was around 0.83 [33]. As shown above, the object or scene-based method are effective in detecting UVs or slums.
Meanwhile, machine learning such as random forest (RF), support vector machine (SVM), and CNN are increasingly popular in IUSs detection for their good performance in classification with over 90% accuracy [15,34,35,36], although they need a large amount of high-quality training data, and are computationally demanding [17]. The most appropriate machine learning algorithm sometimes depends on the study area, subject, and equipment. Considerable research has been conducted on the detection of UVs and slums by scholars, and the accuracy is gradually raised by continuously developed technologies. However, it is not surprising to find that most studies selected a small representative area in the city as the study area, and the performance of most methods was locally adaptive and poor in another regions, as it is influenced by the local context and the history of city-level development.
Therefore, our study aims to (1) develop a UV-detection framework based on a partition strategy considering the course of spatial expansion of construction land in the core districts of Guangzhou, and to (2) explore the suitability of UV detection derived from the object-based classification with random forest (RF) algorithms using GF-2 images among the partitioned zones. The objective of this study can provide a useful framework for the extensive detection of UVs, and serve as a reference for monitoring urban environment and health, thereby propelling urban renewal and sustainable development.
2. Study Area and Data
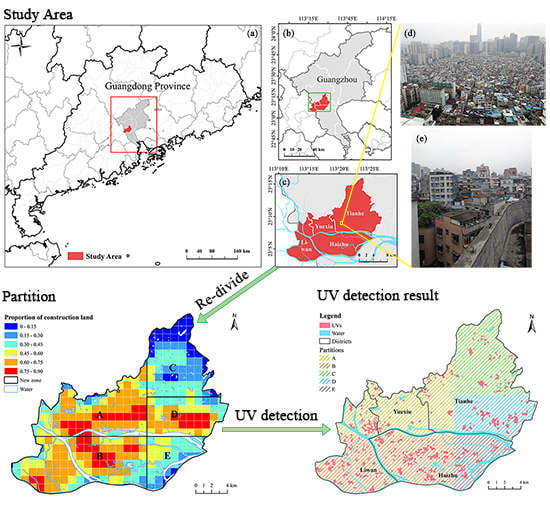
Guangzhou, the “South Gate” of China, is located in Guangdong Province, covering a total area of 7434 km2 (Figure 1). As the economic and cultural center of South China, Guangzhou has been steadily promoting the urbanization process, and the urbanization rate reached 86.46% in 2019 according to the Guangzhou Economic and Social Development Statistics Bulletin. Influenced by the establishment of Shenzhen Special Zone and Pearl River Delta since 1980s, immigrants poured to Guangzhou to seek employment, and the urban construction land has continuously sprawled over the past decades. This is one of the reasons why there are so many UVs in Guangzhou today [37]. According to our field survey, the UVs in Guangzhou usually have a relatively high building density with internal buildings less than 9 floors, and these UVs are often surrounded by skyscrapers. The landlords in UVs may add extra floors to the original building, resulting in the diversity of roof materials. In this study, we focus on the core area of Guangzhou, including the Yuexiu, Liwan, Haizhu, and Tianhe districts, for their particularly high urbanization levels among all districts in Guangzhou.
Four remote-sensing images by GF-2 satellite PMS1 sensor, accessed on 15 September, 2017, were used in this study (derived from China Centre for Resources Satellite Data and Application, http://www.cresda.com/CN/). The GF-2 satellite, launched in August 2014, was independently developed by China and has a high spatial resolution, high position accuracy, and fast maneuverability. The GF-2 satellite image has four multi-spectral bands with 4 m resolution (blue, green, red, near-infrared (NIR) bands) and one panchromatic band with 1 m resolution. Orthorectifications, radiometric calibration and fast line-of-sight atmospheric analysis of spectral hypercubes (FLAASH) were performed for all images. We also fused multispectral and panchromatic images by gram-schmidt spectral sharpening for preferable extraction, and the final spatial resolution was up to 1 m. Moreover, road and water data from Open Street Map (OSM, https://www.openstreetmap.org/) served as auxiliary data in the process of detection.
3. Methods
In this study, we proposed an object-based UV-detection framework with a partition strategy as illustrated in Figure 2. In this framework, the core districts of Guangzhou were first divided into five zones (A–E). Then, some significant features were selected to characterize the UVs in each zone. Finally, the RF model, integrating the segmented objects and selected features, was employed to extract the UVs from the GF2/PMS images. The classification and analysis were conducted by eCognition9.0 and R-3.5.3, and the image processing was performed using ArcGIS 10.3 and ENVI5.3. These processes can be found in detail below.
3.1. Partition Strategy
In comparison to other formal communities, IUSs often present a more crowded and cluttered pattern [11,12,17]. Among countries, cities, and even within a city, however, the IUSs are featured by different morphological characteristics, such as different densities and building heights (Figure S1, Supplementary Materials) [5,38]. For example, densities of IUSs in Asian cities tend to be higher than those of sub-Saharan Africa (SSA) cities [12]. Likewise, UVs are distinctive among cities due to different contexts and histories. Here, UVs in Guangzhou, Shenzhen, and Wuhan are briefly compared (Figure 3). The long history and rapid urbanization of Guangzhou led to the high density and diversity of UVs, which reflect characteristics of the city at different periods of development [39]. In comparison, although Shenzhen is an emerging city with a late start in urban construction, the UVs in Shenzhen are more systematic and orderly than those in Guangzhou [5,40]. Different from Guangzhou and Shenzhen, Wuhan is an inland city in central China, and the UVs in Wuhan have obvious sloping red roofs [41].
In addition, the spatial pattern, planning policies, and management of the city are temporally different in the courses of urban development, causing various appearances of UVs across the city [42,43]. For example, three slums in Mumbai present distinct structural heterogeneity at block level determined by their location, the time that they existed, and whether they have been renewed [43]. Similarly, the districts in Guangzhou have undergone a multi-stage urban expansion over the past few decades, which resulted in some obviously differentiated regions, including old areas (Yuexiu and northern Liwan), newly and rapidly urbanized areas (eastern Haizhu and southern Tianhe), and several transition zones between the old and new areas [44]. For this point, the formation and appearance of UVs in these districts should be differentially considered for UV detection. Hence, the study area was divided into several new zones before detecting UVs in them by means of high-resolution remote sensing images. According to the general expansion trend of local construction land revealed by an earlier study [45], the proportion of construction land at the 1 × 1 km level derived from our previous work [46] was calculated in ArcGIS (10.3 ESRI) in order to fulfil the partition strategy. In this way, the original four districts were clearly re-divided into five zones with various proportions of construction land (Figure 4).
3.2. Multi-Resolution Image Segmentation
Object-based image analysis is an efficient technology for identifying complex targets in which segments are used as elementary units [47]. The method provides more information about objects, such as spectral information, shape, texture, as well as interlayer relationship, and it can preserve target boundaries [48]. Image segmentation is a significant step for OBIA. It partitions an image into several segments composed of neighboring pixels with similar features as basic units for classification [15]. The multi-resolution segmentation used in this study is one of the most popular approaches in segmenting remote sensing images. The multi-resolution segmentation procedure starts with a single pixel and consecutively merges the surrounding pixels based on relative homogeneity criteria, until the set “scale” is reached [49]. The detail explanation of parameters can be found in an earlier study [50].
The segmentation for different ground targets can be implemented by adjusting the scale parameter, color/shape, and smoothness/compactness weights. In this study, segmentation layers at building level and block level were created for feature computation and classification. Meanwhile, considering the complexity of UVs, some natural community boundaries (e.g., road network and water data from OSM and continuously distributed vegetation data extracted by normalized difference vegetation index (NDVI)) were applied as auxiliary data to constrain the shape of the segmented patches [21]. Three parameters of the building level segmentation layer were set to 100, 0.8, and 0.5 by further trial with reference to the estimation of scale parameter (ESP) tool results [51]. On the basis of the building level segmentation, parameters were adjusted to 320, 0.9, and 0.8 to obtain the block level segmentation. The building level segments can be used as sub-objects of the block level segments to participate in feature computation, and the block level segments were applied to subsequent classification.
3.3. Feature Selection
According to several notable characteristics summarized in many previous studies [12,23,29,52] and the conversion between observation, expert knowledge, and image-based indicators [7,23], a set of image features were selected and applied to distinguish the UVs from non-UVs (including formal communities, commercial and industrial areas) in this study (Table 1). Meanwhile, all features were computed and assigned to the block level segmentation objects.
Differing from formal communities or commercial and industrial areas, UVs have several typical characteristics in terms of spectrum, pattern, and opening space.
Spectrum: The unauthorized extension on the top floor of the building in order to increase rent incomes results in more heterogeneous roof materials in UVs than those in formal communities or commercial and industrial areas [53]. Therefore, we selected the mean and standard deviation (SD) for four original image bands and the first principal component (PCA) possessing the most image information after dimension reduction, as well as the brightness, maximum difference (Max_Diff) between bands, and standard deviation of sub-objects (Mean of SO: StdDev) to distinguish UVs and non-UVs.
Pattern: The most typical characteristic of UVs in the image is the narrow, crowded, and disordered building layout. Therefore, the area, density, shape index, gray level co-occurrence matrix (GLCM), and mean area of sub-objects (Area of SO: Mean) were considered to express the pattern of UVs. In addition, although there are many texture features based on GLCM, some of them are similar. Consequently, only the GLCM texture features listed in Table 1, which have shown effectiveness for UV detection in previous studies [18,34,46], were used.
Opening space: Generally, formal communities have sufficient green space to create a suitable living environment. However, due to the lack of management, there is little opening space, such as public green space and outdoor activity areas within UVs. Thus, opening space features were characterized by NDVI, Veg_P, and Shadow_P.
There were 23 specific features in total, and most of them were available from the Trimble eCognition 9.0, except Veg_P and Shadow_P, which were computed in ArcGIS 10.3. The details are shown in Table 1.
3.4. Classification Process
3.4.1. Sample Selection
The vegetation, water, and road in the GF-2/PMS imageries were masked by auxiliary data mentioned in Section 3.2 before selecting the samples for training and testing the UV-detection model. In other words, these samples (UVs and non-UVs) were merely chosen from the construction land in this study. There were 270 samples moderately selected in total, including 81 UVs and 189 non-UVs samples equally distributed in five zones, according to the total number of segments in each zone (Figure 5 and Table 2). Meanwhile, these samples were randomly grouped into training (70%) and testing (30%) sets.
3.4.2. Model Building
In this study, the RF algorithm (RandomForest package in R) was used to classify UVs and non-UVs. For RF, multiple independent decision trees are combined to improve the prediction accuracy, and the final classification is determined by voting [57]. The RF classifier can process high-dimensional data without feature selection and assess the importance of features. Therefore, the training samples with selected features were directly used as input data to train the model.
The performance of models is influenced by vital parameters. The RF model includes two main parameters: ntree and mtry; the former denotes the number of trees and the latter decides the number of random variables used at each split [58,59]. We traversed possible values to find the optimal one that minimizes the model error. The performance of the training model with different parameter values was validated through 10-fold cross-validation whereby all samples were randomly divided into 10 folds and each fold was in turn used for test data, and the final accuracy was the average of the 10 validation results. In addition, we employed mean decrease Gini (MDG) to measure feature importance in RF because of its robustness to small perturbations of the data. Mean decrease Gini is the sum of all decreases in Gini impurity due to the split formed by given variables, and is widely used for ranking features [60].
3.4.3. Accuracy Assessment
To evaluate the efficiency of the current UV-detection method, we obtained a series of ground truth UVs data using some field survey photos and the Google Earth images with higher resolutions as references. We create a fishnet (2 × 2 km) for ensuring the spatial distribution uniformity of the ground validation data. In this way, about 130 grids were equally yielded across the study area. As a whole, each grid included one UV and one non-UV point. Consequently, sufficient ground samples for validation were guaranteed.
Then, the classification result from the RF model was compared with the ground truth by computing the confusion matrix between them. Meanwhile, the overall accuracy, kappa coefficient, and producer/user accuracies were calculated based on the confusion matrix for the assessment of the actual classification result. Furthermore, the performance of the RF model was compared with that of the support vector machine (SVM) model which is also popular in ground object detection based on remote sensing images [61].
4. Results
4.1. Evaluation of the UV-Detection Model
According to the overall accuracies (higher than 80%) as given in Table 3, the current UV-detection of both RF and SVM models displayed good performances in five zones, with the exception of the relatively low accuracy (68.75%) of the SVM model in the E zone. Meanwhile, the overall accuracies of either the RF or SVM models were clearly different between the training and testing sets in each zone. At this point, the RF models possessed relatively small differences between the training accuracies and the test accuracies, although the SVM models possessed somewhat higher training accuracies. These results show that the UV-detection models of the RF algorithm were reliable and stable.
In the further evaluation compared with the ground datasets, these two models differed in kappa coefficients and producer/user accuracies (Table 4). With distinctly higher kappa coefficients, the RF model performed better in zones C (0.88), D (0.75), and E (0.83) than SVM (0.83, 0.55, and 0.59, respectively), although the coefficients of the RF model were slightly lower in A (0.82) and B (0.69) compared with those of the SVM (0.83 and 0.70, respectively). In comparison with the RF models, the SVM models presented an obviously worse performance in terms of producer accuracies in D and E. The probable reason may be the overfitting of the SVM model in zones D and E caused by less training data and an overly accurate description of training samples. Although UVs have more consistent basic characteristics in zones D and E than in A and B, and distinctly differ from the surroundings, a small amount of noise in certain training samples would have a strong effect on the SVM model, resulting in the reduction in generalization ability. By contrast, the RF model can reduce the probability of overfitting due to their classification principle. Hereby, the RF models presented better adaptability of UV detection in this study.
4.2. Assessment of Partition Strategy
In terms of the overall accuracies and kappa coefficients, the performance of the partition strategy was further assessed through comparing the UV-detection results using samples in the individual zone (partition strategy) with those of the total samples in five zones (non-partition strategy). The overall accuracies and kappa coefficients of UV detection with the partition strategy (90.23% and 0.80 on average) and that with the non-partition strategy (89.98% and 0.79) were approximate. However, there were significant differences in accuracies among these zones. The summed sets of the respective samples in the five zones presented a better detection ability in zones A, B, and D, with relatively higher kappa coefficients, whereas the detection ability was significantly weakened in zones C and E (Figure 6), which may be attributed to the properly distinct UV types in zones C and E, as well as the relatively complex typical samples of the five zones. In addition, in zone B, the detection accuracies based on both assessments of samples from the individual zone and the total five zones were poor, which was probably caused by its particularly complex UV types. The RF classifiers with the respective samples in each zone displayed good capability of identifying the UVs with larger kappa coefficients larger than 0.75 for zones A, C, D, and E, which indicated that the partition strategy was potentially meaningful for detecting all of the UVs in the study area.
There was a total of 23.76 km2 of UVs detected by the proposed framework distributed in five zones (Figure 7), accounting for about 7.34% of the total area (Table 5). As far as the proportion of UVs in the total UV area is concerned, about 65% of the total UVs was distributed in the zones of A (20.99%) and B (43.84%). By contrast, the zones of C and E possessed the lowest proportions (about 10%) since these two zones are far from the city center and are mainly covered by hills (C) or farmlands (E). Furthermore, each zone has significantly different UV distribution characteristics. In zone A, UVs are scattered across the west of the zone, which is the old center of Guangzhou. While the UVs in zone B tend to be concentrated in the east of the zone, that is, in the middle of the Haizhu district, but they are more dispersed in the west. The number of UVs in zones C, D, and E is relatively small, however, the extent of a single UV is larger, and there are still woodlands and farmlands around UVs in zones C and D.
4.3. Comparison of Feature Significances
During the RF-extraction of UVs, 23 features made various contributions in terms of MDG. As ranked in Figure 8, Area and GLCM_Entropy always possessed much higher values of MDG. Meanwhile, some features referring to heterogeneity within UVs (e.g., Mean of SO: StdDev, SD_Blue) and the afforestation degree (e.g., Veg_P, NDVI) were also among the top 10 important features. Because of the varied appearances of UVs in the five zones, however, the sequences of the 23 features’ contributions were somewhat different from each other (Figure 8 zones A−E). In particular, some of the rest features tended to be more appropriate for the RF-extraction of UVs in different zones (e.g., GLCM_Entropy in A; Area in B, C, and D; and Area of SO: Mean in E). This indicates that the 23 features had different significances for the RF-extraction of UVs in the five zones with various UV types.
4.4. Adaptability of Samples and Models in an Individual Zone
Samples and models from a specific zone had different adaptabilities to other zones. Figure 9 shows the variations in the kappa coefficient arising from using samples and models of other zones. A positive value denotes that the sample/model of the source zone possessed higher detection accuracies than those of the target zone, while a negative value represents a worse performance. We also used “capacity” and “suitability” to display results in depth. Capacity refers to the mean of variations when other samples/models were applied to one zone (in the vertical direction), while suitability is the mean of variations when one sample/model was used in other zones (in the horizontal direction). As depicted in Figure 9, the kappa coefficients of each zone declined with certain degrees when the sample from the zone was applied to other zones. Meanwhile, zone D had a better capacity when the other four zones samples were applied to it, as indicated by the approximate (zone A) or increased (zones B, C, and E) kappa coefficients. By contrast, zone E displayed the worst capacity as indicated by its largely decreased kappa coefficients. However, the samples in zone E possessed the best suitability of UV detection in the other zones, and samples in zone D presented the worst. The result shows that it is feasible to transfer samples and models among the five zones; however, the accuracies are affected by the similarity of UVs and the richness of samples between two zones.
5. Discussion
As a typical informal urban settlement, UV has attracted much attention from the public, for which high-resolution remote sensing images have been widely employed in recent years [12]. In this study, the RF and SVM methods, as well as the partitioned GF-2/PMS imageries were employed to detect the UVs in the central region of Guangzhou City. Several interesting findings were achieved and would provide useful clues for local city managers identifying these IUSs and devising better urban planning.
It has been pointed out that the central region, including one more district than Yuexiu, Liwan, Haizhu, and Tianhe, underwent spatiotemporally different urban expansion during Guangzhou’s fast urbanization over the past few decades [45]. Similarly, our analysis showed that these four districts were featured by spatially differentiated distribution of current construction lands. At present, there have been numerous emerging scientific, financial, and service companies in the southeastern part of the Tianhe district during the past ten years [62], leading to a dramatic land use change process and remains of original villages with relative large extents. By contrast, due to the impact of planning policies and geographical location, there are still large-scaled forests conserved in the northeastern Tianhe district [39]. Likewise, differing from the western Haizhu district, which is close to the old city center with rapid development, amounts of farmland and water areas were still reserved in the east. These urban development patterns reflected by spatial disparities of current construction lands (e.g., west–east in Haizhu and north–south in the Tianhe district) lead to UV differentiations in the core area of Guangzhou. Accordingly, it was reasonable to divide the core area into five zones. Because the diversity of UVs among zones was fully considered, the partition-based detection of UVs, in comparison to the UV detection from the integral region, presented relatively higher accuracies (i.e., mean values of the overall accuracies and kappa coefficients) by means of the RF method. That is to say that the partition strategy may be a necessary solution to reasonably increase the accuracy of UV detection in Guangzhou, which has spatial and temporal differentiation in urban internal development, in virtue of high-resolution remote sensing images.
With relatively higher mean MDG values, 10 common features, including area, GLCM_entropy, Mean of SO: StdDev and so on, made more important contributions to the UV detection, while other characteristics were variously ranked in each partition. There may be two reasons for their differences. One explanation is that the most significant characteristics of UVs are the lack of green open space and the heterogeneity of roofs caused by building upward expansions for the pursuit of higher earnings [18,63]. Another is that the UVs, the byproducts of a long-term and multi-period urbanization in these five zones, owned their landscape genetics labeled by different spectral characteristics of the roofs and their edges [43,64]. As a result, either the respective samples of each zone or the total sample sets integrated in the RF model possessed a good capability of extracting the UVs with larger kappa coefficients than 0.65, although the performance of the summed set in zones C and E was relatively weakened. Therefore, these common and/or typical features were reasonable for selecting the zonal UV-samples and extracting the UVs through the classifiers.
Moreover, the samples in zone E presented the best suitability of extracting the UVs in the zones C and D, and was relatively worse in zones A and B, which may be attributed to the strong (for zones C and D) or weak (for zones A and B) comparability of UV typical features in zone E. On the other hand, zone D had a better capacity of accepting the samples (and models) transferred from the four source zones due to its richness of remained UV types during the recent acceleration of urbanization (Figure 4). Accordingly, we speculate that the efficiency of the selected samples and models transferred from the source zones into the target ones were potentially affected by not only the comparability of UV features but also the capacity of accepting exogenous samples. This finding is similar to previous studies that have found that the suitability of existing samples and models tended to be restricted in other regions because of different development histories, the local context, and the composition of built-up areas [24]. For example, the urban areas and the UVs are intermingled with each other in emerging cities (e.g., Shenzhen), while downtown usually formed before decades of urbanization (as well as the emergence of UVs) in the city with a long history (e.g., Wuhan) [5]. This was the challenge for the transferring ability of the existing samples or methods, and might be improved by some appropriate adjustments of typical (i.e., different) features and their weights. Even so, it can be seen that the feasibility of transferring existing samples and models for UV detection in some other regions would be guaranteed by the partition strategy to some degree.
In addition, some similar urban areas with widely distributed UVs, including the other districts (e.g., Baiyun District) in Guangzhou and some neighboring cities including Foshan, Dongguan, and Shenzhen, would benefit from the solution proposed for detecting the UVs in the central Guangzhou through the partition strategy and a series of zonal UV-samples with common and typical features derived from high-resolution remote sensing images. According to the spatial distribution of current construction lands, there were some zones potentially possessing a good capacity of accepting the samples and models in this study. For example, the samples and models in zones C and E could be appropriately transferred into some zones of the Baiyun district and the northern Dongguan, while those in A–B may be more suitable for the UV detection in the Chancheng district (the core area of Foshan City which has become an important economic center on a par with Guangzhou since the Ming Dynasty [65]), as well as zones C and E for eastern Shenzhen (e.g., Longgang district, an emerging district [38]) (Figure 10). The solution, however, may not be suitable for regions with different development histories and distinct settlement landscapes (e.g., Wuhan) [66]. In this way, our study would provide some meaningful clues for city managers efficiently identifying the UVs before implementing their urban planning in the future.
There are some limitations to the study. First of all, the 2015 construction land data used for partition could be appropriately renewed through the 2017 land use data so as to reduce the influence on UV-detection in each zone caused by the gap of time phase with remote sensing images, although the effectiveness of the partition strategy has been well explored in this study. Secondly, the feasibility of transferring existing samples and models for UV detection in some other regions has been properly confirmed, however, it is still necessary to improve transferring performance through the adjustment of features and weights, so as to support the application of the methodology in the whole of Guangzhou or similar regions. Thirdly, although UV detection using physical characteristics of UVs based on remote sensing images has achieved satisfying accuracy, the old residential quarters with high building density were easily confused with UVs for their similarity in images. The utilization of point of interest (POI) and cellular signaling data may be effective additional data, which could reflect social attributes of UVs (e.g., the existence of an ancestral hall and numerous chophouses) [14,53,67]. Despite the limitations mentioned above, our work would provide a solid foundation for subsequent studies.
6. Conclusions
In this case study, we proposed a partition-strategy-based UV-detection framework integrating the RF model, OBIA method, and high-resolution remote sensing images. In the core districts of Guangzhou, the RF models in this framework displayed good performances of detecting the UVs. It can be concluded that a partition strategy considering the course of urban expansion is an essential solution to raise the UV-detection accuracy in the typical cities with spatiotemporally featured land urbanization. We suggest that the distribution of construction lands need to be sufficiently employed to further understand the spatiotemporal process of urbanization in Guangzhou and similar urban areas, and to make a proper partition for implementing effective UV detection and transferring of samples and models into other partitioned zones. This study provides some meaningful clues for city managers identifying the UVs efficiently before devising and implementing their urban planning in the future.
Supplementary Materials
The following are available online at https://www.mdpi.com/2072-4292/12/14/2334/s1. Figure S1: Informal urban settlements in some countries: (a) Rocinha, Rio, Brazil; (b) Dharavi, Mumbai, India; (c) Kibera, Nairobi, Kenya; (d) Shipai village, Guangzhou, Guangdong, China (source: Google Earth).
Author Contributions
Conceptualization, H.R.; methodology, L.Z. and H.R.; validation, L.Z., and C.C.; formal analysis, L.Z.; investigation, L.Z., C.C., and H.R.; data curation, L.Z.; writing—original draft preparation, H.R. and L.Z.; writing—review and editing, H.R. and Y.H.; visualization, L.Z.; supervision, H.R.; project administration, H.R.; funding acquisition, H.R. and Y.H. All authors have read and agreed to the published version of the manuscript.
Funding
This research was funded by the National Natural Science Foundation of China (Grant No. 41571158) and the National Key Research and Development Program of China (Grant NO. 2016YFC1302602 and No. 2017YFB0503005).
Acknowledgments
We thank to the China Centre for Resources Satellite Data and Application for providing GF-2 images for research purpose. We also thank the anonymous reviewers for their constructive and helpful comments during the review process. Finally, we would like to thank LetPub for its linguistic assistance during the preparation of this manuscript.
Conflicts of Interest
The authors declare no conflicts of interest.
References
- Henderson, V. Urbanization in developing countries. World Bank Res. Obs. 2002, 17, 89–112. [Google Scholar] [CrossRef]
- Chen, M.; Liu, W.; Tao, X. Evolution and assessment on China’s urbanization 1960–2010: Under-urbanization or over-urbanization? Habitat Int. 2013, 38, 25–33. [Google Scholar] [CrossRef]
- Lin, Y.; De Meulder, B. A conceptual framework for the strategic urban project approach for the sustainable redevelopment of “villages in the city” in Guangzhou. Habitat Int. 2012, 36, 380–387. [Google Scholar] [CrossRef]
- Dakpallah, T.A.G. Slum Improvement in Ghana: The Study of Aboabo and Asawase in Kumasi. Master’s Thesis, Kwame Nkrumah University of Science and Technology, Kumasi, The Republic of Ghana, July 2011. [Google Scholar]
- Huang, X.; Liu, H.; Zhang, L. Spatiotemporal Detection and Analysis of Urban Villages in Mega City Regions of China Using High-Resolution Remotely Sensed Imagery. IEEE Trans. Geosci. Remote Sens. 2015, 53, 3639–3657. [Google Scholar] [CrossRef]
- Mukeku, J. Urban Slum Morphology and Socio-economic Analogies: A Case Study of Kibera Slum, Nairobi, Kenya. Urbanisation 2018, 3, 17–32. [Google Scholar] [CrossRef]
- Liu, Y.; He, S.; Wu, F.; Webster, C. Urban villages under China’s rapid urbanization: Unregulated assets and transitional neighbourhoods. Habitat Int. 2010, 34, 135–144. [Google Scholar] [CrossRef]
- Riley, L.W.; Ko, A.I.; Unger, A.; Reis, M.G. Slum health: Diseases of neglected populations. BMC Int. Health Hum. Rights 2007, 7, 2. [Google Scholar] [CrossRef] [Green Version]
- Tan, Y.; He, J.; Han, H.; Zhang, W. Evaluating residents’ satisfaction with market-oriented urban village transformation: A case study of Yangji Village in Guangzhou, China. Cities 2019, 95, 102394. [Google Scholar] [CrossRef]
- Ye, Y. Theoretical Framework and Mechanism Innovation of the Inclusive Urban Village Reconstruction in Chinese Megacities: Study and Reflections on Beijing and Guangzhou. City Plan. Rev. 2015, 39, 9–23. [Google Scholar]
- Mahabir, R.; Croitoru, A.; Crooks, A.T.; Agouris, P.; Stefanidis, A. A critical review of high and very high-resolution remote sensing approaches for detecting and mapping slums: Trends, challenges and emerging opportunities. Urban Sci. 2018, 2, 8. [Google Scholar] [CrossRef] [Green Version]
- Kuffer, M.; Pfeffer, K.; Sliuzas, R. Slums from space-15 years of slum mapping using remote sensing. Remote Sens. 2016, 8, 455. [Google Scholar] [CrossRef] [Green Version]
- Mahabir, R.; Crooks, A.; Croitoru, A.; Agouris, P. The study of slums as social and physical constructs: Challenges and emerging research opportunities. Reg. Stud. Reg. Sci. 2016, 3, 399–419. [Google Scholar] [CrossRef] [Green Version]
- Yan, X.; Wei, L.; Zhou, R. Research on the Coordination between Urban and Rural Area in the Rapid Urbanization with the Redevelopment of Guangzhou Village-Amid-the-City as a Case. City Plan. Rev. 2004, 3, 30–38. [Google Scholar]
- Pan, Z.; Xu, J.; Guo, Y.; Hu, Y.; Wang, G. Deep Learning Segmentation and Classification for Urban Village Using a Worldview Satellite Image Based on U-Net. Remote Sens. 2020, 12, 1574. [Google Scholar] [CrossRef]
- Tong, D.; Feng, C.; Deng, J. Spatial evolution and cause analysis of urban villages: A case study of Shenzhen Special Economic Zone. Geogr. Res. 2011, 30, 437–446. [Google Scholar]
- Thomson, D.R.; Kuffer, M.; Boo, G.; Hati, B.; Grippa, T.; Elsey, H.; Linard, C.; Mahabir, R.; Kyobutungi, C.; Maviti, J. Need for an Integrated Deprived Area “Slum” Mapping System (IDEAMAPS) in Low-and Middle-Income Countries (LMICs). Soc. Sci. 2020, 9, 80. [Google Scholar] [CrossRef]
- Owen, K.K.; Wong, D.W. An approach to differentiate informal settlements using spectral, texture, geomorphology and road accessibility metrics. Appl. Geogr. 2013, 38, 107–118. [Google Scholar] [CrossRef]
- Blaschke, T.; Hay, G.J.; Kelly, M.; Lang, S.; Hofmann, P.; Addink, E.; Queiroz Feitosa, R.; van der Meer, F.; van der Werff, H.; van Coillie, F.; et al. Geographic Object-Based Image Analysis-Towards a new paradigm. ISPRS J. Photogramm. Remote Sens. 2014, 87, 180–191. [Google Scholar] [CrossRef] [Green Version]
- Blaschke, T. Object based image analysis for remote sensing. ISPRS J. Photogramm. Remote Sens. 2010, 65, 2–16. [Google Scholar] [CrossRef] [Green Version]
- D’Oleire-Oltmanns, S.; Coenradie, B.; Kleinschmit, B. An object-based classification approach for mapping migrant housing in the mega-urban area of the Pearl River Delta (China). Remote Sens. 2011, 3, 1710–1723. [Google Scholar] [CrossRef] [Green Version]
- Hofmann, P.; Strobl, J.; Blaschke, T.; Kux, H. Detecting informal settlements from QuickBird data in Rio de Janeiro using an object-based approach. In Lecture Notes in Geoinformation and Cartography; Springer: Berlin, Germany, 2008; pp. 531–553. [Google Scholar] [CrossRef]
- Kohli, D.; Sliuzas, R.; Kerle, N.; Stein, A. An ontology of slums for image-based classification. Comput. Environ. Urban Syst. 2012, 36, 154–163. [Google Scholar] [CrossRef]
- Kohli, D.; Warwadekar, P.; Kerle, N.; Sliuzas, R.; Stein, A. Transferability of object-oriented image analysis methods for slum identification. Remote Sens. 2013, 5, 4209–4228. [Google Scholar] [CrossRef] [Green Version]
- Rhinane, H.; Hilali, A.; Berrada, A.; Hakdaoui, M. Detecting slums from SPOT data in Casablanca Morocco using an object based approach. J. Geogr. Inf. Syst. 2011, 3, 217. [Google Scholar] [CrossRef] [Green Version]
- Veljanovski, T.; Kanjir, U.; Pehani, P.; Oštir, K.; Kovačič, P. Object-based image analysis of VHR satellite imagery for population estimation in informal settlement Kibera-Nairobi, Kenya. In Remote Sens. Appl; Escalante, B., Ed.; InTech: Rijeka, Croatia, 2012; pp. 407–434. [Google Scholar]
- Liu, J.; Li, P.; Wang, X. A new segmentation method for very high resolution imagery using spectral and morphological information. ISPRS J. Photogramm. Remote Sens. 2015, 101, 145–162. [Google Scholar] [CrossRef]
- Stark, T. Using Deep Convolutional Neural Networks for the Identification of Informal Settlements to Improve a Sustainable Development in Urban Environments; Technische Universität München: Munich, Germany, 2018. [Google Scholar]
- Kuffer, M.; Barros, J.; Sliuzas, R.V. The development of a morphological unplanned settlement index using very-high-resolution (VHR) imagery. Comput. Environ. Urban Syst. 2014, 48, 138–152. [Google Scholar] [CrossRef]
- Bosch, A.; Zisserman, A.; Muñoz, X. Scene classification via pLSA. In European Conference on Computer Vision; Springer: Berlin/Heidelberg, Germany, 2006; pp. 517–530. [Google Scholar]
- Li, Y.; Huang, X.; Liu, H. Unsupervised deep feature learning for urban village detection from high-resolution remote sensing images. Photogramm. Eng. Remote Sens. 2017, 83, 567–579. [Google Scholar] [CrossRef]
- Liu, H.; Huang, X.; Wen, D.; Li, J. The use of landscape metrics and transfer learning to explore urban villages in China. Remote Sens. 2017, 9, 365. [Google Scholar] [CrossRef] [Green Version]
- Liu, X.; He, J.; Yao, Y.; Zhang, J.; Liang, H.; Wang, H.; Hong, Y. Classifying urban land use by integrating remote sensing and social media data. Int. J. Geogr. Inf. Sci. 2017, 31, 1675–1696. [Google Scholar] [CrossRef]
- Duque, J.C.; Patino, J.E.; Betancourt, A. Exploring the potential of machine learning for automatic slum identification from VHR imagery. Remote Sens. 2017, 9, 895. [Google Scholar] [CrossRef] [Green Version]
- He, X.; Zhang, X.; Xin, Q. Recognition of building group patterns in topographic maps based on graph partitioning and random forest. ISPRS J. Photogramm. Remote Sens. 2018, 136, 26–40. [Google Scholar] [CrossRef]
- Kuffer, M.; Wang, J.; Nagenborg, M.; Pfeffer, K.; Kohli, D.; Sliuzas, R.; Persello, C. The scope of earth-observation to improve the consistency of the SDG slum indicator. ISPRS Int. J. Geo-Inf. 2018, 7, 428. [Google Scholar] [CrossRef] [Green Version]
- Liang, X.; Yuan, Q.; Tan, X.; Li, Z. Territorialization of urban villages in China: The case of Guangzhou. Habitat Int. 2018, 78, 41–50. [Google Scholar] [CrossRef]
- Hao, P.; Geertman, S.; Hooimeijer, P.; Sliuzas, R. Spatial analyses of the urban village development process in shenzhen, china. Int. J. Urban Reg. Res. 2013, 37, 2177–2197. [Google Scholar] [CrossRef]
- Gong, J.; Jiang, C.; Chen, W.; Chen, X.; Liu, Y. Spatiotemporal dynamics in the cultivated and built-up land of Guangzhou: Insights from zoning. Habitat Int. 2018, 82, 104–112. [Google Scholar] [CrossRef]
- Lin, J.; Wan, H.; Cui, Y. Analyzing the spatial factors related to the distributions of building heights in urban areas: A comparative case study in Guangzhou and Shenzhen. Sustain. Cities Soc. 2020, 52, 101854. [Google Scholar] [CrossRef]
- Zhang, S. The Research on the Cities’ Colors Based on Regional Characteristics—Taking City Center of Wuhan as an Example; Wuhan University: Wuhan, China, 2014. [Google Scholar]
- Graesser, J.; Cheriyadat, A.; Vatsavai, R.R.; Chandola, V.; Long, J.; Bright, E. Image based characterization of formal and informal neighborhoods in an urban landscape. IEEE J. Sel. Top. Appl. Earth Obs. Remote Sens. 2012, 5, 1164–1176. [Google Scholar] [CrossRef]
- Taubenböck, H.; Kraff, N.J. The physical face of slums A structural comparison of slums in Mumbai, India based on remotely sensed data. J. Hous. Built Environ. 2014, 29, 15–38. [Google Scholar] [CrossRef]
- Ren, H.; Wu, W.; Li, T.; Yang, Z. Urban villages as transfer stations for dengue fever epidemic: A case study in the Guangzhou, China. PLoS Negl. Trop. Dis. 2019, 13, e0007350. [Google Scholar] [CrossRef] [Green Version]
- Zhang, J.; Ouyang, T.; Zhu, Z.; Bai, Y. Analysis on the expansion mode of Guangzhou’s urban built-up land based on landscape ecology. Ecol. Environ. 2010, 19, 410–414. [Google Scholar]
- Wu, W.; Ren, H.; Yu, M.; Wang, Z. Distinct Influences of Urban Villages on Urban Heat Islands: A Case Study in the Pearl River Delta, China. Int. J. Environ. Res. Public Health 2018, 15, 1666. [Google Scholar] [CrossRef] [Green Version]
- Song, X.; Jiang, X.; Jiang, D.; Huang, Y.; Wan, H.; Wang, C. Object-oriented Classification of High-resolution Remote Sensing Image. Remote Sens. Technol. Appl. 2015, 30, 99–105. [Google Scholar]
- Tan, K.; Zhang, Y.; Wang, X.; Chen, Y. Object-based change detection using multiple classifiers and multi-scale uncertainty analysis. Remote Sens. 2019, 11, 359. [Google Scholar] [CrossRef] [Green Version]
- Johnson, B.; Xie, Z. Unsupervised image segmentation evaluation and refinement using a multi-scale approach. ISPRS J. Photogramm. Remote Sens. 2011, 66, 473–483. [Google Scholar] [CrossRef]
- Baatz, M.; Schäpe, A. An optimization approach for high quality multi-scale image segmentation. In Proceedings of the Angewandte Geographische Informationsverarbeitung XII Beiträge zum AGIT-Symposium Salzburg, Karlsruhe, Germany, 30 June 2000; pp. 12–23. [Google Scholar]
- Drǎguţ, L.; Tiede, D.; Levick, S.R. ESP: A tool to estimate scale parameter for multiresolution image segmentation of remotely sensed data. Int. J. Geogr. Inf. Sci. 2010, 24, 859–871. [Google Scholar] [CrossRef]
- Barros Filho, M.; Sobreira, F. Assessing Texture Pattern in Slum across Scales an Unsupervised Approach; CASA Working Paper 87; Centre for Advanced Spatial Analysis (UCL): London, UK, 2005. [Google Scholar]
- Li, P. Tremendous Changes: The End of Villages-A Study of Villages in the Center of Guangzhou City. Soc. Sci. China 2002, 1, 168–179. [Google Scholar]
- Trimble Documentation. eCognition® Developer 9.0 Reference Book; Trimble Germany GmbH: Munich, Germany, 2014. [Google Scholar]
- Haralick, R.M.; Shanmugam, K.; Dinstein, I.H. Textural features for image classification. IEEE Trans. Syst. ManCybern. 1973, 610–621. [Google Scholar] [CrossRef] [Green Version]
- Shekhar, S. Detecting Slums From Quick Bird Data in Pune Using an Object Oriented Approach. ISPRS Int. Arch. Photogramm. Remote Sens. Spat. Inf. Sci. 2012, 39, 519–524. [Google Scholar] [CrossRef] [Green Version]
- Breiman, L. Random forests. Mach. Learn. 2001, 45, 5–32. [Google Scholar] [CrossRef] [Green Version]
- Wiener, A.L.A.M. Classification and Regression by randomForest. R News 2. R News 2003, 3, 18–22. [Google Scholar]
- Huang, B.F.F.; Boutros, P.C. The parameter sensitivity of random forests. BMC Bioinform. 2016, 17, 331. [Google Scholar] [CrossRef] [Green Version]
- Calle, M.L.; Urrea, V. Letter to the editor: Stability of random forest importance measures. Brief. Bioinform. 2011, 12, 86–89. [Google Scholar] [CrossRef] [PubMed] [Green Version]
- Wu, W.; Li, A.D.; He, X.H.; Ma, R.; Liu, H.B.; Lv, J.K. A comparison of support vector machines, artificial neural network and classification tree for identifying soil texture classes in southwest China. Comput. Electron. Agric. 2018, 144, 86–93. [Google Scholar] [CrossRef]
- Chen, Y.; Chang, K.T.; Han, F.; Karacsonyi, D.; Qian, Q. Investigating urbanization and its spatial determinants in the central districts of Guangzhou, China. Habitat Int. 2016, 51, 59–69. [Google Scholar] [CrossRef]
- Wu, F. Housing in Chinese Urban Villages: The Dwellers, Conditions and Tenancy Informality. Hous. Stud. 2016, 31, 852–870. [Google Scholar] [CrossRef] [Green Version]
- Hu, Z.; Liu, P. The conceptual model and characterizations of landscape genome maps of traditional settlements in China. Acta Geogr. Sin. 2015, 70, 1592–1605. [Google Scholar]
- Hu, W.; He, J. Study on Settlement Development of Guang-Fu Metropolis Based on Spatial Information Technology. Geo-Inf. Sci. 2002, 3, 35–40. [Google Scholar]
- Liu, P.; Liu, C.; Deng, Y.; Shen, X.; Li, B.; Hu, Z. Landscape division of traditional settlement and effect elements of landscape gene in China. Acta Geogr. Sin. 2010, 65, 1496–1506. [Google Scholar]
- Hu, T.; Yang, J.; Li, X.; Gong, P. Mapping urban land use by using landsat images and open social data. Remote Sens. 2016, 8, 151. [Google Scholar] [CrossRef]
Figure 1.
Location of study area. (a,b) The overview; (c) core area of Guangzhou; (d,e) Shipai village in the Tianhe district, Guangzhou (source: author).
Figure 1.
Location of study area. (a,b) The overview; (c) core area of Guangzhou; (d,e) Shipai village in the Tianhe district, Guangzhou (source: author).

Figure 2.
Flowchart of urban villages (UVs) detection.

Figure 3.
Urban villages in (a) Shenzhen, (b) Wuhan, and (c) Guangzhou (source of a and b: Google Earth).
Figure 3.
Urban villages in (a) Shenzhen, (b) Wuhan, and (c) Guangzhou (source of a and b: Google Earth).

Figure 4.
Partition strategy in study area. (a) Partition based on proportion of construction land; (b–f) UVs in five zones.
Figure 4.
Partition strategy in study area. (a) Partition based on proportion of construction land; (b–f) UVs in five zones.

Figure 5.
Distribution of UV and non-UV samples in each zone.

Figure 6.
Accuracy of UV detection using samples of the individual and the total five zones.

Figure 7.
Classification result of UVs in the core area of Guangzhou.

Figure 8.
Feature significance ranks in five zones (zones A–E).

Figure 9.
Adaptability of individual samples and models. The value in each grid represents the variation of the UV-detection kappa coefficient in the target zone when the sample and model of the source zone are applied, compared with the original model of the target zone.
Figure 9.
Adaptability of individual samples and models. The value in each grid represents the variation of the UV-detection kappa coefficient in the target zone when the sample and model of the source zone are applied, compared with the original model of the target zone.

Figure 10.
Urban villages in Guangzhou and neighboring cities (source: Google Earth).


Table 1.
Feature selection based on morphological characteristics.
| Group | Morphological Characteristic | Feature | Description (Refer to [54,55]) |
|---|---|---|---|
| Spectrum | UV: Diversity roof colors/materials Formal community: Similar roof color Commercial and industrial area: Bright roof | Mean Blue [24] | Mean of pixel values in blue band |
| Mean Green | Mean of pixel values in green band | ||
| Mean Red | Mean of pixel values in red band | ||
| Mean NIR | Mean of pixel values in near-infrared (NIR) band | ||
| Mean PCA | Standard deviation of pixel values in PCA layer | ||
| SD Blue [34] | Standard deviation of pixel values in blue band | ||
| SD Green | Standard deviation of pixel values in green band | ||
| SD Red | Standard deviation of pixel values in red band | ||
| SD NIR | Standard deviation of pixel values in NIR band | ||
| SD PCA | Standard deviation of pixel values in PCA layer | ||
| Brightness [56], | Average of means of all layers | ||
| Max Diff [24,56] | Maximum difference between all layers | ||
| Mean of SO: Stddev [54] | Standard deviation of sub-objects in PCA layer | ||
| Pattern | UV: Small roof sizes; high density; narrow passage Formal community: Regular pattern; same building orientation Commercial and industrial area: Individual building; special architectural styles | Area [24] | Number of pixels |
| Density [54] | Distribution in space of the pixels of an image object, the more an object is shaped like a filament, the lower its density | ||
| Shape Index [29] | Smoothness of object border, the smoother the border of an object is, the lower its shape index | ||
| GLCM_Correlation [44] | Measure of the linear dependency of gray levels of neighboring pixels | ||
| GLCM_Entropy [34] | Measure of the disorder of an image | ||
| GLCM_StdDev [34] | Measure of the dispersion of values around the mean | ||
| Area of SO: Mean [54] | Average area of sub-objects | ||
| Opening Space | UV: Lack of green space and water; less shadow Formal community: Abundant green space between buildings; visible shadow Commercial and industrial area: Surrounded by green/opening space; apparent shadow | NDVI [18] | Normalized difference vegetation index |
| Veg_P | Proportion of vegetation within the 15 m buffer of the object | ||
| Shadow_P | Proportion of shadow within the object |
Table 2.
Composition of samples in each zone.
| Statistical Object | A | B | C | D | E | Total | |
|---|---|---|---|---|---|---|---|
| Segment | 26,543 | 20,186 | 14,011 | 11,100 | 7381 | 79,221 | |
| Sample | UV | 21 | 24 | 13 | 11 | 12 | 81 |
| non-UV | 44 | 48 | 32 | 34 | 31 | 189 | |
Table 3.
Model performance for each zone.
| Performance Evaluation Metric | A | B | C | D | E | |
|---|---|---|---|---|---|---|
| RF | Training accuracy/% | 82.61 | 92.16 | 93.55 | 96.88 | 81.48 |
| Testing accuracy/% | 84.21 | 85.71 | 92.86 | 92.31 | 93.75 | |
| SVM | Training accuracy/% | 97.83 | 98.04 | 96.77 | 100 | 100 |
| Testing accuracy/% | 84.21 | 80.95 | 92.86 | 92.31 | 68.75 | |
Table 4.
Classification accuracy of random forest (RF) and support vector machine (SVM).
| Evaluation Metric | A | B | C | D | E | |
|---|---|---|---|---|---|---|
| Producer accuracy (%) | RF | 85.01 | 72.94 | 82.12 | 82.63 | 88.60 |
| SVM | 86.05 | 75.49 | 82.12 | 64.44 | 64.09 | |
| User accuracy (%) | RF | 93.63 | 95.94 | 100 | 96.50 | 96.28 |
| SVM | 93.05 | 94.82 | 90.07 | 98.43 | 99.03 | |
| Kappa coefficient | RF | 0.82 | 0.69 | 0.88 | 0.75 | 0.82 |
| SVM | 0.83 | 0.70 | 0.83 | 0.55 | 0.59 | |
| Mean overall accuracy | RF: 90.23% SVM: 85.22% | |||||
| Mean kappa coefficient | RF: 0.80 SVM: 0.70 | |||||
The bold numbers indicate that the model corresponding to the bold number has better UV detection performance (higher kappa coefficient) in the zone.
Table 5.
Statistics on the UV-detection result.
| Area Statistic | A | B | C | D | E | Total |
|---|---|---|---|---|---|---|
| UVs area (km2) | 4.99 | 10.42 | 2.47 | 3.54 | 2.35 | 23.77 |
| Zone area (km2) | 81.78 | 99.12 | 63.02 | 46.35 | 33.71 | 323.98 |
| Proportion of UVs in the zone (%) | 6.10 | 10.51 | 3.92 | 7.64 | 6.97 | 7.34 |
| Proportion of UVs in total UV (%) | 20.99 | 43.84 | 10.39 | 14.8 | 9.88 | 20.99 |
© 2020 by the authors. Licensee MDPI, Basel, Switzerland. This article is an open access article distributed under the terms and conditions of the Creative Commons Attribution (CC BY) license (http://creativecommons.org/licenses/by/4.0/).
Share and Cite
MDPI and ACS Style
Zhao, L.; Ren, H.; Cui, C.; Huang, Y. A Partition-Based Detection of Urban Villages Using High-Resolution Remote Sensing Imagery in Guangzhou, China. Remote Sens. 2020, 12, 2334. https://doi.org/10.3390/rs12142334
AMA Style
Zhao L, Ren H, Cui C, Huang Y. A Partition-Based Detection of Urban Villages Using High-Resolution Remote Sensing Imagery in Guangzhou, China. Remote Sensing. 2020; 12(14):2334. https://doi.org/10.3390/rs12142334
Chicago/Turabian StyleZhao, Lu, Hongyan Ren, Cheng Cui, and Yaohuan Huang. 2020. "A Partition-Based Detection of Urban Villages Using High-Resolution Remote Sensing Imagery in Guangzhou, China" Remote Sensing 12, no. 14: 2334. https://doi.org/10.3390/rs12142334
Note that from the first issue of 2016, this journal uses article numbers instead of page numbers. See further details here.