Detection of Parking Cars in Stereo Satellite Images
by
 , , ,
, , ,
Sebastian Zambanini
1,* ,
,
Ana-Maria Loghin
2,
Norbert Pfeifer
2 ,
,
Elena Màrmol Soley
3 and
Robert Sablatnig
1 1
Computer Vision Lab, Institute of Visual Computing and Human-Centered Technology, TU Wien, A-1040 Vienna, Austria
2
Department of Geodesy and Geoinformation, TU Wien, A-1040 Vienna, Austria
3
Parkbob GmbH, A-1200 Vienna, Austria
*
Author to whom correspondence should be addressed.
Remote Sens. 2020, 12(13), 2170; https://doi.org/10.3390/rs12132170
Submission received: 8 June 2020
/
Revised: 2 July 2020
/
Accepted: 3 July 2020
/
Published: 7 July 2020
(This article belongs to the Special Issue Satellite Image Processing and Applications)
Abstract
:In this paper, we present a Remote Sens. approach to localize parking cars in a city in order to enable the development of parking space availability models. We propose to use high-resolution stereo satellite images for this problem, as they provide enough details to make individual cars recognizable and the time interval between the stereo shots allows to reason about the moving or static condition of a car. Consequently, we describe a complete processing pipeline where raw satellite images are georeferenced, ortho-rectified, equipped with a digital surface model and an inclusion layer generated from Open Street Model vector data, and finally analyzed for parking cars by means of an adapted Faster R-CNN oriented bounding box detector. As a test site for the proposed approach, a new publicly available dataset of the city of Barcelona labeled with parking cars is presented. On this dataset, a Faster R-CNN model directly trained on the two ortho-rectified stereo images achieves an average precision of 0.65 for parking car detection. Finally, an extensive empirical and analytical evaluation shows the validity of our idea, as parking space occupancy can be broadly derived in fully visible areas, whereas moving cars are efficiently ruled out. Our evaluation also includes an in-depth analysis of the stereo occlusion problem in view of our application scenario as well as the suitability of using a reconstructed Digital Surface Model (DSM) as additional data modality for car detection. While an additional adoption of the DSM in our pipeline does not provide a beneficial cue for the detection task, the stereo images provide essentially two views of the dynamic scene at different timestamps. Therefore, for future studies, we recommend a satellite image acquisition geometry with smaller incidence angles, to decrease occlusions by buildings and thus improve the results with respect to completeness.
1. Introduction
Parking in a city can be challenging and is rarely digitally supported. Current navigation systems guide drivers to the destination address but do not give support while they are looking for free parking spots. As a result, drivers spend a non-negligible amount of time looking for available spots. According to an IBM study [1], 30% of vehicles in major cities on the road are looking for parking spots at any given time, and similar figures are given in scientific literature ([2], p. 213). This inefficiency of parking space search results in increased congestion and carbon emissions and economic damage [1]. In fact, the average driver in an US city spends around 17 h per year searching for parking, leading to per-driver costs of 345 US $ due to wasted time, fuel, and emissions [3].
Automatic vehicle detection from high-resolution Remote Sens. images is motivated by different fields of application, e.g., urban planning, traffic flow management or estimation, and mapping of air and noise pollution. Therefore, an algorithm that automatically detects and correctly positions vehicles in satellite imagery would effectively support parking-related analyses in urban planning, for instance, detect on-street parking spaces to enable developing parking availability models. To build these models, there is a necessity to obtain historical ground truth data of on-street parking occupancy and availability. Therefore, we propose to use globally available high-resolution Remote Sens. images to obtain historical snapshots of on-street parking availability, providing information about the relative spatial availability information of parking in a city.
In such a framework, the main technical challenge is to localize the cars in the images, which can be treated as a visual object detection problem [4]. However, when it comes to the detection of parking cars vs. moving cars, single satellite images are not an option as the dynamics of the scene are not captured. Hence, we propose to exploit a minimum amount of temporal information—provided by a (single pass) stereo satellite image pair with around one minute recording time difference—to enable reasoning about the movement of cars. To the best of our knowledge, our work represents the first attempt to detect parking cars in satellite imagery of a city while ruling out the moving cars. While there exist methods for tracking vehicles in satellite videos [5,6,7], we argue that in such a setup only moving cars can be detected by exploiting their motion, while for static cars ground sample distances (GSDs) of more than 1m do not provide enough details for a car-specific appearance signature in the image. In our approach, static car detections are learned by feeding a Faster R-CNN framework [8] with ortho-rectified stereo satellite images, such that the network aims to learn whether a car is visible in both images. Furthermore, we study the usage of a reconstructed Digital Surface Model (DSM) as additional modality offering a complementary cue about car locations. We also investigate the optimal type of information fusion from the different image sources: early fusion, where the model instantly sees all input images and is able to learn their correlations, and late fusion, where single car detection networks detect both static and moving cars and the final parking car decision is derived by a hand-crafted combination of the individual predictions. Overall, we describe a complete pipeline to achieve parking cars localization from a stereo satellite image pair of a city, from ortho-rectification and stereo reconstruction to OSM-guided ROI filtering and the final CNN-based parking car detection.
As our study site, we selected the city of Barcelona as it represents typical challenges for parking space analysis in European cities, such as densely parked cars on-street, partially occluded parking space under trees, shadows caused by tall bindings, and varying parking spot arrangements. As an additional contribution of this paper, we present a publicly available dataset [9] of a 4.58 km test area of Barcelona with labeled (parking) cars. While this dataset can be used for single-image car detection, and thus increases the data diversity in combination with already existing datasets [10,11,12], its unique feature is the additional static car labelling, which we hope to stimulate further research in this direction within the community.
The remainder of this paper is organized as follows. In Section 2, we give an overview of related work on vehicle detection in Remote Sens. images. Our methodology is presented in Section 3, including a description of our new Barcelona dataset of parking cars. Experimental results are presented in Section 4 and discussed in Section 5. Concluding remarks are finally given in Section 6.
2. Related Work
Visual object detection is the task of localizing instances of object classes in an image [13], which also has a broad range of applications in Remote Sens. [4]. With the recent advancement of Remote Sens. technology and the availability of very high resolution satellite and aerial images, a larger range of small artificial objects became detectable and got into research focus [4], such as roads [14] or buildings [15].
From a methodological viewpoint, the nowadays most effective and widely used methods are based on machine learning, as earlier methods based on template matching [16] or knowledge basis [17] become ineffective and impractical for complex object types due to their limited flexibility and difficulty to manually define discriminative rules describing the object signature. Within the machine learning paradigm, object detection is treated as a classification problem and classifier parameters are trained by means of positive and negative image samples [18]. Traditionally, such classifiers are fed with hand-crafted features extracted from the images such as HOG [19], but nowadays this paradigm has been outdated by the rise of end-to-end learning methods using deep Convolutional Neural Nets (CNNs) [13].
Recently, such deep learning methods have also been applied to the problem of vehicle detection from Remote Sens. images. As one of the first, Mundhenk et al. [10] used a training set of more than 300,000 car samples to train a CNN as a sliding-window classifier for detection. Similarly, Ammour et al. [20] use mean-shift segmented regions as candidate locations which are then evaluated by a CNN. While some later proposed methods [21,22] treat the task as a semantic segmentation problem where a Fully Convolutional Network [23] acts as a pixel classifier, the majority of methods follow effective CNN-based object detection frameworks such as Faster-R-CNN [8], Single-Shot Detector (SSD) [24], or Feature Pyramid Network (FPN) [25]. These frameworks typically model the detectable shapes as (oriented) bounding boxes which are additionally refined by regression.
SSD is a single-stage pipeline where the network both detects and classifies bounding boxes, and Tang et al. [26] extend this framework from axis-aligned bounding boxes (AABBs) to oriented bounding boxes (OBBs) for vehicle detection. FPNs provide rich multi-scale features targeted for the detection of objects at various scales. For Remote Sens. images, importance is attached to efficient multi-scale object detection when different object sizes need to be detected simultaneously, and FPNs have therefore been used for multi-class object detection in the Remote Sens. scenario, including vehicle classes [27,28,29]. The Faster R-CNN framework treats multiple classes in a two-stage process, where first a Region Proposal Network (RPN) detects possible candidate locations by inferring objectness at dense anchor locations in the image. A second CNN then verifies and classifies these proposals. Among all frameworks, Faster R-CNN is the one most commonly adapted to vehicle detection in the Remote Sens. domain [11,30,31,32,33,34]. These adaptations mainly focus on the specific characteristics of vehicles in Remote Sens. imagery: small size and arbitrary orientations. The small size of vehicles demands for adaptations in the RPN network structure, as the final feature maps need to preserve high resolution details in the images. This is solved by concatenating high-resolution feature maps from earlier layers with the upsampled ones from later layers [31,32,33]. The arbitrary orientation of vehicles demands for an OBB representation for detection as the original AABBs provide an imprecise localization result, especially for densely located vehicles with highly overlapping AABBs. Therefore, more suitable OBB representations are proposed like rectangles with additional orientation angle [34] or 4-point polygons [11]. Incremental improvements of Faster-R-CNN for vehicle detection include mining of hard negative samples during training [31], inclusion of context by enlarging the RPN proposals [32] or addressing the class-imbalance issue by a focal loss function [33].
3. Materials and Methods
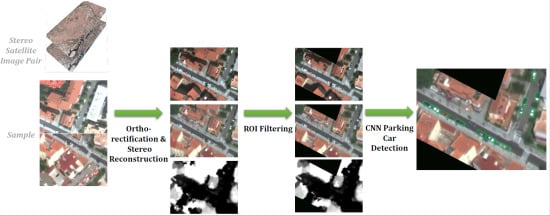
An overview of our processing pipeline is shown in Figure 1. Starting from a raw satellite stereo image pair, we first perform a 3D reconstruction to obtain a Digital Surface Model (DSM) as additional cue for visual car detection, followed by ortho-rectification to spatially align the images (Section 3.2). Next, Open Street Map (OSM) data is exploited to filter out non-street areas and consequently reduce the false positive risks for detection (Section 3.3). The final CNN takes the two RGB ortho-rectified images and the DSM as input and detects parking cars based on their co-occurrence in both images (Section 3.4). CNN training and testing of the study city of Barcelona is based on our new publicly available labeled dataset of parking cars in this region, as described in Section 3.1.
3.1. Pacaba—Parking Cars Barcelona Dataset
The PaCaBa (Parking Cars Barcelona) dataset [9] (The dataset is available for download at https://doi.org/10.5281/zenodo.3701453) is an ortho-rectified stereo satellite image dataset with labeled parking cars. It provides both an annotation of individual cars in the two ortho-rectified stereo images as well as as a combined annotation of static cars. The image and annotation data is available for four isolated regions in the city of Barcelona covering 4.58 km (see Figure 4). In total, 12,088 and 12,248 cars have been identified in the individual ortho-rectified stereo images, respectively, resulting in 7303 annotated parking cars.
3.1.1. Satellite Image Acquisition
The satellite images for the study area were acquired with the WorldView-3 high spatial resolution Earth imaging satellite developed by Digital Globe Inc. (Longmont, CO, USA). Flying at a nominal altitude of 620 km, the sensor is the highest resolution commercial satellite, reaching a ground resolution of 0.31 m in panchromatic mode and 1.24 m in multi-spectral mode for nadir viewing direction. Fast rotation of the satellite allows collecting multiple areas of interest or stereo/tri-stereo data from the same orbit during a single pass. The stereo images over Barcelona city were acquired on 20 July 2018, around 11:05 a.m. in North–South direction, within less than one minute. Therefore, the territory is captured under the same illumination conditions, with no significant shadow changes. The acquisition viewing angles are of 14.4 and −19.7 in the along-track direction with respect to the nadir and 11.4 and 9.6 in the across-track direction. Consequently, the base to height (B/H) ratio for the stereo pair is 0.69 and the GSD varies between 0.34 and 0.35 m depending on the different viewing angles. The optical satellite images were delivered as pan-sharpened with four spectral bands, i.e. Red, Green, Blue, and Near-infrared, but only the RGB information is used in this work, as Near-infrared provides no additional useful features for car recognition. For each image, auxiliary data containing the Rational Functional Model (RFM) are provided by the supplier. Detailed information regarding the main acquisition parameters are summarized in Table 1.
3.1.2. Data Annotation
In order to keep the human annotation task simplistic and manageable, car annotation was carried out as polygon selections in the two ortho-rectified satellite images, instead of following a more error-prone process of directly identifying parking cars in the images. Consequently, automatic postprocessing was done on these manual annotations: first, the polygon representations have been converted to an OBB representation, and second, parking cars have been identified by checking for spatial overlap between individual annotations.
The conversion of a given 4-point polygon with vertices arranged in clockwise order and corresponding edges to an OBB representation is illustrated in Figure 2. First, the longest edge of the polygon is identified as and its opposite side as , with ⊕ being the modulo 4 addition defined as
To estimate the orientation of the OBB, an averaged endpoint of the two longest edges as seen from is calculated as
and the orientation is calculated from the edge to by
The height h and width w is given by the average length of the two longest sides and as well as the two shortest sides and , respectively. The center of the bounding box is calculated as the average of the four vertices . Please note that in this representation the front and back information of cars is neglected, as the orientation covers only the half circle. This was done since identifying the front of cars in satellite images during annotation is hard to achieve, and the actual full-circle orientation is of minor interest for parking space detection.
The overlap of OBBs is calculated by a skewed version [35] of Intersection over Union (IoU). By visual inspection, an overlap threshold of 0.3 was chosen to distinguish static cars from moving cars. In order to combine two overlapping bounding boxes and , their center points and orientations are simply averaged. From the combined center point and orientation we extend the width and height in order to fully cover the two bounding boxes as follows.
3.2. Georeferencing and Stereo Reconstruction
The optical satellite images for Barcelona were delivered as map projected products at Ortho Ready Standard (OR2A) processing level, in UTM 31 North map projection. They are accompanied by Rational Polynomial Coefficients (RPCs) that allow the conversion between image and object coordinates [36] with a predicted geolocation accuracy of less than 3.1 m (CE90) without ground control points. At OR2A processing level, the provided images are already approximately ortho-rectified, but without consideration of ground control points or a terrain model describing the elevation variation within the scene. They have approximate geopositions with planimetric shifts up to several meters. With the objective of obtaining a highly accurate localization of parking cars, images with a corrected geometry are needed. Therefore the World View-3 satellite images were ortho-rectified (geometrically corrected), to remove the effects of perspective (tilt) and relief (terrain). For this, the corresponding Digital Elevation Model (DEM) of the scene is required.
The 3D information extraction from the stereo satellite imagery comprises Digital Surface Model (DSM) derivation and ortho-rectification. These steps were performed in the Inpho software from Trimble, designed for precise image block triangulation and dense 3D point cloud reconstruction using image matching techniques [37]. To this point, three modules were employed: (1) Match-AT for image block triangulation, (2) Match-T DSM for 3D reconstruction, and (3) OrthoMaster for image ortho-rectification.
The WorldView-3 stereo acquisition over Barcelona with two overlapping images allows the reconstruction of 3D points by applying photogrammetric techniques and dense image matching algorithms. Overall, the image processing chain comprises the following main steps; (1) image with metadata information (RPCs) import, (2) orientation refinement using tie points, (3) dense image matching for 3D reconstruction, (4) DSM and DTM derivation, and (5) image orthorectification based on the elevation model (Figure A1). For improving the sensor orientation, the initial values of the RPCs were refined by performing a bias compensation in image space. For this, tie points automatically extracted in both images were employed. Points with image residuals greater than one pixel were considered as blunders and therefore rejected. Thereafter, RPC refinement was repeated.
The automatic computation and extraction of 3D information from the stereo satellite imagery is possible through dense image matching. The matching employed a feature-based strategy on the higher levels and a semi-global cost-based one on the lower pyramid levels. The 3D object point coordinates for each image pixel were determined by forward intersections. Finally, the output was a dense 3D photogrammetric point cloud in las file format, with a regular distribution (one point per each image pixel) at a high density of 10 points/m (Figure A2). Cities with tall buildings and narrow streets are challenging environments, as occluded areas, height jumps, and a large number of small objects w.r.t. the GSD lead to heterogeneous textures in the images, resulting in noisy point clouds characterized by a high variation in elevation.
The resulting 3D points were further interpolated into a regular raster model of height values (i.e., DSM). Usually the transition from 3D information to 2.5D grid models through interpolation tends to smooth the input elevation values. Therefore, to generate a high quality DSM, we defined the most favorable solution, which is a compromise between achieving fidelity to the true surface and respecting the limitations according to the density and accuracy of the data source. For minimizing the smoothness effect, we selected a small grid size of 0.5 m with 20 nearest neighbors and tested the results when using different search radii to the current grid point. Unreconstructed areas with missing elevation information were present in the DSM. These were generally caused by non-visible areas (occlusions) or by a strong elevation difference between buildings/trees and surrounding ground, where the matching algorithm could not find corresponding points in the stereo pair. To generate a continuous DSM, these areas were filled by triangulation. Thus, missing elevation was obtained by interpolating the information of the valid neighboring boundary pixels. Such a model typically has a very noisy appearance, characterized by a high surface roughness. Therefore, it is not suitable for ortho-rectification, as it would cause distortion, artifacts, and double mapping effects (Figure A3). Therefore, from the photogrammetric DSM over Barcelona city, we derived the Digital Terrain Model (DTM) by using the volume based filtering approach developed by Piltz et al. [38]. The workflow for DSM and DTM derivation for Barcelona study site was performed with the scientific software OPALS (Orientation and Processing of Airborne Laser Scanning data) [39].
In ideal cases, the true orthophoto would be the best solution for further investigations, since it has an accurate geoposition with objects rectified to their correct locations [40,41]. However, due to the limiting aspects, we ortho-rectified the images by replacing the DSM with the computed DTM. Since buildings were not modeled in the DTM, they have visible facades in the computed orthophoto, potentially hiding street information (building leaning effects). Only objects at terrain level are correctly geolocated. As the main focus of this investigation is on parking cars detection, the adoption of a DTM-based orthophoto approach was suitable for this task. The selection of a DSM for ortho-rectification does not change the satellite image content and thus would not provide an increased visibility on the ground. Our method of 3D reconstruction from satellite images leads to a terrain model, which provides a smooth mapping from the image-space to the ortho-rectified image. This correctly represents ground and objects close to it (cars) and has (small) systematic errors for irrelevant objects like, in our case, buildings.
For each satellite image, the orthophoto was generated with 0.30 m pixel size by using the exact Cubic Convolution rectification method. The geoposition difference between the two Barcelona orthophotos is smaller than one pixel (0.3 m). The planimetric position fits very well with the reference OSM data, therefore no additional ground control and georeferencing is needed.
Detailed information regarding the results of image orientation, matching, DSM/DTM derivation, and ortho-rectification for the Barcelona dataset are given in Appendix A.
3.3. Region of Interest Generation
Regions of Interest (RoIs), also known as inclusion layers, were generated for two reasons. First, given the large area of the Barcelona dataset (over 100 km), it was estimated that a full annotation of the whole area would take ~1000 h, which would be too long. Second, the process of annotating vehicles on a satellite image can be a very tedious job. Labeling tasks can take tremendous effort, especially when the type of object is small, easily confusing and its boundaries are hard to define. Attentions can be easily lost, and the whole process can be error-prone. Therefore, the aim was to reduce the annotation effort by defining smaller areas for the annotations, and consequently, reduce obvious mistakes on areas where surely vehicles can not be, e.g., building roofs. Therefore, we decided to manually define smaller RoIs. Based on a basic rule-counting for several streets, the area and number of cars, resp., the area determined to be annotated was ∼5 km to get around 10,000 annotations for this experiment. To obtain the greatest variability in terrain type and street distribution, four regions of different sizes and locations were chosen. Therefore, the inclusion layer for Barcelona is distributed in four regions from 0.5 km to 2.3 km. An overview of the inclusion layer in the city of Barcelona is shown in Figure 4.
Once the RoIs are selected, OSM street lines are superimposed to the ortho-rectified images and clipped with the RoIs. Then, street lines are filtered to only keep streets with desired OSM tags (e.g., primary or residential). The lines are buffered with a certain margin varying on the street type (e.g., residential with 20 meters buffer). In the last step, all separate polygons are dissolved to get just one polygon for each RoI. Only on-street parking is included in the inclusion layer.
3.4. CNN-Based Static Car Detection
The last step in our pipeline is to detect static cars, given the masked and georeferenced ortho-rectified stereo image pair and DSM. We decided to adapt the Faster R-CNN approach [8], due to its wide usage and strong performance on various benchmarks [13] (Section 3.4.1). As the original Faster R-CNN implementation takes a single RGB as input, fusion strategies for processing the three input images are described in Section 3.4.2.
3.4.1. Adapted Faster R-CNN for Car Detection
Faster R-CNN is a two-stage detector, meaning that in a first stage a set of object proposals is generated which are verified and classified in the second stage. Additionally, in both stages, a regression component allows to refine the position and shape of the detected bounding boxes. The two-stage mechanism has shown to be highly effective for multiclass detection, as one net can focus on general object characteristics while the other one can derive the discriminating features between the objects. However, in our single-class scenario this type of task sharing is unnecessary and we thus only use the first stage and treat the object “proposals” as final detection result. This so called Region Proposal Network (RPN) has already shown to be effective in other single-class detection scenarios like pedestrian detection [42]. The RPN is designed as a fully convolutional network that predicts objectness and bounding box refinement parameters at regularly defined image locations, the so-called anchors. While in the original version of Faster R-CNN AABBs are detected at various bounding box aspect ratios and scales, possible object shapes in our Remote Sens. task can be regularized to various orientations with a single, fixed aspect ratio and scale. Therefore, similar to others [11,34,43], we transform Faster-R-CNN to OBB detection which requires to estimate an additional orientation parameter per bounding box.
Specifically, at an anchor position we sample 6 orientations at equally spaced intervals, i.e., . The height h and width w are set to pixels (corresponding to around m on ground level) to cover the actual shape of cars. The dense distribution of cars has also shown to demand for a finer grid sampling of 8 pixels (2.8 m) for anchor positioning than the default 16 pixels (5.5 m) value. As the original VGG16 [44] feature extractor pools the input image to 1/16 of its size, we only keep the layers before the 4th max pooling layer to allow for a 8 pixels sampling.
In contrast to standard AABB bounding box regression, the localization regression term of the loss function evaluates the quintuple describing the OBB:
where is the ground-truth quintuple, v is the predicted quintuple, and is the outlier-insensitive loss function defined in [45]. From an anchor quintuple and predicted bounding box , the parametrization quintuple is calculated as follows,
Accordingly, the predicted bounding box is calculated from an anchor by
3.4.2. Fusion Mechanism
As in our approach three input images are jointly evaluated to predict static stars, a central question is at which stage the data from the different input images is fused. In this paper, we investigate both a early and late fusion approach, as illustrated in Figure 5.
In early fusion, all three input images are stacked together to form the input for a CNN directly trained for static car detection. Therefore, the first convolutional layer of the VGG16 RPN is changed such that it accepts 7-channel inputs instead of 3-channel inputs.
In late fusion, three nets are responsible to detect cars for the respective input modality, and the final decision is derived by combining the individual predictions. As the ground truth annotation provides an own, general car annotation for each stereo image, their individual detectors are trained to detect both static and moving cars. The CNN for the DSM input is trained on static cars like the CNN of the early fusion approach. Final fusion of individual predictions is achieved by combining their OBBs in case of an IoU overlap of at least 0.2, similar to the combination of annotated OBBs (see Section 3.1.2). The confidence value of a static car detection is then averaged from the three individual confidence values.
The two different fusion mechanism are studied in this work, as there are versatile approaches with respect to the fusion stage in object detection literature [46]. The power of early fusion lies in the ability to exploit the correlations between input images. In contrast, late fusion allows for a simplified sub-step learning and enables adapting the individual CNNs to the input modality. In our scenario, late fusion also allows us to study the individual car detection performance of the two modalities RGB and DSM.
4. Results
In this section, we report the results achieved with our methodology on our study site of Barcelona. Specifically, details about Faster R-CNN training are covered in Section 4.1. The evaluation metrics used are described in Section 4.2 and the final results are reported in Section 4.3.
4.1. Faster R-CNN Training
For our experiments, all images of the overall dataset described in Section 3.1 are randomly split into training (60%), validation (20%), and test set (20%). Training is performed for 200 epochs with an initial learning rate of 0.02, which is halved every 30 epochs. For evaluating test performance, the net from the training epoch with the lowest loss value on the validation set is taken. For every training image, positive samples are identified by an IoU of more than 0.4 with ground truth samples, and negative samples by an IoU of less than 0.1. Additionally, a positive sample is accepted only if the orientation difference to the ground truth is less than to avoid forcing the net to do large refinements in bounding box regression. Negative samples are randomly collected from the image such that positive and negative samples sum up to 1024. For weight initialization, a VGG16 net pretrained on ImageNet [47] is used. As for the early fusion approach the first convolutional layer of VGG16 needs to be changed to a 7-channel input, the pretrained weights are used both for channels 1–3 and 4–6 which correspond to the RGB channels of images 1 and 2, respectively. For the DSM channel, the weights are initialized randomly. Initial tests have shown that this shows superior results compared to selecting one of the pretrained color channels filter weights from VGG16.
4.2. Evaluation Metrics
In object detection, Average Precision (AP) serves as a standard metric [48] and is thus also used in this study. AP is derived from precision and recall measures:
where denotes the number of True Positives, the number of False Positives, and the number of False Negatives. A true positive is typically defined as a predicted detection with an IoU overlap with a ground truth object above a specific threshold . Similarly, a false positive is a predicted detection with an IoU overlap with a ground truth object less than and a false negative is a ground truth object with no predicted detection with a IoU larger than . As the predicted detections come with a confidence value, precision and recall can be computed as a function of a confidence threshold , as each threshold delivers a different pair of precision and recall values. From this function, the AP can be computed as the area under the precision–recall curve.
Complementary to AP, precision and recall, we also report the F1 score of our detection results as it gives a combined, but more intuitive measure of the achievable precision and recall. The F1 score is defined as the harmonic mean of precision and recall:
We report the F1 score as the one achieved with the best value of , i.e., the that gives the highest F1 score on the test data.
4.3. Car Detection Results
In Table 2, the results of parking cars detection for both the early and late fusion approach are compared. A major conclusion from these results is that early fusion performs slightly better than late fusion (AP of 0.651 vs. 0.628) as it allows to learn the correlations and interactions of the stereo image pair. Another major conclusion is that using the DSM is not beneficial in our scenario, and even worsens the results (AP of 0.636 vs. 0.651 for the early fusion approach). This is owed to the fact that stereo reconstruction is not reliable and accurate enough for the car height level to provide a significant signature in the DSM.
The values shown in Table 2 are obtained with a IoU threshold of 0.3. As shown in Table 3, the results are highly sensitive to this threshold as it decides if a detection is localized with acceptable precision. While for typical object detection with larger objects a default value of 0.5 is selected [48], in Remote Sens. object detection the smaller object sizes make this localization precision request less appropriate [49], given also the lower Ground Truth (GT) localization precision.
While the evaluation metrics reported in Table 2 are helpful to quantitatively compare the performance of our methods, only limited conclusions can be drawn for the actual detection performance for parking cars. This is owed to the imperfect ground truth annotation where moving cars located at the same spot are treated as positive samples and static cars occluded in one of the images are treated as negative samples, in addition to erroneous car annotations in view of the challenging image quality. Therefore, in order to get more insights on our results, we visually investigated the failure cases on 14 out of the 57 test images (corresponding to a test area of km), as shown in Table 4. On these images, overall 379 cars have been detected by our method, with 21 of them being FPs. However, only 5 FPs are attributed to two different moving cars located at the same spot. In total, 598 cars are located in the test area subset, but 240 are missed. However, most of these failure cases (160) are fully visible in both images, but the cars have a less significant optical signature, leading to a FN prediction for the high confidence threshold used. In contrast, 80 cars are missed because they are not visible in one of the images, either due to a tree (19) or building (61) occlusion.
Results of a runtime analysis of our method are shown in Table 5. Runtime performance is not a major issue in our application scenario, but still a rapid prediction time is seen as an additional benefit of the Faster R-CNN framework. An image covering 1 km can be analyzed for parking cars within 0.05 s (1 s on a CPU), meaning that an entire city like Barcelona with an area of 101.4 km could be scanned for parking cars in under 4 min (around 76 min on a CPU).
5. Discussion
The main idea of our paper is to exploit stereo image pairs to differentiate moving from static cars. As shown in the examples of Figure 6, this can be efficiently achieved, given that parking cars remain static in the one minute stereo image acquisition interval, and in turn the moving cars do not.
In Figure 7, detection results for some exemplary regions of our dataset are shown. It can be seen that on a local level car detection is partly erroneous, for example, by single false positives and negatives as well as a wrong orientation regression. However, on a global scale, the parking cars and thus parking space can be broadly derived. In the following, we investigate and discuss our car detection results in the view of parking space analysis and review error sources.
5.1. Conditions Affecting Detection Performance
Commonly, the detection of cars in ortho-rectified satellite images of city scenery is hindered by challenging conditions like low image resolution, shadows, occlusions, and the high amount of image clutter. In our results, the detection of individual cars is shown to be error-prone mainly for areas with tree covering and densely parked cars, as depicted in Figure 8. Cars which are partly occluded by trees pose a specific challenge both to prediction and GT annotation, and consequently the reliability in these areas is reduced. For instance, in Figure 8a, the prediction and GT annotations disagree in the orientation of the cars. Densely aligned objects like cars are a problematic condition in Remote Sens. in general due to the difficulties arising in fine anchor sampling [50]. This can be also observed in our results: for instance, in the row consisting of ten parking cars shown in Figure 8b, both a false positive and false negative occur. Still, the parking area is broadly predicted.
5.2. Limitations
Apparently, a specific limitation of our methodology is owed to the sake of simplicity in GT generation, where individual cars have been selected in both images independently. As shown in Figure 9a, it can happen that by coincidence two moving cars cover the same location in both images. Consequently, such cases are treated as static cars both in training and prediction. However, our empirical investigation (see Table 4) has shown that the influence of this failure case is minor, as in a test area of km with 598 parking cars, only 5 such cases occurred.
Another implicit assumption we make is that a static car is visible in both images. Obviously, as illustrated in Figure 9b, this assumption can be violated by occlusions, e.g., when cars are parked close to buildings. It was shown empirically that around of parking cars (61 out of 598 cars as depicted in Table 4) get lost due to this restriction, for our specific set-up.
Because the satellite position along its orbit has different in-track and cross-track viewing angles, there are areas in the images occluded by high buildings, trees, and other artificial objects on the ground. Being the second most populous municipality of Spain, Barcelona is a large city with tall buildings, but currently not exceeding 150 m in height. From a thorough analysis of the derived DSM, it follows that typical buildings in the city center have 30 m height. Moreover, building have similar rectangular atrium-shapes following the regular distribution of street directions. This was double-checked with additional visualization of the satellite images and OSM data. In the city center, the street network has a conventional grid pattern, with arterial roads and local streets parallel and orthogonal to each other, forming a pattern of squares (Figure 10).
The typical distance between two buildings is approximately 20 m. This covers not only the street width (10 m), but also the sidewalks and parking areas on both street sides. Figure 11a illustrates a profile-view for visible and non-visible areas during image acquisition, where we assume a particular case with the satellite track parallel with the street azimuth and an in-track viewing angle of 0.
The street visibility can be analyzed with the incidence angles (), azimuth of the camera sensor (), and street direction (). According to Figure 11b, the non-visible street areas can be described by both the geometry of the city (, ) and satellite viewing geometry (, ), with the following formula,
where is the non-visible distance on the ground hidden by buildings; the building height; and are the street and camera azimuths, respectively; and the incidence angle.
The incidence angle () is defined as the angle between the ground normal and looking direction from the satellite sensor (note that we define those angles at the ground, whereas the Nadir angle at the satellite may be different by a few degree because of Earth curvature). For the two Barcelona satellite images, the incidence angles are and . The azimuth of the camera sensor () is the angle between North and the viewing direction projected on the ground, clockwise positive from to . The Barcelona stereo images have azimuth angles of and for the forward and backward scenes, respectively.
Streets located in the central area of the city have a regular distribution with right angle intersections (Figure 11). Therefore, there are mainly two types of streets: (a) with a southwest to northeast direction ( = ) and (b) with a southeast to northwest direction ( = ). The building height is 30 m.
For computing the visible part of the streets, the street width () needs to be considered, too. The visibility can then be computed by subtracting the non-visible distance () from the street width (): ω = - .
By applying the above equations and considering a street cross section, we obtain different values for the two types of streets in the two images. In the forward scene, the visible distances are 19.4 m for streets with azimuth and 9.1 m for streets with azimuth, i.e., visibility of 97% and 46% for northeast- and northwest-oriented streets, respectively. For the backward image, the resulting visible distances are 8.3 m and 13.2 m (visibility 41% and 66% for the northeast- and northwest-oriented streets, respectively). Thus, at least the western halves of the streets are visible in both images.
Obviously, the smaller the incidence angles, the better is the street visibility. Therefore, to avoid reduced visibility and to have as few occlusions as possible in the images, the acquisition collection parameters should be taken into account when ordering satellite imagery in urban areas. Concerning occlusions caused by buildings, small in-track and cross-track angles are recommended for a better visibility. The acquisition geometry can be specified in the technical documentation when ordering satellite images (additional costs are charged). In case of archive images, there is typically hardly any choice of viewing directions. Using two image pairs, one looking eastwards and one looking westwards, would allow observing the entire parking space with short interval in-track imagery. To reduce the occlusions caused by trees, images can be acquired during leaf-less periods; however, the low sun elevation angle leads to a lower image quality under these circumstances.
5.3. 3D Reconstruction
It is evident from the results that in our scenario the reconstructed DSM is not helpful for the detection of cars. Normal family cars, our investigated objects, are usually less than 1.5 m high, 5 m long, and 2 m wide. Expressed in pixels, by taking into account the GSD of the WorldView-3 satellite images (0.35 m for Barcelona), they have dimensions of less than 14 pixels length and 6 pixels width. As a result of different viewing angles of the sensor with a B/H ratio of 0.69, the corresponding change in parallax for cars (apparent shift in position) is approximately 3 pixels in image space. The reconstruction of the Barcelona city from the stereo image pair is performed using dense image matching. Because of the smoothness constraint and regularization in dense image matching [51,52], the heights of small individual objects may not be reconstructed. Therefore, in the resulting 3D point cloud cars do not have higher elevations compared to their surroundings. A detailed description of single objects height estimation from WV-3 DSM is found in [53], where a minimum pixel size of 15 is reported for vehicle lengths, in order to get reconstructed.
The computed DSM with a spatial resolution of 0.5 m × 0.5 m shows the Barcelona cityscape, but with some “noise, artifacts, and roughness” effects that appear on the road network especially due to moving objects and building shadows. Figure 12 shows a detail view of the computed DSM for a street intersection and surrounding buildings. Even if buildings appear in the DSM with irregular contours they have quite well reconstructed heights. In contrast, parked cars do not show any height information in the DSM. The elevation of the two streets and in the intersection area is thoroughly constant.
Moreover, the DSM contains areas with missing elevation information, caused by occlusions or by a substantial height difference between buildings, trees, and the surrounding ground. To summarize, cars appear to be too small to have a significant height signature in the DSM. Still, the DSM allows to discern street level from building level which could be possibly exploited by a CNN to rule out building areas for car detection. However, confusing structures on building roofs with cars seems to be very seldom, and thus a CNN can not benefit from the additional DSM information.
However, while the 3D content from the DSM had an adverse effect on the static car detection, the terrain model extracted from the satellite image stereo pair is necessary to correctly ortho-rectify the image content at street level. A parallax-free image pair (e.g., from a hypothetical pair of satellites flying along the same orbit with the same viewing direction of their cameras) would require an alternative source for the DTM in order to execute the ortho-rectification and integration with other data sources, e.g., inclusion layers.
6. Conclusions
We have presented a novel approach to localize parking cars in a city, where the Faster R-CNN detector is trained and applied to ortho-rectified stereo satellite images to discriminate static from moving cars. Our main hypothesis was that the time interval between the two stereo images allows to capture the static/moving feature of a car, as in general parking cars remain at the same spot while moving cars do not. This hypothesis was validated on a new labeled dataset of the city of Barcelona, which we also made publicly available to the research community. It is shown that with our approach parking areas can be widely captured and that false positives from moving cars covering the same spot are a seldom case in practice (five such cases occurred on an investigation area of 0.5 km with 598 parking cars).
On a methodological level, we studied the usage of an additional DSM derived from stereo reconstruction as well as the influence of the fusion stage where the different modalities are combined. Early fusion has shown to have a better performance as it allows the detector to directly learn the appearance of static cars in both stereo images. The reconstructed DSM is able to capture building heights, but the street car level can not be reconstructed in a quality that would be helpful for detection.
We particularly investigated the issue of street areas which are only visible in one satellite image. While the parking cars missed by the detector are typically isolated (e.g., individually missed cars in a row of parking cars), such occlusions can lead to the omission of all cars parking on the same street side. We have explored that on our stereo dataset of Barcelona in the worst case more than half of the street area is occluded, and in reality ~10% of parking cars are actually missed. A major conclusion from our occlusion study is that for the given application one should consider acquisition setups with minimal incidence angles to reduce occlusion areas. This would generally mean a smaller baseline of the cameras and thus a smaller depth resolution for stereo reconstruction, a drawback which can anyhow be neglected as we have seen that stereo reconstructions can not be exploited given the small car size and high GSD, and that the stereo images are primarily needed to obtain two views of the same scene at different timestamps. We also used the stereo pair for DTM extraction and ortho-rectification.
For future work we aim to study and exploit local contexts for the detection of parking cars. Evidently, cars are prevalently parked close to each other and with a similar orientation. We believe that these conditions can be used as a prior for parking car detection where nearby cars regularize the detection process to dissolve ambiguous cases.
Author Contributions
Conceptualization: S.Z., A.-M.L., N.P., E.M.S. and R.S.; Methodology: S.Z. and A.-M.L.; Software: S.Z., A.-M.L. and E.M.S.; Validation: S.Z., A.-M.L. and E.M.S.; Formal analysis: S.Z. and A.-M.L.; Investigation: S.Z. and A.-M.L.; Data curation: S.Z., A.-M.L. and E.M.S.; Writing—original draft preparation: S.Z., A.-M.L., N.P. and E.M.S.; Writing—review and editing: S.Z., A.-M.L., N.P., E.M.S. and R.S.; Visualization: S.Z., A.-M.L. and E.M.S.; Supervision: N.P. and R.S.; Funding acquisition: S.Z., N.P. and R.S. All authors have read and agreed to the published version of the manuscript.
Funding
This work was partially funded by the Austrian Research Promotion Agency (FFG), Vienna, Austria within the research project "SatPark", grant agreement No. 865997. Open Access Funding by TU Wien.
Acknowledgments
The authors would like to thank LAND INFO Worldwide Mapping, LLC for the approval of publicly sharing the four Barcelona test areas used in this investigation on the Zenodo data repository. The authors also acknowledge Open Access Funding by TU Wien.
Conflicts of Interest
The authors declare no conflicts of interest.
Abbreviations
The following abbreviations are used in this manuscript:
| AABB | Axis-Aligned Bounding Box |
| AP | Average Precision |
| CNN | Convolutional Neural Network |
| DSM | Digital Surface Model |
| DTM | Digital Terrain Model |
| FN | False Negative |
| FP | False Positive |
| FPN | Feature Pyramid Network |
| GSD | Ground Sample Distance |
| GT | Ground Truth |
| IoU | Intersection over Union |
| OBB | Oriented Bounding Box |
| OPALS | Orientation and Processing of Airborne Laser Scanning |
| OSM | Open Street Map |
| RGB | Red, Green, Blue |
| RFM | Rational Functional Model |
| RoI | Region of Interest |
| RPN | Region Proposal Network |
| RPCs | Rational Polynomial Coefficients |
| TP | True Positive |
Appendix A
Figure A1 shows the photogrammetric processing chain for stereo reconstruction and orthophoto derivation.
Figure A1.
The general workflow for satellite image processing, 3D reconstruction, DSM, digital terrain model (DTM), and orthophoto derivation.
Figure A1.
The general workflow for satellite image processing, 3D reconstruction, DSM, digital terrain model (DTM), and orthophoto derivation.

During satellite triangulation, a total number of 177 tie points were automatically extracted using a feature detector, followed by finding the point correspondences between images. The final standard deviation of the bundle adjustment was at sub-pixel level (0.95 pixels) and the estimated bias-correction model for Barcelona dataset contained two shifts—in X and Y directions—for each images. The correction parameters corresponding to the forward image are 1.71 pixels and 0.23 pixels in X and Y directions, respectively, whereas the backward image is shifted with −1.71 pixels in X and with −0.23 pixels in Y direction. The standard deviations of the estimated parameters vary between −0.036 and +0.037 pixels. All processes were performed using a system with an Intel(R) Core i7 3.50 GHz Processor and 32 GB RAM. Key performance figures are summarized in Table A1.

Table A1.
Image orientation and 3D reconstruction.
| No. of Tie Points | Sigma [pix] | Matching Proc. Time [h] | LAS File [GB] | No. of Points [mil.] |
|---|---|---|---|---|
| 177 | 0.95 | 13 | 24 | 1.028 |
Figure A2 illustrates the reconstructed 3D point cloud of Barcelona city coloured by RGB and elevation attributes.
Figure A3 shows an illustration of a test area as true orthophoto, that has a good geoposition with objects rectified to their correct locations, but shows distortion effects and artifacts along building roof edges, caused mainly by the high roughness of the photogrammetrically derived DSM. Moreover, buildings obscure the objects close to them, since their walls can be thought of as a rapid change in elevation. In the orthophoto generation process, these occluded areas are not detected and instead a double projection is created, known as “ghost images” or “double mapping effect”. When a building is orthorectified, it will obtain the original position in the rectified image, but it will also leave a “copy” on the terrain (see double projected roof in the right image of Figure A3. During reprojection, rays are projected back to both the occluded area and the obscuring object (building), therefore the “false” image data is rectified in the occluded areas.)
Figure A2.
3D point cloud of Barcelona city colored by RGB and elevation information with a zoom of a selected area in the city center.
Figure A2.
3D point cloud of Barcelona city colored by RGB and elevation information with a zoom of a selected area in the city center.

Figure A3.
Artifacts and distortion effects in the true orthophoto (center and right images) caused by the high roughness of the image-matched DSM (left image).
Figure A3.
Artifacts and distortion effects in the true orthophoto (center and right images) caused by the high roughness of the image-matched DSM (left image).

For enhancing the quality of the orthophotos, by reducing the distortion, double mapping effects and artifacts, we replaced the photogrammetric DSM with the DTM. The newly obtained orthophotos have the disadvantage of not handling sharp changes in elevation, because the terrain model does not include any objects on it, i.e., buildings and vegetation. As buildings are not modeled in the DTM, they have visible facades in the computed orthophoto, hiding street information (building leaning effects).
For a comparative view, Figure A4 shows the DTM and DTM-based orthophoto for the same area (as in Figure A3).
For deriving the DTM from the photogrammetric DSM over Barcelona city, we used the volume-based filtering approach developed by Piltz et al. [38] and implemented in the OPALS software. The mask for the open terrain was computed by setting the minimum height of the off-terrain objects to 3 m and the maximum width to 80 m. The width was set in accordance with the maximum length/width of existing buildings in the Barcelona dataset. Finally, the areas with missing elevation information were filled by triangulation.
Figure A4.
DTM (left image) and DTM-based orthophoto (center and right images).

Figure A5.
Barcelona digital models: (a) shaded view of the reconstructed DSM; (b) shaded and color-coded view of the DTM; (c) orthophoto.
Figure A5.
Barcelona digital models: (a) shaded view of the reconstructed DSM; (b) shaded and color-coded view of the DTM; (c) orthophoto.

References
- IBM Global Parking Survey: Drivers Share Worldwide Parking Woes. Available online: https://www-03.ibm.com/press/us/en/pressrelease/35515.wss (accessed on 6 July 2020).
- Rodrigue, J.P.; Comtois, C.; Slack, B. The Geography of Transport Systems, 3rd ed.; Routledge: New York, NY, USA, 2013. [Google Scholar]
- Searching for Parking Costs Americans $73 Billion a Year. Available online: https://inrix.com/press-releases/parking-pain-us/ (accessed on 6 July 2020).
- Cheng, G.; Han, J. A survey on object detection in optical Remote Sens. images. ISPRS J. Photogramm. Remote Sens. 2016, 117, 11–28. [Google Scholar] [CrossRef] [Green Version]
- Xiao, W.; Vallet, B.; Schindler, K.; Paparoditis, N. Street-side vehicle detection, classification and change detection using mobile laser scanning data. ISPRS J. Photogramm. Remote Sens. 2016, 114, 166–178. [Google Scholar] [CrossRef]
- Zhang, J.; Jia, X.; Hu, J. Error Bounded Foreground and Background Modeling for Moving Object Detection in Satellite Videos. IEEE Trans. Geosci. Remote Sens. 2019, 58, 1–11. [Google Scholar] [CrossRef] [Green Version]
- Xuan, S.; Li, S.; Han, M.; Wan, X.; Xia, G. Object Tracking in Satellite Videos by Improved Correlation Filters With Motion Estimations. IEEE Trans. Geosci. Remote Sens. 2020, 58, 1074–1086. [Google Scholar] [CrossRef]
- Ren, S.; He, K.; Girshick, R.; Sun, J. Faster R-CNN: Towards real-time object detection with region proposal networks. In Proceedings of the Advances in Neural Information Processing Systems 2015, Montreal, QC, Canada, 7–12 December 2015; pp. 91–99. [Google Scholar]
- Zambanini, S.; Login, A.M.; Pfeifer, N.; Soley, E.M.; Sablatnig, R. PaCaBa - Parking Cars Barcelona Dataset. 2020. Available online: https://doi.org/10.5281/zenodo.3701453 (accessed on 6 July 2020).
- Mundhenk, T.N.; Konjevod, G.; Sakla, W.A.; Boakye, K. A large contextual dataset for classification, detection and counting of cars with deep learning. In Proceedings of the European Conference on Computer Vision 2016, Amsterdam, The Netherlands, 8–16 October 2016; pp. 785–800. [Google Scholar]
- Xia, G.S.; Bai, X.; Ding, J.; Zhu, Z.; Belongie, S.; Luo, J.; Datcu, M.; Pelillo, M.; Zhang, L. DOTA: A large-scale dataset for object detection in aerial images. In Proceedings of the IEEE Conference on Computer Vision and Pattern Recognition 2018, Salt Lake City, UT, USA, 18–22 June 2018; pp. 3974–3983. [Google Scholar]
- Razakarivony, S.; Jurie, F. Vehicle detection in aerial imagery: A small target detection benchmark. J. Vis. Commun. Image Represent. 2016, 34, 187–203. [Google Scholar] [CrossRef]
- Liu, L.; Ouyang, W.; Wang, X.; Fieguth, P.; Chen, J.; Liu, X.; Pietikäinen, M. Deep learning for generic object detection: A survey. Int. J. Comput. Vis. 1809, 1–58. [Google Scholar] [CrossRef] [Green Version]
- Liu, W.; Zhang, Z.; Li, S.; Tao, D. Road Detection by Using a Generalized Hough Transform. Remote Sens. 2017, 9, 590. [Google Scholar] [CrossRef] [Green Version]
- He, H.; Zhou, J.; Chen, M.; Chen, T.; Li, D.; Cheng, P. Building Extraction from UAV Images Jointly Using 6D-SLIC and Multiscale Siamese Convolutional Networks. Remote Sens. 2019, 11, 1040. [Google Scholar] [CrossRef] [Green Version]
- Stankov, K.; He, D.C. Building detection in very high spatial resolution multispectral images using the hit-or-miss transform. IEEE Geosci. Remote Sens. Lett. 2012, 10, 86–90. [Google Scholar] [CrossRef]
- Baltsavias, E. Object extraction and revision by image analysis using existing geodata and knowledge: Current status and steps towards operational systems. ISPRS J. Photogramm. Remote Sens. 2004, 58, 129–151. [Google Scholar] [CrossRef]
- Bishop, C.M. Pattern Recognition and Machine Learning; Springer: Berlin/Heidelberg, Germany, 2006. [Google Scholar]
- Dalal, N.; Triggs, B. Histograms of oriented gradients for human detection. In Proceedings of the IEEE Conference on Computer Vision and Pattern Recognition 2005, San Diego, CA, USA, 20–26 June 2005; Volume 1, pp. 886–893. [Google Scholar]
- Ammour, N.; Alhichri, H.; Bazi, Y.; Benjdira, B.; Alajlan, N.; Zuair, M. Deep learning approach for car detection in UAV imagery. Remote Sens. 2017, 9, 312. [Google Scholar] [CrossRef] [Green Version]
- Audebert, N.; Le Saux, B.; Lefèvre, S. Segment-before-Detect: Vehicle Detection and Classification through Semantic Segmentation of Aerial Images. Remote Sens. 2017, 9, 368. [Google Scholar] [CrossRef] [Green Version]
- Terrail, J.O.D.; Jurie, F. On the use of deep neural networks for the detection of small vehicles in ortho-images. In Proceedings of the 2017 IEEE International Conference on Image Processing (ICIP), Beijing, China, 17–20 September 2017; pp. 4212–4216. [Google Scholar] [CrossRef] [Green Version]
- Long, J.; Shelhamer, E.; Darrell, T. Fully convolutional networks for semantic segmentation. In Proceedings of the IEEE Conference on Computer Vision and Pattern Recognition 2015, Boston, MA, USA, 7–12 June 2015; pp. 3431–3440. [Google Scholar]
- Liu, W.; Anguelov, D.; Erhan, D.; Szegedy, C.; Reed, S.; Fu, C.Y.; Berg, A.C. SSD: Single shot multibox detector. In Proceedings of the European Conference on Computer Vision 2016, Amsterdam, The Netherlands, 8–16 October 2016; pp. 21–37. [Google Scholar]
- Lin, T.Y.; Dollár, P.; Girshick, R.; He, K.; Hariharan, B.; Belongie, S. Feature pyramid networks for object detection. In Proceedings of the IEEE Conference on Computer Vision and Pattern Recognition 2017, Honolulu, HI, USA, 21–26 July 2017; pp. 2117–2125. [Google Scholar]
- Tang, T.; Zhou, S.; Deng, Z.; Lei, L.; Zou, H. Arbitrary-oriented vehicle detection in aerial imagery with single convolutional neural networks. Remote Sens. 2017, 9, 1170. [Google Scholar] [CrossRef] [Green Version]
- Azimi, S.M.; Vig, E.; Bahmanyar, R.; Körner, M.; Reinartz, P. Towards multi-class object detection in unconstrained Remote Sens. imagery. In Proceedings of the Asian Conference on Computer Vision 2018, Perth, Australia, 2–6 December 2018; pp. 150–165. [Google Scholar]
- Ding, J.; Xue, N.; Long, Y.; Xia, G.; Lu, Q. Learning RoI Transformer for Oriented Object Detection in Aerial Images. In Proceedings of the IEEE Conference on Computer Vision and Pattern Recognition, Long Beach, CA, USA, 16–20 June 2019; pp. 2844–2853. [Google Scholar] [CrossRef]
- AL-Alimi, D.; Shao, Y.; Feng, R.; Al-qaness, M.A.; Elaziz, M.A.; Kim, S. Multi-Scale Geospatial Object Detection Based on Shallow-Deep Feature Extraction. Remote Sens. 2019, 11, 2525. [Google Scholar] [CrossRef] [Green Version]
- Fan, Q.; Brown, L.; Smith, J. A closer look at Faster R-CNN for vehicle detection. In Proceedings of the 2016 IEEE Intelligent Vehicles Symposium (IV), Gotenburg, Sweden, 19–22 June 2016; pp. 124–129. [Google Scholar] [CrossRef]
- Tang, T.; Zhou, S.; Deng, Z.; Zou, H.; Lei, L. Vehicle detection in aerial images based on region convolutional neural networks and hard negative example mining. Sensors 2017, 17, 336. [Google Scholar] [CrossRef] [Green Version]
- Ren, Y.; Zhu, C.; Xiao, S. Small object detection in optical Remote Sens. images via modified faster R-CNN. Appl. Sci. 2018, 8, 813. [Google Scholar] [CrossRef] [Green Version]
- Yang, M.Y.; Liao, W.; Li, X.; Rosenhahn, B. Deep learning for vehicle detection in aerial images. In Proceedings of the 2018 25th IEEE International Conference on Image Processing (ICIP). IEEE, Athens, Greece, 7–10 October 2018; pp. 3079–3083. [Google Scholar]
- Li, Q.; Mou, L.; Xu, Q.; Zhang, Y.; Zhu, X.X. R3-Net: A Deep Network for Multioriented Vehicle Detection in Aerial Images and Videos. IEEE Trans. Geosci. Remote Sens. 2019, 57, 5028–5042. [Google Scholar] [CrossRef] [Green Version]
- Ma, J.; Shao, W.; Ye, H.; Wang, L.; Wang, H.; Zheng, Y.; Xue, X. Arbitrary-Oriented Scene Text Detection via Rotation Proposals. IEEE Trans. Multimedia 2018, 20, 3111–3122. [Google Scholar] [CrossRef] [Green Version]
- Poli, D.; Toutin, T. Review of developments in geometric modelling for high resolution satellite pushbroom sensors. Photogramm. Rec. 2012, 27, 58–73. [Google Scholar] [CrossRef]
- Trimble Geospatial. Available online: https://de.geospatial.trimble.com/products-and-solutions/inpho (accessed on 6 July 2020).
- Piltz, B.; Bayer, S.; Poznanska, A.M. Volume based DTM generation from Very High Resolution Photogrammetric DSMs. ISPRS Arch. 2016, 41, 83–90. [Google Scholar]
- Pfeifer, N.; Mandlburger, G.; Otepka, J.; Karel, W. OPALS–A framework for Airborne Laser Scanning data analysis. Comput. Environ. Urban Syst. 2014, 45, 125–136. [Google Scholar] [CrossRef]
- Bang, K.I.; Habib, A.F. Comparative Analysis of Alternative Methodologies for True Ortho-Photo Generation from High Resolution Satellite Imagery. In Proceedings of the ASPRS Annual Conference 2007, Tampa, FL, USA, 7–11 May 2007. [Google Scholar]
- Amhar, F.; Jansa, J.; Ries, C. The generation of true orthophotos using a 3D building model in conjunction with a conventional DTM. ISPRS Arch. 1998, 32, 16–22. [Google Scholar]
- Zhang, L.; Lin, L.; Liang, X.; He, K. Is Faster R-CNN Doing Well for Pedestrian Detection? In Proceedings of the European Conference on Computer Vision 2016, Amsterdam, The Netherlands, 8–16 October 2016; pp. 443–457. [Google Scholar]
- Koo, J.; Seo, J.; Jeon, S.; Choe, J.; Jeon, T. RBox-CNN: Rotated bounding box based CNN for ship detection in remote sensing image. In Proceedings of the 26th ACM SIGSPATIAL International Conference on Advances in Geographic Information Systems, Seattle, WA, USA, 6–9 November 2018; pp. 420–423. [Google Scholar]
- Simonyan, K.; Zisserman, A. Very Deep Convolutional Networks for Large-Scale Image Recognition. In Proceedings of the International Conference on Learning Representations (ICLR) 2015, San Diego, CA, USA, 7–9 May 2015. [Google Scholar]
- Girshick, R. Fast R-CNN. In Proceedings of the IEEE International Conference on Computer Vision, 2015, Santiago, Chile, 7–13 December 2015; pp. 1440–1448. [Google Scholar]
- Feng, D.; Haase-Schuetz, C.; Rosenbaum, L.; Hertlein, H.; Timm, F.; Glaeser, C.; Wiesbeck, W.; Dietmayer, K. Deep Multi-modal Object Detection and Semantic Segmentation for Autonomous Driving: Datasets, Methods, and Challenges. arXiv 2019, arXiv:1902.07830. Available online: https://arxiv.org/abs/1902.07830 (accessed on 6 July 2020). [CrossRef] [Green Version]
- Deng, J.; Dong, W.; Socher, R.; Li, L.J.; Li, K.; Fei-Fei, L. Imagenet: A large-scale hierarchical image database. In Proceedings of the IEEE Conference on Computer Vision and Pattern Recognition 2009, Miami, FL, USA, 22–24 June 2009; pp. 248–255. [Google Scholar]
- Everingham, M.; Van Gool, L.; Williams, C.K.; Winn, J.; Zisserman, A. The PASCAL Visual Object Classes (VOC) Challenge. Int. J. Comput. Vis. 2010, 88, 303–338. [Google Scholar] [CrossRef] [Green Version]
- Yan, J.; Wang, H.; Yan, M.; Diao, W.; Sun, X.; Li, H. IoU-adaptive deformable R-CNN: Make full use of IoU for multi-class object detection in Remote Sens. imagery. Remote Sens. 2019, 11, 286. [Google Scholar] [CrossRef] [Green Version]
- Yang, X.; Yang, J.; Yan, J.; Zhang, Y.; Zhang, T.; Guo, Z.; Sun, X.; Fu, K. SCRDet: Towards More Robust Detection for Small, Cluttered and Rotated Objects. In Proceedings of the IEEE International Conference on Computer Vision (ICCV) 2019, Seoul, Korea, 27 October–2 November 2019. [Google Scholar]
- Stentoumis, C.; Karkalou, E.; Karras, G. A review and evaluation of penalty functions for Semi-Global Matching. In Proceedings of the 2015 IEEE International Conference on Intelligent Computer Communication and Processing (ICCP), Cluj-Napoca, Romania, 3–5 September 2015; pp. 167–172. [Google Scholar]
- Lhuillier, M.; Quan, L. Robust dense matching using local and global geometric constraints. In Proceedings of the 15th International Conference on Pattern Recognition 2000, Barcelona, Spain, 3–7 September 2000; Volume 1, pp. 968–972. [Google Scholar]
- Loghin, A.M.; Otepka-Schremmer, J.; Pfeifer, N. Potential of Pléiades and WorldView-3 Tri-Stereo DSMs to Represent Heights of Small Isolated Objects. Sensors 2020, 20, 2695. [Google Scholar] [CrossRef]
Figure 1.
Overview of our proposed methodology for detecting parking cars in satellite images. The results of the individual steps are shown for a small sample region.
Figure 1.
Overview of our proposed methodology for detecting parking cars in satellite images. The results of the individual steps are shown for a small sample region.

Figure 2.
(a) A 4-point polygon annotation of a car; (b) converted OBB representation described by the five parameters x, y, h, w, and .
Figure 2.
(a) A 4-point polygon annotation of a car; (b) converted OBB representation described by the five parameters x, y, h, w, and .

Figure 3.
The data annotation postprocessing process for a small sample region; (a) raw polygons (only shown for one image); (b) converted OBB representations in both images; (c) overlapping OBBs denoting static cars.
Figure 3.
The data annotation postprocessing process for a small sample region; (a) raw polygons (only shown for one image); (b) converted OBB representations in both images; (c) overlapping OBBs denoting static cars.

Figure 4.
Orthophoto of Barcelona city with highlighted locations of the four ROIs and a detail view, coordinate reference frame: WGS 84/UTM 31N, units = meters.
Figure 4.
Orthophoto of Barcelona city with highlighted locations of the four ROIs and a detail view, coordinate reference frame: WGS 84/UTM 31N, units = meters.

Figure 5.
The two fusion mechanism investigated in this paper: (a) early fusion and (b) late fusion.
Figure 5.
The two fusion mechanism investigated in this paper: (a) early fusion and (b) late fusion.

Figure 6.
Two sample regions, where moving cars are effectively ruled out by our method and only parking cars are detected (from left to right: first stereo image, second stereo image, detections). Blue boxes depict ground truth, whereas green boxes depict the detections predicted with our early fusion methodology w/o DSM.

Figure 7.
Examples of parking car detections on the Barcelona test set. Blue boxes depict ground truth, whereas green boxes depict the detections predicted with our early fusion methodology w/o DSM.
Figure 7.
Examples of parking car detections on the Barcelona test set. Blue boxes depict ground truth, whereas green boxes depict the detections predicted with our early fusion methodology w/o DSM.

Figure 8.
Problematic conditions leading to individual false detections: (a) tree covering and (b) densely parked cars (from top to bottom: first stereo image, second stereo image, and detections).
Figure 8.
Problematic conditions leading to individual false detections: (a) tree covering and (b) densely parked cars (from top to bottom: first stereo image, second stereo image, and detections).

Figure 9.
Limitations of our proposed method: (a) two different cars covering the same spot lead to a false positive detection and (b) cars parked closed to high buildings are occluded in one of the stereo images.
Figure 9.
Limitations of our proposed method: (a) two different cars covering the same spot lead to a false positive detection and (b) cars parked closed to high buildings are occluded in one of the stereo images.

Figure 10.
Barcelona street network type (grid pattern with streets that intersect at right angles); detailed view of (a) WV-3 forward image, (b) DSM 0.30 m resolution with filled occlusions by interpolation, and (c) OSM street view.
Figure 10.
Barcelona street network type (grid pattern with streets that intersect at right angles); detailed view of (a) WV-3 forward image, (b) DSM 0.30 m resolution with filled occlusions by interpolation, and (c) OSM street view.

Figure 11.
Satellite image acquisition: (a) profile-view illustration of visible and non-visible areas (satellite track parallel with street azimuth and a null in-track viewing angle) and (b) satellite viewing geometry for street visibility.
Figure 11.
Satellite image acquisition: (a) profile-view illustration of visible and non-visible areas (satellite track parallel with street azimuth and a null in-track viewing angle) and (b) satellite viewing geometry for street visibility.

Figure 12.
Example of moving objects, shadowing, occlusions effects and parked cars not being reconstructed: (a) pansharpened WV-3 image and (b) corresponding Digital Surface Model (DSM).
Figure 12.
Example of moving objects, shadowing, occlusions effects and parked cars not being reconstructed: (a) pansharpened WV-3 image and (b) corresponding Digital Surface Model (DSM).

Table 1.
Acquisition properties for the stereo satellite image dataset over Barcelona.
| Acq. Date | View | Acq. Time | GSD [m] | Viewing Angles [] | Sun Angles [] | B/H | ||
|---|---|---|---|---|---|---|---|---|
| In-Track | Cross-Track | Azimuth | Elevation | |||||
| 20 July 2018 | Forward | 11:04:28.38 | 0.34 | 9.4 | 11.4 | 147.3 | 66.5 | 0.69 |
| Backward | 11:05:24.54 | 0.35 | −19.7 | 9.6 | 147.8 | |||
Table 2.
Parking car detection results on the Barcelona test set.
| Early Fusion | Late Fusion | |||
|---|---|---|---|---|
| with DSM | w/o DSM | with DSM | w/o DSM | |
| Precision | 0.696 | 0.745 | 0.697 | 0.712 |
| Recall | 0.674 | 0.659 | 0.706 | 0.704 |
| F1 Score | 0.693 | 0.700 | 0.701 | 0.708 |
| AP | 0.636 | 0.651 | 0.555 | 0.628 |
Table 3.
AP of early fusion car detection results w/o DSM dependent on the IoU threshold .
| 0.2 | 0.3 | 0.4 | 0.5 | 0.6 | |
| AP | 0.751 | 0.651 | 0.478 | 0.286 | 0.115 |
Table 4.
Visually examined failure categories for FPs and FNs collected on 14 out of 57 test images.
Table 4.
Visually examined failure categories for FPs and FNs collected on 14 out of 57 test images.
| Detected Static Cars | 379 | FPs | 21 | FNs | 240 |
|---|---|---|---|---|---|
| Image Clutter | 16 (76.2%) | Visible | 160 (66.7%) | ||
| Moving Cars | 5 (23.8%) | Occl. by trees | 19 (7.9 %) | ||
| Occl. by buildings | 61 (25.4 %) |
Table 5.
Runtimes of our method measured on a Nvidia Titan X GPU (3072 CUDA-Cores @ 1000MHz, 12GB GDDR5) and an Intel Xeon E5-2697v 2.6 GHz CPU.
Table 5.
Runtimes of our method measured on a Nvidia Titan X GPU (3072 CUDA-Cores @ 1000MHz, 12GB GDDR5) and an Intel Xeon E5-2697v 2.6 GHz CPU.
| GPU Training Time (200 epochs, 2.75 km) | GPU Prediction Time per km | CPU Prediction Time per km |
|---|---|---|
| 320 min | 2.2 s | 45 s |
© 2020 by the authors. Licensee MDPI, Basel, Switzerland. This article is an open access article distributed under the terms and conditions of the Creative Commons Attribution (CC BY) license (http://creativecommons.org/licenses/by/4.0/).
Share and Cite
MDPI and ACS Style
Zambanini, S.; Loghin, A.-M.; Pfeifer, N.; Soley, E.M.; Sablatnig, R. Detection of Parking Cars in Stereo Satellite Images. Remote Sens. 2020, 12, 2170. https://doi.org/10.3390/rs12132170
AMA Style
Zambanini S, Loghin A-M, Pfeifer N, Soley EM, Sablatnig R. Detection of Parking Cars in Stereo Satellite Images. Remote Sensing. 2020; 12(13):2170. https://doi.org/10.3390/rs12132170
Chicago/Turabian StyleZambanini, Sebastian, Ana-Maria Loghin, Norbert Pfeifer, Elena Màrmol Soley, and Robert Sablatnig. 2020. "Detection of Parking Cars in Stereo Satellite Images" Remote Sensing 12, no. 13: 2170. https://doi.org/10.3390/rs12132170
Note that from the first issue of 2016, this journal uses article numbers instead of page numbers. See further details here.