
A Luminance-Based Lighting Design Method: A Framework for Lighting Design and Review of Luminance Measures

1
Department of Civil & Natural Resource Engineering, University of Canterbury, Christchurch 8041, New Zealand
2
Department of Mechanical Engineering, University of Canterbury, Christchurch 8041, New Zealand
*
Author to whom correspondence should be addressed.
Sustainability 2023, 15(5), 4369; https://doi.org/10.3390/su15054369
Submission received: 19 January 2023
/
Revised: 21 February 2023
/
Accepted: 27 February 2023
/
Published: 1 March 2023
(This article belongs to the Special Issue Intelligent and Innovative Solutions for Sustainable and Healthy Built Environment)
Abstract
:Imaging photometers and ray-tracing software packages have made it possible to capture and model high-resolution and accurate luminance maps. However, luminance map measurement is rarely seen in professional practice, despite its ability to evaluate visual parameters accurately and directly, such as contrast, visual, size, and target brightness. Two barriers to the uptake of luminance measurement and associated design measures include (1) lack of knowledge of the range of measures available, and (2) difficulty in assessing whether a luminance-based lighting design method is a sufficient and justifiable replacement for the current illuminance-based practice. This paper reviews current practice and presents alternative luminance design measures and human needs for lighting to construct a framework for designing and comparing lighting design methods. It concludes by presenting a new luminance-based lighting method in the context of this framework to show that it is more accurate and comprehensive than current practice and can be enabled by emerging low-cost and increasingly accessible luminance measurement technologies. The overall outcomes provide the metrics and framework to bring more complete and effective luminance-based lighting design into practice.
1. Introduction
Historically, the backbone of indoor lighting design has been illuminance, measured with the illuminance, or ‘lux’, meter. More specifically, the lighting design task has been to guide the application of light to meet recommended levels of illuminance on the working plane. However, new lighting measurement tools are available, including luminance meters, imaging photometers, and spectroradiometers, which capture more visually relevant dimensions of lighting such as light distribution and spectrum. Assessing more dimensions of lighting has the potential to improve lighting practice, as lighting can be more effectively tailored to meet the full gamut of visual needs. However, these information-rich tools are yet to be integrated into lighting design practice.
Imaging photometers, also known as luminance imaging devices, are a data-rich measurement tool that capture luminance maps, which are analogous to an image wherein each pixel represents a luminance reading. Luminance maps capture the distribution of light in the surrounding lit environment and closely reflect human vision. Luminance imaging devices capture light for a view like a camera. Because reflected light can vary with angle, multiple locations and orientations of the image normal are required to fully characterise a lit environment.
Fundamental visual parameters such as visual size, target contrast, and object luminance may be extracted from a luminance map and used to derive a comprehensive suite of lighting measures. Therefore, the use of luminance maps can guide the more effective design of lighting, more closely matching the application of light to the underlying visual need. By contrast, illuminance measurements cannot evaluate all these visual parameters and thus form a lower-resolution lighting measurement device. Overall, luminance maps and their derived lighting measures enable better performing and more efficient lighting by directing light to meet the underlying visual need and eliminate wasteful over-lighting.
Luminance-based lighting design also enhances passive lighting design, as existing daylight methods are driven and constrained by illuminance targets, which relate poorly to visual needs. Adopting a luminance basis for daylighting design enables the sufficiency of natural lighting to be evaluated directly against the fundamental visual needs, and thus is a more specific basis for design. Through eliminating wasteful artificial over-lighting, enhancing daylighting design will lead to lower energy use, greener buildings, and overall enhanced sustainability. Additionally, designing closer to visual needs guarantees lighting performance and minimises visual strain, which leads to better performing and healthier buildings.
Despite the benefits of luminance maps and measures, a luminance basis does not exist as a clear alternative to illuminance-based lighting design. For the practitioner, it is unclear which luminance measures are available, how these measures should be applied, and whether these measures form a comprehensive alternative method to the current illuminance-based lighting design. These questions raise a more fundamental question: “what is required from a lighting design method?”
This paper is divided into four six sections. Section 2 covers the relevant background of the topic and makes the case for a luminance-based lighting practice. Section 3 addresses the question of what is required from a lighting design method by reviewing current and alternative lighting design measures and methods to elucidate the key requirements for lighting design. Lighting “measure” is defined here as a single lighting calculation, such as working plane illuminance or Unified Glare Index, and lighting “method” is defined as a suite of measures employed for a full lighting design. The results of this review are presented as a framework to meaningfully define and compare different lighting design measures and methods. In Section 4, luminance measures are reviewed. In Section 5, an alternative luminance-based lighting method is presented and demonstrated as a sufficient replacement to the current illuminance-based practise, in the context of the framework presented. Section 6 concludes the research and summarizes key takeaways.
2. Background
Illuminance (lx, lm/m2) is the foundation of lighting design. Task illuminance at the working plane, a horizontal plane at working height, is required for compliance to many lighting standards [1] and is recommended in design guides [2,3]. Illuminance is typically measured from illuminance, also called ‘lux’, meters, although it can also be derived from luminance maps [4]. The devices accept light from the surrounding hemisphere and the read out is equivalent light flux incident on the plane of the device at that point in space. Typically, a grid of measurements will be taken across the area of interest to capture the average illumination and its uniformity. Although any device orientation may be used, the most common measurement orientation is the horizontal plane; however, the vertical plane, or vertical illuminance, is also used.
The key measures and recommendations in the currently accepted lighting design methodology, the Working Plane Illuminance (WPI) method, include illuminance uniformity, glare index, and colour rendering index [5]. The WPI method assumes that these measures, in combination, will ensure adequate visual conditions.
The WPI method was developed using historically available technology. However, the emergence of new light-measurement technologies means that WPI is no longer the best way to incorporate visual science into lighting design. Technological development has enabled accurate luminance meters [6], imaging photometers [7], custom luminance imaging devices [8,9,10,11,12,13,14,15,16], 360° high dynamic range imaging tools [17,18], custom quasi-spectral imaging radiometers [19], and lighting modeling software packages [20] for measuring or modeling luminance and luminance maps. Luminance maps capture the distribution of light in the surroundings, which is reflected or direct light in the environment, and can be expressed with luminance images, where each pixel represents a luminance measurement of the surroundings.
Furthermore, the WPI method and associated recommended levels are imprecise. Illuminance recommendations, and the consensus basis for their derivation, have attracted criticism for being guided by factors other than visual needs [21], such as economic and technological forces. These outside drivers may thus better explain their significant variation over their century of use, as shown in Figure 1.
In addition, the movement away from a criteria-based approach and towards single-zone-based illuminance recommendations has attracted criticism for providing largely arbitrary values [24]. The recommended illuminance levels also map poorly to the visual requirements for performance or preference. For example, visual performance for dark 10 pt text on standard office paper, a common office reading task, is saturated at 25 lux [RVP = 0.95] (80% contrast, 30-year-old observer, 1 m reading distance) [25], which is far lower than the typical recommended levels of 300 to 500 lux. This low requirement corresponds to the experience of successfully reading in dim lighting. Finally, visual preference by workplace illuminance is highly individual and does not correlate well with recommended levels: self-selected illuminance values can vary between 200 and 700 lux [26].
The imprecision of illuminance may be due to the fact that illuminance readings include or condense many lighting components, such as background and target luminance, workstation luminance and contrast, room surface luminance, and contrast. Importantly, each of these components can affect performance and preference, and would be better assessed as separate elements. Such independent consideration of each element cannot be done using illuminance but can be done with luminance maps.
Overall, the key visual parameters in the WPI method are not directly evaluated. Instead, the critical lighting elements are measured either indirectly, as with visual performance where illuminance values are used as a proxy, estimated by simulation, as with discomfort glare or daylighting glare, or left unassessed, as with disability glare. Hence, the WPI method, and illuminance measures in general, is a less direct method, which is used largely due to the difficulty in obtaining accurate luminance maps.
In contrast, luminance maps are a better measure than illuminance for lighting design, as they directly assess key visual parameters, are more data-dense, and can be used to evaluate a comprehensive suite of lighting measures. Luminance maps can be used to directly assess known key visual parameters, including visual size (steradians), location in the field of view (FOV), object luminance, and luminance contrast. These visual parameters can be used to evaluate critical visual requirements, such as visual detection threshold [27], visual performance [27], and glare, including discomfort glare [28] and disability glare [28].
Luminance maps are more data-dense and can be used to evaluate a greater set of lighting measurements compared to illuminance measurements. A luminance map contains the distribution of light intensity over the FOV, which could correspond to millions of readings depending of the resolution of the image. In an illuminance measurement, this distribution is lost as it is consolidated into a single reading, and thus a great deal of data is lost.
More specifically, luminance maps may be used to derive a large set of lighting measures, including relative visual performance (RVP) [25], disability and discomfort glare measurements [28,29], various lighting quality metrics [30,31], alternative lighting metrics such as mean room surface exitance (MRSE) [32,33], and even illuminance [4]. Alternative illuminance measures exist that can also be assessed with luminance maps and include cylindrical illuminance [27], cubic illuminance [34,35], and vertical illuminance [3,23]. Thus, while alternative illuminance measures exist and add data compared to working plane readings, these measures still do not encode the same level of data as luminance maps, nor can they be used to evaluate the same suite of lighting measures as luminance maps.
Overall, luminance maps have greater specificity than illuminance measures. They capture light distribution, which has been noted as a missing piece in lighting design [36], and are a well-suited tool for a wide range of lighting measures [31]. The adoption of luminance-map-based lighting design as a replacement, or addition, to the illuminance-based method of measurement offers a large opportunity to evolve lighting design into a new era with better performing and more efficient lighting by designing lighting systems to directly meet underlying visual requirements.
3. Requirements for Lighting Design
Lighting design has emerged out of historically available technologies, visual science, and evolving needs for lighting [37]. As such, lighting design has not been explicitly “designed” to set criteria. To better understand the context of lighting requirements, we took a retrospective approach that drew from a range of commentary, current practice, and proposed alternative lighting measures that highlight perceived gaps in current practice. This review was used to make a framework by which to compare different lighting design measures and methods on the same basis.
3.1. Human Needs Served by Lighting and CSP
The Illumination Engineering Society of North America (IESNA) lighting handbook [30] outlines the range of human needs served by lighting, which include (1) visibility; (2) visual comfort; (3) aesthetic judgment; (4) task performance; (5) social communication; (6) mood and atmosphere; (7) health, safety, and well-being. The list of needs does not clearly separate the visual need, such as visibility, from the application, such as task performance, social communication, or safety. More specifically, the first three needs are primarily visual factors (visibility, visual comfort, and aesthetic judgement (appearance)), and the latter (4–7) are ill-defined or specific applications of the first three.
The CSP index was developed to determine lighting satisfaction [38]. The model assumes a three-factor basis to lighting quality: Comfort, Satisfaction, and Performance. The index assesses Comfort as the absence of glare, Satisfaction regards the appearance of people and objects in the office and is evaluated as a ratio between vertical cylindrical illuminance and horizontal illuminance, and Performance includes the illuminance, uniformity, and Colour Rendering Index. The CSP index is comprised of a series of correlations for users in offices where computer monitors are used and those where they are not. The index provides a single number, which has been correlated to lighting satisfaction. In the CSP index, lighting distribution is handled as a ratio between vertical and horizontal illuminance, or direct and indirect illumination, instead of conducting the more detailed evaluation of lighting distribution that is possible with luminance maps. As such, it overlooks preferred lighting variation within view, which has been identified as a flaw of the model [38].
3.2. The Working Plane Illuminance (WPI) Lighting Design Methodology
Working plane illuminance is the illuminance level provided at the working plane, defined as a horizontal plane at a task-specific height, such as desk height for office work. The WPI method is a lighting design method utilizing working plane illuminance, illuminance uniformity, a discomfort glare rating such as the Unified Glare Rating (UGR), and a colour rendering index (CRI). This lighting method is employed in guidance documents from institutions such as SLL [23] and the IESNA [3], as well as in various standards [1].
The illuminance recommended for offices ranges from 200–700 lux [26], with recommended levels increasing for visually difficult tasks, or where higher working speed and greater attention are required. Illuminance uniformity is specified to ensure adequate illuminance throughout the working area, as overhead lighting naturally produces variable levels of illumination. Uniformity is generally expressed as the ratio of minimum illuminance to average working plane illuminance. However, formulations can vary. Typical minimum uniformity values for offices are between 0.7 and 0.9, with higher values where task performance is more critical [23].
Discomfort glare is produced by high luminance–contrast ratios. The visual system is more sensitive to high luminance in certain regions of the FOV [39]. The most commonly used metric for discomfort glare for indoor lighting is the Unified Glare Rating (UGR) [40]. Typical maximum UGR values range from 13 to 30 [23,41].
Colour appearance is a function of surface properties and the incident light wavelength composition. The colour rendering index (CRI) is a 0 to 100 scale used to ensure faithful colour reproduction as related to a standard light source [5].
3.3. Alternative Lighting Design Measures
Alternative bases for lighting design have been proposed. They typically arise from observed shortcomings in the WPI method and thus highlight its gaps. These gaps can be used to address where WPI methods may be improved, or where it misses key requirements.
Alternative illuminance measures include vertical illuminance, cylindrical illuminance, and cubic illuminance. Vertical illuminance is mentioned in guidance documents for lighting whiteboards in education settings and storage racking in warehousing [23], although values are not specified. Cylindrical illumination is the illuminance falling on the surface of a vertically orientated cylinder and is specified for social communication in office settings [42]. Semi-cylindrical illumination is used for street lighting applications [42]. Cubic illumination [34,35] involves six illuminance measurements about a point corresponding to the faces of a cube. These six measurements capture light directionality at a point and are used to calculate other illuminance measures, such as vertical or cylindrical illuminance [34].
Mean room surface exitance (MRSE) is a measure of the reflected light in a room, and, as such, gives an indication of the overall ambient light level [32]. Exitance is the visible light reflected or emitted from a surface per unit area, and mean room surface exitance is the geometric average of all the exitance of interior surfaces. MRSE correlates better than illuminance to Perceived Adequacy of Illumination (PAI) [43].
Alternative illuminance measures (vertical, cylindrical, and cubic) highlight the need to also assess the directionality of light beyond the working plane. Directionality is important for vertical task performance and social communication, and assessing lighting in multiple directions is an important requirement for a lighting design method. MRSE also highlights the need to consider reflected light (surface exitance), rather than surface illumination. MRSE and exitance, in general, consider both incident illuminance as well as surface reflectance. As such, MRSE introduces more elements into lighting design.
3.4. A Framework for Lighting Design Methods
Given this discussion of current and alternative measures and outline of human needs and requirements, Figure 2 presents a simple three-factor framework to compare lighting design measures and methods. In particular, this framework is intended to meaningfully compare alternative lighting methods to the WPI method. In this framework, aspects of lighting design are divided into three broad visual categories: Visibility; Comfort; and Appearance. Any method may be compared by how accurately and comprehensively it assesses all categories and associated needs.
A retrospective approach was used to determine the requirements for lighting design, wherein three sources of information were reviewed to assess lighting design from a multi-perspective approach. Firstly, commentary and existing frameworks such as the “human needs for lighting” and CSP index were reviewed. Secondly, current lighting design practice (the WPI method) was reviewed, as it is expected that current practice can implicitly reveal lighting requirements. Thirdly, alternative lighting measures were reviewed, as these highlight perceived gaps, i.e., lighting requirements that are inadequately met, in current practice. Where multiple perspectives converged, the common ground represented a grounded set of lighting requirements.
From these reviews, three factors emerged as visual categories that can organise all identified visual needs and the lighting measures that serve to fulfil them. These categories are Visibility, Comfort, and Appearance. While these categories are similar to the three assumed factors in the CSP model [38], they have been justified by a multi-perspective approach. Additionally, where Satisfaction is related to the appearance of people and objects in the CSP model, in this work, the term “Appearance” is used, as “Satisfaction” is beyond the scope of a single visual category. These three categories map well to the identified ‘needs for lighting’, the lighting measures used in current practice, and alternative measures, as seen in the rows of Figure 2. The categories are also largely independent, as comfort has minimal impact on visibility, visibility on appearance, and so forth. Overall, the framework is a suitable platform for comparing lighting design measures and methods.
As can be seen, each human need for lighting is reflected in the more fundamental visual requirements, which define the framework in Figure 2. For example, task performance, social communication, and health and safety are purely, or in large part, expressions of visibility, with only the object or task changing. The same principle is true for the other visual requirements in Figure 2. Some human needs for lighting have two visual components. For example, health and safety is a function of visibility and comfort, which could be divided as the need to safely navigate a room (Visibility) and the need to be free from persistent or intense discomfort (Comfort). A complete system or method would have entries in every row for the column it occupies for comparison.
The elements of the WPI design method were fitted within the framework of Figure 2. Each of the key measures was fit into a category. Visibility is assessed by working plane illuminance and uniformity. Comfort is assessed by UGR, and appearance is assessed with CRI. While uniformity will affect appearance, the stated purpose is to ensure minimum illuminance, and so was attributed only to visibility.
Using this framework, lighting methods and measures may be compared. Two terms are useful for assessing the efficacy of methods and measures: ‘comprehensive’ and ‘accurate’. A ‘comprehensive’ method addresses all the visual categories. ‘Accurate’ assessment of a visual category relates to the evaluation of the underlying visual needs for an application. For example, Visibility is influenced both by target illuminance and disability glare. Assessing both components is more accurate than assessing only one. Equally, Visibility has many applications, or needs served, and incorporating measures assessing or applying to more applications is a more accurate assessment of the visual category. Thus, including Visibility measures that serve social communication, such as vertical illuminance, as well as task performance using working plane illuminance, would be more accurate than using only a single measure. In practice, measurement device accuracy will also affect how accurately the underlying visual needs are evaluated. However, in this work, the primary consideration and use of the term ‘accuracy’ relate to how lighting measures and methods map to visual requirements.
Under this framework, it should be direct and simple to determine whether an alternative lighting design methodology is sufficient to be used in place of the WPI method in the first column of methods compared in Figure 2. If a lighting method is equally or more comprehensive and accurate than the WPI method, using these definitions, such a method would provide a suitable alternative.
Putting lighting measures in this framework also provides the opportunity to create a lighting method that best suits a particular lighting design application, where different applications could have their own weighting across the three visual categories. For example, a reception area with low requirements for visibility is justified in adopting MRSE as the primary design measure and ensuring adequate visibility by exceeding (very low) minimum illuminance levels. By contrast, a dental surgery with high visibility requirements and low expectations for appearance can use working plane illuminance targets. Thus, this framework provides justification for exercising flexibility to best meet application-specific needs.
Finally, the framework can be reformulated as knowledge grows. For instance, research is being conducted into the health effects of lamp spectral composition [46]. This need for health does not fit well within the three visual categories presented in Figure 2, but could be added as a fourth category. Hence, the framework is readily extensible. However, in the case of spectral assessment, neither luminance nor illuminance meters are suitable for this task, as they do not differentiate light spectra but give only the luminous power. Instead, spectroradiometers would be required.
4. Review of Luminance-Based Measures
Luminance meters, new imaging photometers, and modelling and rendering techniques allow increasingly accurate luminance and luminance map measurements and modelling. Luminance maps can be used to assess many lighting measures directly and accurately. Hence, greater incorporation of luminance-based measures into lighting design can bring significant improvements in lighting performance and efficiency. The review presented here uses the same visual categories as the framework in Figure 2.
4.1. Visibility
Visibility depends on the contrast between an object and its background, the target size, the target luminance, and observer age, as visual acuity decreases with age. These metrics can be directly extracted from a luminance map. The threshold of detection is the combination of these visual parameters, where an object is just perceivable [47]. Above this threshold, visual performance increases with increasing visual size, target contrast, and target luminance.
Visual performance is the visual component of task performance and a key part of visibility. Early work in the science of visual performance [48] informed recommended illuminance levels for different types of work. Later, relative visual performance (RVP) [25] was derived to elucidate the relationship between the parameters of visibility. RVP varies between 0 and 1. Above 1, the visual component of performance is saturated, and further changes to visual conditions produce no more favourable visual conditions for performance. RVP increases as target size, contrast, and background luminance increase, as shown in Figure 3. Although a visual performance basis to lighting design has been criticised [21], RVP embeds important information about visibility.
Visual performance decreases in the presence of disability or veiling glare [28,49], which is caused by scattering of light within the eye [50]. The scattered light forms a veil over the object, effectively reducing the apparent contrast, a significant component of visibility, and consequently reducing visibility. The contrast reduction due to veiling glare is expressed as
where C’ is the reduced target contrast, LT and LB are the target and background luminance, and LV is the veiling luminance, defined as
where E is the illuminance at the eye from the glare source, L is the luminance of the glare source, θ is the position in the FOV, Ω is the solid angle of the glare source, and n is an index denoting the number of the source.
C’ = 1 − (LT + LV)/(LB + LV)
LV = 10 ∑ En/θn = 10 ∑ LS,n × Ωn/θ2n
Disability glare is expected to be small where discomfort glare is small, and is thus not typically evaluated [23]. However, large floor-to-ceiling windows, common in modern offices, are large light sources in direct view, with small values of θ, and so disability glare may be significant in these settings. Thus, disability glare evaluation cannot be ignored, particularly for efficient low-light (low LT) lighting designs. As can be seen from Equations (1) and (2), disability glare assessment requires luminance maps.
4.2. Comfort
Discomfort glare is the discomfort due to scenes of high luminance or contrast. Discomfort glare measures exist, including the Unified Glare Rating (UGR) [40] and Visual Comfort Probability (VCP) [39], primarily for lamp glare assessment, and Daylight Glare Probability (DGP) [44] for daylighting glare assessment. UGR is the most ubiquitous rating, and is defined as
where Lb is the background luminance (cd/m2), Ls is the luminaire luminance (cd/m2), Ω is the solid angle subtended at the observer’s eye by the luminaire (Steradians), and ρ is the Guth position index.
UGR = 8log10 (0.25/Lb ∑Ls2Ω/ρ2)
As with UGR, all glare ratings are a function of the luminance, size, and position of the light source in the FOV, and require luminance maps for direct assessment. While this assessment is often simplified by lamp manufacturers providing UGR values for standard lamp arrays or using simple models [51], this method is not possible for daylight glare. In particular, the fact that assessing daylight glare would need luminance maps and (consequently) either involved modelling tools or inaccessible measurement tools means that daylight glare assessment is often overlooked in practice.
Other formulations for glare exist, including more complicated formulations that consider the source luminance and position in the FOV [45] and simple luminance contrast metrics [41]. These formulations are summarised in Table 1. These simple metrics only require a luminance meter to evaluate but are equally limited in their capability.
4.3. Appearance
Some degree of luminance variation is preferred by room occupants [26,30]. For example, the preferred maximum-to-minimum luminance ratio in the field of view is around 20:1 [26]. In addition, luminance contrast between surfaces or objects and their surroundings draws attention and can promote task focus or highlight objects. These effects can be used in design with sufficient modelling power [52] or measurement capability. Spatial luminance ratios prescribed by IESNA guidance for task attention and visual attraction are summarised in Table 2 and Table 3, respectively.
Additionally, variations in light appear to influence the perceived brightness of a space beyond the light level alone. Lower uniformity can lead to an increased perception of room brightness. For example, 5–10% less working plane illuminance was required to match the brightness of a non-uniformly lit room with an otherwise identical uniformly lit room [53]. As such, the largely unutilised parameter of lighting variance provides an avenue for more efficient lighting design.
4.4. Summary of Luminance Measures
Luminance maps can be used to derive fundamental visual parameters, such as contrast, object luminance, and visual size, They may also be used to directly evaluate performance and evaluate glare indices, which cannot be measured directly with illuminance measures. In particular, the most accurate indicators of visual performance, RVP, and disability glare can only be evaluated with luminance maps. Additionally, all glare indices require luminance maps. The use of luminance maps allows glare to be evaluated directly instead of indirectly, as in current practice. Furthermore, lighting distribution, which has a significant role on the appearance of a room, requires luminance maps. In particular, the use of luminance maps allows lighting designers to assess many useful luminance ratios for preference, attention, and attraction.
Thus, luminance map data give lighting designers access to more useful measures and remove the need to rely on accepted illuminance levels, enhancing designer flexibility. For example, with the assessment of RVP and disability glare, it may be shown that there is no performance benefit meeting illuminance targets in an office building, and the lighting designer is justified in lowering the overall lighting power delivered and using non-energy-intensive means to enhance the appearance of a room, thus enabling flexible passive design. Possible low-energy means to enhance appearance include changing room surface reflectance and the distribution of lighting.
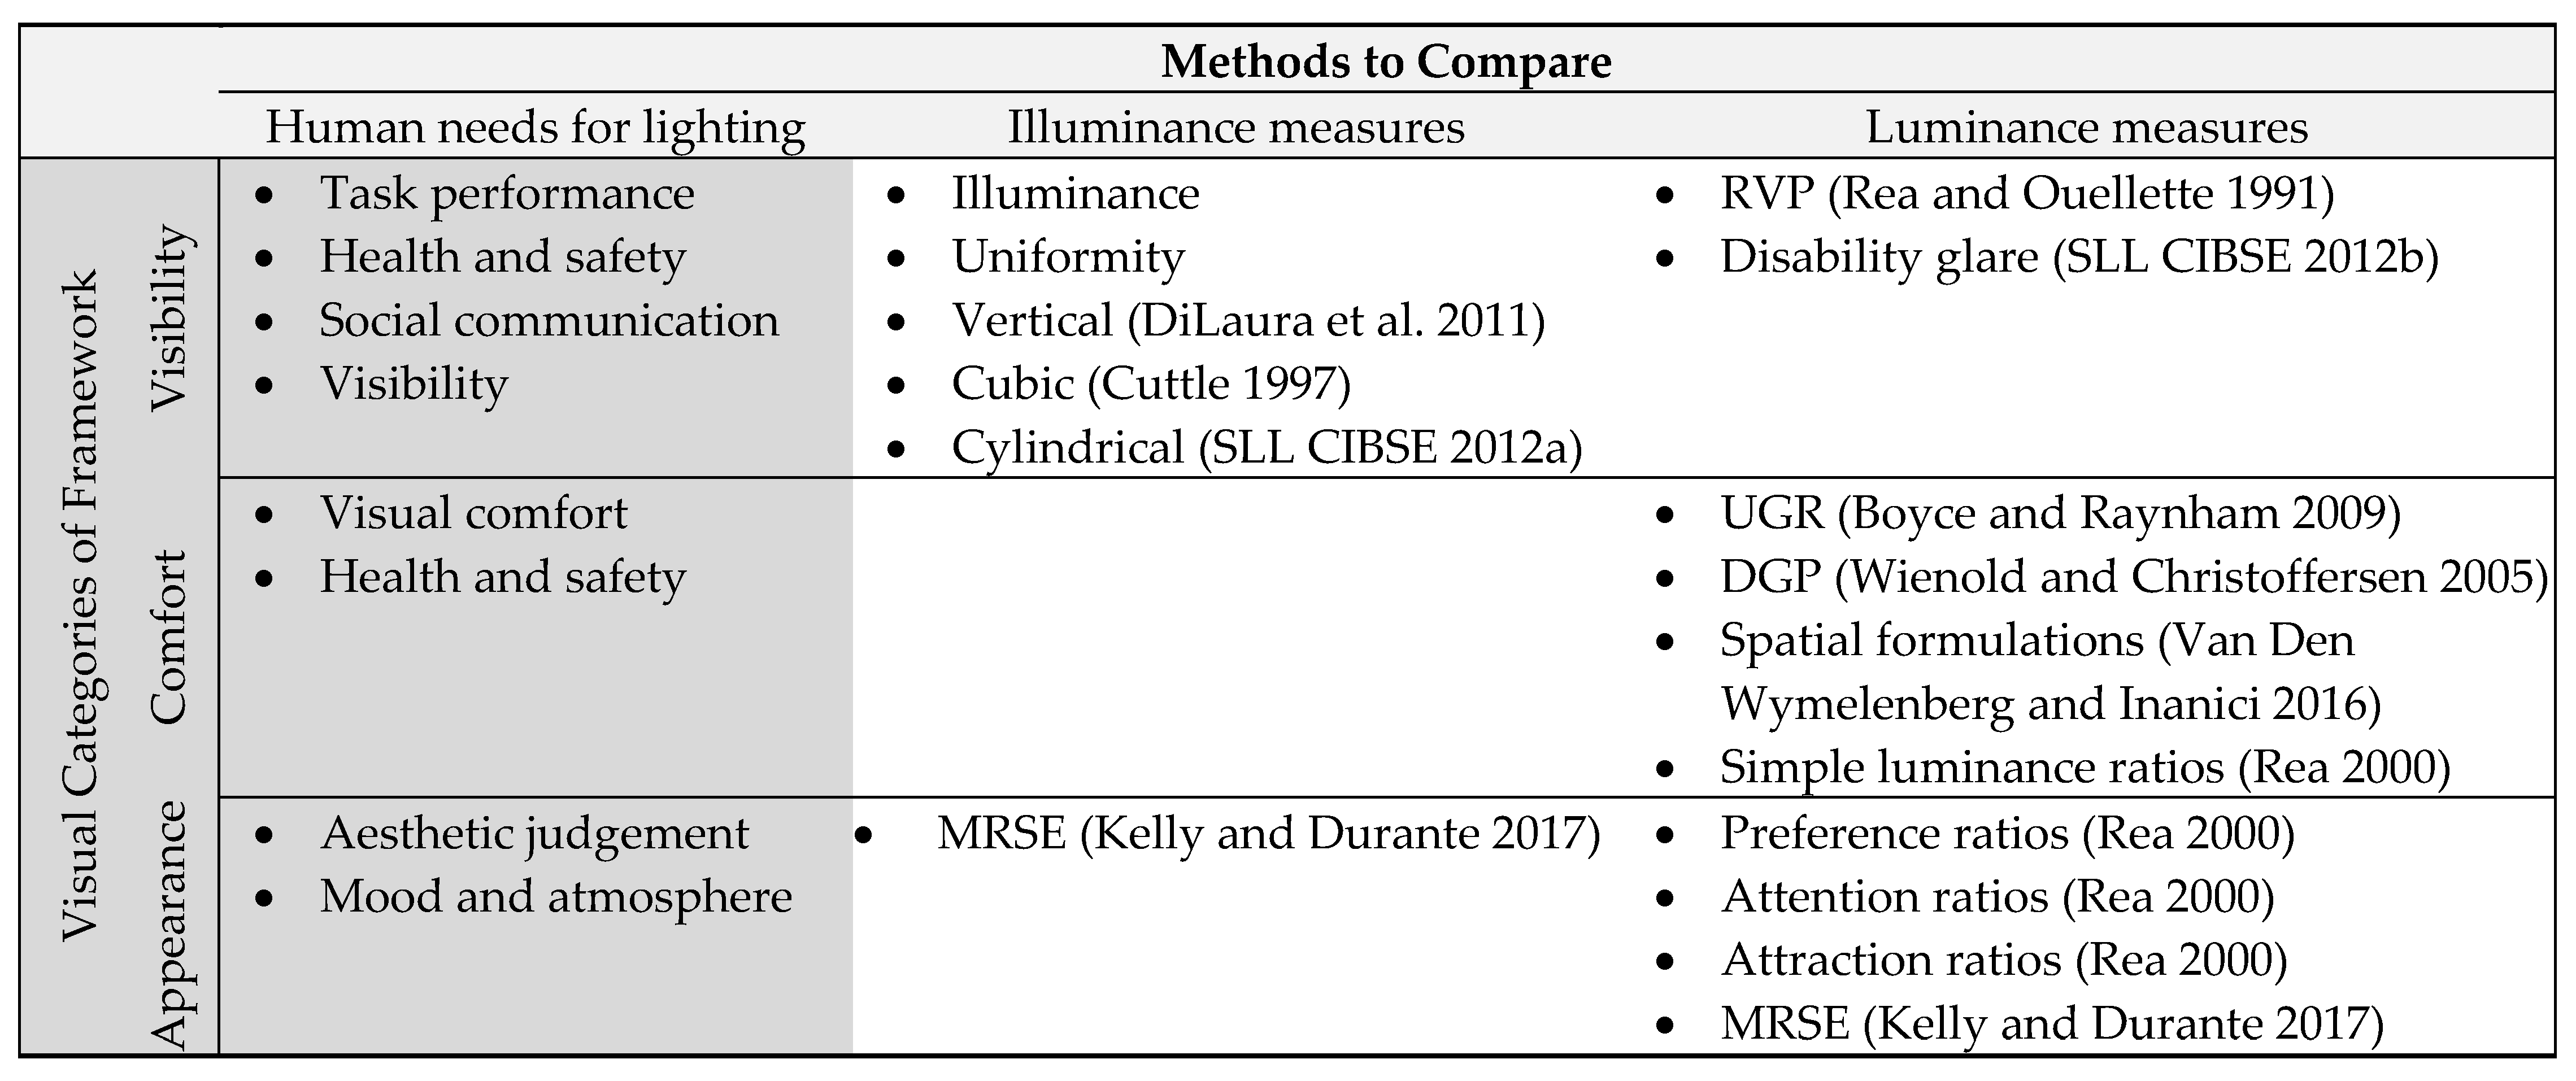
The review of luminance identified a range of available luminance measures to assess all the visual categories, as shown in Figure 4, using the framework of Figure 2. Figure 4 maintains the visual categories and human needs for lighting from Figure 2, but compares both illuminance measures and luminance measures instead of the WPI method and alternative illuminance measures used to derive the framework. Note that MRSE is included as both an illuminance and luminance measure, as the measure may be assessed both with an illuminance meter and HDR imaging [32,54]. The comparison between illuminance and luminance measures in the framework enables straightforward comparison of the available measures against each visual category and measurement instrument. The luminance measures presented are consolidated in the next section into a readily implementable luminance method and shown to be a sufficient replacement for the WPI method using the framework created.
5. A Proposed Luminance-Based Lighting Design Method
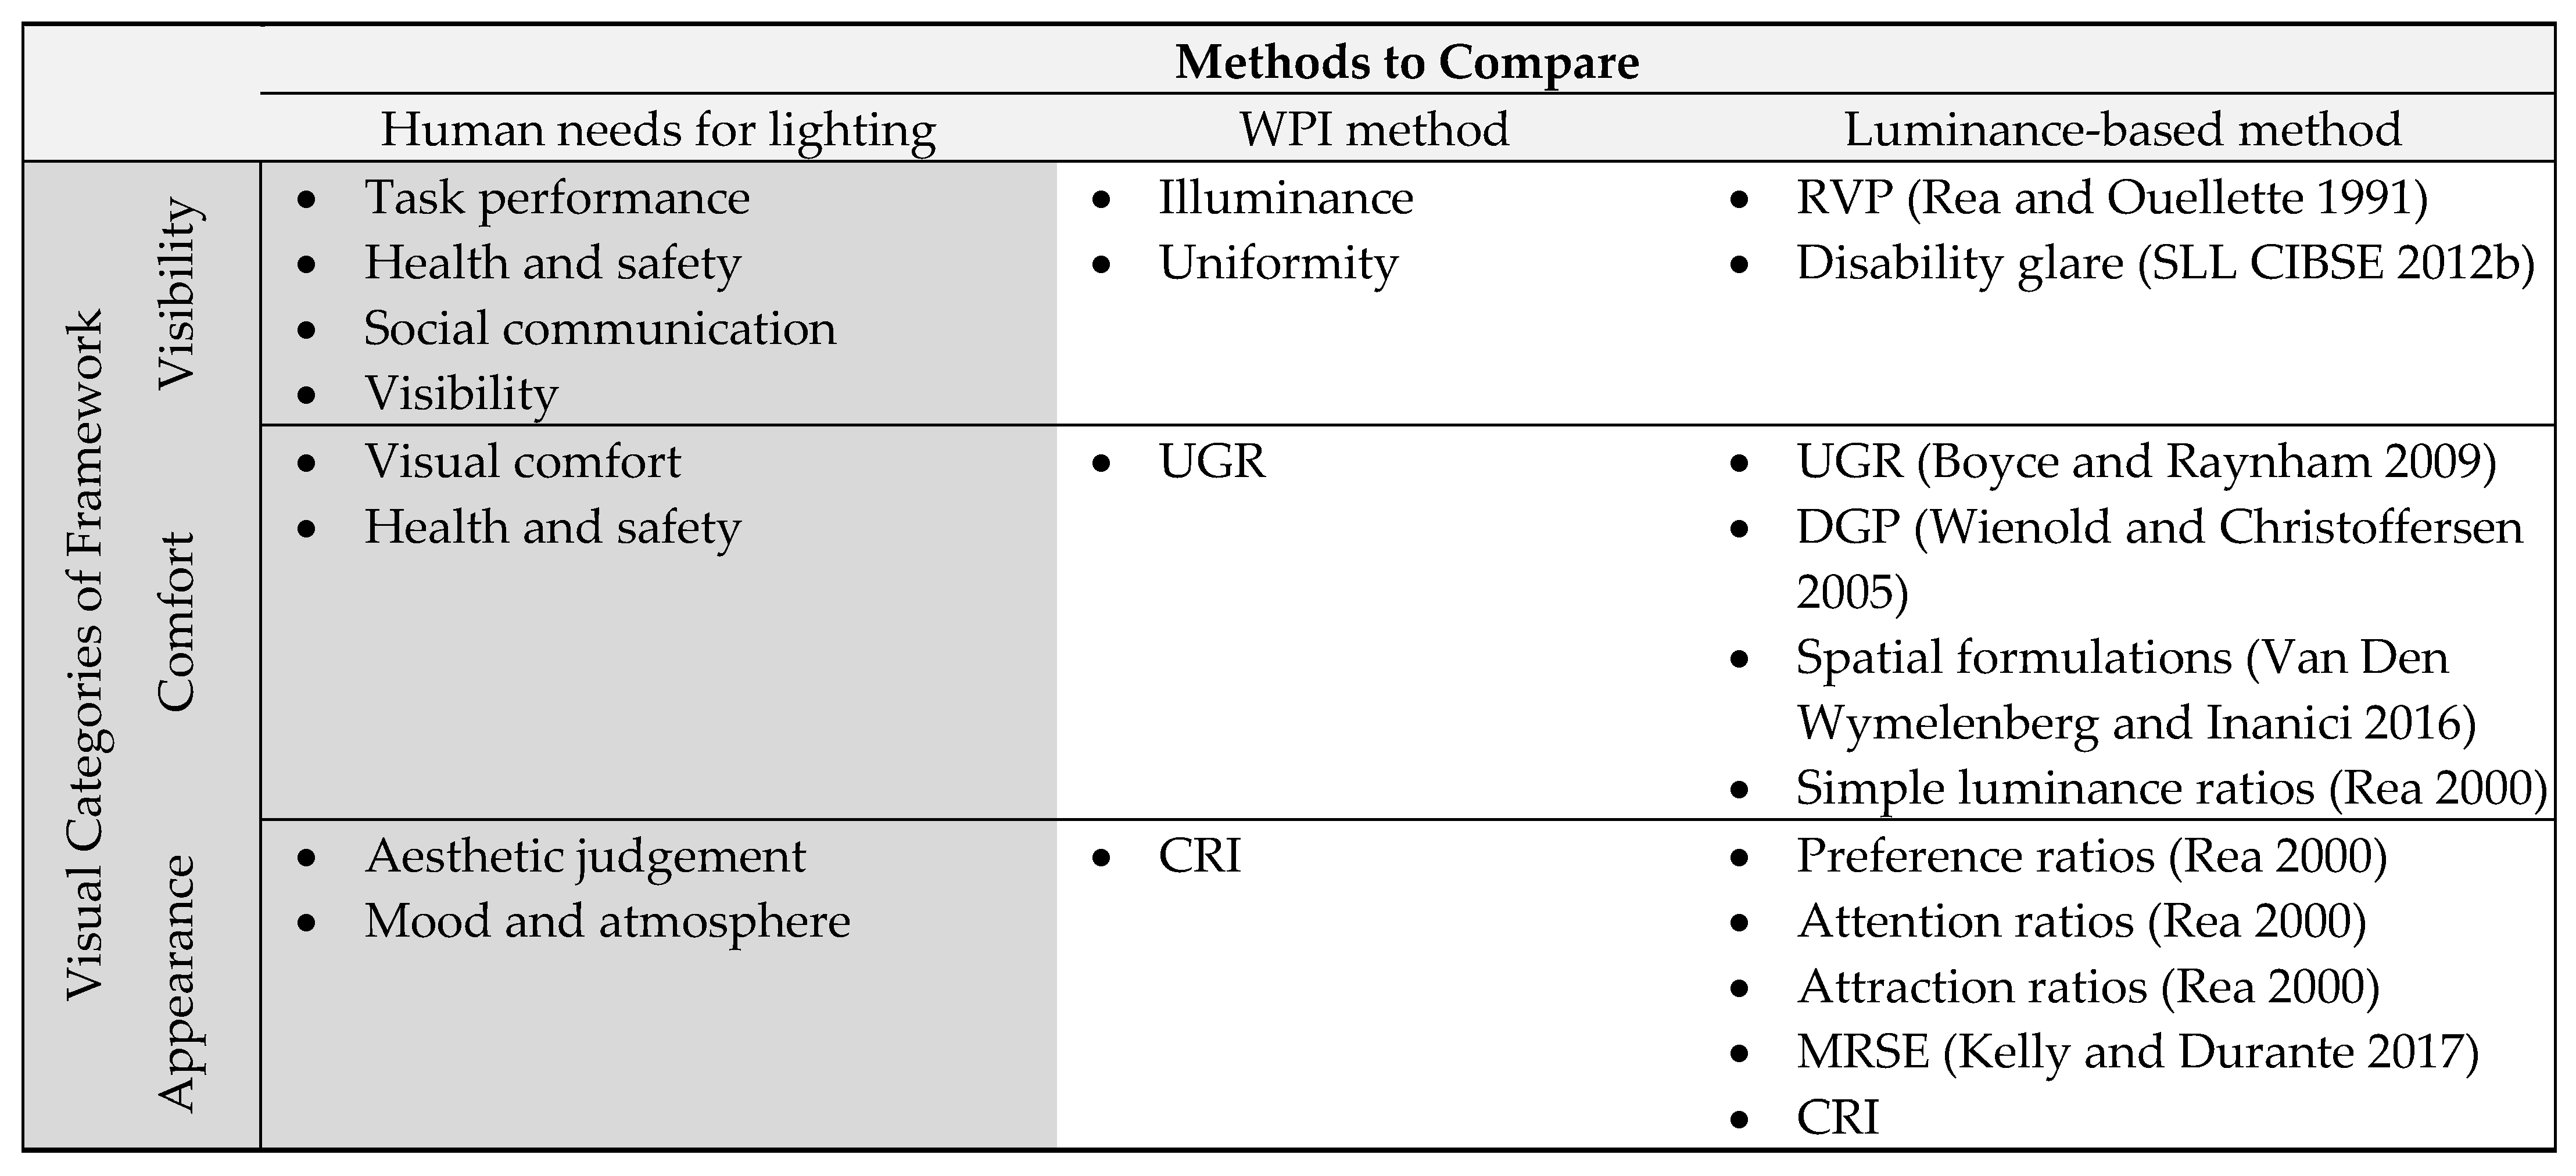
We propose a luminance-based alternative to the WPI method using the three visual categories, which we compared to the WPI to demonstrate its justifiable substitution in lighting practice. The proposed luminance method requires each visual category to meet or exceed the WPI method. The proposed method and its measures are summarised using the framework of Figure 2, as shown in Figure 5. Figure 5 directly compares the measures commonly employed in the WPI method and the proposed luminance-based lighting design method. As such, it is simple to compare the methods across each visual category.
5.1. Visibility
Visibility may be assessed by RVP and disability glare measures. For a given task, with a particular contrast, visual size, and RVP value, the two measures may be used to calculate the minimum target luminance (or background luminance) values required for performance. RVP calculations can be simplified and made more conservative by removing the observer age parameter by assuming a value of 70 years, the model upper limit.
In the first instance, a justifiable RVP target can be found using RVP of the relevant task under comparable recommended working plane illuminance levels (RVPWP). This approach guarantees that Visibility meets or exceeds the WPI method. If RVPWP is in the region of saturated visual performance, target luminance may be decreased with little or no penalty on performance, and a lower minimum target luminance is established. This approach ensures that over-lighting is minimised and performance is guaranteed by setting light levels to the need. In future, RVP targets should be independently established to avoid the ambiguity imposed by illuminance targets. Additionally, for many indoor lighting applications, the visibility requirements for lighting are low and minimum light levels are set by the needs for comfort and appearance, in which case, a full visibility analysis can be excluded.
The orientations or views that are evaluated are set by the task. For social communication, this view orientation is in the horizontal direction, comparable to a vertical plane. This requirement of luminance-based measures to assess lighting conditions in application-specific directions ensures that lighting is applied with the required directionality. However, this approach increases the number of orientations assessed and, consequently, the complexity and time burden for the Visibility assessment compared to the WPI method.
5.2. Comfort
Discomfort glare is derived from spatial luminance distributions in the FOV and is thus most natively and directly assessed with luminance maps. In a luminance-based design method, Comfort may be evaluated from a large suite of discomfort glare metrics, as shown in Figure 5, which allows the most application-suitable metrics to be used. Therefore, luminance-based glare assessment is more accurate than glare assessment that is conducted with the WPI method, which is often limited to UGR and simplified to values provided by manufacturer tables or simple modelling.
In addition, daylight glare may be evaluated without additional effort, as high-quality modelling or measurement is already required and thus available. For equivalence with the WPI method, UGR should at a minimum be evaluated with design values taken from established standards.
5.3. Appearance
Appearance may be assessed using any of the following: luminance ratios to reproduce preferred conditions and highlight points of attention and attraction; MRSE for accurate indication of perceived room brightness, which may be assessed by luminance imaging; and CRI to account for faithful colour reproduction, managed by lamp selection. Where MRSE is typically captured with illuminance measurement, it can also be accurately captured with luminance-map measurement [32]. At minimum, a luminance-based method should assess CRI to be equivalent to the WPI method.
Appearance design values can be found from standards and published research [1,3,23]. CRI values may be taken from guidance or standards [5]. Other dimensions of appearance, such as MRSE and preference–attention–attraction luminance ratios, have more flexibility with target values in published literature [30,32].
Luminance-based Appearance assessment captures many dimensions of appearance, particularly the variance and distribution of light in a space. By comparison, the WPI method employs only the CRI measure. However, guidance on surface reflectance values and uniformity will have an indirect effect on appearance. Overall, considering the range of measures available, Appearance assessment with luminance distributions is more accurate than the WPI method.
5.4. Technical Summary
The proposed luminance-based lighting design method can accurately assess the three key visual categories and the human needs for lighting they serve. Therefore, it is a comprehensive design method and an effective replacement for current practice. The increased accuracy of this method can lead to more efficient and better performing lighting design due to the precise application of light and direct evaluation of the fundamental lighting requirements.
Both task performance and discomfort glare analysis depend on the distribution and intensity of light in the FOV, which is dependent on time of day for daylight glare, and thus, metric evaluation depends on the view orientation of the luminance map. However, a number of key view orientations must be selected for a room lighting, increasing the complexity of the design beyond simple WPI illuminance assessment at the working plane. In contrast, these choices can be standardised by application or end-user preferences, and the added complexity provides a measurably better design outcome.
5.5. Practical Implications Summary
Our review-derived three-factor framework, review of luminance-based methods, and provided method of application in the translation of design values all help promote the uptake of luminance and alternative lighting measures by overcoming a knowledge barrier. Increased incorporation of accurate luminance-based measures drives improvements in lighting practice. Improvements include lighting efficiency increases by designing closer to lighting needs, eliminating over-lighting, and ensuring adequate performance across a wide range of lighting dimensions.
The framework for lighting design in Figure 2 is a simple, effective tool for comparing lighting measures and methods. While it has been used here to construct a luminance-based design method, it is not limited to this application. Instead, it may be used to select specific measures best suited for a particular application to consequently improve lighting performance.
In addition, the three-factor lighting design framework may be expanded as more lighting design considerations and measures emerge. For example, the health effects of the lighting spectrum are being increasingly incorporated into lighting design [46]. An additional factor of health could be added to the model to fit these emerging considerations. Interestingly, low-cost custom-imaging devices have also been used as quasi-radiometers [19] and could capture this added dimension of lighting design.
The luminance-based design method presented is significantly more complex than the WPI method. The practitioner is required to determine key tasks, times, positions, and view orientations for the design in question, which introduces significant dimensionality to the problem and consequently requires increased modelling and measurement. While it is expected that increased use of luminance-based design methods will lead to a refining of the methods of application, at present, the complexity presents a significant barrier to luminance-based measurement uptake. In contrast to this perspective, the use of computers and CAD systems can enable the creation of these orientations and perspectives in simulation to better automate the process and potentially return the method to the early design phase for a given space.
Visibility design values are still based on current practice, and as such, the values may not accurately reflect all requirements. More specifically, RVP target values are set by taking the RVP values for the equivalent task under recommended working plane illuminance. These working plane illuminance targets are themselves inaccurate, as the minimum difference between zone-based illumination values in typical guidance is 50 lux, which may be 7–25% of the recommended value, for typical office settings. Instead, it would be more appropriate to establish an RVP based on the criticality of the task and to design to this value independent of the equivalent working plane recommendation.
Current commercial imaging photometers, which measure luminance distribution (luminance maps), are required to implement a luminance-based design method. However, they are currently prohibitively expensive. While custom low-cost alternative devices exist, these still rely on expensive calibration equipment. The expense of these devices is a significant barrier to the uptake of a luminance-based method, but one which may be addressed by emerging technologies and ideas using high-functioning mobile phone cameras.
6. Conclusions
The three-factor framework proposed in this study indicates that lighting design methods serve to fulfil three broad categories of visual needs: Visibility, Comfort, and Appearance. The framework provides a general and useful means to compare lighting methodologies and can be used to assess whether an alternative lighting-design method is as equally comprehensive and accurate as the WPI method, and thus could serve as an effective replacement. This framework is also readily extendable as additional factors and measurement device types are considered, such as the health and wellbeing effects of lighting and the use of spectral radiometers.
Luminance measures can provide an accurate and comprehensive alternative to the current working plane illuminance-based lighting design method. Implementing these luminance measures can lead to better performing and more efficient lighting. More detailed visibility assessment can be used to reduce light levels, while RVP and disability glare measures guarantee visibility by setting the lighting level in the task direction to the need, eliminating wasteful over-lighting. Direct comfort assessment leads to higher confidence in lighting comfort. Luminance-based glare assessment enables direct assessment of a wide range of glare metrics, providing for more direct, and thus accurate, glare assessment than the modelling methods used in the WPI method. Daylight glare, often left out of glare analyses, is easier to implement with luminance map assessment. Luminance-based appearance assessment includes many measures that cannot be evaluated with illuminance measurement, such as preference, attention, attraction contrast ratios, and MRSE. Thus, appearance assessment accuracy is greatly improved with the proposed luminance-based design method.
The flexibility offered by a luminance-based lighting design approach enhances passive lighting design. Light levels can be set by very low established minimums required for visual performance, then artificial lighting may be added effectively and, where required, to create the desired comfort and appearance.
The proposed luminance-based lighting design method is more complex than the WPI method. The practitioner must consider measures, locations, views, and times of day, as all these parameters can produce significantly different visual conditions. However, the added complexity provides for a measurably better design outcome. Additionally, the location/view/time combinations can both be simplified by considering the limiting conditions and standardised for common applications and end-user preferences.
Author Contributions
Conceptualization, D.B.; methodology, D.B. and J.G.C.; investigation, D.B.; writing—original draft preparation, D.B.; writing—review and editing, D.B. and J.G.C.; supervision, J.G.C.; funding acquisition, D.B. All authors have read and agreed to the published version of the manuscript.
Funding
Research was funded by the Ngau Boon Keat doctoral scholarship.
Institutional Review Board Statement
Not Applicable.
Informed Consent Statement
Not Applicable.
Conflicts of Interest
The authors declare no conflict of interest.
Abbreviations
| CRI | Colour Rendering Index |
| DGP | Daylight Glare Probability |
| FOV | Field Of View |
| MRSE | Mean Room Surface Exitance |
| RVP | Relative Visual Performance |
| UGR | Unified Glare Rating |
| VCP | Visual Comfort Probability |
| VDT | Visual Display Terminal |
| WPI | Working Plane Illuminance |
References
- AS/NZS 1680.1:2006; Interior and Workplace Lighting—Part 1: General Principles and Recommendations. New Zealand Standards: Wellington, New Zealand, 2006.
- Boyce, P.; Raynham, P. The SLL Lighting Handbook; Cibse: London, UK, 2009; Volume 44. [Google Scholar]
- DiLaura, D.L.; Houser, K.W.; Mistrick, R.G.; Steffy, G.R. IESNA the Lighting Handbook-Reference and Application, 10th ed.; lluminating Engineering Society of North America: New York, NY, USA, 2011. [Google Scholar]
- Moeck, M.; Anaokar, S. Illuminance analysis from high dynamic range images. LEUKOS J. Illum. Eng. Soc. N. Am. 2006, 2, 211–228. [Google Scholar] [CrossRef]
- SLL CIBSE. Chapter 16—Colour. In The SLL Code for Lighting; Cibse: London, UK, 2012. [Google Scholar]
- Konica, M. LS-150/LS-160 Datasheet 2019. Available online: https://sensing.konicaminolta.us/us/products/ls-150-luminance-meter/ (accessed on 20 November 2022).
- Radiant Vision Systems, “ProMetric Y,” 2020. Available online: https://www.radiantvisionsystems.com/products/imaging-colorimeters-photometers/prometric-y-imaging-photometers (accessed on 21 November 2022).
- Fiorentin, P.; Iacomussi, P.; Raze, G. Characterization and calibration of a CCD detector for light engineering. IEEE Trans Instrum Meas 2005, 54, 171–177. [Google Scholar] [CrossRef]
- Bellia, L.; Cesarano, A.; Minichiello, F.; Sibilio, S.; Spada, G. Calibration proceedures of a CCD camera for photometric measurements. In Proceedings of the Conference Record—IEEE Instrumentation and Measurement Technology Conference, Vail, CO, USA, 20–22 May 2003; Volume 1, pp. 89–92. [Google Scholar]
- Inanici, M.N. Evaluation of high dynamic range photography as a luminance data acquisition system. Light. Res. Technol. 2006, 38, 135. [Google Scholar] [CrossRef]
- Krawczyk, G.; Goesele, M.; Seidel, H.-P. Photometric calibration of high dynamic range cameras. Max Plank Institut. Fur. Imformatik 2005, 3, 1–4. [Google Scholar]
- Moore, T.; Graves, H.; Perry, M.J.; Cphys, M.; Carter, D.J. Approximate field measurement of surface luminance using a digital camera. Light. Res. Technol. 2000, 32, 1–11. [Google Scholar] [CrossRef]
- Mead, A.R.; Mosalam, K.M. Ubiquitous luminance sensing using the Raspberry Pi and Camera Module system. Light. Res. Technol. 2017, 49, 904–921. [Google Scholar] [CrossRef]
- Anaokar, S.; Moeck, M. Validation of high dynamic range imaging to luminance measurement. LEUKOS-J. Illum. Eng. Soc. N. Am. 2005, 2, 133–144. [Google Scholar] [CrossRef]
- Wüller, D.; Gabele, H. The usage of digital cameras as luminance meters. Digit. Photogr. III 2007, 6502, 281–291. [Google Scholar] [CrossRef]
- Meyer, J.; Gibbons, R.; Edwards, C. Development and Validation of a Luminance Camera. Master’s Thesis, Virginia Tech Transportation Institute, Blacksburg, VA, USA, 2009. [Google Scholar] [CrossRef]
- Li, H.; Cai, H. Lighting measurement with a 360° panoramic camera: Part 2—Applications. Light. Res. Technol. 2022, 54, 712–729. [Google Scholar] [CrossRef]
- Li, H.; Cai, H. Lighting measurement with a 360° panoramic camera: Part 1—Technical procedure and validation. Light. Res. Technol. 2022, 54, 694–711. [Google Scholar] [CrossRef]
- Gayeski, N.; Stokes, E.; Andersen, M. Using digital cameras as quasi-spectral radiometers to study complex fenestration systems. Light. Res. Technol. 2009, 41, 7–23. [Google Scholar] [CrossRef]
- Ward, G. RADSITE: Radiance. Available online: https://www.radiance-online.org/ (accessed on 12 January 2021).
- Boyce, P. Illuminance Selection Based on Visual Performance and Other Fairy Stories. In Proceedings of the IESNA Annual Conference, New York, NY, USA, 30 July–2 August 1995. [Google Scholar]
- Osterhaus, W.K.E. Office lighting: A review of 80 years of standards and recommendations. In Proceedings of the Conference Record—IAS Annual Meeting (IEEE Industry Applications Society), Toronto, ON, Canada, 2–8 October 1993; Volume 3, pp. 2365–2375. [Google Scholar]
- SLL CIBSE. The SLL Code for Lighting; Cibse: London, UK, 2012. [Google Scholar]
- Steffy, G.R. Rational illuminance. LEUKOS J. Illum. Eng. Soc. N. Am. 2006, 2, 235–261. [Google Scholar] [CrossRef]
- Rea, M.S.; Ouellette, M.J. Relative visual performance: A basis for application. Light. Res. Technol. 1991, 23, 135–144. [Google Scholar] [CrossRef]
- Newsham, G.R.; Veitch, J.A. Lighting quality recommendations for VDT offices: A new method of derivation. Light. Res. Technol. 2001, 33, 97–116. [Google Scholar] [CrossRef]
- SLL CIBSE. Chapter 1—Balance of Lighting. In The SLL Code for Lighting; Cibse: London, UK, 2012. [Google Scholar]
- SLL CIBSE. Chapter 2—Indoor Workplaces. In The SLL Code for Lighting; Cibse: London, UK, 2012. [Google Scholar]
- Jacobs, A. High dynamic range imaging and its application in building research. Adv. Build. Energy Res. 2007, 1, 177–202. [Google Scholar] [CrossRef]
- Rea, M. Chapter 10—Lighting Quality. In IESNA Lighting Handbook—Reference & Application, 9th ed.; Illuminating Engineering Society of North America: New York, NY, USA, 2000. [Google Scholar]
- Kruisselbrink, T.; Dangol, R.; Rosemann, A. Photometric measurements of lighting quality: An overview. Build Environ. 2018, 138, 42–52. [Google Scholar] [CrossRef]
- Kelly, K.; Durante, A. A. A New Interior Lighting Design Methodology—Using MRSE. In CIBSE ASHRE Technical Symposium; Cibse: London, UK, 2017; p. 18. [Google Scholar]
- Duff, J.; Antonutto, G.; Torres, S. On the calculation and measurement of mean room surface exitance. Light. Res. Technol. 2016, 48, 384–388. [Google Scholar] [CrossRef] [Green Version]
- Cuttle, C. Cubic Illumination. Int. J. Light. Res. Technol. 1997, 29, 1–14. [Google Scholar] [CrossRef]
- Cuttle, C. Research Note: A practical approach to cubic illuminance measurement. Light. Res. Technol. 2014, 46, 31–34. [Google Scholar] [CrossRef]
- Boyce, P. Editorial: Light distribution—A missing variable. Light. Res. Technol. 2014, 46, 617. [Google Scholar] [CrossRef] [Green Version]
- Mansfield, K.P. Architectural lighting design: A research review over 50 years. Light. Res. Technol. 2018, 50, 80–97. [Google Scholar] [CrossRef] [Green Version]
- Bean, A.R.; Bell, R.I. The CSP index: A practical measure of office lighting quality as perceived by the office worker. Light. Res. Technol. 1992, 24, 215–225. [Google Scholar] [CrossRef]
- DiLaura, D.L.; Houser, K.W.; Mistrick, R.G.; Steffy, G.R. 4.10 Glare. In IESNA The Lighting Handbook—Reference and Application, 10th ed.; Illuminating Engineering Society of North America: New York, NY, USA, 2011; p. 1328. [Google Scholar]
- Boyce, P.; Raynham, P. 2.6 Visual Discomfort. In SLL Lighting Handbook; Cibse: London, UK, 2009; pp. 37–41. [Google Scholar]
- Rea, M.S. IESNA Lighting Handbook—Reference & Application, 9th ed.; Illuminating Engineering Society of North America: New York, NY, USA, 2000. [Google Scholar]
- SLL CIBSE. Chapter 10—Direct Lighting. In The SLL Code for Lighting; Cibse: London, UK, 2012. [Google Scholar]
- Duff, J.; Kelly, K.; Cuttle, C. Perceived adequacy of illumination, spatial brightness, horizontal illuminance and mean room surface exitance in a small office. Light. Res. Technol. 2017, 49, 133–146. [Google Scholar] [CrossRef] [Green Version]
- Wienold, J.; Christoffersen, J. Towards a new daylight glare rating. In Proceedings of the Lighting for Humans, Lux Europa, Berlin, Germany, 19–21 September 2005; pp. 157–161. [Google Scholar]
- Van Den Wymelenberg, K.; Inanici, M. Evaluating a New Suite of Luminance-Based Design Metrics for Predicting Human Visual Comfort in Offices with Daylight. LEUKOS J. Illum. Eng. Soc. N. Am. 2016, 12, 113–138. [Google Scholar] [CrossRef]
- Webb, A.R. Considerations for lighting in the built environment: Non-visual effects of light. Energy Build 2006, 38, 721–727. [Google Scholar] [CrossRef]
- Bouman, M.A. Peripheral Contrast Thresholds of the Human Eye. J. Opt. Soc. Am. 1950, 40, 825. [Google Scholar] [CrossRef]
- Blackwell, H.R. The Evaluation of Interior Lighting on the Basis of Visual Criteria. Appl. Opt. 1967, 6, 1443–1467. [Google Scholar] [CrossRef]
- SLL CIBSE. Chapter 14—Outdoor lighting calculations. In The SLL Code for Lighting; Cibse: London, UK, 2012. [Google Scholar]
- Johannes, J.V. Reflections on Glare. Light. Res. Technol. 2003, 35, 163–176. [Google Scholar]
- DIALux. DIALux Webpage. Available online: https://www.dialux.com/en-GB/ (accessed on 16 December 2021).
- Inanici, M.N.; Navvab, M. The virtual lighting laboratory: Per-pixel luminance data analysis. LEUKOS J. Illum. Eng. Soc. N. Am. 2006, 3, 89–104. [Google Scholar] [CrossRef]
- Tiller, D.K.; Veitch, J.A. Percieved room brightness: Pilot study on the effect of luminance distribution. Light. Res. Technol. 1995, 27, 93–101. [Google Scholar] [CrossRef] [Green Version]
- Cuttle, C. Towards the third stage of the lighting profession. Light. Res. Technol. 2010, 42, 73–93. [Google Scholar] [CrossRef]
Figure 1.
The Illuminating Engineering Society (IES)-recommended illuminance levels for office work and “ordinary seeing tasks” over the last 100 years, including an equivalent current recommendation for comparison [22,23].

Figure 2.
A three-factor framework for assessing different lighting methods and measures, where the rows are the three visual categories, and the columns show how current standards, methods, and alternative approaches meet these categories. Each method may be evaluated for accuracy by comparing the measures listed for a visual category against their ability to meet the corresponding human needs for lighting. Methods may be evaluated for comprehensiveness if measures are provided for each visual category [30,32,40,44,45].

Figure 3.
A simplified representation of relative visual performance (RVP), which compares 80%, 90%, 95% and 97% RVP levels (values sufficiently high to be of interest), 20 and 70 year observers, low 10 cd/m2, and high 169 cd/m2 target luminance (representing experimental limits and a best- and worst-case scenario) [25]. Note the small impact of increased illumination and decreased observer age on all but the very small and low-contrast details.

Figure 4.
Summary of the illuminance and luminance measures available for lighting design expressed in the three-factor framework. The columns also represent the measures available for each measurement device (illuminance meters and luminance meters) [3,25,27,28,30,32,34,40,44,45].

Figure 5.
The proposed luminance-based method expressed in the three-factor framework, with the WPI method included for comparison [25,28,30,32,40,44,45].


Table 1.
Maximum luminance ratios to avoid visual discomfort.
| Limiting Ratio | Application |
|---|---|
| 1:40 | The task to light source (daylight media or luminaires) |
| 1:20 | Light source (daylight media or luminaires) to adjacent surfaces |
Table 2.
Prescribed luminance ratios for task attention, where the ratios should not be exceeded [30].
Table 2.
Prescribed luminance ratios for task attention, where the ratios should not be exceeded [30].
| 3:1 | Between a Paper Task and Adjacent Visual Display Terminal (VDT) Screen |
|---|---|
| 3:1 | Between task and adjacent dark surroundings (such as ceiling and walls) |
| 10:1–40:1 | Between task and remote (non-adjacent surfaces), 40:1 for casual or slow paced locations |
Table 3.
Luminance ratios between an object and its immediate background and their degree of visual attraction [30].
Table 3.
Luminance ratios between an object and its immediate background and their degree of visual attraction [30].
| 3:1 | Provides Some Degree of Prominence from the Background |
|---|---|
| 10:1 | For a distinct visual cue |
| 100:1 | For a dominating visual focal point |
Disclaimer/Publisher’s Note: The statements, opinions and data contained in all publications are solely those of the individual author(s) and contributor(s) and not of MDPI and/or the editor(s). MDPI and/or the editor(s) disclaim responsibility for any injury to people or property resulting from any ideas, methods, instructions or products referred to in the content. |
© 2023 by the authors. Licensee MDPI, Basel, Switzerland. This article is an open access article distributed under the terms and conditions of the Creative Commons Attribution (CC BY) license (https://creativecommons.org/licenses/by/4.0/).
Share and Cite
MDPI and ACS Style
Bishop, D.; Chase, J.G. A Luminance-Based Lighting Design Method: A Framework for Lighting Design and Review of Luminance Measures. Sustainability 2023, 15, 4369. https://doi.org/10.3390/su15054369
AMA Style
Bishop D, Chase JG. A Luminance-Based Lighting Design Method: A Framework for Lighting Design and Review of Luminance Measures. Sustainability. 2023; 15(5):4369. https://doi.org/10.3390/su15054369
Chicago/Turabian StyleBishop, Daniel, and J. Geoffrey Chase. 2023. "A Luminance-Based Lighting Design Method: A Framework for Lighting Design and Review of Luminance Measures" Sustainability 15, no. 5: 4369. https://doi.org/10.3390/su15054369
Note that from the first issue of 2016, this journal uses article numbers instead of page numbers. See further details here.