Article

Influence of Graphene Nanosheets on Rheology, Microstructure, Strength Development and Self-Sensing Properties of Cement Based Composites

by
Sardar Kashif Ur Rehman
1,*,
Zainah Ibrahim
1,*,
Shazim Ali Memon
2,*,
Md. Toasin Hossain Aunkor
1,
Muhammad Faisal Javed
3,
Kashif Mehmood
3 and
Syed Mustafa Ali Shah
3
1
Department of Civil Engineering, University of Malaya, Kuala Lumpur 50603, Malaysia
2
Department of Civil Engineering, School of Engineering, Nazarbayev University, Astana 010000, Kazakhstan
3
Department of Civil Engineering, COMSATS Institute of Information Technology, Abbottabad 22060, Pakistan
*
Authors to whom correspondence should be addressed.
Sustainability 2018, 10(3), 822; https://doi.org/10.3390/su10030822
Submission received: 22 February 2018 / Revised: 4 March 2018 / Accepted: 6 March 2018 / Published: 15 March 2018
(This article belongs to the Special Issue Sustainable Cementitious Materials for the Construction Industry)

Abstract

:
In this research, Graphene oxide (GO), prepared by modified hammer method, is characterized using X-ray Diffraction (XRD), Fourier Transform Infrared (FT-IR) Spectrometry and Raman spectra. The dispersion efficiency of GO in aqueous solution is examined by Ultraviolet–visible spectroscopy and it is found that GO sheets are well dispersed. Thereafter, rheological properties, flow diameter, hardened density, compressive strength and electrical properties of GO based cement composite are investigated by incorporating 0.03% GO in cement matrix. The reasons for improvement in strength are also discussed. Rheological results confirm that GO influenced the flow behavior and enhanced the viscosity of the cement based system. From XRD and Thermogravimetric Analysis (TGA) results, it is found that more hydration occurred when GO was incorporated in cement based composite. The GO based cement composite improves the compressive strength and density of mortar by 27% and 1.43%, respectively. Electrical properties results showed that GO–cement based composite possesses self-sensing characteristics. Hence, GO is a potential nano-reinforcement candidate and can be used as self-sensing sustainable construction material.

1. Introduction

Construction industry plays a vital role in economic development of any country. Nowadays, concrete is the most widely used construction material (20–35 billion tons annually) [1] in the world, and its use is increasing daily. It consumes earth natural resources rapidly and causes chronic shortage of building materials. Moreover, earthquakes, floods, cyclones and wildfires affect human lives and resources required for reconstruction. In addition, inspection and monitoring of existing infrastructure is one of the biggest challenge for the economy of any country. In United States of America, almost 600,000 bridges are inspected biennially [2], while the repair, renovation and reconstruction needs a total $20.5 billion USD annually [3]. Therefore, there is a strong need to develop ultra-strong composite materials using advanced nanotechnology, which save the natural resources as well as the economy. Graphene is an engineered nanomaterial (two-dimension sheet) which possesses some amazing properties such as huge specific surface area (2630 m2 g−1), high intrinsic strength (130 GPa) and firm Young’s module (~1.0 TPa) [4]. It promotes construction sustainability with following potential contributions: (1) It preserves natural resources by significantly enhancing the mechanical properties and using less amount of cement. The production of cement involves natural resources, pollutes environment by releasing carbon dioxide and utilizes a lot of thermal and electrical energy. Therefore, any effort to reduce the production of cement will greatly influence the environment and play significant role towards sustainable development of construction materials. (2) Its reduces the self-weight of structure thus allowing innovative designs and consumption of less construction materials. (3) It reduces the construction cycle time: due to high early strength of composite material, the curing time is shortened and the formwork can be removed quicker, hence making the overall project economical [5]. (4) It enhances durability by reducing occurrence of cracks and porosity of composite material which in turn will reduce the maintenance and repair activities. (5) It reduces structural health monitoring cost: The self-sensing properties of graphene cement based composites detect damages and cracks in the cementitious materials without any additional equipment [6]. (6) It enhances fire resistance: Due to high thermal conductivity of graphene cement composite materials, the behavior of cement based composite against fire is improved [7,8]. (7) It develops ultra-strong composite material: The utilization of super advance high strength composite building material for housing and infrastructure will mitigate damage from cyclones, earthquakes and wildfires, saving lives as well as the resources required for reconstruction. Moreover, it will prevents premature failure and would be able withstand the great stresses caused by explosions and earthquakes [6].
It is known that graphene sheets have large exposed surface area and the ability to form a strong physical and chemical bond with cement matrix. For example, Sixuan [9] found 20% increase in compressive strength and 17% increase in flexural strength of mortar specimens. However, graphene has very high production cost as well as difficulties with dispersion, which, in turn, limits its application in civil infrastructure especially like bridges, dams and buildings. Some previous studies have found that graphene nanoplatelets (2D carbon based nanomaterials) are cost competitive and can enhance cement composites strain-sensing and transport properties [10,11]. Furthermore, it can be obtained from naturally available graphite flakes (inexpensive source) after chemical oxidation and exfoliation. GO, an antecedent of graphene, is a single sheet of sp2-hybridized carbon with a mixture of carboxyl, epoxy and/or hydroxyl functionalities [12]. Hence, in this research, GO nanosheets were prepared by chemical oxidation of natural graphite. Various researchers have investigated the application of GO in cement based materials. Lv et al. [13] reported a rise in tensile, flexural and compressive strength by 78.6%, 60.7% and 38.9%, respectively, with 0.03% dosage of GO in cement mortar. Other researchers also reported improvement in mechanical and transport properties by utilizing a small amount of GO [14,15,16,17]. The cement-based composites are typically casted in the plastic state. Thus, its rheological properties are extremely significant for the construction industry. Moreover, many factors such as durability, strength, consolidation and workability depend on the flow properties of the concrete. Additionally, high electrical transport properties of graphene will alter the electrical properties and transform it into self-sensing composite material. The cement based composite reinforced with conducting fibers can observe its own strain by monitoring the changes in the electrical resistivity values. This ability is related to the breaking of conducting fibers when cracks are initiating in the cement-based composite, consequently enhancing the resistivity of the overall sample. If cracks are opening up due to tensile or fracture loading, then resistivity values will be positive, while it will be negative when subjected to compressive loading. Rehman et al. [18] investigated the piezo-resistive properties of the graphene-cement composite material and found that piezo-resistive properties changes due to the change in electrical resistance of specimen when it is subjected to mechanical strain [19].These piezo resistive properties has been used by researchers to monitor the structural health of concrete structures [6,18].
As per authors’ knowledge, the rheological (flow) properties of a cement based composite containing GO sheets have not been investigated. Hence, the flow properties of the cement paste were considered using Bingham model. Thereafter, the suitability of GO sheets as potential nano-reinforcement candidate was investigated. It was characterized using Fourier transform infrared (FTIR) spectrometry, thermogravimetric analysis (TGA/DTA) and X-ray diffraction technique (XRD). The compressive strength of GO cement composite was also determined and the reasons for the improvement in strength are discussed. Finally, self-sensing properties were investigated.

2. Experimental Investigation

2.1. Materials and Chemicals

Natural graphite flakes (size < 30 μm), 98%-concentrated sulphuric acid (H2SO4), 37%-hydrochloric acid (HCl), 30%-hydrogen peroxide (H2O2) and potassium permanganate (KMnO4) were purchased from Sigma-Aldrich, Petaling Jaya, Selangor, Malaysia. For the preparation of GO–cement composite, ordinary Portland cement (Type I) having the 28-day compressive strength of 48 MPa, specific gravity 3.14 and Blaine surface area 351 m2/kg was used (Table 1). Locally mined sand with fineness modulus of 2.85, water absorption 0.51% and specific gravity of 2.68 was used as fine aggregate. A polycarboxylate based superplasticizer, Sika ViscoCrete (Sika ViscoCrete®-2199, brown liquid, Sika Kimia Sdn. Bhd. Nilai, Negeri Sembilan, Malaysia), was utilized for the preparation of mortar.

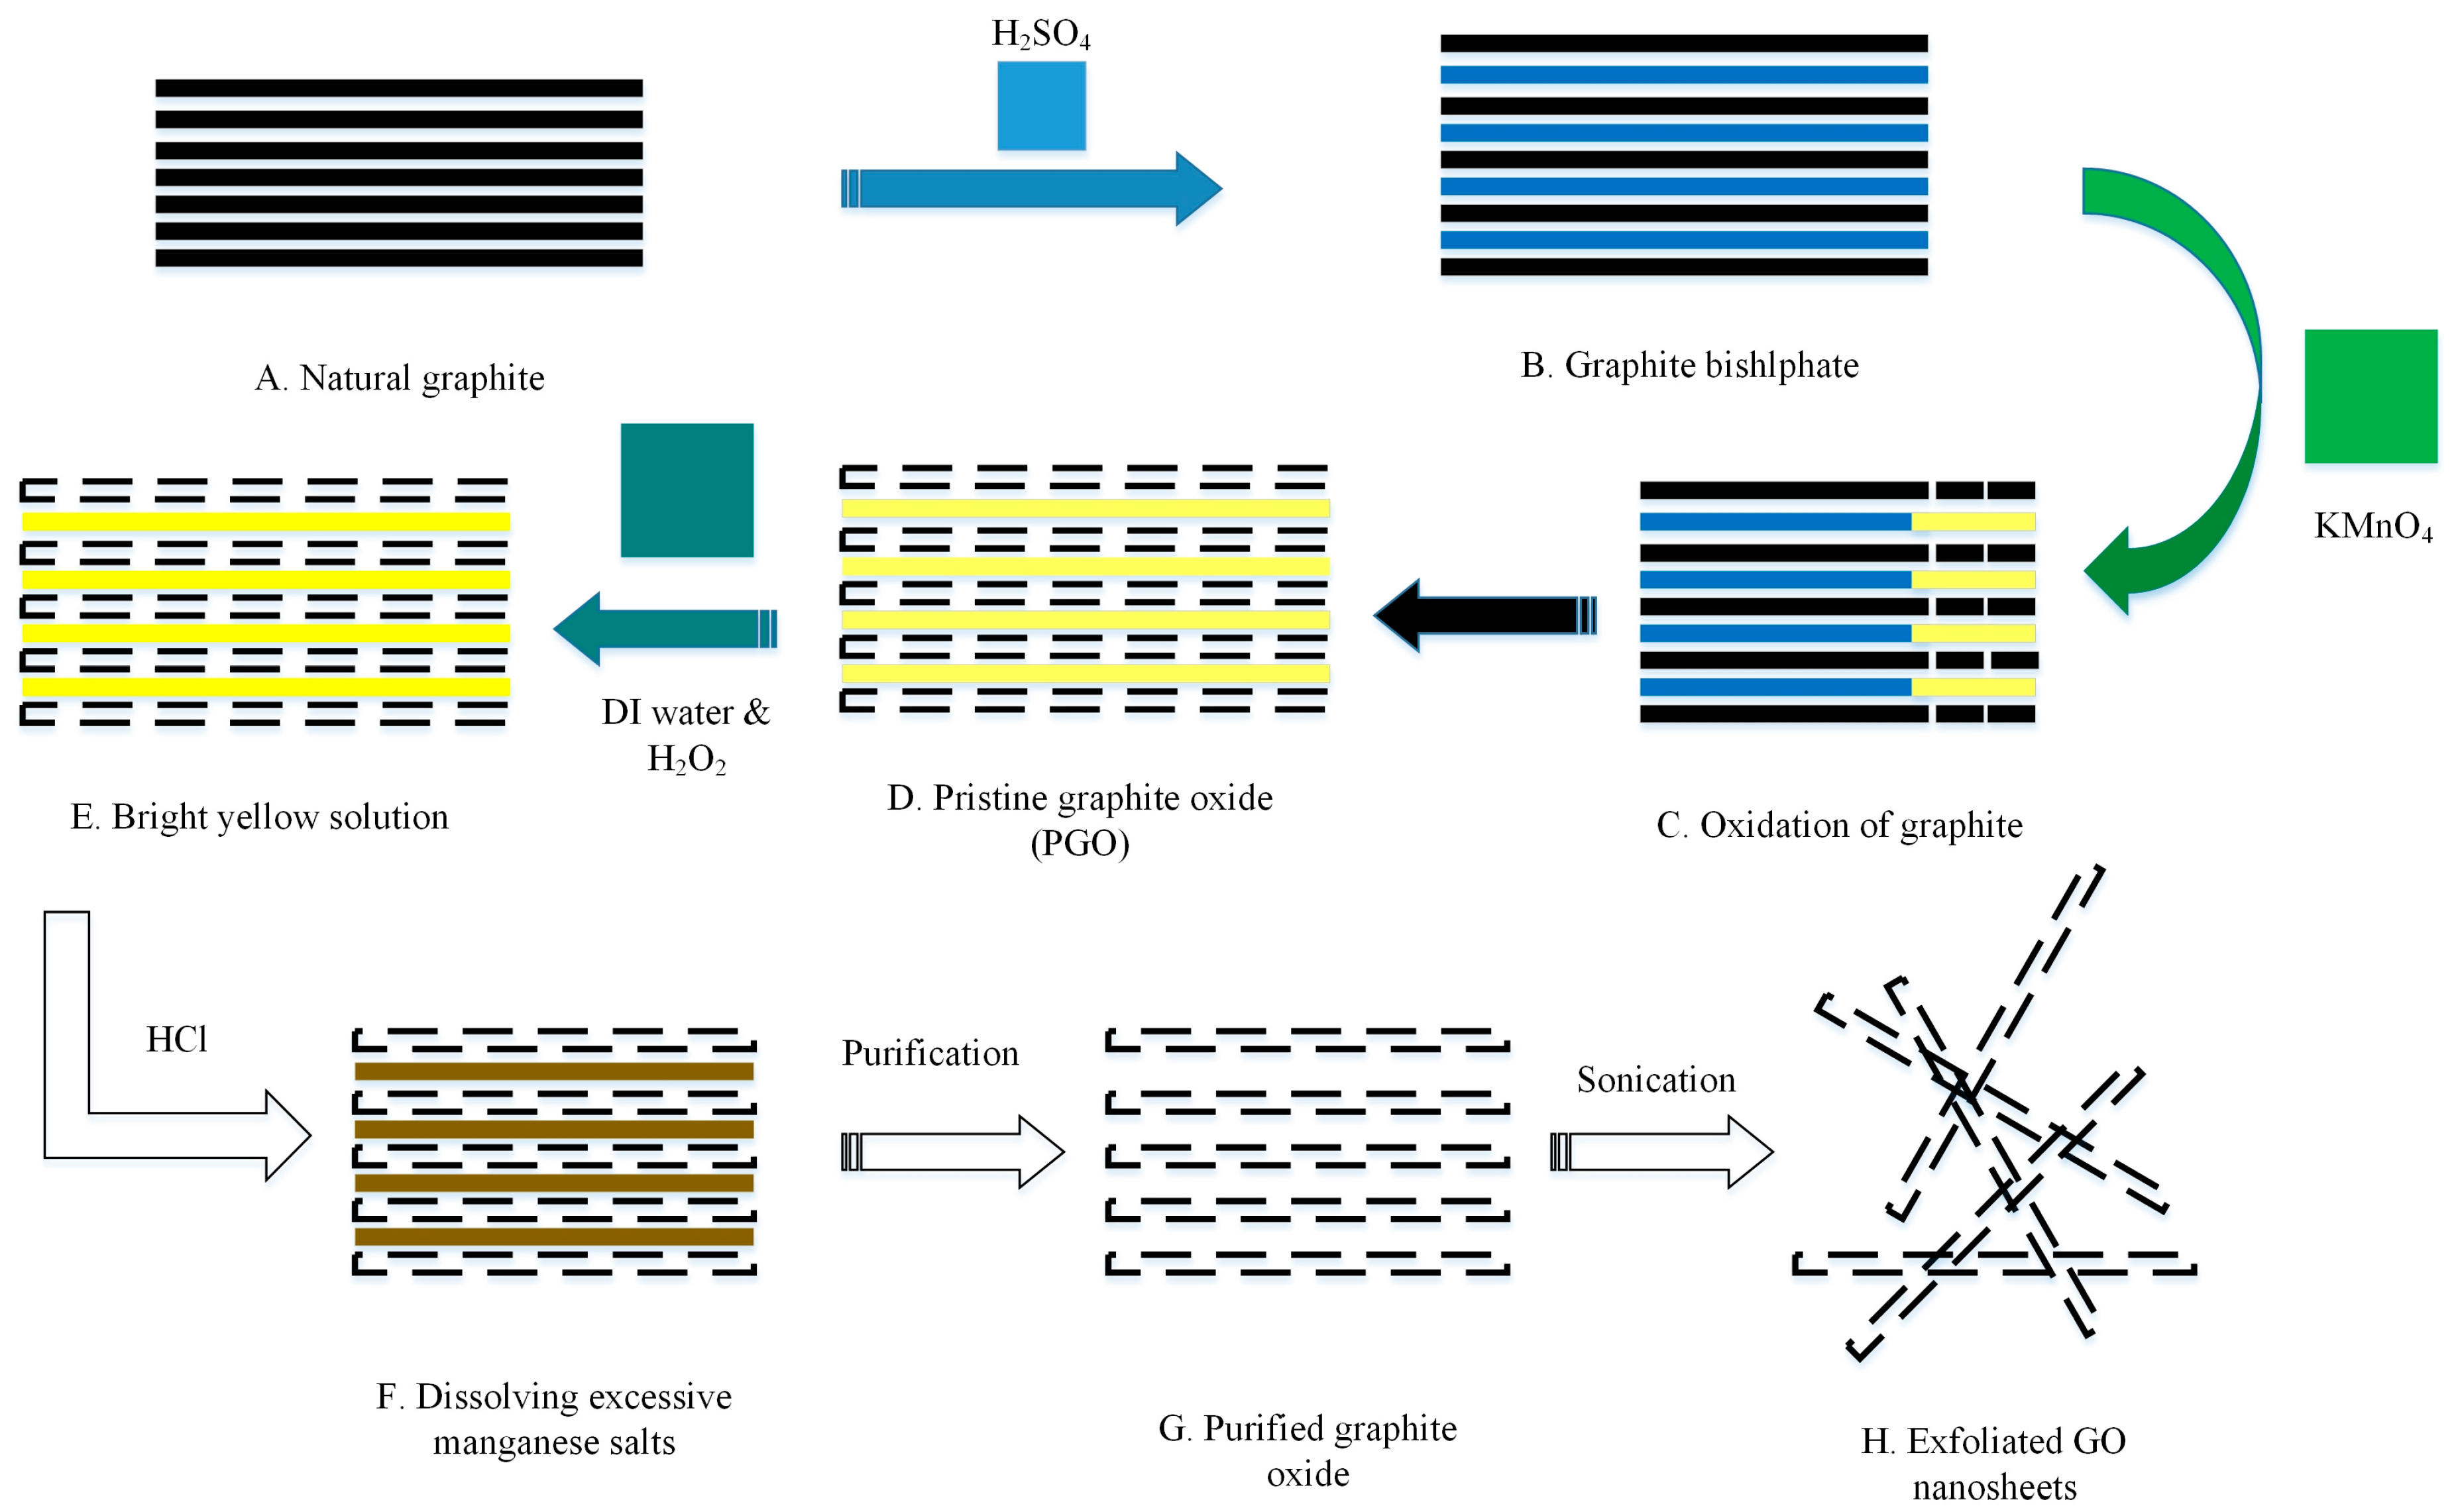
2.2. Preparation of GO Sheets

For this research, modified Hummer method [20] was used for the production of GO sheets. First, 45 mL concentrated H2SO4 and 2 g graphite flakes were mixed in a beaker which was kept in 0 °C ice water bath to avoid the rise in temperature due to the use of concentrated H2SO4. Thereafter, 5 g of KMnO4 was carefully added to the mixture and the solution was retained in a water bath at 90 °C for 3 h. The mixture was shifted to 500 mL beaker and diluted by addition of 350 mL deionized water (DI). A 30% H2O2 solution was then poured dropwise until the solution changed to bright yellow color. To dissolve excess manganese salt, 5% solution of HCl was added. The obtained GO was centrifuged several times and repeatedly washed with deionized water until the pH of the product was 6. Afterward, through mild ultrasonication into DI water for 30 min, GO sheets were exfoliated. Thus, homogeneous GO aqueous solution was obtained without aggregation (0.1 mg/mL). Finally, the purified solution was kept in a dryer at 80 °C for 6 h resulting in 1 g of fine dry powder. The schematic illustration is given in Figure 1. The thickness of GO sheet was 1.2 nm while the average size was 0.5–5 microns, as reported in the study by Aunkor et al. [21].

2.3. Preparation of GO Based Cement Composites

The rheological properties of cement paste were determined by using Rheometer MCR 302 (Anton-Paar). Concentric-cylinder was used with a gap thickness of 1.2 mm to determine the rheological properties of fresh cement paste. For this purpose, GO based cement composites were prepared by mixing of ordinary Portland cement, water, polycarboxylate superplasticizer and GO. The details of mix proportion for cement paste are given in Table 2. For samples preparation, dry GO sheets were dispersed by sonication (Fisher Scientific™ Model 505 Sonic Dismembrator, Fisher Scientific (M) Sdn Bhd, Shah Alam, Malaysia) in deionized water and superplasticizer for 15 min to form a uniform mix. The obtained aqueous solution of GO was then mixed with cement for 5 min in spar mixer (SP-800A). After this step, the approximately 15 mL of cement paste was added into the measuring cup at a fixed temperature of 25 °C. Initially, cement paste was held at rest and after 10 min it was pre-sheared at a shear rate of 100 s−1 for 30 s. This was done to re-homogenize the sample as cement paste have thixotropic character [22]. After 5 min, shear rate was applied from 100 to 0.06 s−1 in 16 decreasing steps. The rheological measurements of cement paste were characterize using Bingham equation [23]. All rheological readings were observed during dormant period and potential influence of hydration is not considered here.
The GO based cement mortar was prepared by mixing of ordinary Portland cement, standard sand, water, polycarboxylate superplasticizer and GO. The details of mix proportion are given in Table 2. For samples preparation, dry GO sheets were dispersed by sonication (Fisher Scientific™ Model 505 Sonic Dismembrator, Fisher Scientific (M) Sdn Bhd, Shah Alam, Malaysia) in deionized water and superplasticizer for 15 min to form a uniform mix. The obtained aqueous solution of GO was then mixed with cement and sand for 5 min in spar mixer (SP-800A). The workability of cement mortar was determined by ASTM C 1437-15 [24]. After that, the mixture was poured into the molds of 50 mm cubes in three layers and vibrating table was used to remove the entrapped air. The molds were removed after 24 h and samples were cured in a lime-saturated water bath at room temperature before testing. The compressive strength of GO–cement based composite having a size of 50 mm cubes was determined at the age of 3, 28 and 90 days by using compression testing machine (ELE International ADR-Auto V2.0 2000 36-4150/01, Bedfordshire, UK) under constant loading rate of 0.5 kN/s. ASTM C 109 was adopted for measuring compressive strength [25]. It is important to mention here that cement paste was used for measurement of rheological properties and electrical properties whereas, cement mortar was used for flow diameter, hardened density, compressive strength and material characterization. The microstructure characteristics and density of cement-based composite were determined at the age of 28 days.

2.4. Characterization of GO and Cement Composites

The graphite and Exfoliated graphene oxide nanosheets were characterized by using different techniques such as XRD, Raman, FTIR and EDS. The diffractograms were obtained by using X-ray Diffraction technique (model Ringaku Mini Flex, 600, Tokyo, Japan) with Cu Kα radiation (1.5418 Å) operated at 40 kV and 40 mA in the range of 2θ = 5–80° at 0.026° step size. The Raman spectroscopy was used to determine the oxidation effect and the presence of hydroxyl groups on GO sheets. For this purpose, an Invia Laser-Raman spectrometer (Renishaw, UK) having 514 argon ion laser was used. Several milligrams of the sample were spin-casted on a silicon wafer coated with a 300 nm thick layer of SiO2. The Fourier transform infrared (FTIR) spectrometry of nanosheets was evaluated by using Perkin Elmer FTIR-spectrum 400, Waltham, MA, USA. The sample was prepared by mixing the material with KBr in 1:1000 (nanomaterial: KBr) ratio. The spectrometer was operated with 4 cm−1 resolution in the region of 400–4000 cm−1. Finally, the elemental composition was acquired using Field emission scanning electron microscope (FESEM) coupled with an energy dispersive X-ray spectrometer. EDS samples were gold coated using sputtering technique and then fixed on the aluminum stub. Finally, Spectroquant® Pharo 300 UV-vis spectrophotometer, from Sigma-Aldrich, Petaling Jaya, Selangor, Malaysia with a wavelength in 190–1100 nm range was used to determine the absorbance of the GO sheets in aqueous solution with and without superplasticizer. The aqueous solution was obtained by mixing dry GO sheets with deionized water and then sonicated it for 15 min in Fisher Scientific™ Model 505 Sonic dismembrator. Thereafter, crystal cuvette was used to determine the spectrum. Deionized water was used as a reference in a spectrophotometer.
The surface morphology of plain-cement and GO–cement composite specimens were investigated by using Field emission scanning electron microscope (FE-SEM, AJSM-7600F with semi-in-lens, JEOL (Malaysia) Sdn. Bhd. Petaling Jaya, Malaysia). XRD (X-ray Diffraction) was conducted to see the mineralogical characteristics of GO–cement composite specimens (with and without GO) by using Ringaku Mini Flex, 600, Tokyo, Japan. Diffractograms were obtained by using PANalytical X’Pert HighScore X-ray diffractometer with Cu Kα radiation (1.5418 Å) operated at 45 kV and 40 mA and 2θ scan between 5° and 80° at 0.026° step size. Test samples were collected after compression tests, from the remnant pieces of the cubes, and then grounded into fine powder <5 μm for analysis. Thermogravimetric analysis (TGA) and Differential thermal analysis (DTA) of plain-cement and GO–cement composite specimens were determined using TGA, Shimadzu TG 50 instrument, Tokyo, Japan. For this purpose, 40 mg sample was heated from room temperature to 900 °C with a scanning rate of 10 °C/min under nitrogen atmosphere condition and readability range of 0.001 mg. Fourier transform infrared (FTIR) spectrometry of plain cement and GO–cement composite specimens were evaluated by using Perkin Elmer FTIR-spectrum 400, Waltham, MA, USA. The procedure for obtaining the FTIR spectra is as follows. The crushed mortar sample and the KBr were heated for 24 h at 105 °C and were then mixed in 1:1000 (powder: KBr) ratio in a controlled humidity environment. Next, the mixed sample was pressed at 10 ton for 1 min using a Specac 15-ton Manual Hydraulic Press. Finally, the obtained KBr pellet was placed in the sample container. Spectrum Analysis software was used to acquire the infrared spectrum. The spectrometer was operated with 4 cm−1 resolution in the region of 400–4000 cm−1.

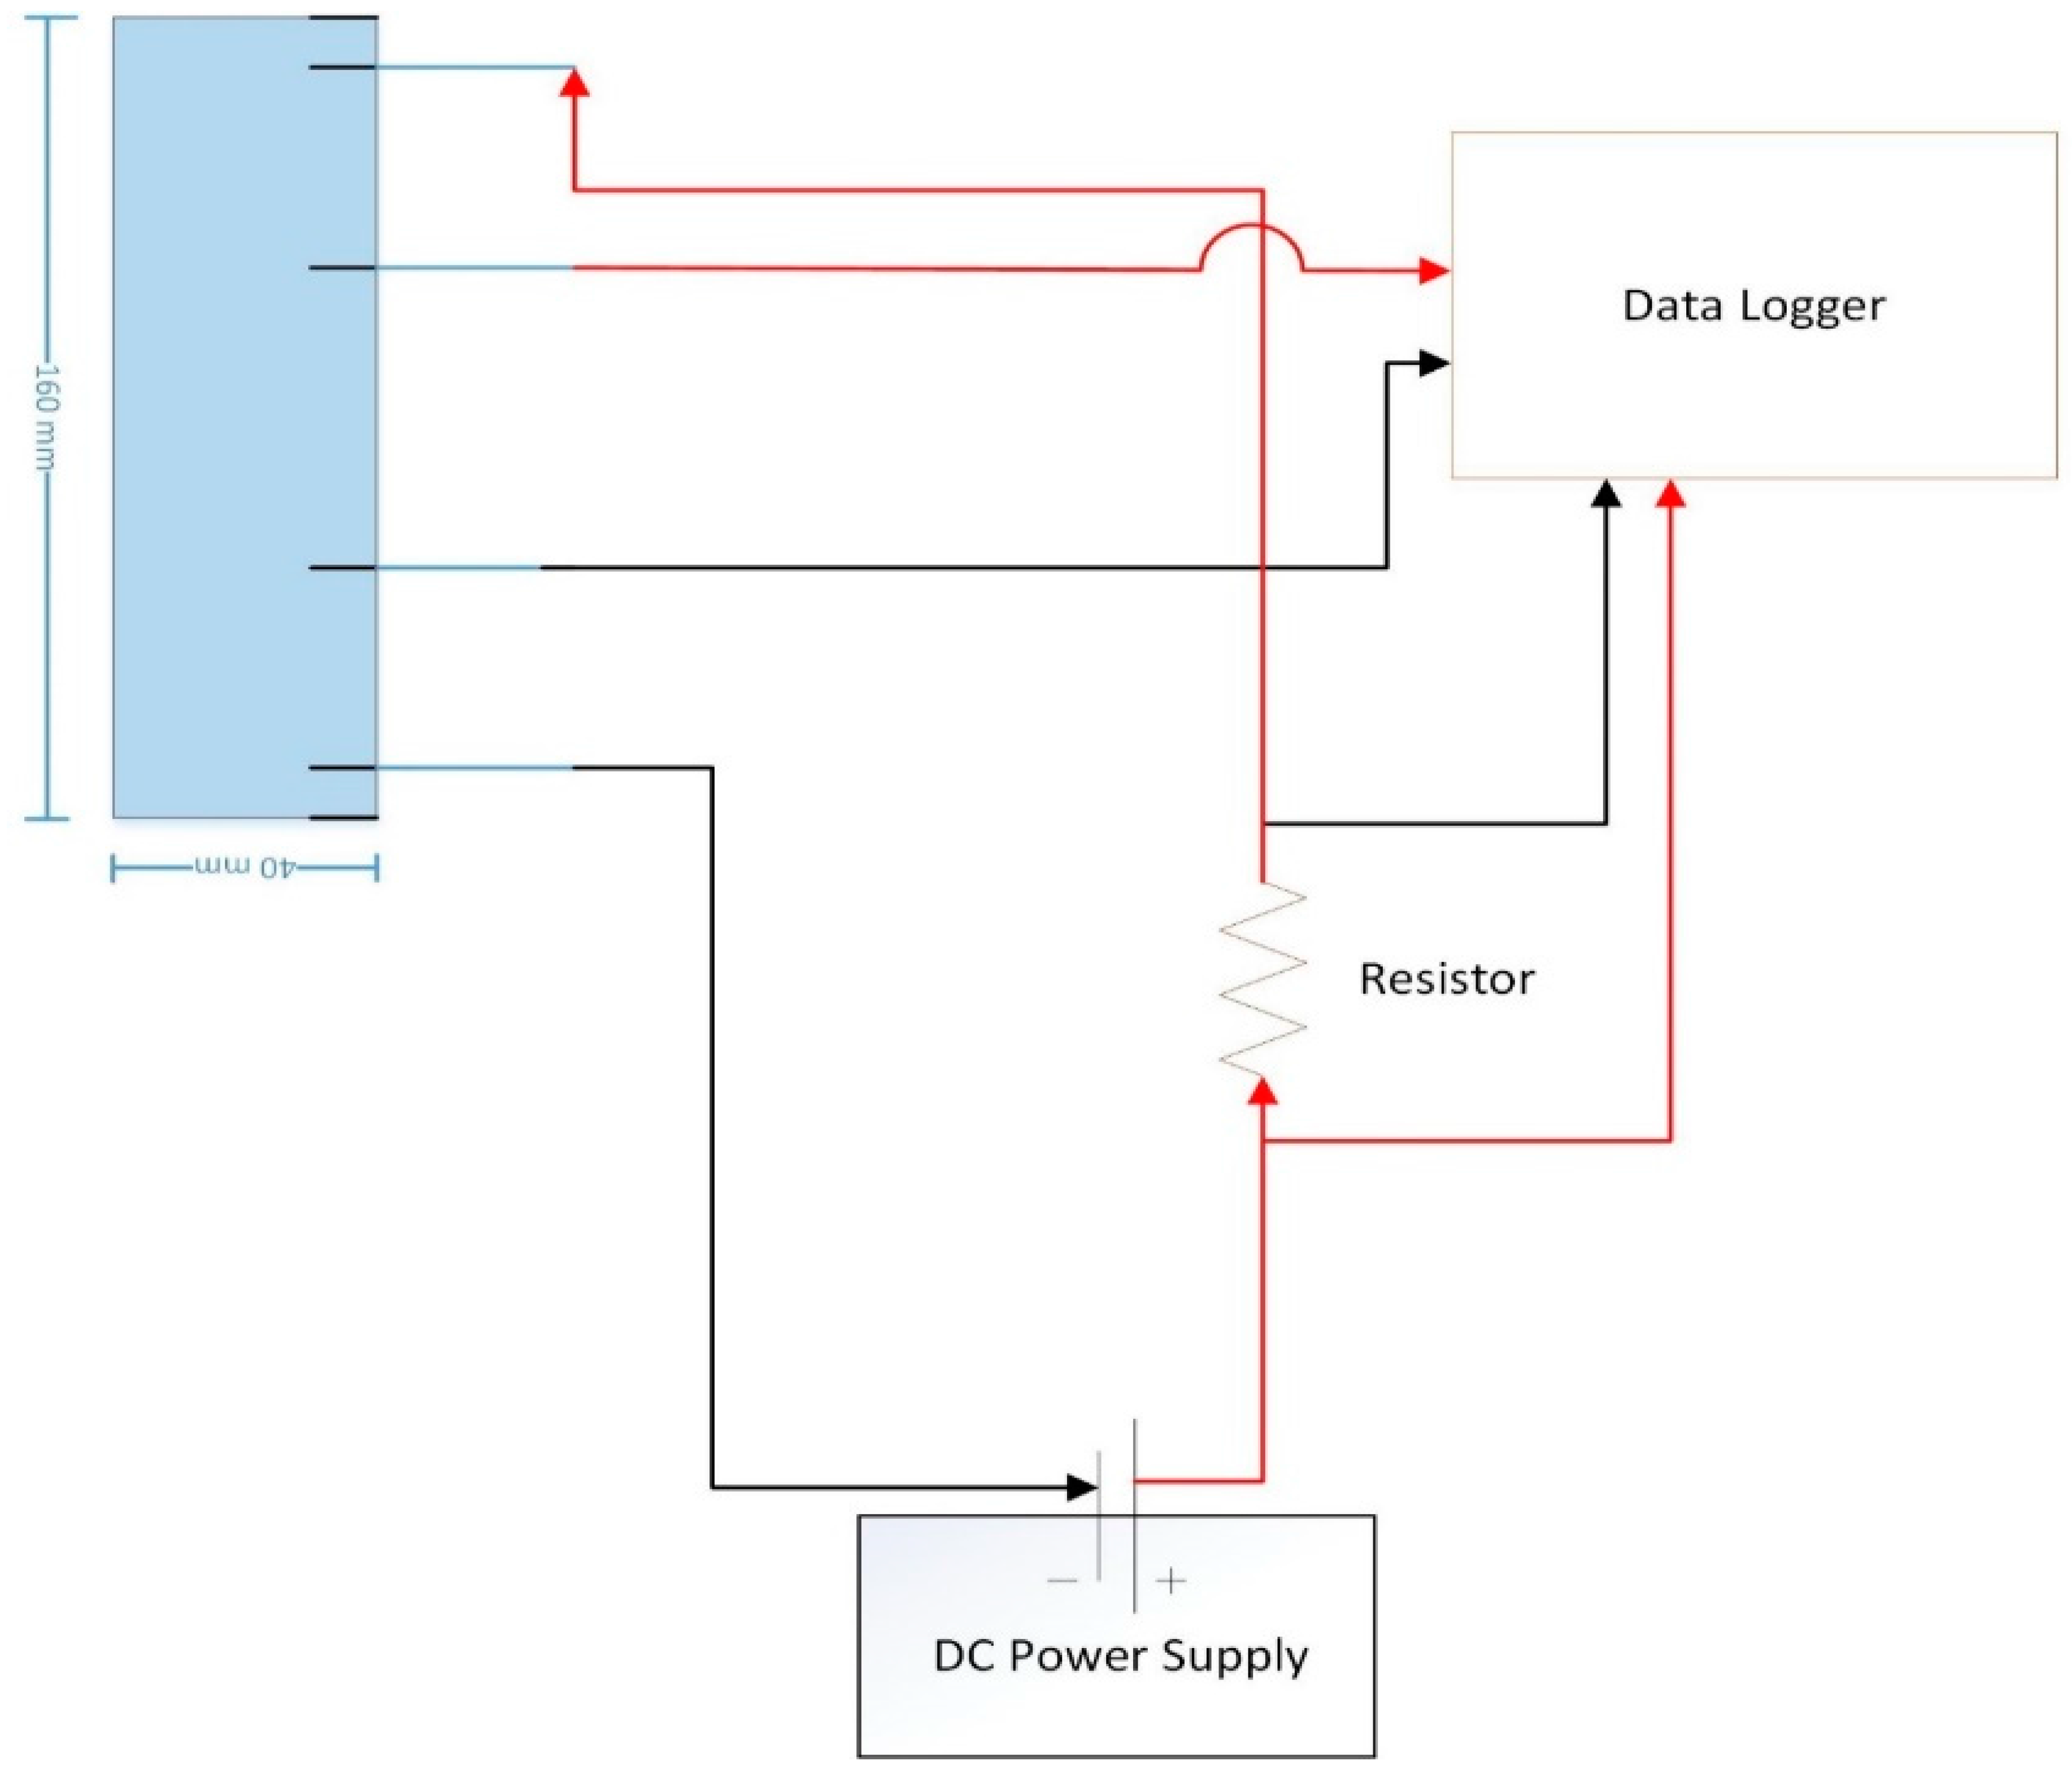
2.5. Self-Sensing Properties of GO Based Cement Composites

To determine electrical properties, a prism was casted having dimensions of 160 mm × 40 mm × 40 mm. Four-stainless-steel wire meshes of 11 mm × 11 mm cross-section with an average thickness of 1.3 mm and dimensions of 40 mm × 70 mm were inserted in the samples to measure the electrical properties of GO–cement composite specimens. The four-probe method was used to determine the piezoresistive properties of the GO–cement composite specimens. The outer two wire meshes were positioned at 10 mm from the ends of the prism while the inner two wire meshes were positioned at 40 mm from the outer wire mesh. The setup for measuring the electrical resistivity comprise of Instron 600 kN machine used for applying a compressive load, TDS-530 data logger to record the voltage measurements, a DC power supply, and 10-ohm resistance. Specimens were placed in Instron machine and a constant voltage of 15 V through DC power supply was applied to the samples. Figure 2 shows the schematic illustration of the electrical connection in circuit. Inner wire meshes were connected to the data logger and measures the voltage drop in V. Meanwhile, one of the outer wire meshes was connected to the negative terminal of the power supply and the remaining outer wire mesh was connected to the resistor followed by the connection to the second channel of the data logger and positive terminal of the power supply forming a series circuit as shown in Figure 2. Moreover, the electrical properties were determined by monitoring variation in electrical resistance of the specimen. Based on Ohm’s law given in Equation (1), the material’s electrical resistance at a given constant temperature is equal to the amount of applied voltage divided by the amount of electrical current flowing through it. Mathematically it is expressed as:
R = V I
where R = electrical resistance of the material in ohms (Ω); V = applied voltage in volts (V); and I = electrical current in amperes (A).
Furthermore, Electrical resistivity values were calculated by using Equation (2) for unequal spacing [26].
ρ = V I × 2 π × 1   ( 1 S 1 + 1 S 3 1 S 1 + S 2 1 S 2 + S 3 )
where “V” is the floating potential difference between inner two probes; “I” is current measured by outer two probes; “ρ” is the resistivity in ohm-cm; and “S” is the spacing in cm and was calculated from current carrying probe to the voltage measuring probe. S1 = S3 = 40 cm and S2 = 60 cm.
In addition, to observe the sensing ability of the specimens, normalized compressive loading (NCL) values were calculated. It is the ratio between the applied loads to the maximum compressive load before specimen failure. For electrical resistance values, the fractional change in resistance (FCR) was used. Equations (3) and (4) presents the calculation procedure for the NCL and FCR values [6].
NCL = P P max
FCR = ρ t ρ o ρ o × 100 %
where ρt is the electrical resistivity at the given time during the test; ρo is the electrical resistivity at the start of the test; P is the compressive loading at the given time during the test; and Pmax is the maximum compressive loading for the specimen.

3. Test Results and Discussion

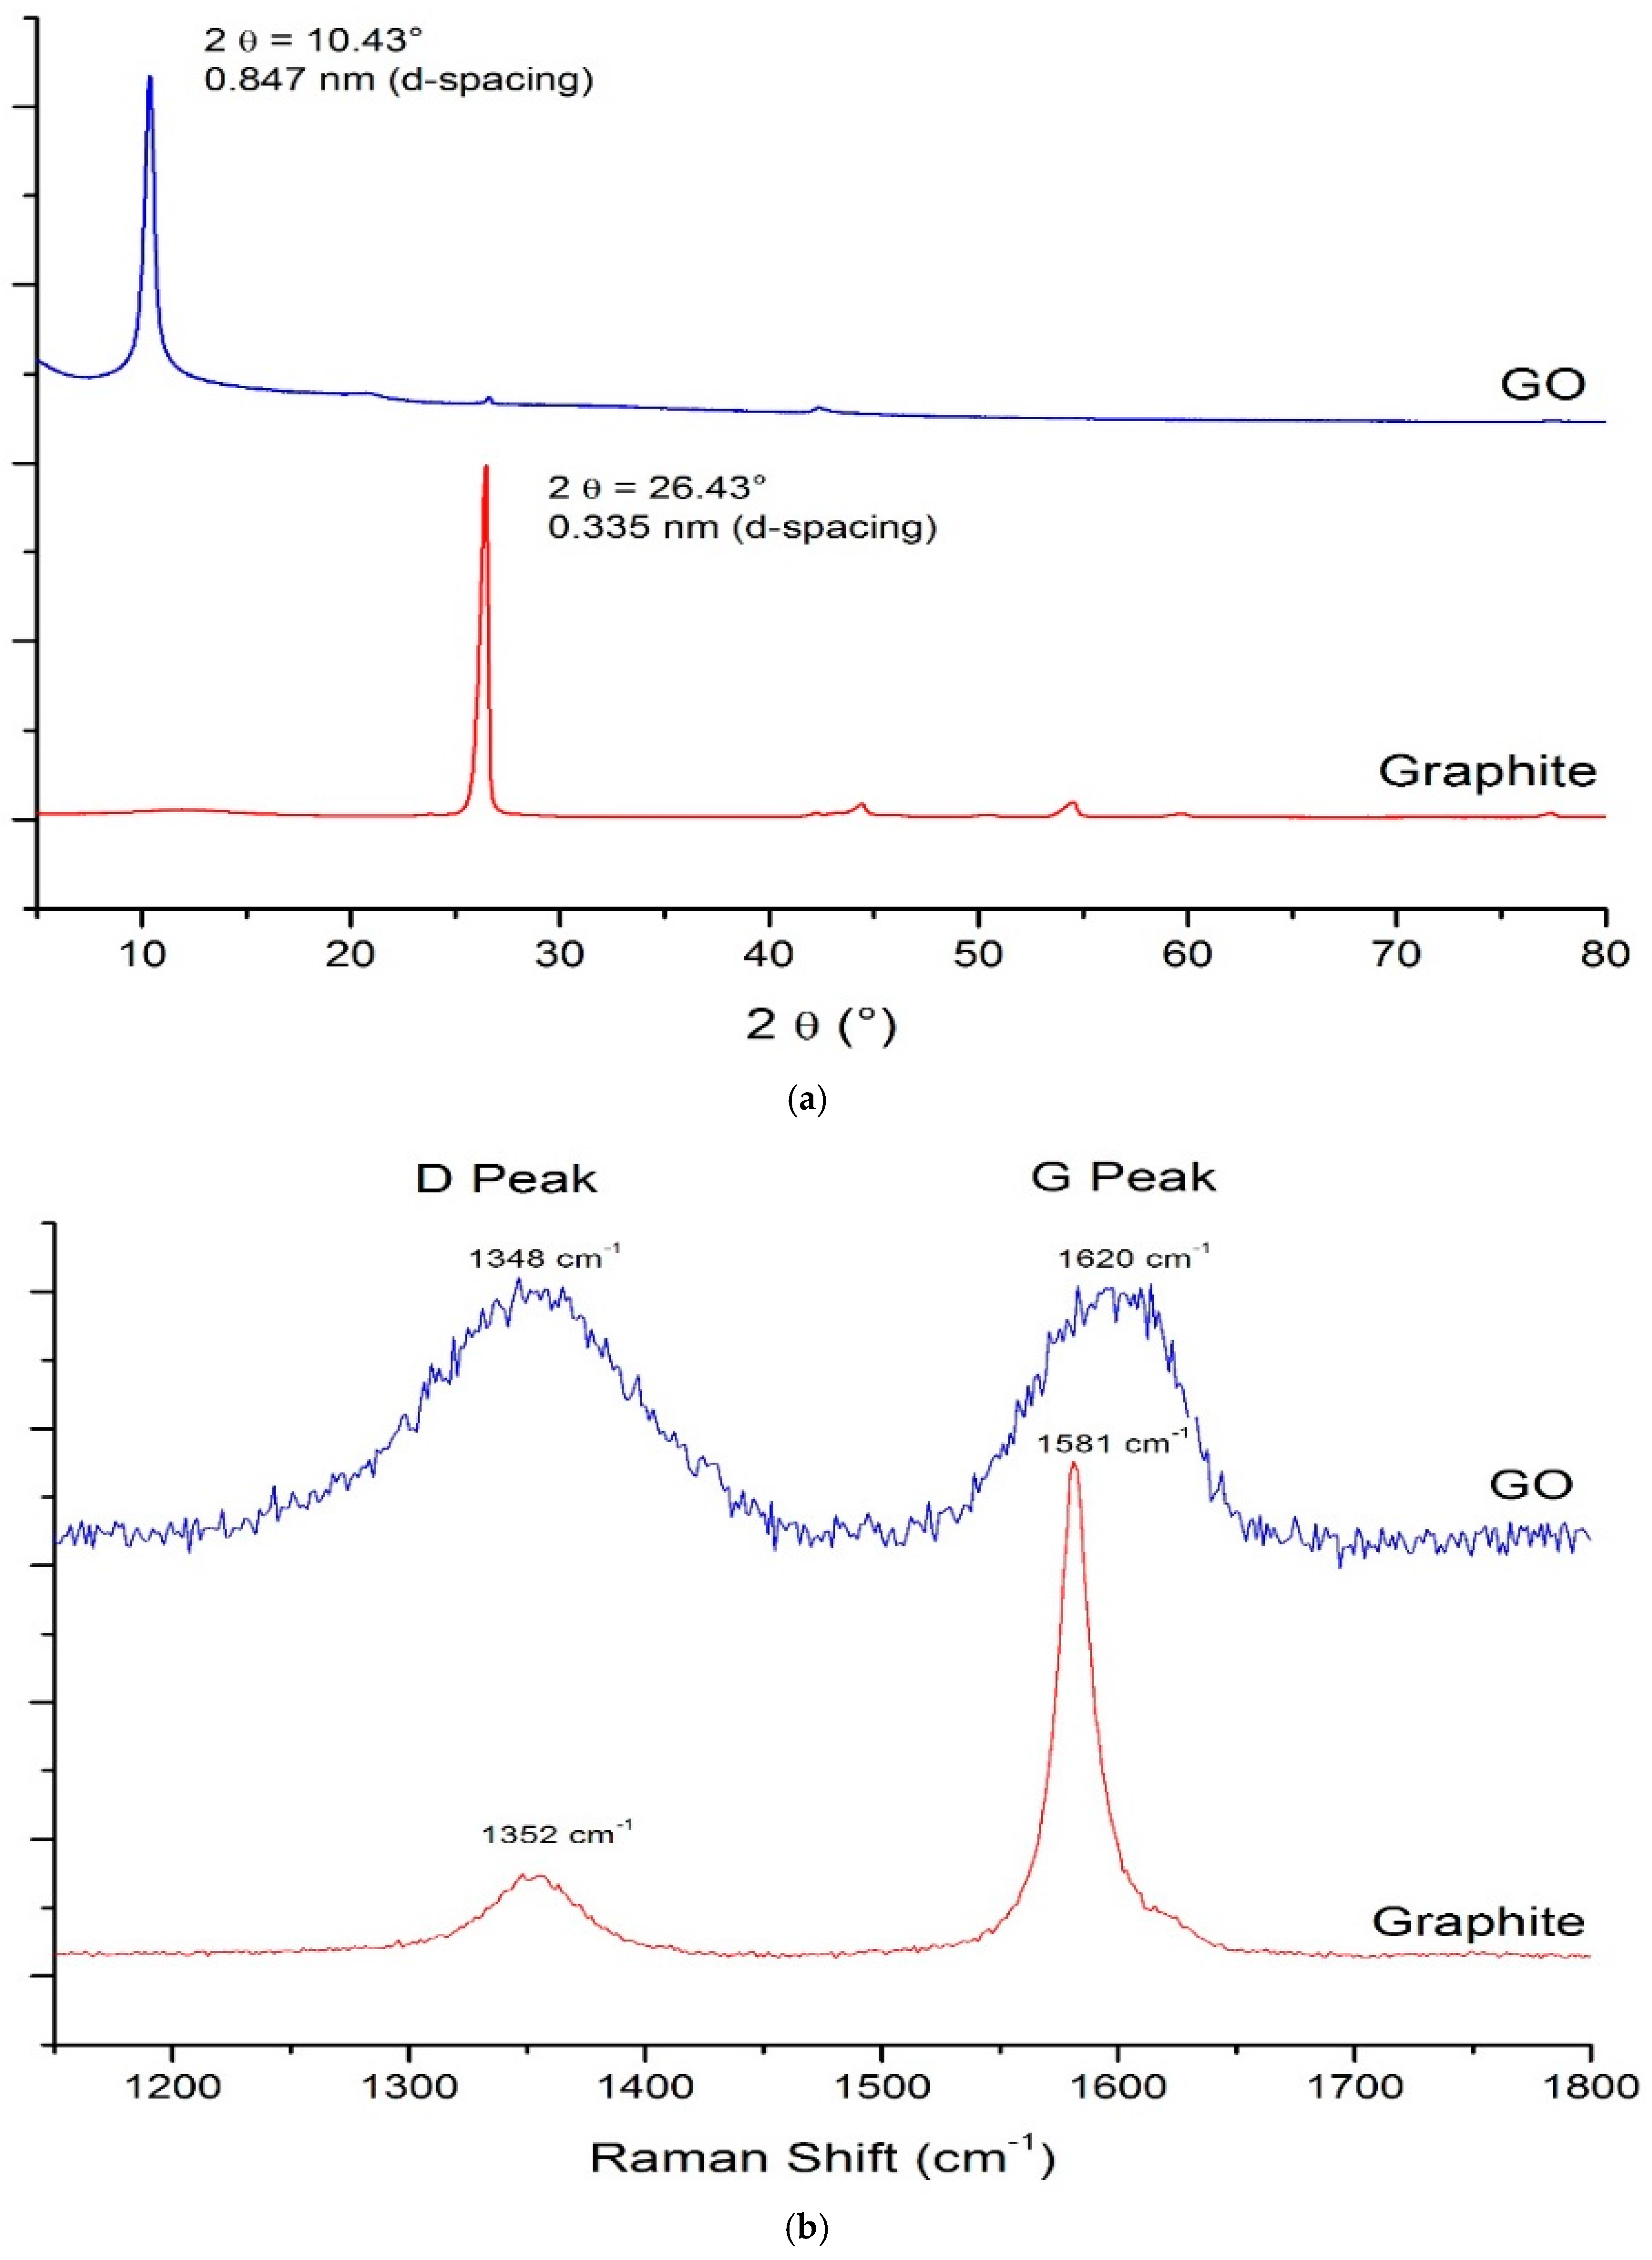
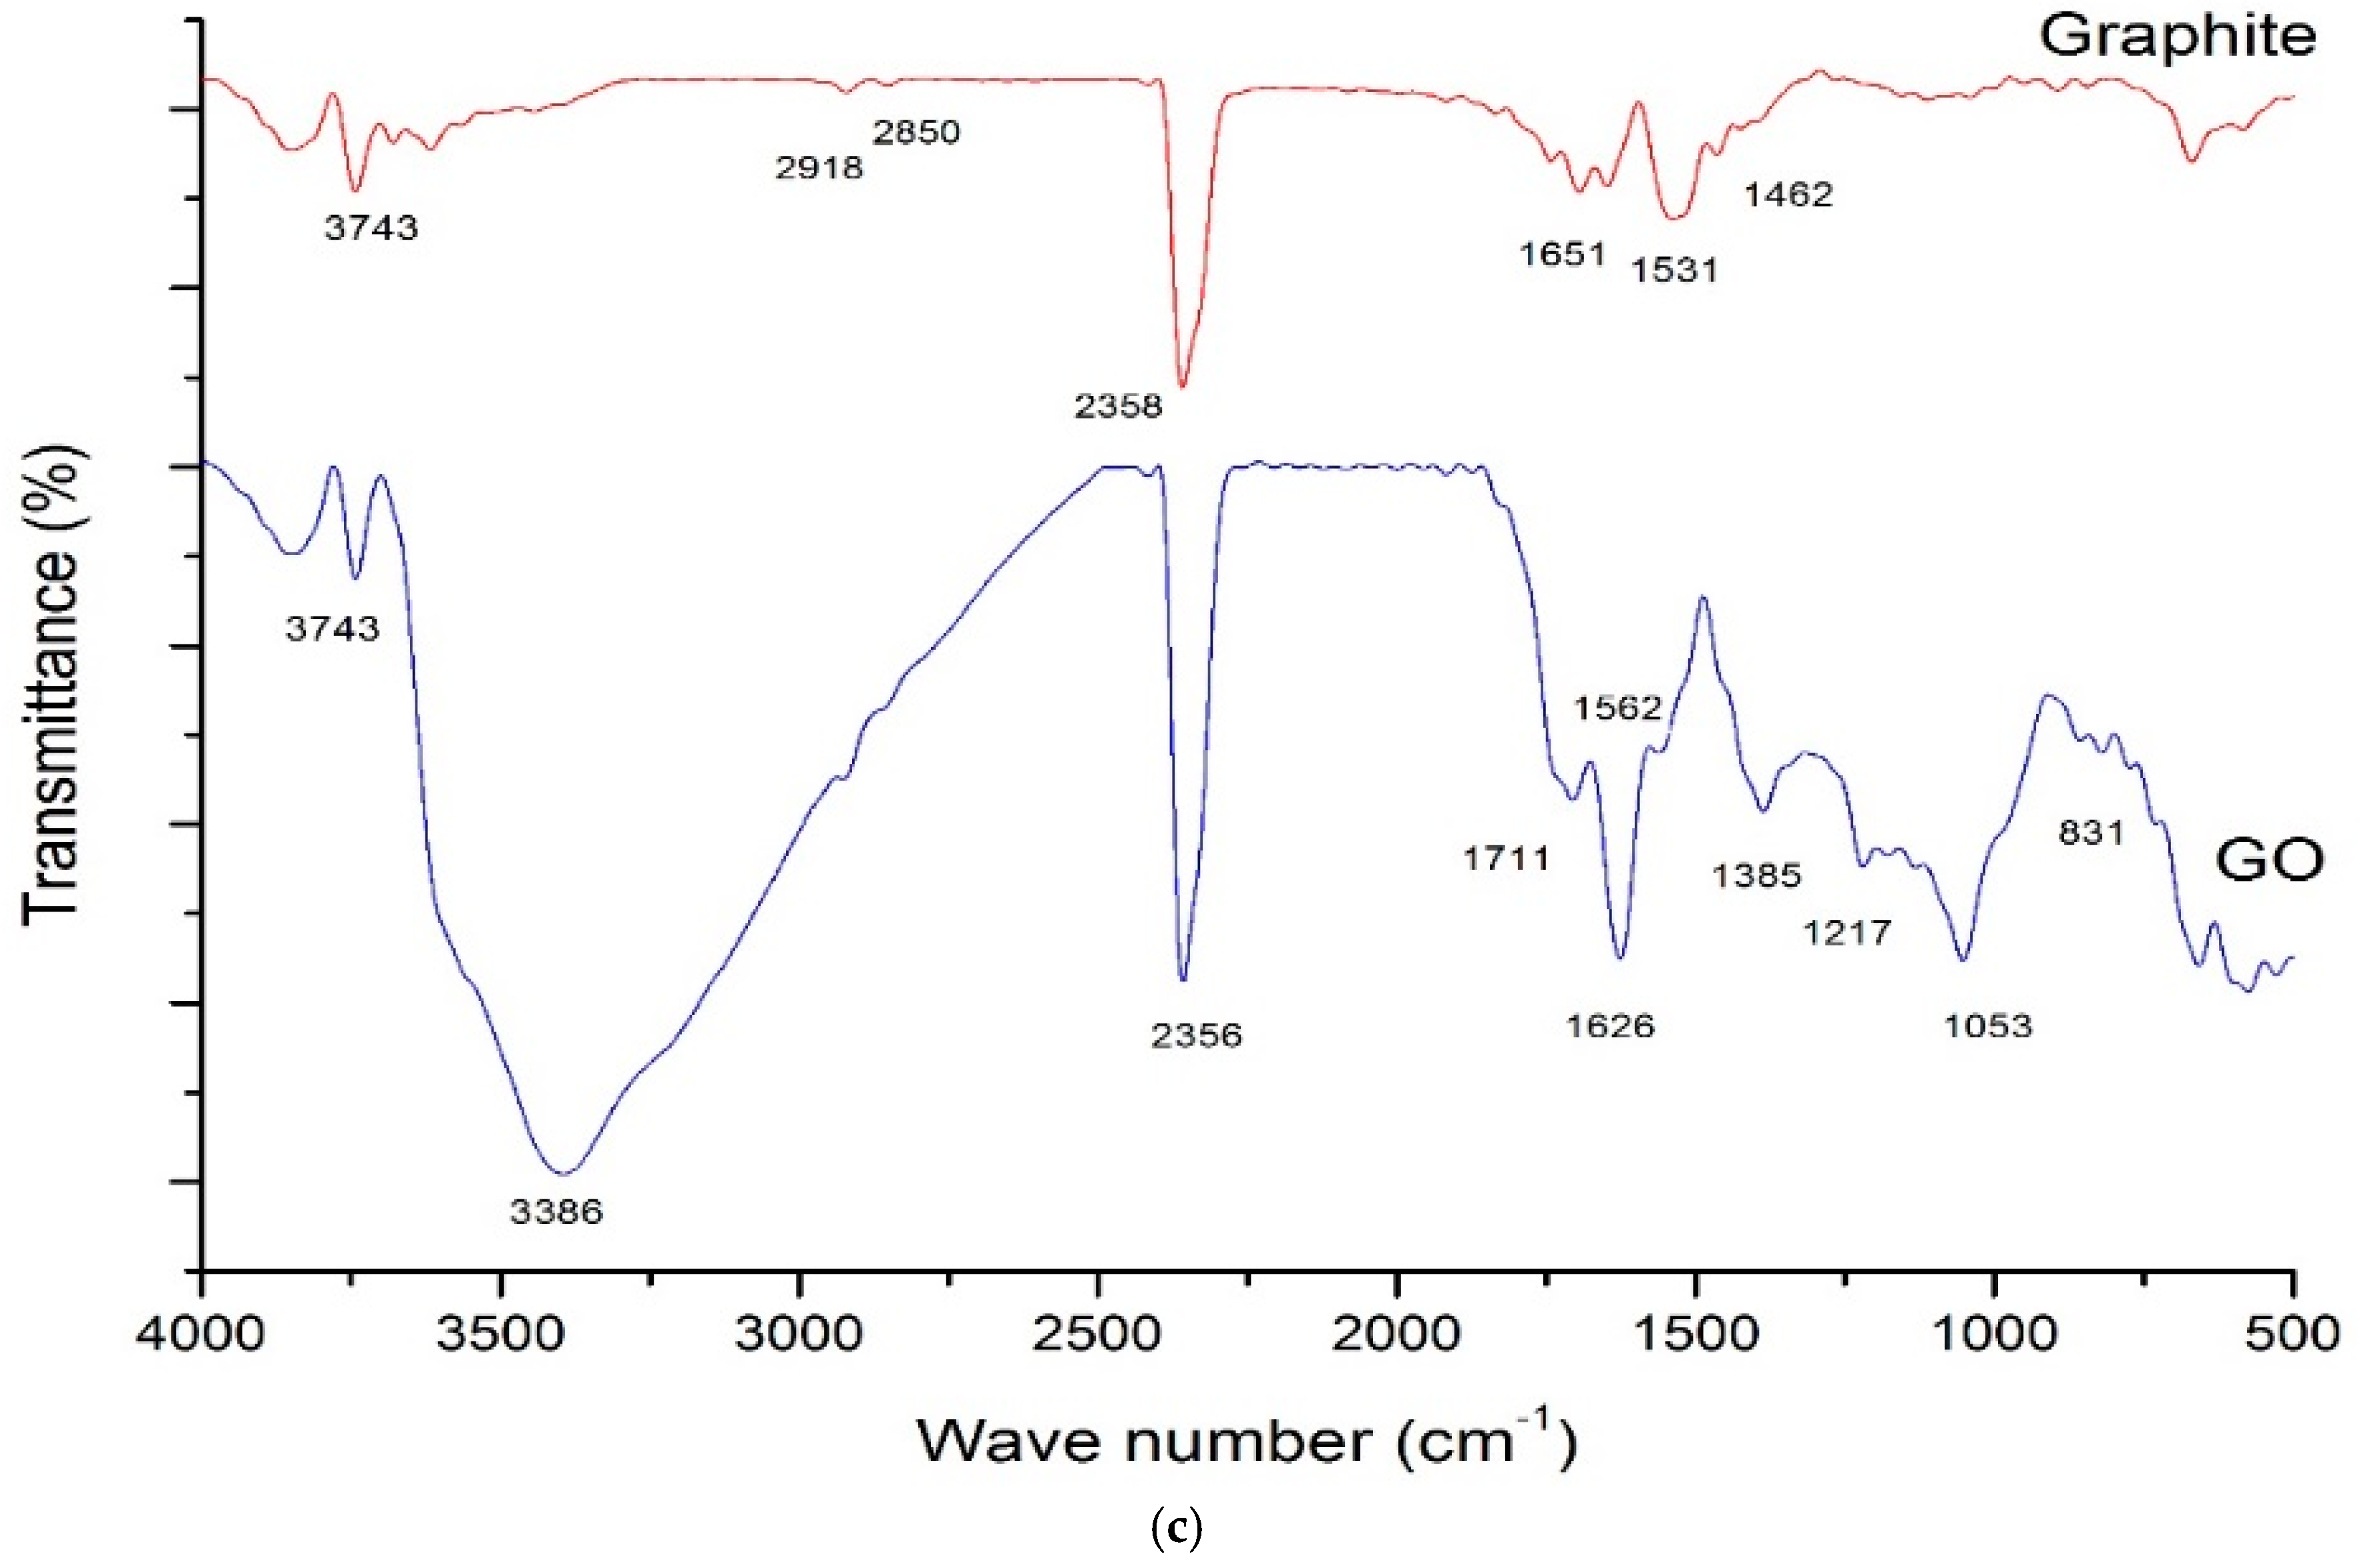
3.1. Characterization of GO Sheets

EDS determined the chemical composition of graphite and GO sheets (Table 3). In natural graphite, the oxygen content was 2%. However, after excessive oxidation, the oxygen content in GO increased to 39.5%. This is in line with the available literature [21,27].
The mineralogical characteristics of GO and graphite as determined by XRD are shown in Figure 3a. The peak of graphite having an interlayer distance of 0.335 nm (d-spacing) was observed at 2θ = 26.43° while the peak of GO having an interlayer distance of 0.847 nm (d-spacing) was observed at 2θ = 10.43°. This shows that, after oxidation process, the characteristics peak shifted towards lower angle and is in line with the results reported in the literature [28,29]. The transfer in peak confirms the formation of GO while the increment in d-spacing confirms the penetration of oxygen functional groups in between the graphite layers. Furthermore, it decreases the interaction between graphite layers and helps in the smooth dispersion of GO in aqueous solution.
Raman spectroscopy is the powerful tool to determine the oxidation effect and presence of hydroxyl groups on GO sheets. The spectra of GO and graphite in 1200–1700 cm−1 range are shown in Figure 3b. The peaks shown are termed as D and G peaks. The D peak represents the disorder present over the plane while G peak represents sp2 bonded carbon [21]. In natural graphite, a strong, sharp and high-intensity G peak can be seen at 1581 cm−1 (caused by graphite lattice structure) while a weak and broader D peak can be observed at 1352 cm−1 (caused by disorder band graphite edges). In GO, the G band broadens and shifted to a higher frequency (1620 cm−1) while D peak was also found to widen (1348 cm−1). The shifting and stretching of G peak to higher frequency is due to extensive oxidation and size degradation of in-plane sp2 domain while the broadening of D peak confirms the existence of hydroxyl group at the edges and disorder in the sheet caused by oxidation [30].
The FTIR spectra of graphite and graphene oxide are presented in Figure 3c. The spectrum of graphite shows peaks at 3743 cm−1 (vibration of OH stretching, adsorbed water molecules), 2918 cm−1 and 2850 cm−1 (symmetric and asymmetric stretching vibration of –CH2), 1651 cm−1 (–C=C– stretch structural vibration), 2358 cm−1 (gaseous-CO2), 1531 cm−1 and 1462 cm−1 (–C–C– stretch) [31]. After oxidation, the peaks of GO were found at 3386 cm−1 (–OH), 1711 cm−1 and 1385 cm−1 (–COOH), 1626 cm−1 (–C=O–, C=C, –OH), 1562 cm−1 (–C–C–), 1217 cm−1 and 1053 cm−1 (–O–) and 1385 cm−1 and 831 cm−1 (C–SO3) [13]. These peaks confirm the existence of carboxyl group (–COOH), carbonyl group (C=O), epoxy group (C–O–C), hydroxyl group (–OH) and alkoxy group (C–O stretching) in GO [21]. Furthermore, it indicates the destruction of sp2 character and formation of defects due to oxidation. More specifically, hydroxyl and epoxy groups are formed at the basal plane while carboxyl group is formed at the edges of the sheet.

3.2. Dispersion Efficiency of GO-Aqueous Solution

Exfoliation of GO sheets in aqueous solution is the first and crucial step which will determine the characteristics of sustainable GO based cement composites. The dispersion efficiency of GO in aqueous solution was determined using UV-vis spectrometric measurements. This method was used by Jiang, et al. [32] to quantitatively characterize the colloidal stability of CNT dispersion. Moreover, Bouguer Lambert Beer law was used as the quantitative basis of absorption spectroscopy [33]. It is known that absorbance depends on the concentration of the dispersed GO sheets, as GO sheets can absorb light in aqueous solution. Therefore, the absorbance of GO sheets in deionized water was used as a reference and compared with the absorbance of GO sheets in aqueous solution with superplasticizer. The absorption peak of GO sheets was observed at 232 nm wavelength, which represents the π–π* transition of C=C bond and is in line with the available literature [21]. Hence, after ultrasonication, the absorbance was calculated at 232 nm wavelength at different time interval. As shown in Figure 4, the GO sheets are well dispersed and remain suspended in aqueous solution in presence of SP even after 120 min. After 10 and 120 min, the absorbance in GO aqueous solution with SP was 40% and 33% more as compared to without SP solution. The better dispersion of GO sheets in aqueous solution is mainly attributed to: (1) Surface modification of graphene nanoplatelets due to the presence of carboxylic group (–COOH) on GO sheets make them hydrophilic and dispersible [34]. (2) Use of polycarboxylate based superplasticizer acts as surfactant and disperses GO nanosheets. Sixuan [9] stated that dispersant neutralize the residual charges of nanomaterials and make entire surface to carry same charge, which in turn, results in uniform dispersion due to electrostatic repulsion. Wotring [35] also observed that polycarboxylates based high range water reducing superplasticizer can maintain the stability of graphene nanoplatelets in the solvent. (3) Use of ultrasonication technique imparts the vibrational waves to the solution. The energy that had been delivered to the graphene oxide sheets by sonication leads to the wreckage of the interlayer π-bond and achieve uniform dispersion [9]. According to Mehrali et al. [36] graphene flakes sonicated in distilled water remained stable in suspension for 600 h. Therefore, it can be concluded that carboxylic groups (–COOH), polycarboxylate based superplasticizer and ultrasonication ensured the uniform dispersion of GO in aqueous solution.

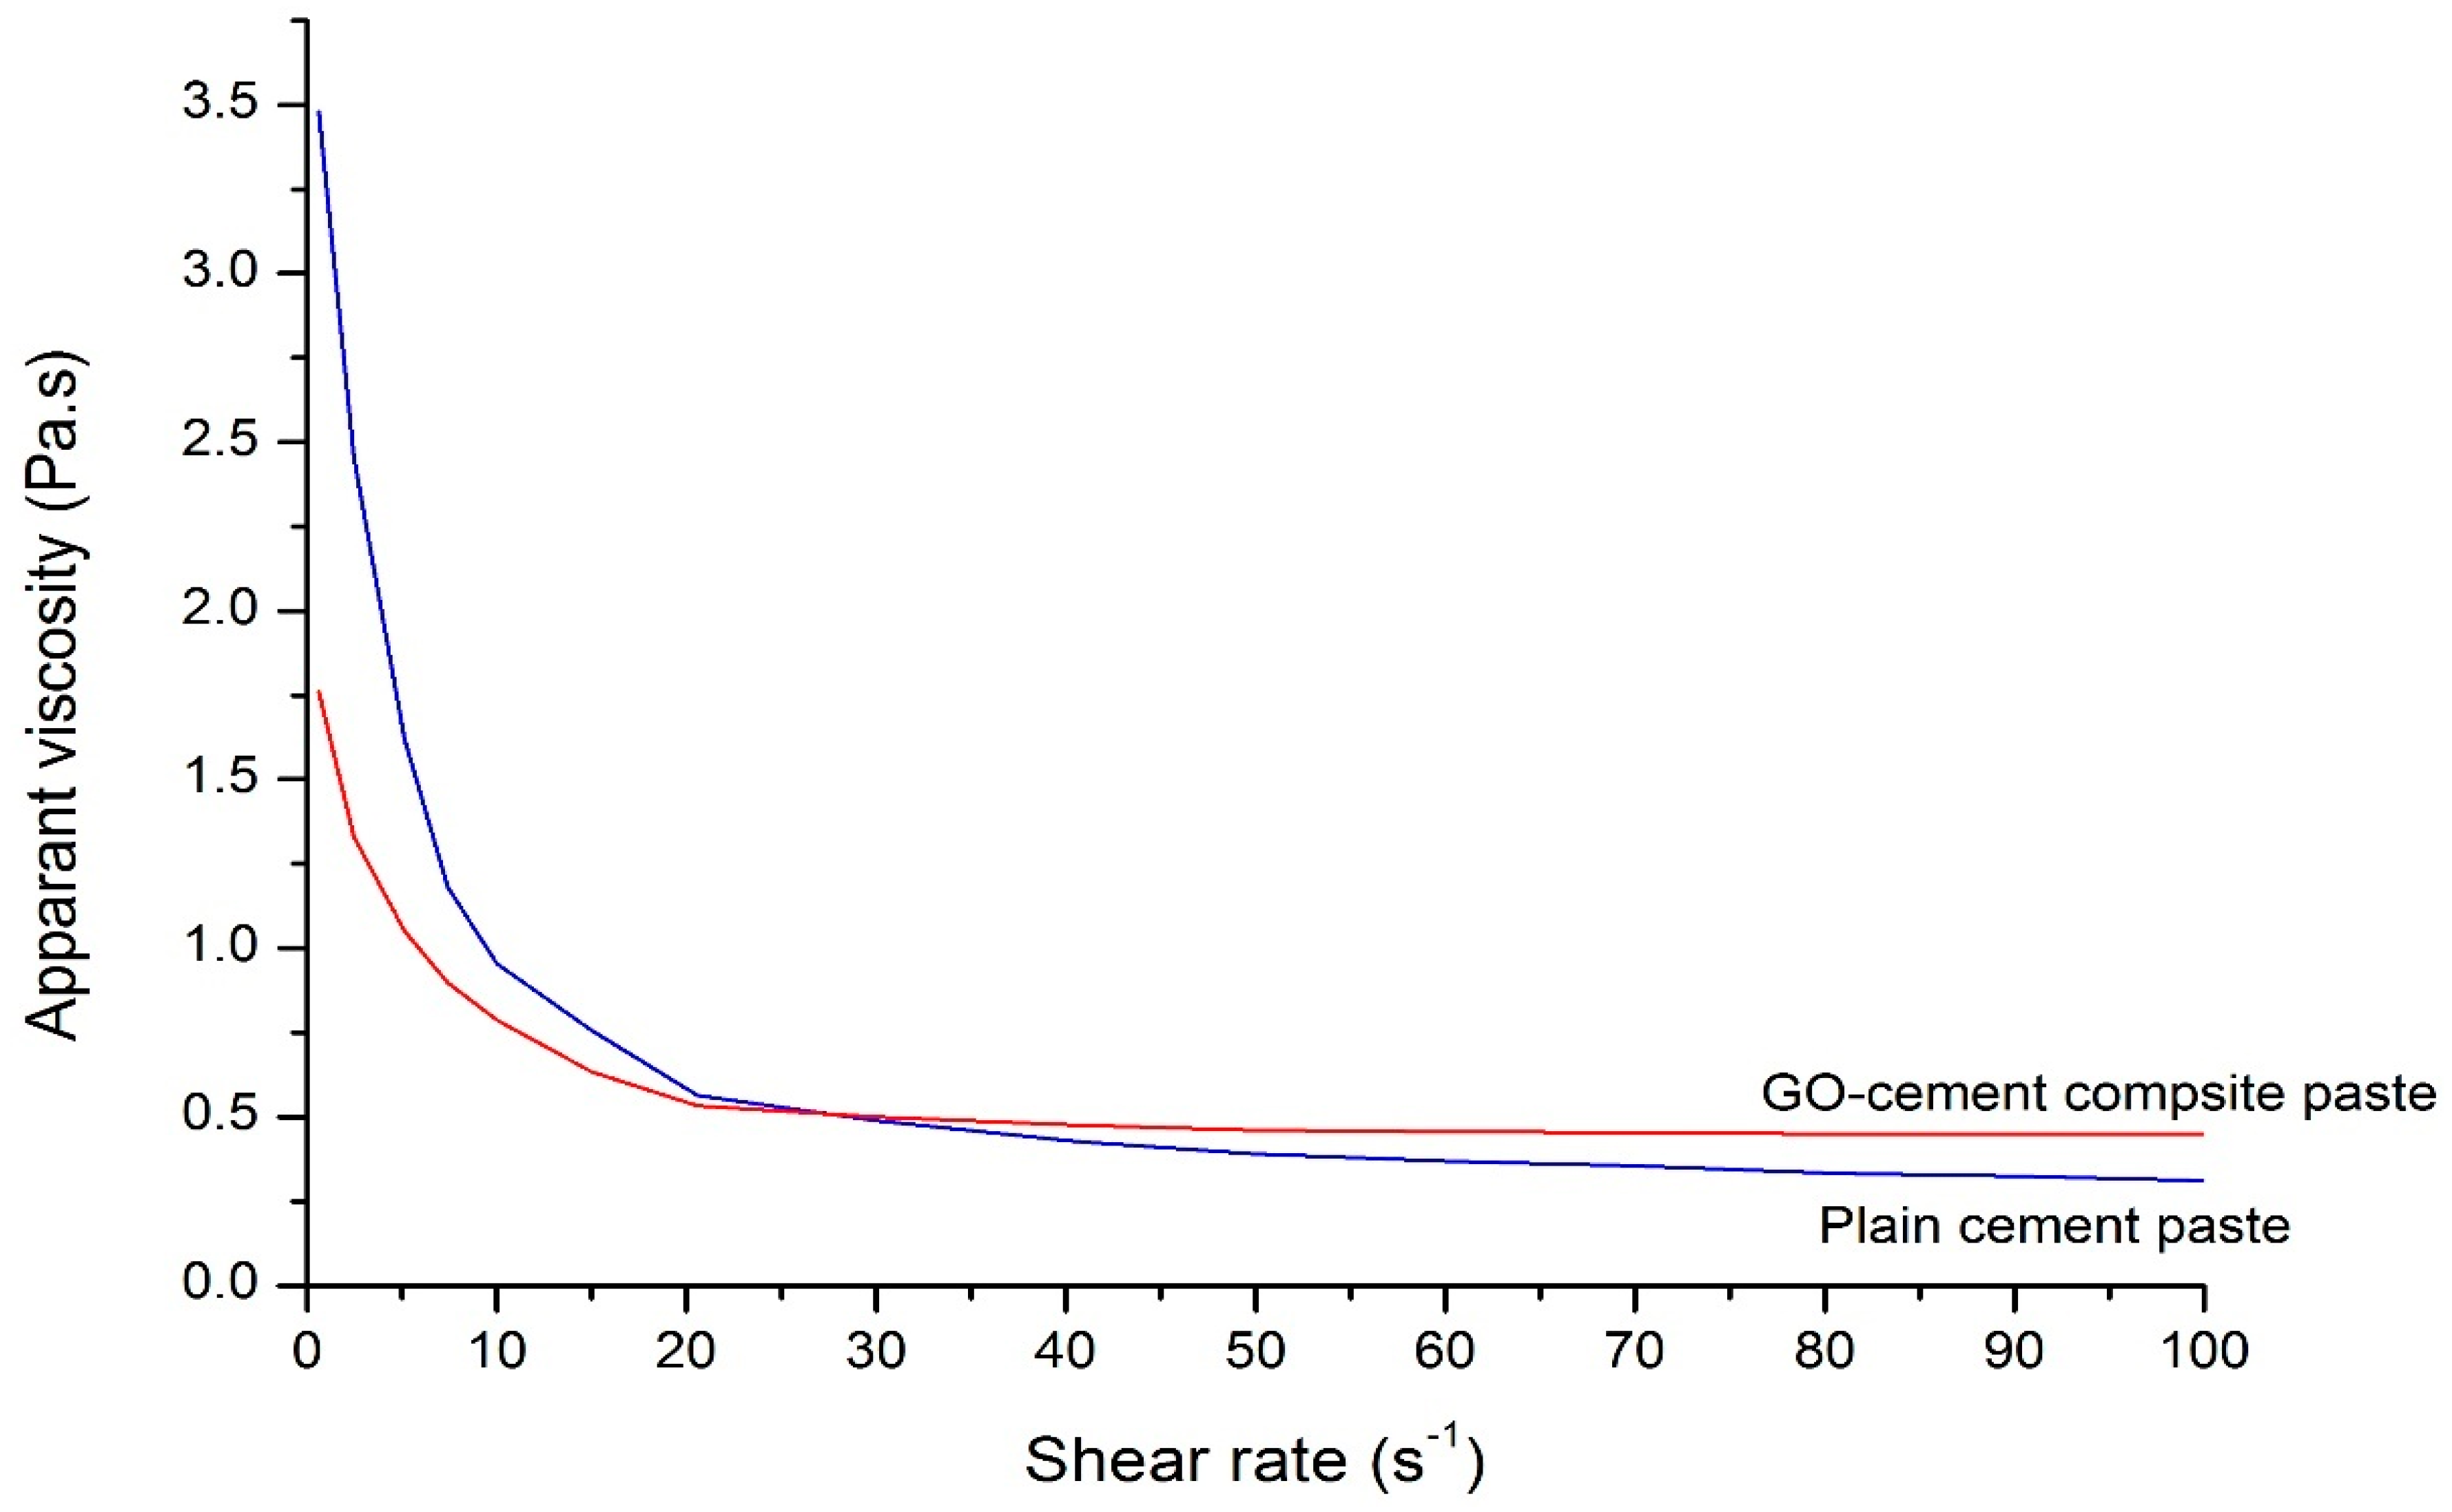
3.3. Impact of GO Sheets on Rheological Properties of Cement Pate Composite

In this research, Bingham model was used to determine the rheological behavior of the paste. The Bingham model depends on two variables (yield stress and plastic viscosity). The plastic viscosity is independent of the shear rate and paste behaves as Newtonian flow but having some yield stress. The Bingham model equation is given as [7]
τ = τ + η γ Bingham   equation  
where τ is the shear stress (Pa), τ is the yield stress (Pa), η is the plastic viscosity (Pa·s) and γ is the shear rate (s−1). Yield stress was determined by the intercept value of shear stress axis at zero shear rate and plastic viscosity as a slope of the shear stress and shear rate curve.
The rheological parameters obtained from the Bingham curve are enlisted in Table 4. The low values of yield stress in both plain cement paste and GO–cement composite paste is due to the addition of superplasticizer, which greatly enhances the flowability of the paste. It can also be seen that the plastic viscosity is increased due to the addition of GO sheets in cement paste. This phenomenon was also observed in workability test.
It is known that the cement particles have a net attraction with each other, especially when they are in contact with water. Owing to this, they form flocs and cannot be considered as colloidal particles. Architecture and size of these flocs have a significant influence on the dispersion and flow properties. By increasing the shear rate, these flocs reduce to the original size of the particles and resistance to the flow of the fluid is reduced. After specific shear rate, no further breakdown of flocs occurs and fluid leads to Newtonian plateau. A similar phenomenon is observed in Figure 5. At the beginning, when shear rate was very small, the apparent viscosity was high. When the shear rate increased, the viscosity reduced and reached steady state. The viscosity of GO–cement composite was found more as compared with the plain cement paste due to the reason that GO sheets provide resistance to the flow. It can also be seen from Figure 5 that the paste behaved as shear thinning fluid up till 60 s−1 followed by the Newtonian plateau stage. In the shear thinning portion of the curve, shear-induced dispersion of solid suspended particles was found and in Newtonian plateau stage, the dispersion was almost independent of the shear rate. The rheological results indicate that GO sheets increased the plastic viscosity, which leads to an increase in resistance of the flow.

3.4. Microstructure and Characterization of GO Based Cement Composite

FTIR spectra of plain cement and GO–cement composite specimens are presented in Figure 6a. The spectrum a of plain cement specimen shows peaks at 3375 cm−1 (H–O–H stretching of CSH); 1014 cm−1 (Si–O asymmetric stretching vibrations of CSH); 460 cm−1 (Si–O in-plane vibration of CSH), 690 cm−1 (Si–O out of plane vibration of CSH); 1410 cm−1, 874 cm−1 and 712 cm−1 (C–O stretching of CO3−2); 1630 cm−1 and 3430 cm−1 (H–O–H stretching of ettringite); 695 cm−1 (S–O bending vibration of SO4−2); and 2299 cm−1 and 2075 cm−1 (C=O, C=C, O=O) [37,38,39,40]. In GO–cement composite specimen spectrum the intensity of the peak at 3640 cm−1 is more, which was due to O–H stretch (hydroxyl group) of CH [39]. It indicates that more quantity of hydrated cement products (i.e., CH) were formed due to the addition of nanomaterial in cement composite. The spectrum of GO–cement composite shows a slightly broader peak at 3359 cm−1, which is attributed to hydrogen bonded OH species (H–O–H) absorbed on the surfaces [39]. The broadness of the peak suggests that chemical interaction or hydrogen bonding might have involved [41] with the functional groups of graphene oxide nanosheets. The Si–O asymmetric stretching vibrations of CSH in GO cement composite shifted from 1014 cm−1 to 1025 cm−1, indicating very little polymerization of silicates in the samples [38]. Therefore, it can be correlated to the presence of bond between the cement matrix and GO.
Thermogravimetric analysis (TGA/DTA) was used to determine the behavior of cement-based composite at elevated temperature. According to available literature, few reactions occur due to heating of the cement based mortar: (a) 180–300 °C bonded water loss from C–S–H and carboaluminate hydrate; (b) 430–480 °C dehydroxylation of portlandite (calcium hydroxide); and (c) 600–780 °C decarbonation of calcium carbonate [37,42,43,44,45,46,47]. The thermal analysis of both specimens (with and without GO) are presented in Figure 6b while the weight loss values in different regions are given in Table 5. For GO–cement composite, the weight loss in 180–300 °C range was found to be 1.01%, which is 20.8% less when compared to plain cement specimen. The reason for less weight loss may be attributed to the bonding of C–S–H gel with the graphene oxide sheets, as observed in FTIR spectra. Another possible explanation for less weight loss is the more production of C–S–H gel, which fills up the micropores and as a result, less amount of water was available [48]. To determine the amount of CH, dehydroxylation of portlandite and decarbonation of calcium carbonate, the molecular mass ratio was used (Table 5). In GO–cement composite specimen, the potential amount of CH by mass percentage was found to be 10.87 while in plain cement specimen it was 9.34, which supports the FTIR findings. According to Trezza [49], the amount of CH gives an indication of the hydration, therefore, it can be concluded from the results that more hydration occurs by incorporating nanomaterials. This, in turn, results in enhanced compressive strength and density of the composite material.
The XRD patterns of both plain cement and GO–cement composite specimens were obtained (as shown in Figure 6c) to evaluate the hydration reactions and interpret various crystalline phases present in cement based composite [50]. The hexagonal platy crystals of calcium hydroxide (CH) were observed at 18.3°, 34.5°, 47.47°, 50.33°, 55.21° and 64.7° [49]. In comparison to plain cement specimen, the amount of CH was more in GO cement composite specimen at 18.3°, 34.5° and 50.33°. It is known that the quantity of CH can be used as an indicator for the degree of hydration [49]. For the most significant peak (observed at 18.3°), the CH intensity was more in GO–cement composite specimen as compared with plain cement specimen. This is also validated by FTIR and TGA/DTA results. Therefore, it can be deduced that more degree of hydration is achieved by incorporating nanomaterial. For this research, the presence of alite (C3S) and belite (C2S) were used as an indicator for estimating CSH. The peaks of C3S were found at 29.54°, 46.32° and 51.55° [50]. In comparison to GO–cement composite specimen, alite peak content was observed more in plain cement matrix at 29.54°. Hence, it can be deduced that plain cement specimen contains more un-hydrated cement contents.
Conversely, it can be concluded that more hydration occurs due to the addition of GO nanomaterial, which supports the findings of TGA/DTA analysis. The XRD pattern also shows peaks at 20.92°, 26.74°, 36.68° 39.6°, 43.1° and 68.24°, which are due to the presence of sand (SiO2) [51]. However, the intensity of these sand peaks is approximately same. Finally, the peak of C4AF was observed at 23.5° [50], which diminished in GO–cement composite specimen and hence testifying higher hydration rate of GO–cement composite.

3.5. Workability of Fresh Cement Based Composites

The results of flow diameter of fresh mortars are presented in Table 6. With the addition of 0.03% of GO sheets, the percentage reduction in flow diameter was found to be 12%. It is believed to be due to the large surface area of the GO sheets, which requires more water to lubricate the surface of GO sheets. Pan et al. [15] found that the addition of 0.05% of GO sheets reduced the workability by 41.7%. In comparison to Pan et al. [15] results, the less reduction in flow diameter was probably due to the use of polycarboxylate based superplasticizer, which effectively improved the workability of GO–cement composite mortar.

3.6. Compressive Strength of Cement Based Composites

The results of compressive strength of GO–cement composite mortar and plain cement mortar are shown in Table 6. Due to low w/c ratio and use of superplasticizer, the compressive strength of plain cement mortar at 28 days was found to be 66.4 MPa. However, with the addition of nanosheets in cement composite, the compressive strength of GO–cement composite mortar increased and was found to be 84.3 MPa. This shows that, at the age of 28 and 90 days, the compressive strength of GO–cement composite mortar was 27% and 28% higher than plain cement mortar. The results support the findings of Pan et al. [15] and Murugan et al. [52]. The authors found 15–33% enhancement in compressive strength and 41–59% in flexural strength by using 0.05% GO [15]. The compressive strength improvement may be attributed to the following.
(a)
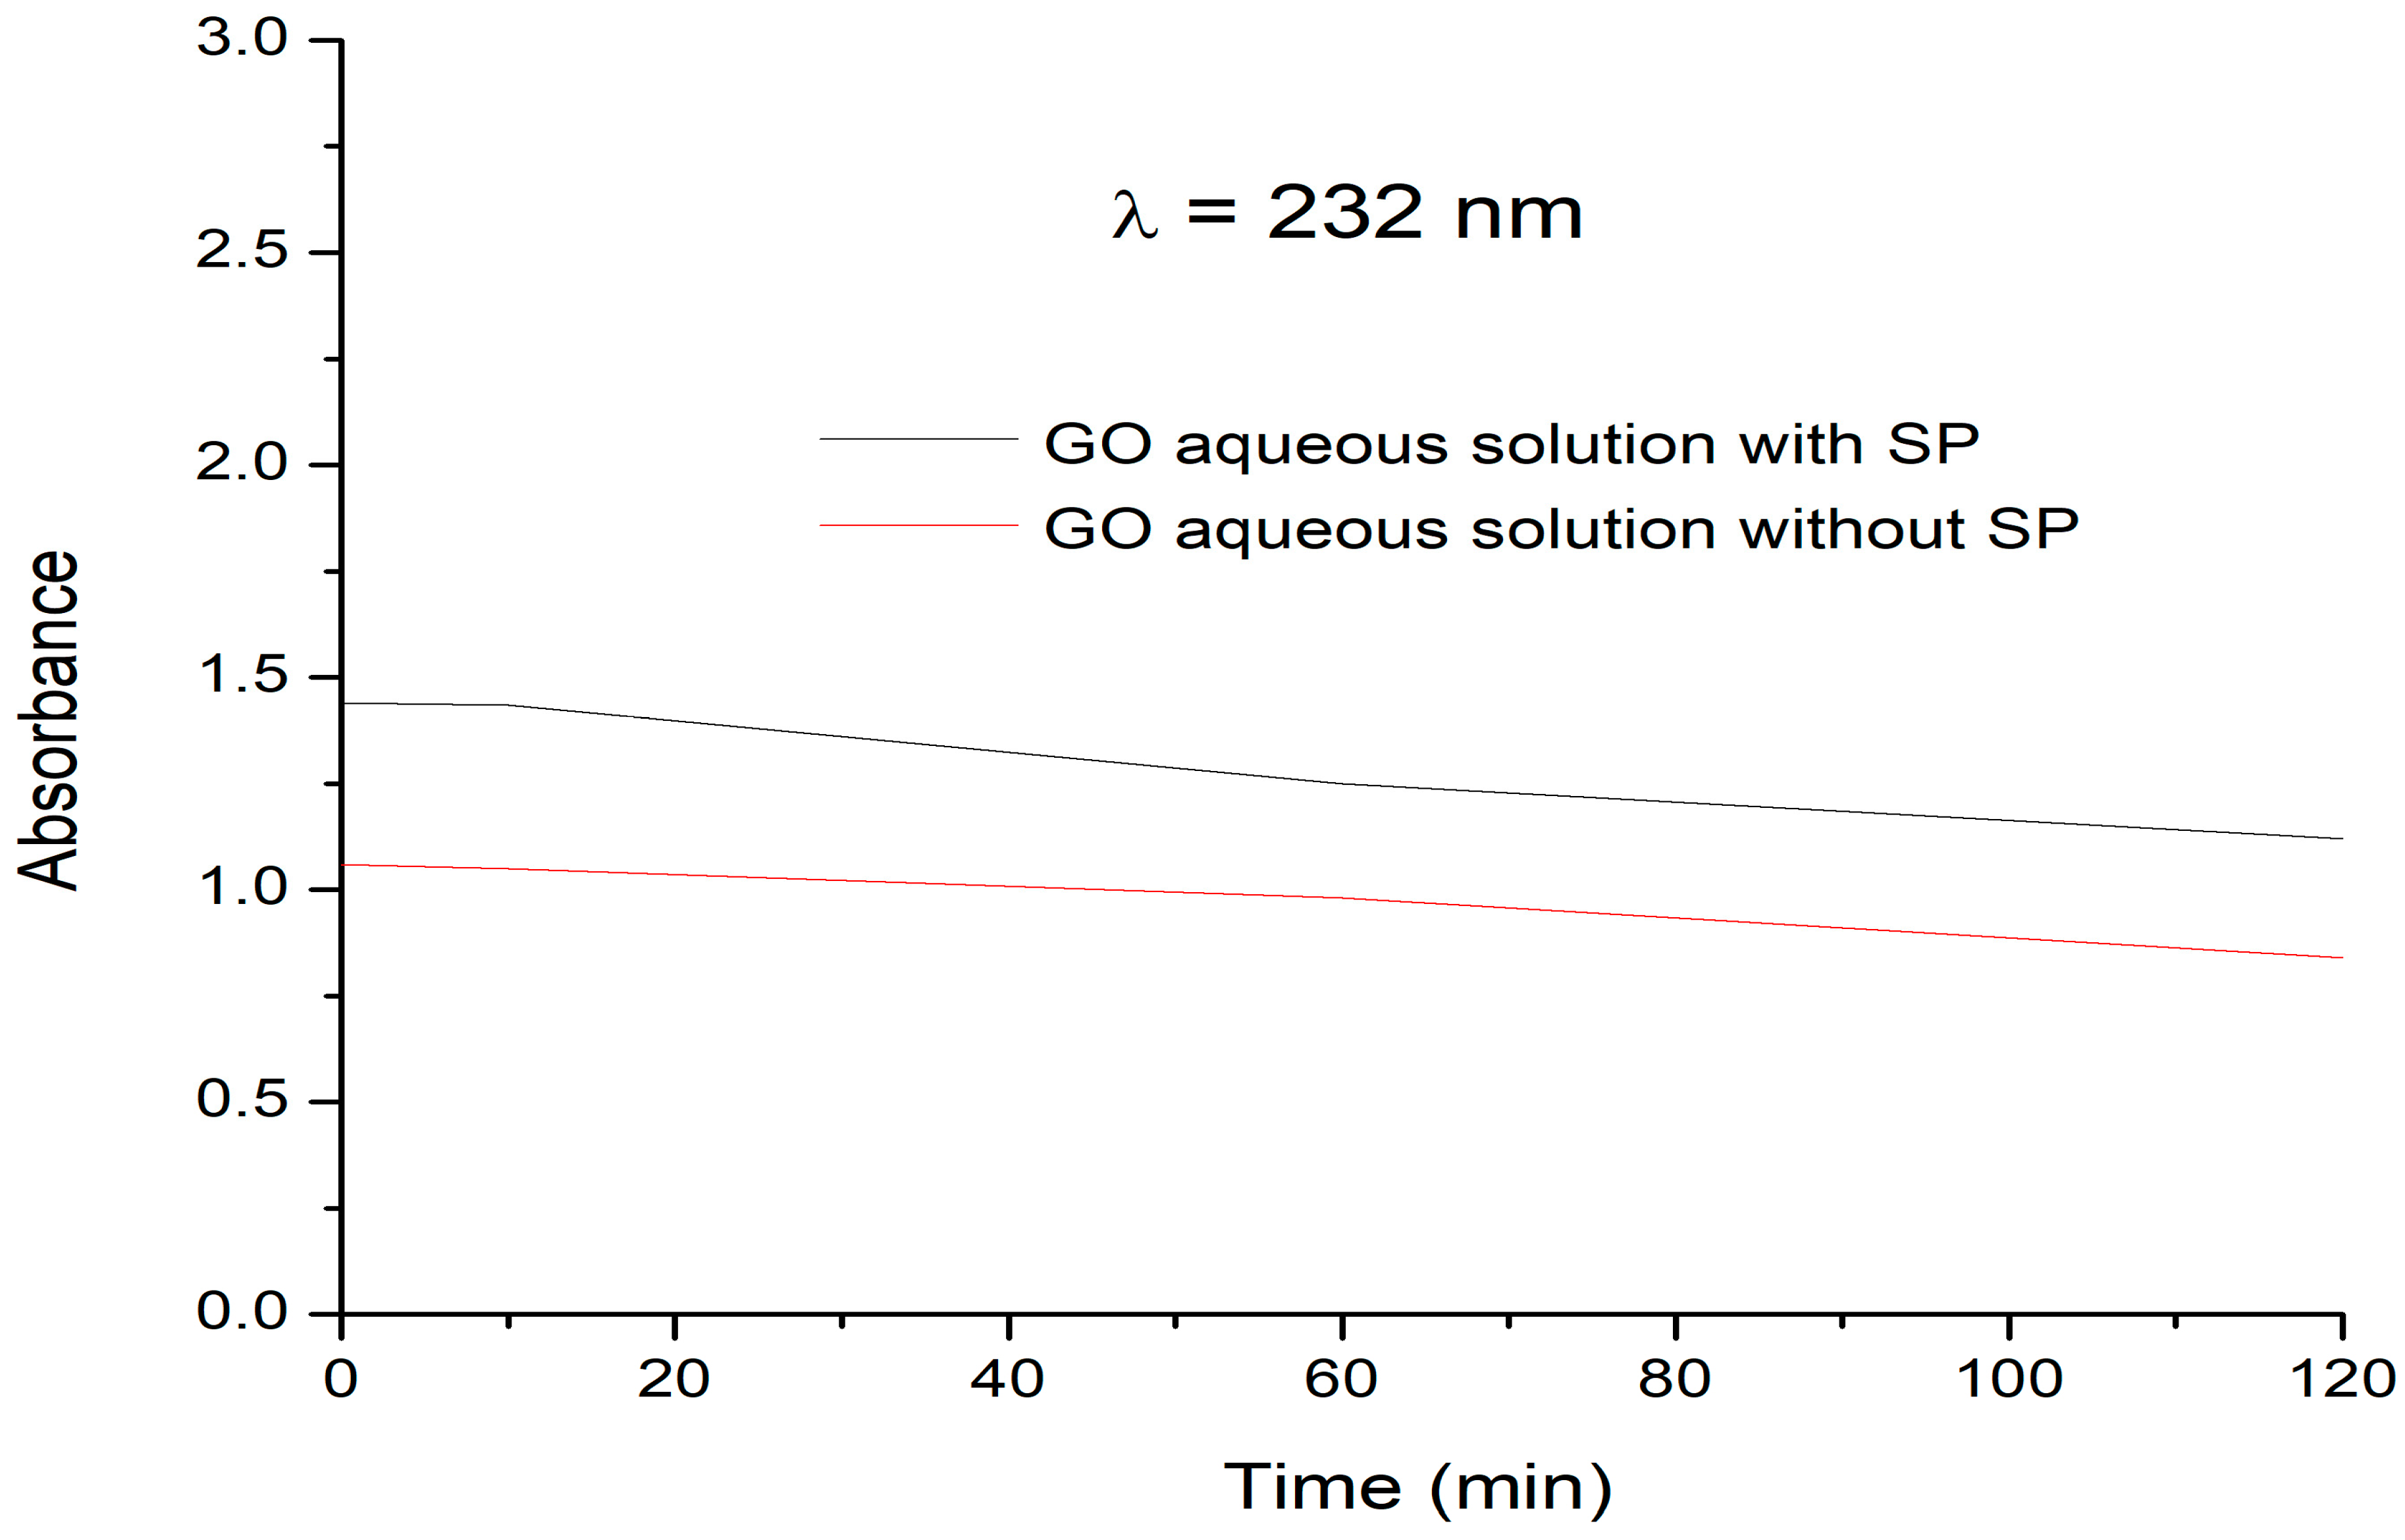
Uniform dispersion of GO sheets in cement-based composite: Due to the presence of carboxylic groups at edges of GO sheets and electrostatic repulsion, they are highly dispersible in water. Moreover, polycarboxylate superplasticizer, which acts as a surfactant, significantly affects the dispersion. We would like to mention here that from visual inspection and UV-vis spectra, it was found that the GO sheets were well dispersed in aqueous solution even after 2 h.
(b)
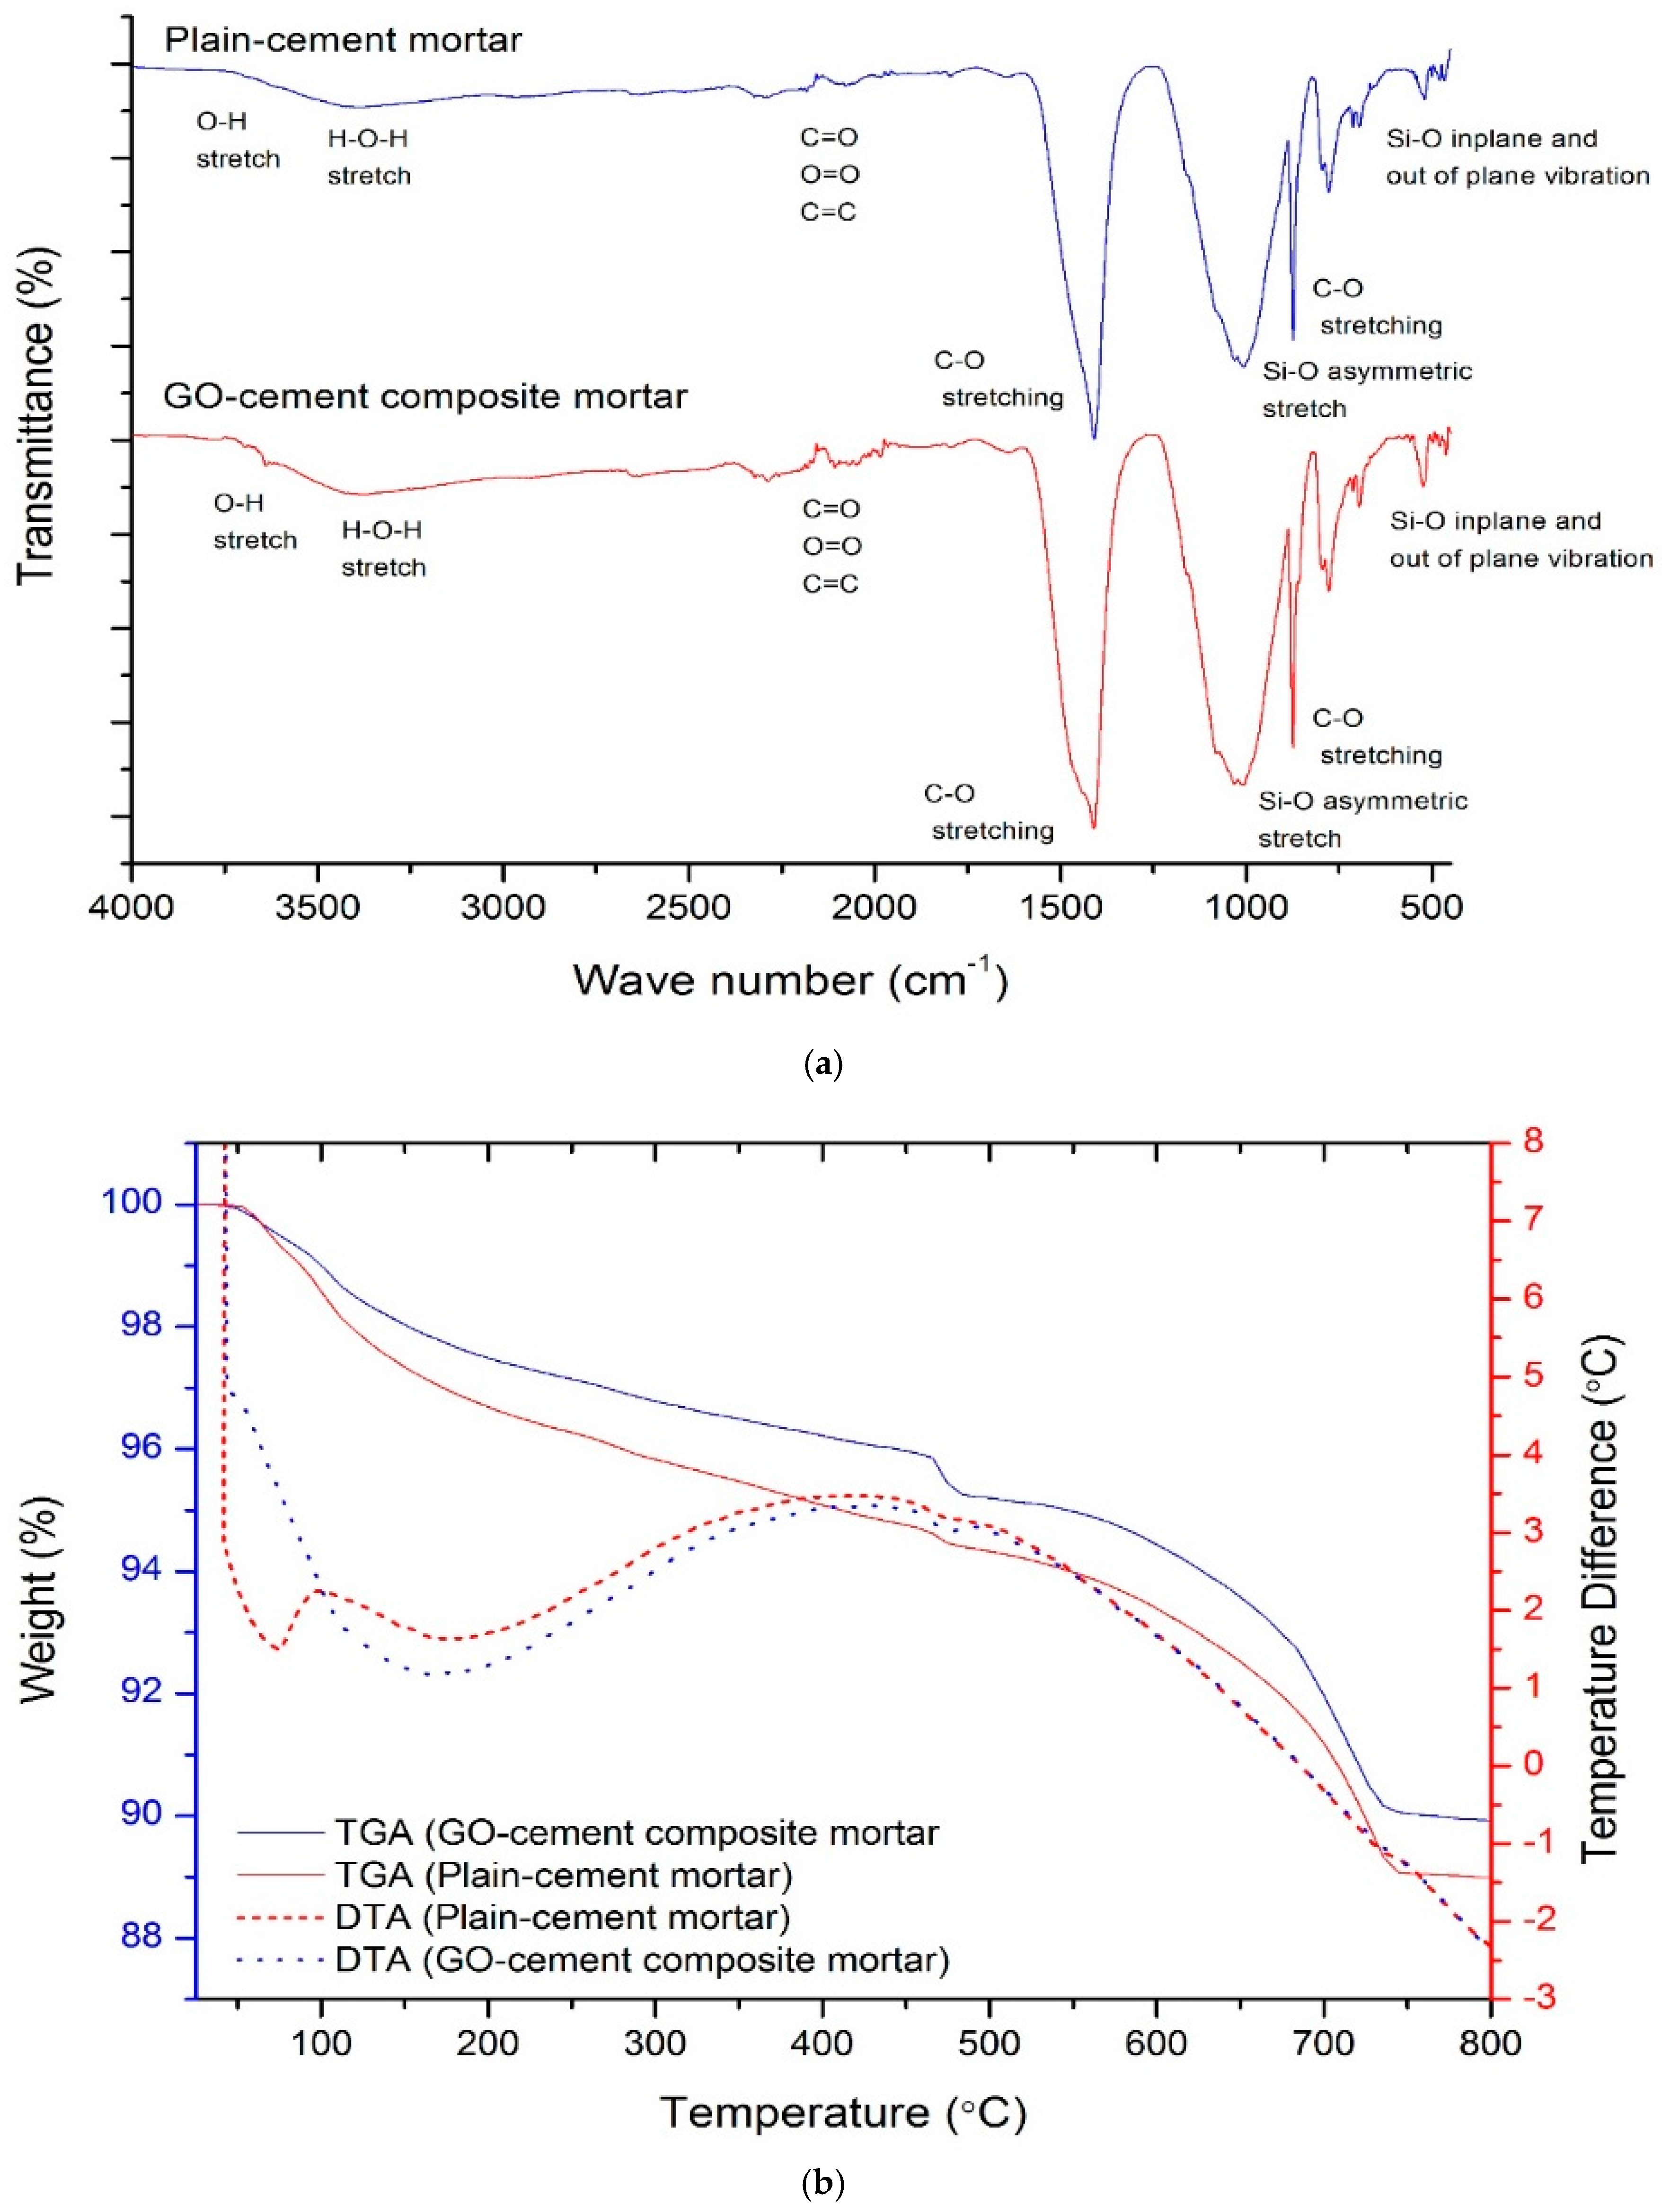
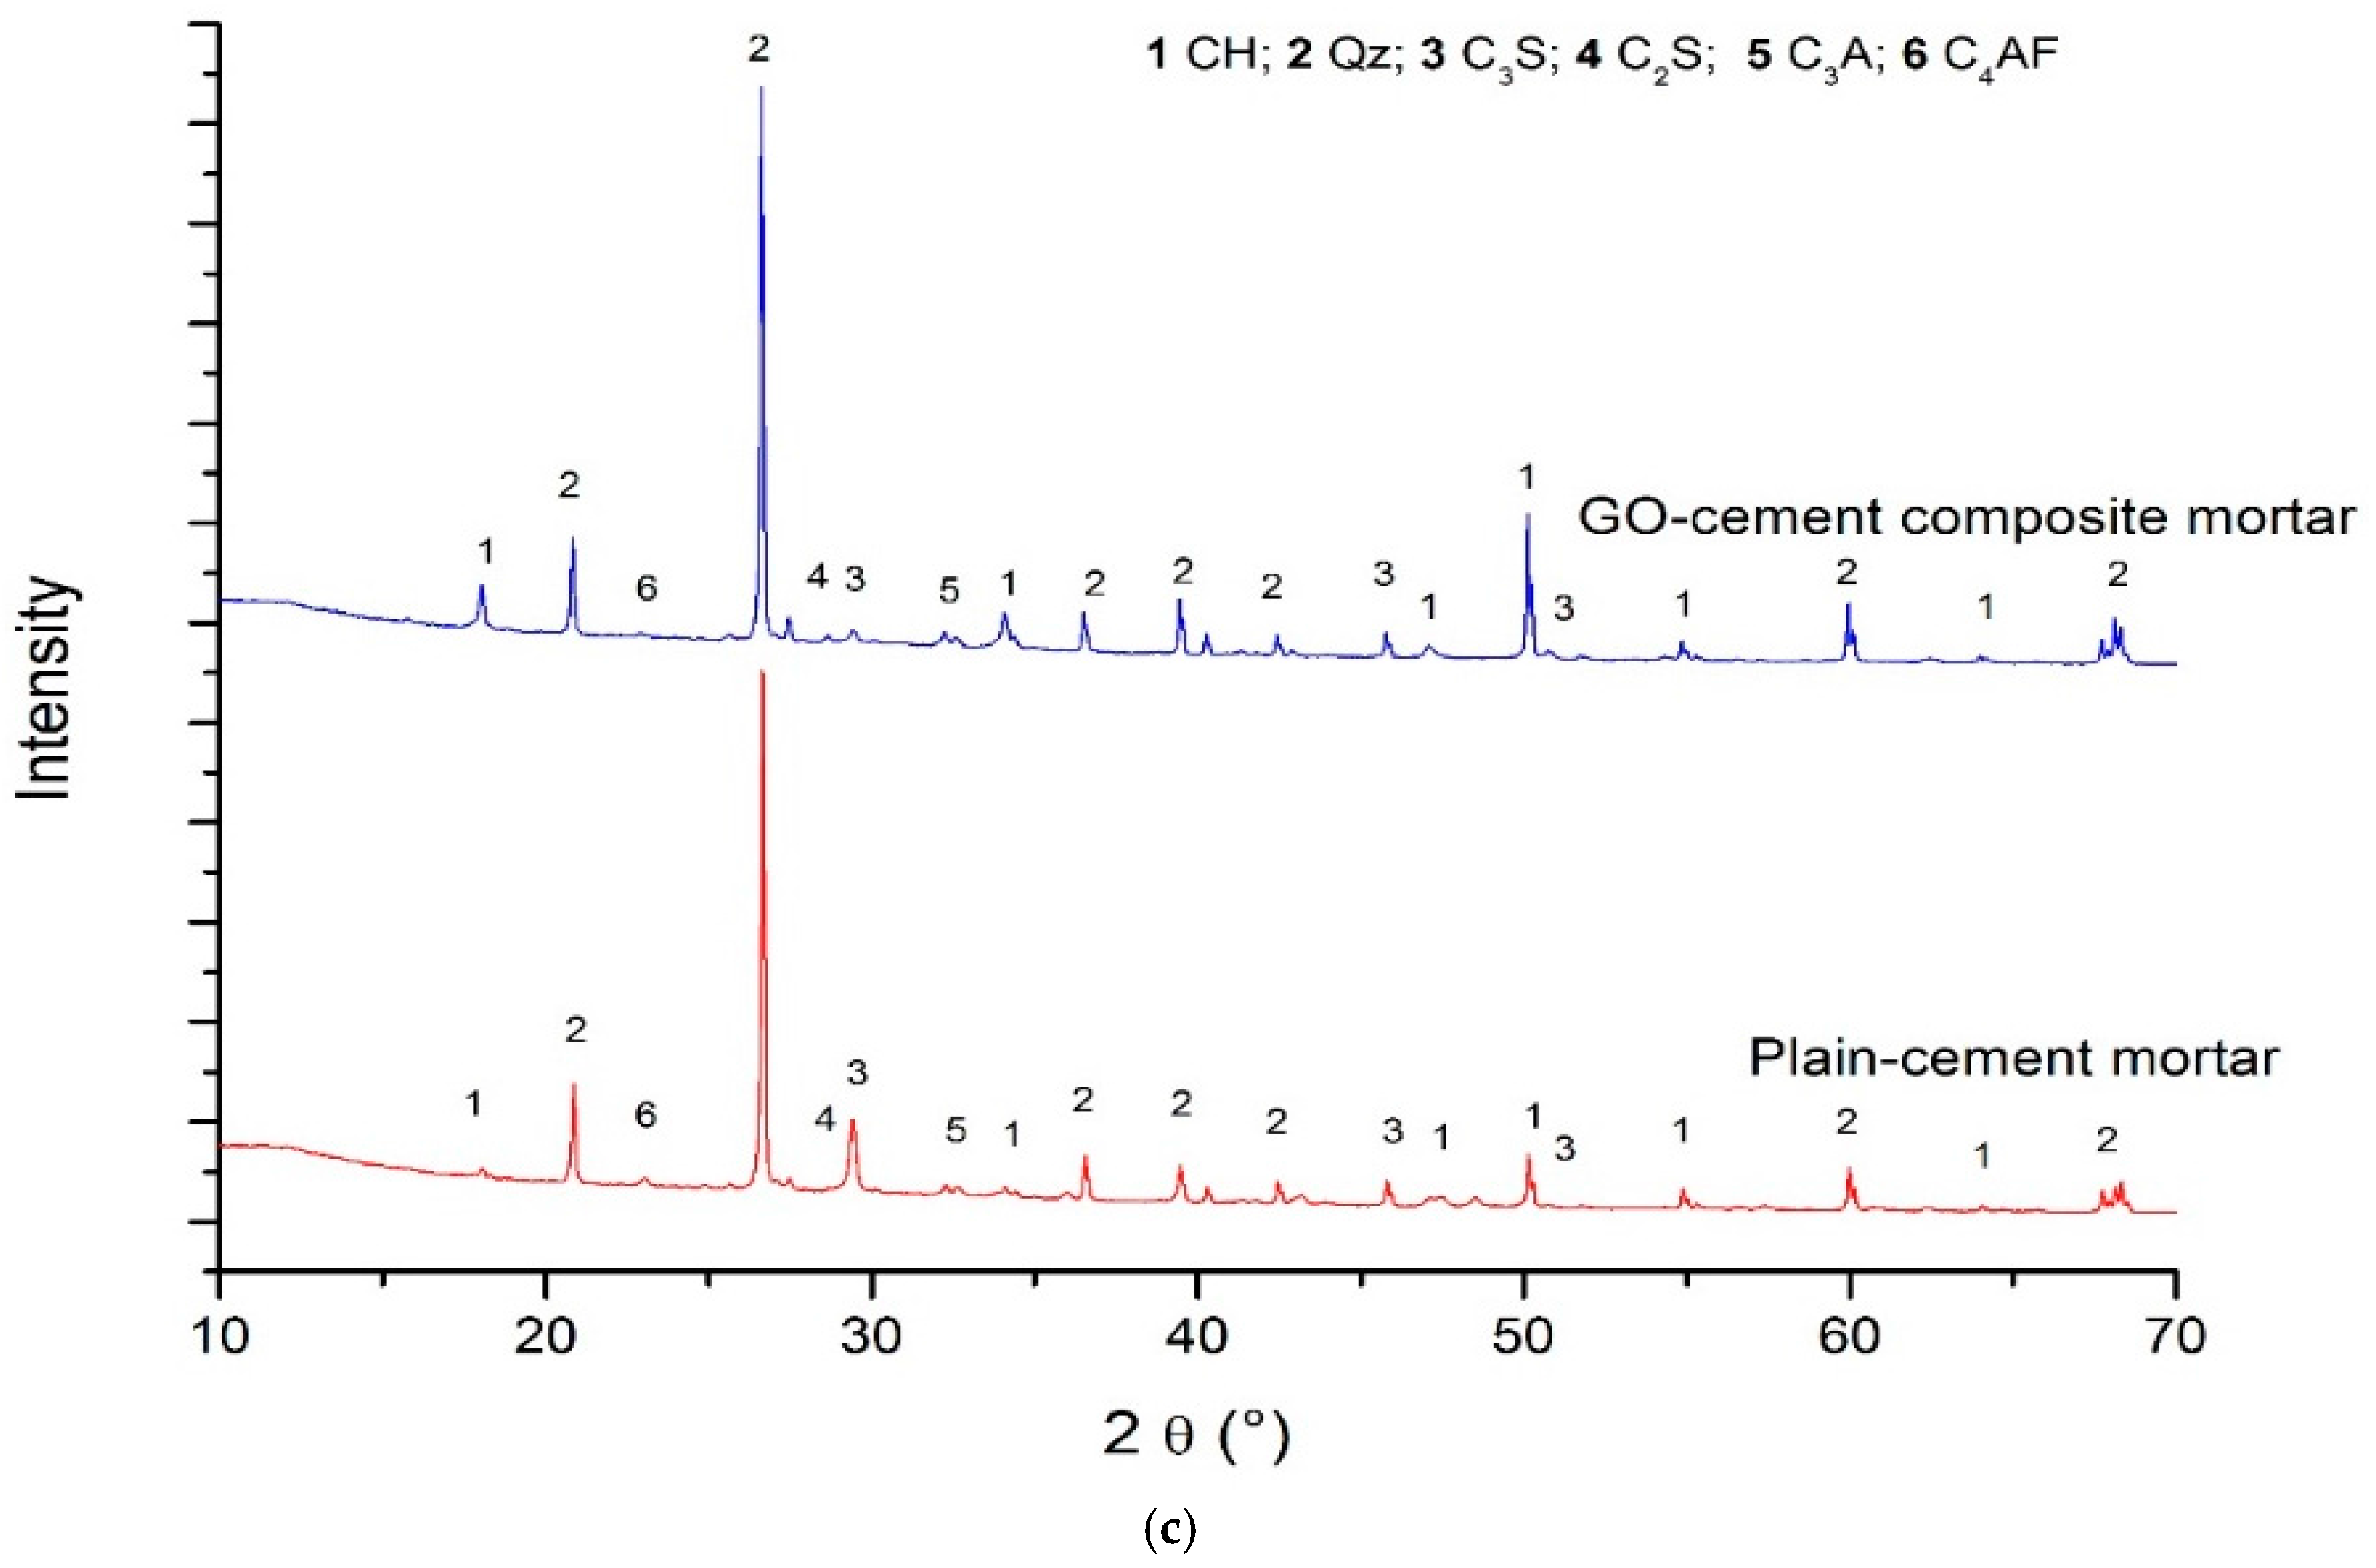
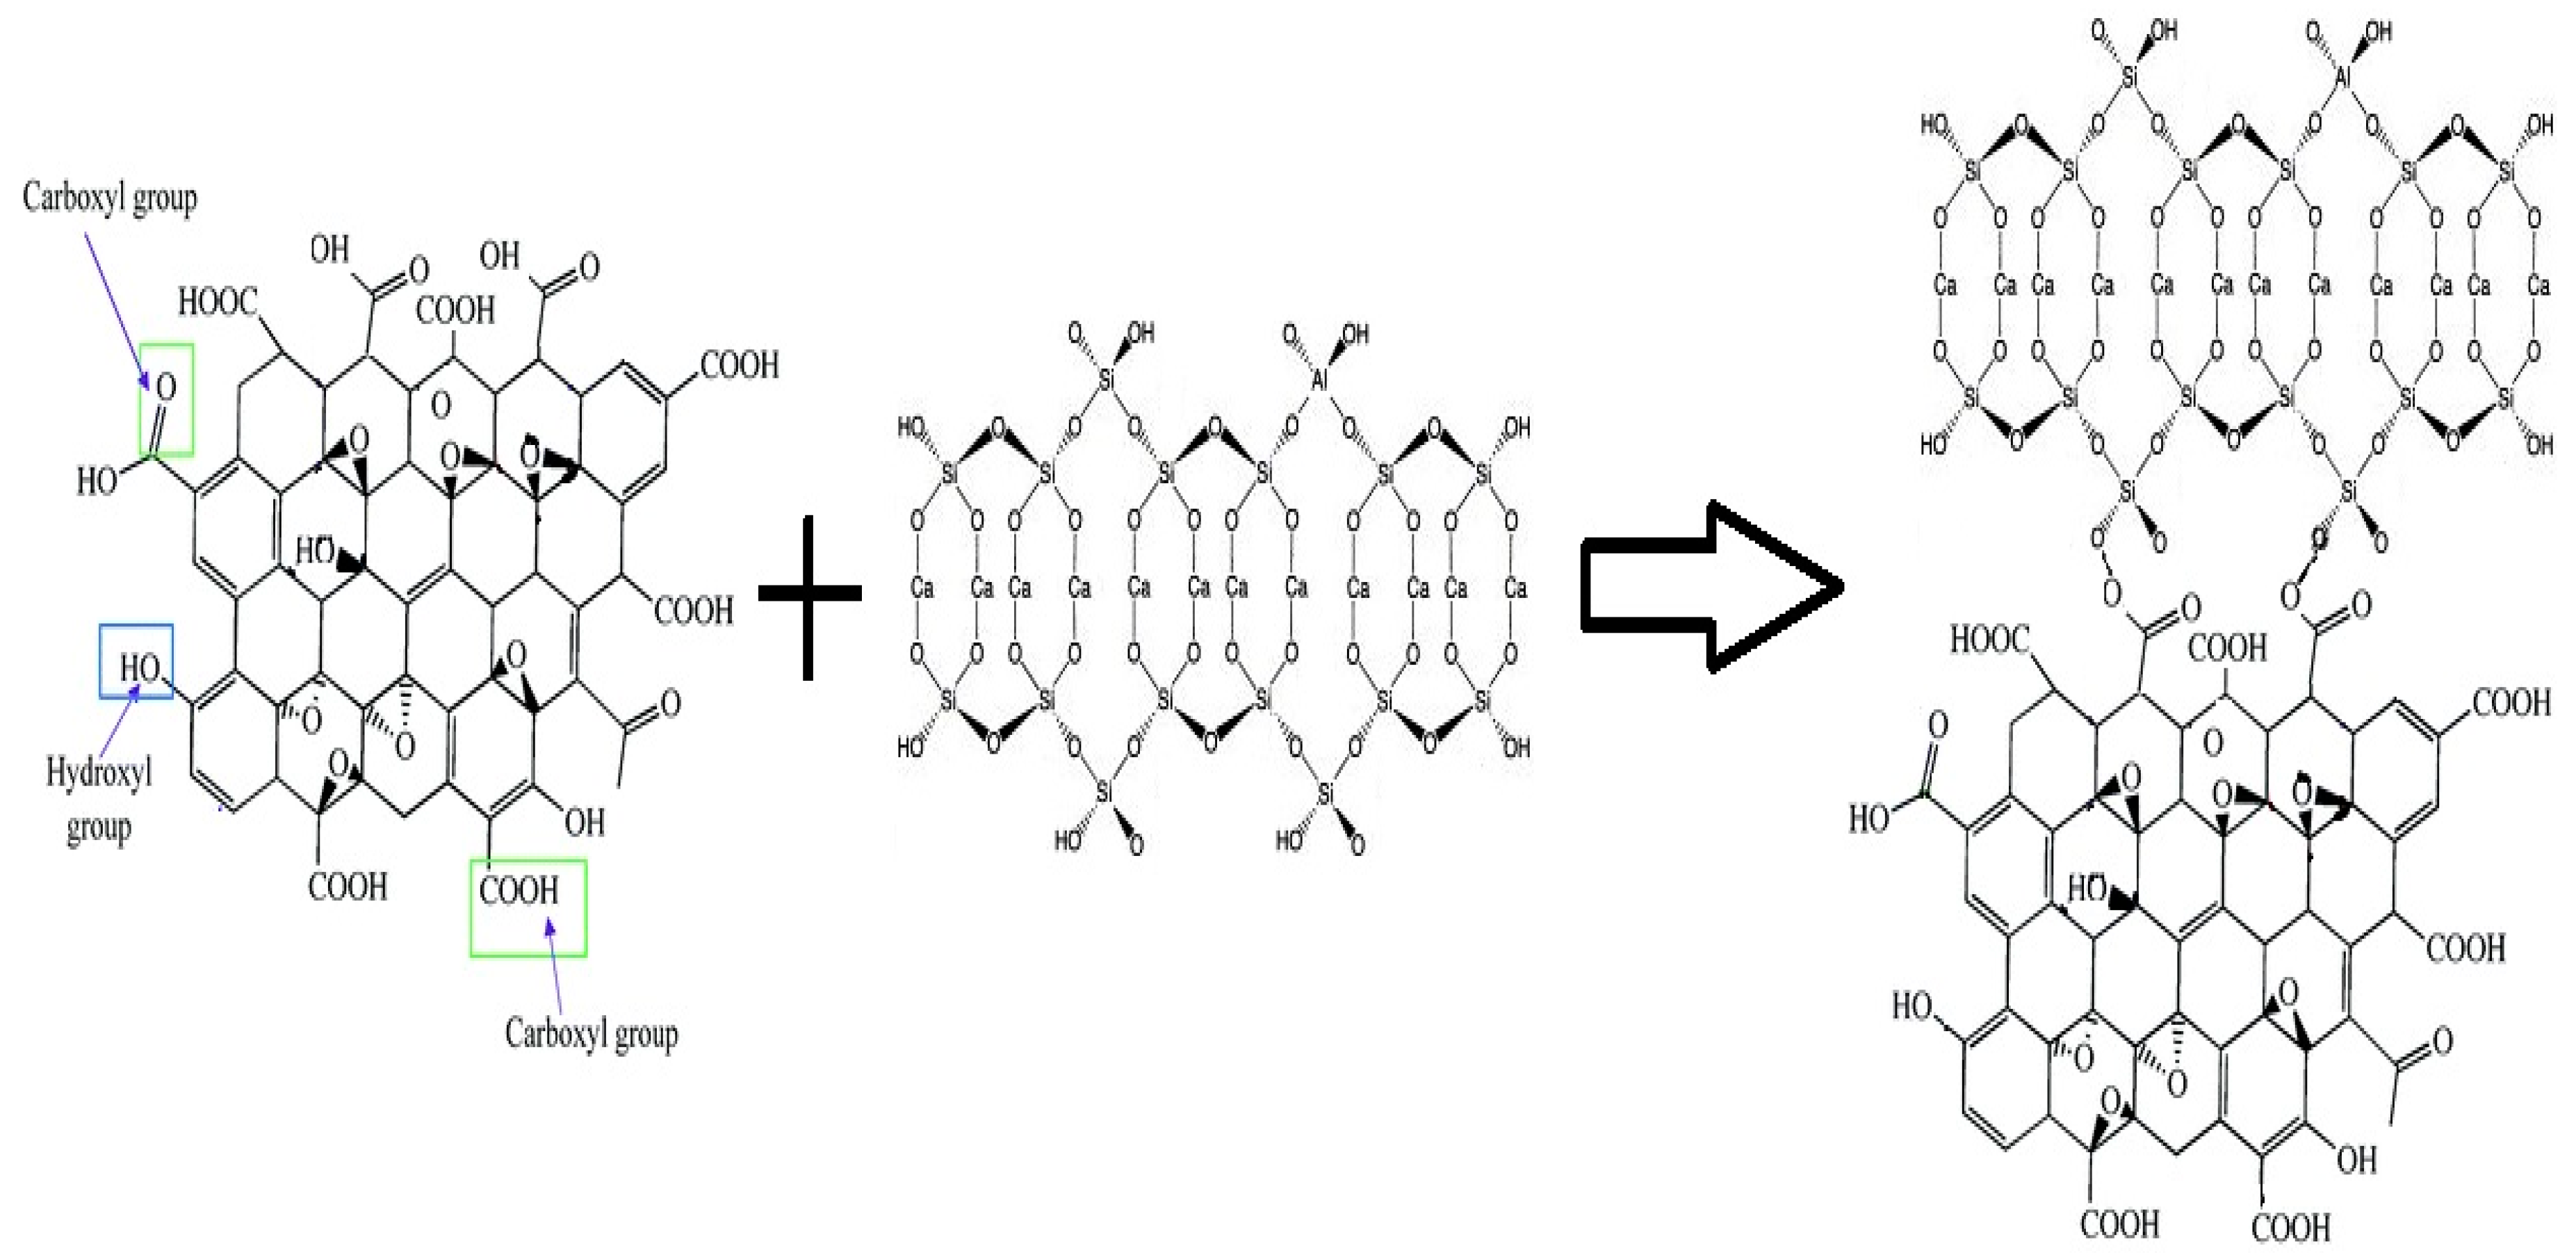
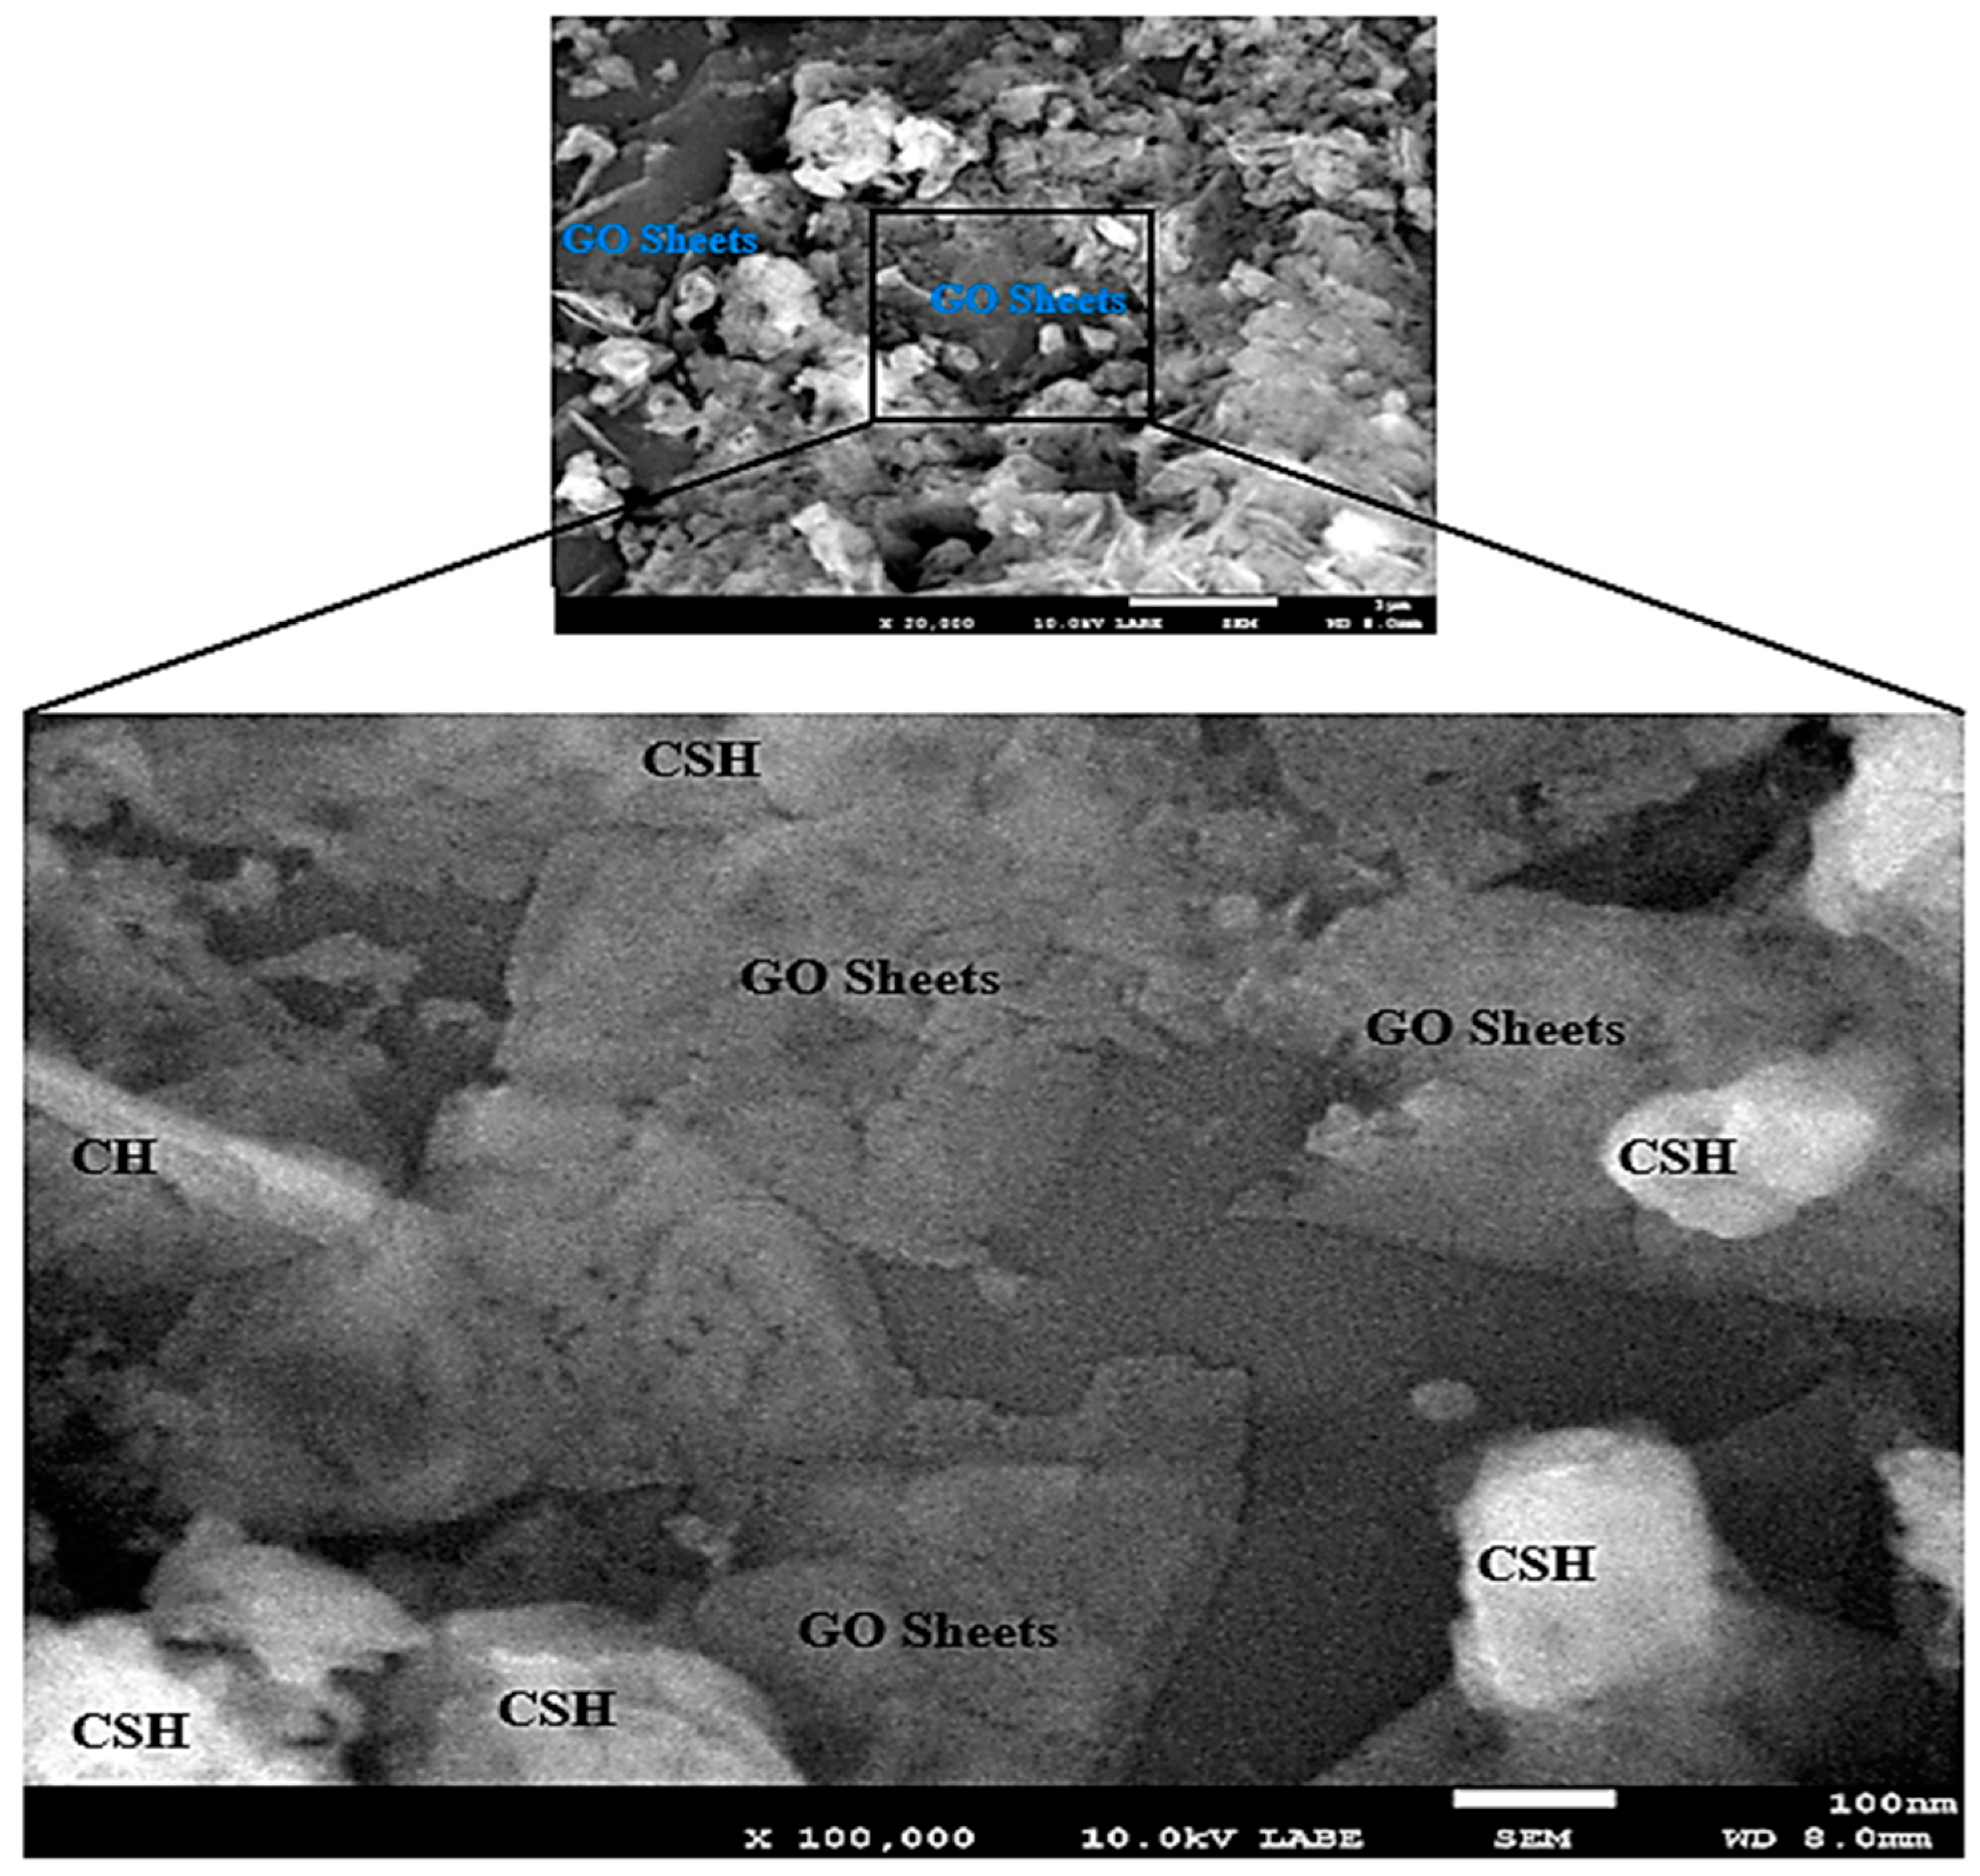
Bond formation between cement matrix and GO sheets: The increase in compressive strength of GO–cement composite could be endorsed to the strong bond between the cement matrix and GO. The surface of GO contains many oxygen functional groups –OH and –COOH, which form a strong covalent bond with C–S–H and CH [53,54]. The presence of the chemical interaction was also observed in the FTIR spectra and TGA/DTA data. The schematic of this bond formation is shown in Figure 7. Due to strong covalent bond, the load transfer efficiency of GO–cement composite enhanced and hence resulted in an increase in overall compressive strength [53]. The growth of CSH gel over GO sheets (Figure 8) also confirms the above finding.
(c)
Accelerated hydration: Table 6 shows that compressive strength of GO–cement composite mortar was more as compared with plain cement mortar, due to more amount of C–S–H and CH. Pan et al. [15] and Murugan et al. [52] found that addition of GO promotes the hydration process (early stages hydration), achieve a high degree of hydration and yields more proportion of CSH gel. This early age strength development reduces the duration of curing time and formwork can be removed earlier. Hence, making the overall project economical which in turn contributes to the sustainable use of resources.
(d)
More hydrated products were also observed as verified by FTIR, TGA and XRD data. These, in turn, reduce the volume of the pores and increase the density of cement based composite. It indicates that GO–cement composite mortar is more packed, dense and less porous as compared to plain cement mortar.
(e)
Filling and packing ability: Density of hardened mortar cube was measured using BS EN 1015-10-1999 [55]. From test results, it was found that the density of GO–cement composite enhanced by 1.43% with the addition of 0.03% GO (Table 6). As reported in the literature, the increase in density may be attributed to filling and packing ability of the GO sheets in small pores at micro level [17,56]. Moreover, this will enhance the durability of the infrastructure, subsidize the repair and maintenance activities and guide towards sustainable construction.
(f)
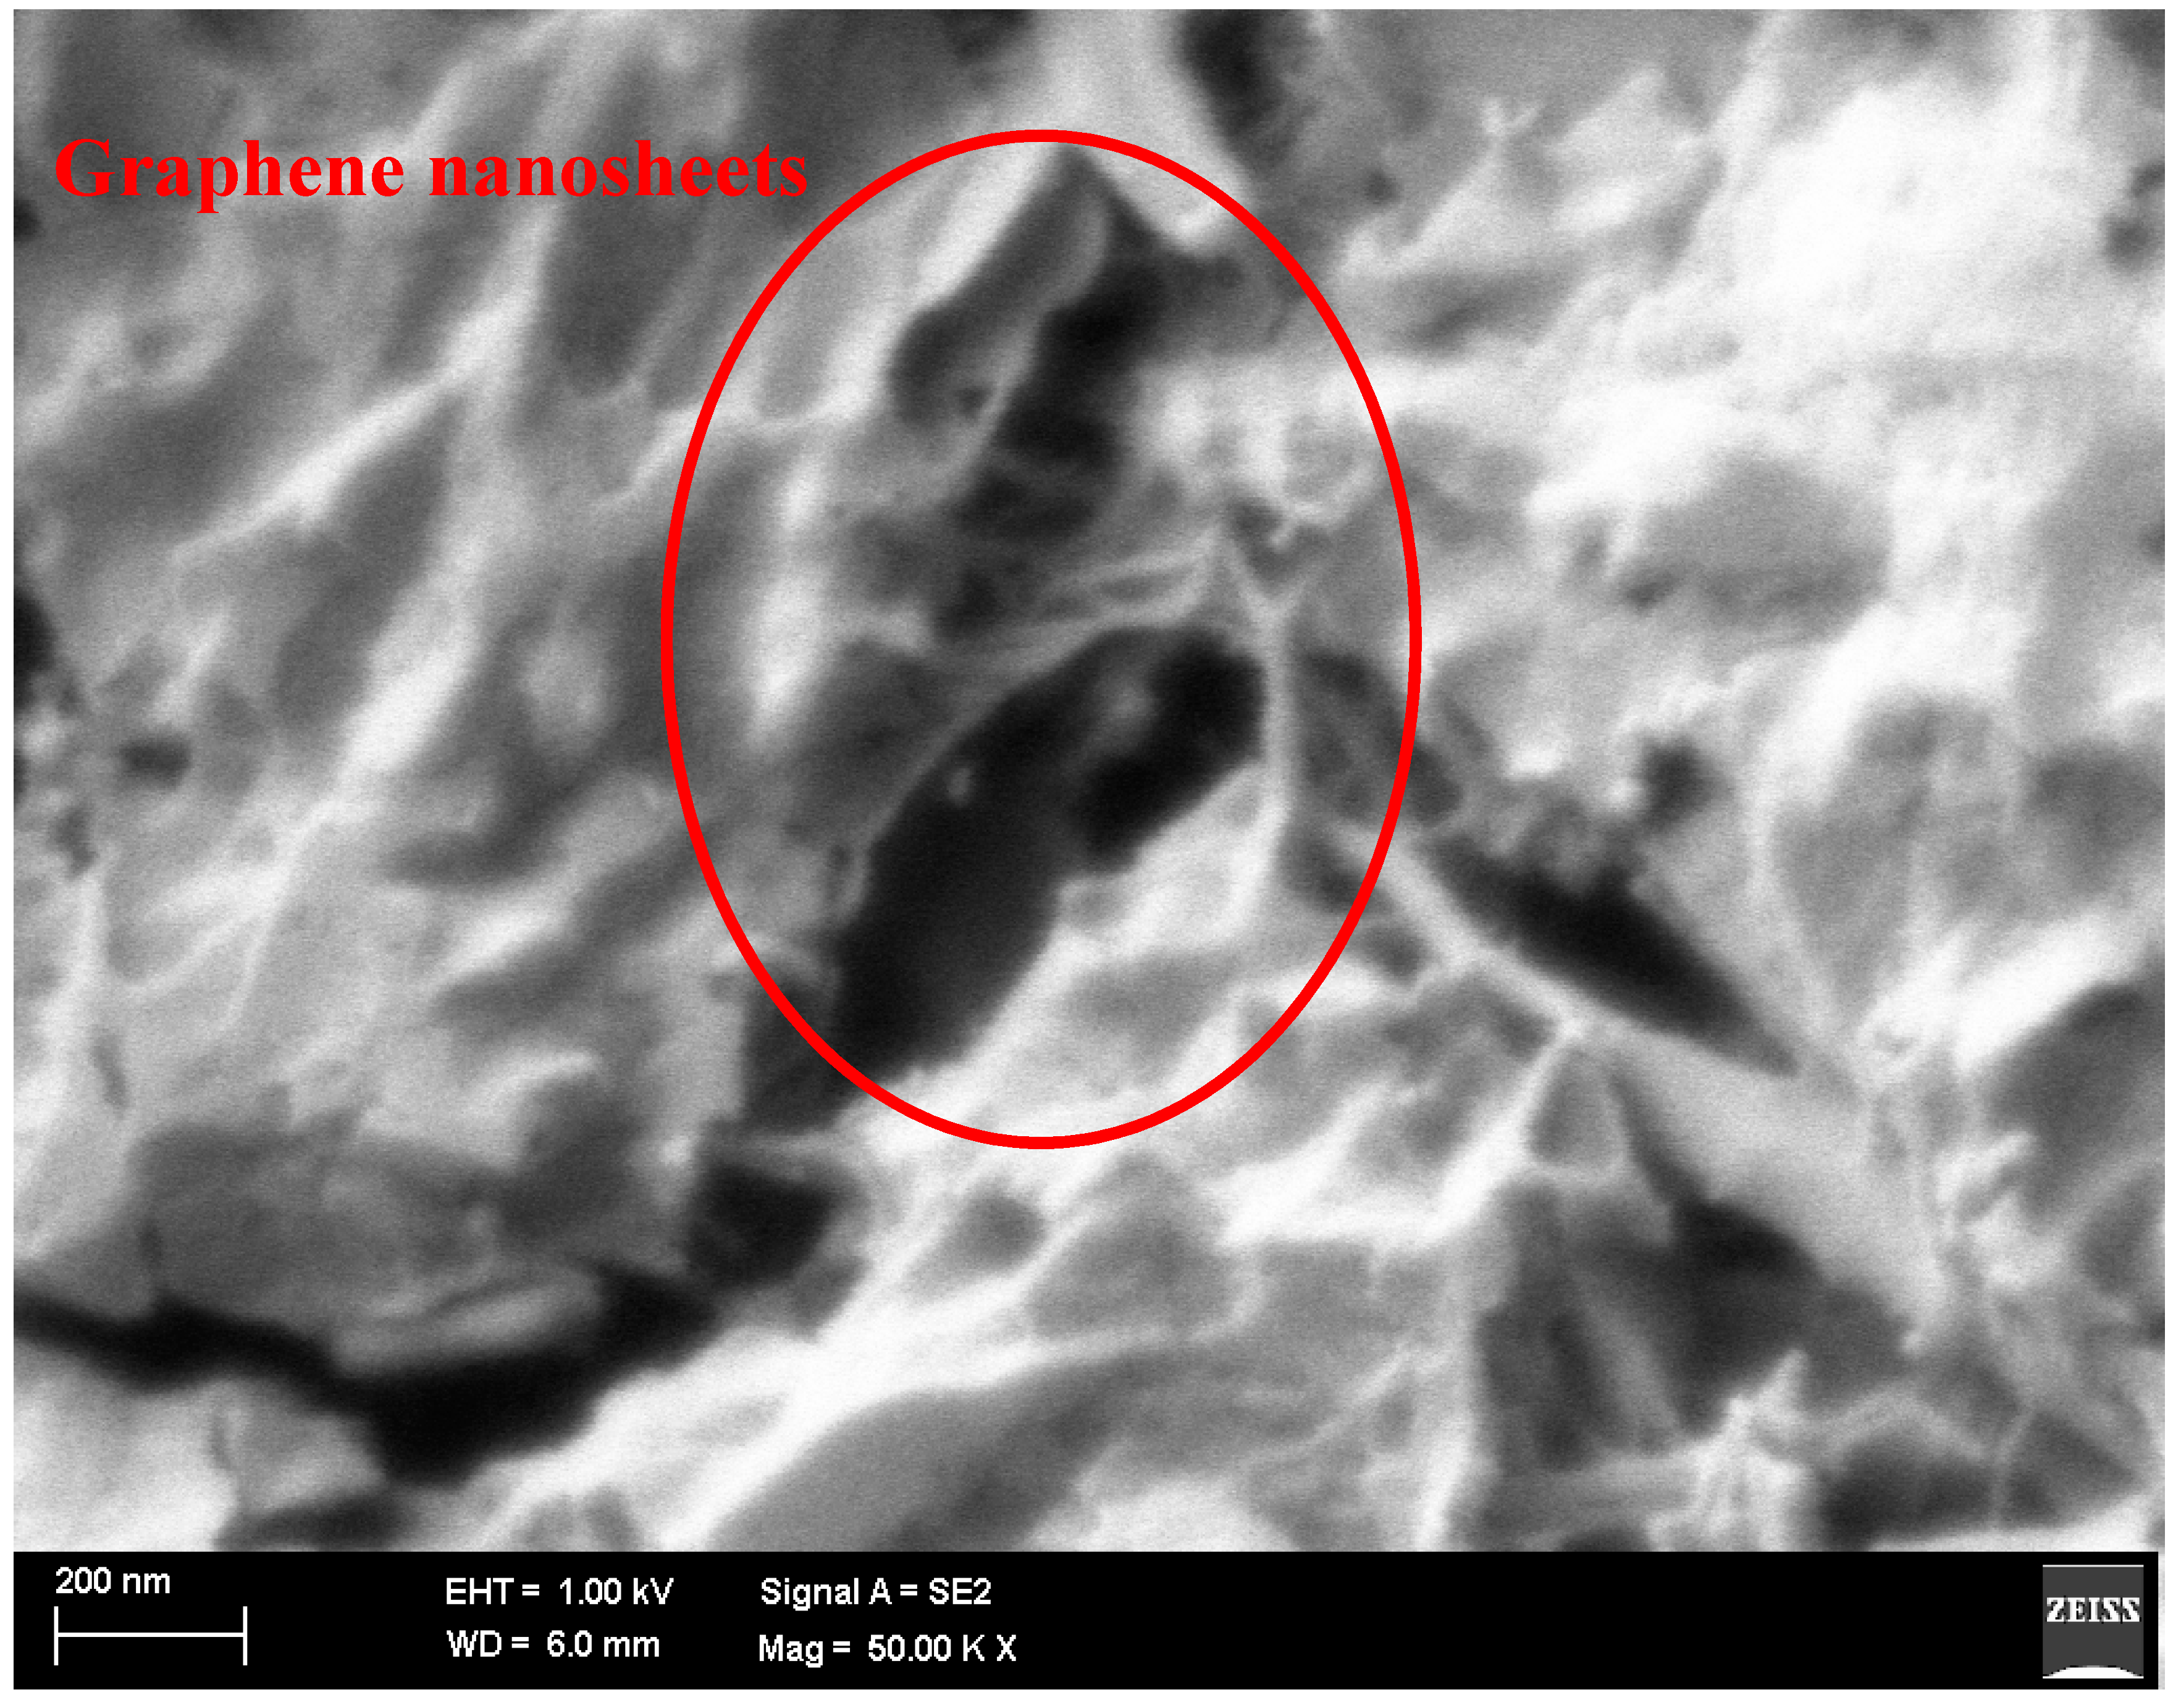
Crack arrest: Another possible reason related to the increase in compressive strength may be related to crack arrest. Since GO nanosheets have large surface area, it has the capability to capture the micro-cracks (Figure 9) and slow down the propagation of cracks [17]. The slowing down of propagation of cracks is due to the bridging provided by the nanosheets (Figure 9), which further hinder the opening up of the crack.

3.7. Electrical Properties of Cement Based Composites

Electrical properties of composite material were investigated by using four-probe method. Electrical resistivity values were used to calculate the fraction change in resistance. Figure 10 presents the fractional change in resistance (in percentage) for cement based composites. These results were further compared with the two literature studies [57,58]. Li et al. [57] investigated the self-monitoring capability of control specimen and cement mortar containing nano Fe2O3. The authors found that the control sample was poor in monitoring its own stress whereas, nano- Fe2O3 cement mortar was found to be more sensitive to monitor stress. They observed that fractional change in resistance is the key factor for self-sensing instead of resistivity itself. Li et al. [58] investigated the strain sensing characteristics of carbon black filled cement composite. They observed the linear relationship between the fractional change in resistivity and compressive strain. It is important to mention here that FCR curve was considered after 20% of normalizing compressive loading. It was done primarily to avoid the response of shrinkage, tensile and elastic cracks. It can be seen in Figure 10 that the control cement mix as determined by Li et al. [57] showed a very low fractional change in resistance. However, the addition of 3% nano Fe2O3 and 15% of Carbon Black (CB) provided a more fractional change in resistance, i.e., strain sensing characteristics. It can be seen that, due to high electrical transport characteristics of graphene, GO–cement composite sample in a better way correlates the FCR values with NCL at each point. Moreover, the quantity of graphene oxide was extremely small, i.e., 0.03% as compared with 3% and 15% of other nanomaterials. It is pertinent to mention here that a comparable finding was reported about the higher sensitivity of cement mortar with graphene nanoplatelets on the strain-sensing capability by Dai et al. [59]. They authors concluded that piezoresistivity characteristics increases with the increasing amount of graphene nanoplatelets. For the same strain, the measured value of FCR was found to be larger with increasing graphene content. These self-sensing characteristics of GO based cement composites will save huge amount of budget and stimulate sustainable use of financial resources.

4. Conclusions

This research was focused on the development of composite building material, which will boost the construction sustainability. In this study, graphene oxide nanosheets were prepared by chemical oxidation of natural graphite and then its effect was investigated on the cement matrix. EDS data confirmed the presence of oxygen moieties. From XRD analysis, the increase in interlayer spacing confirmed that oxygen functional groups penetrated in between the graphite layers. The broadening of G band in Raman spectroscopy showed that extensive oxidation has occurred. FTIR results confirmed the presence of carboxyl group, epoxy group, hydroxyl group and alkoxy group on GO nanosheets. From the UV-vis data, it was confirmed that GO sheets in the presence of superplasticizer were stable and remained in suspended form in aqueous solution even after 120 min. Rheological results confirmed that GO sheets influenced the flow behavior of the paste and increased the resistance to the flow of the paste. Test results of incorporation of GO in cement composite suggested that the bond between cement matrix and GO exist. From TGA, the GO–cement composite showed less weight loss indicating the thermal stability of composite mix. The gravimetric changes due to dehydration of Ca(OH)2 and decarbonation of CaCO3 suggested that more hydration occurred by incorporation of GO sheets. XRD results also specified that more hydration occurred by incorporation of GO sheets. With the addition of 0.03% GO, the increase in compressive strength was found to be 27% while the increase in density was noted as 1.43%. The higher degree of hydration, strong bond between GO nanosheets and cement matrix, packing, filling ability and bridging effect of GO nanosheets were suggested as the possible reasons for strength enhancement of GO–cement composite. From the results of fractional change in resistance, it can be concluded that GO–cement composite possesses self-sensing characteristics and can detect damages in specimen
Based on above findings, it can be concluded that graphene oxide sheets are a potential nano-reinforcement candidate for a cement based composite that is a stronger, greener and environmentally friendly concrete.

Acknowledgments

This research was supported by University Malaya Research Grant (UMRG-Project No. RP004A/13AET), University Malaya Postgraduate Research Fund (PPP-Project No. PG217–2014B) and Fundamental Research Grant Scheme, Ministry of Education, Malaysia (FRGS-Project No. FP004–2014B).

Author Contributions

Sardar Kashif Ur Rehman and Zainah Ibrahim conceived and designed the experiments; Sardar Kashif Ur Rehman, Md. Toasin Hossain Aunkor and Muhammad Faisal Javed performed the experiments; Sardar Kashif Ur Rehman, Shazim Ali Memon, Syed Mustafa Ali Shah and Kashif Mehmood analyzed the data; Zainah Ibrahim and Syed Mustafa Ali Shah contributed reagents/materials/analysis tools; and Sardar Kashif Ur Rehman, Shazim Ali Memon and Muhammad Faisal Javed wrote the paper.

Conflicts of Interest

The authors declare no conflict of interest.

References

  1. Barcelo, L.; Kline, J.; Walenta, G.; Gartner, E. Cement and carbon emissions. Mater. Struct. 2014, 47, 1055–1065. [Google Scholar] [CrossRef]
  2. Rehman, S.K.U.; Ibrahim, Z.; Memon, S.A.; Jameel, M. Nondestructive test methods for concrete bridges: A review. Constr. Build. Mater. 2016, 107, 58–86. [Google Scholar] [CrossRef]
  3. Herrmann, A.W. ASCE 2013 Report Card for America’s Infrastructure. Int. Assoc. Bridge Struct. Eng. 2013, 99, 9–10. [Google Scholar] [CrossRef]
  4. Lee, C.; Wei, X.; Kysar, J.W.; Hone, J. Measurement of the elastic properties and intrinsic strength of monolayer graphene. Science 2008, 321, 385–388. [Google Scholar] [CrossRef] [PubMed]
  5. Yang, H.; Cui, H.; Tang, W.; Li, Z.; Han, N.; Xing, F. A critical review on research progress of graphene/cement based composites. Compos. Part A Appl. Sci. Manuf. 2017, 102, 273–296. [Google Scholar] [CrossRef]
  6. Rehman, S.K.U.; Ibrahim, Z.; Javed, M.F.; Hanif, M.U. Piezo-resistive characteristics of graphene-based cement materials. In Proceedings of the 24th International Congress on Sound and Vibration (ICSV 24), London, UK, 23–27 July 2017. [Google Scholar]
  7. Rehman, S.K.U.; Ibrahim, Z.; Memon, S.A.; Javed, M.F.; Khushnood, R.A. A sustainable graphene based cement composite. Sustainability 2017, 9, 1229. [Google Scholar] [CrossRef]
  8. Javed, M.F.; Hafizah, N.; Memon, S.A.; Jameel, M.; Aslam, M. Recent research on cold-formed steel beams and columns subjected to elevated temperature: A review. Constr. Build. Mater. 2017, 144, 686–701. [Google Scholar] [CrossRef]
  9. Sixuan, H. Multifunctional Graphite Nanoplatelets (GNP) Reinforced Cementitious Composites. Master’s Theses, National University of Singapore, Singapore, Singapore, 2012. [Google Scholar]
  10. Du, H.; Sze, D.P. Enhancement of barrier properties of cement mortar with graphene nanoplatelet. Cem. Concr. Res. 2015, 76, 10–19. [Google Scholar] [CrossRef]
  11. Du, H.; Gao, H.J.; Sze, D.P. Improvement in concrete resistance against water and chloride ingress by adding graphene nanoplatelet. Cem. Concr. Res. 2016, 83, 114–123. [Google Scholar] [CrossRef]
  12. Wilson, N.R.; Pandey, P.A.; Beanland, R.; Young, R.J.; Kinloch, I.A.; Gong, L.; Liu, Z.; Suenaga, K.; Rourke, J.P.; York, S.J. Graphene oxide: structural analysis and application as a highly transparent support for electron microscopy. ACS Nano 2009, 3, 2547–2556. [Google Scholar] [CrossRef] [PubMed]
  13. Lv, S.; Ma, Y.; Qiu, C.; Sun, T.; Liu, J.; Zhou, Q. Effect of graphene oxide nanosheets of microstructure and mechanical properties of cement composites. Constr. Build. Mater. 2013, 49, 121–127. [Google Scholar] [CrossRef]
  14. Tong, T.; Fan, Z.; Liu, Q.; Wang, S.; Tan, S.; Yu, Q. Investigation of the effects of graphene and graphene oxide nanoplatelets on the micro- and macro-properties of cementitious materials. Constr. Build. Mater. 2016, 106, 102–114. [Google Scholar] [CrossRef]
  15. Pan, Z.; He, L.; Qiu, L.; Korayem, A.H.; Li, G.; Zhu, J.W.; Collins, F.; Li, D.; Duan, W.H.; Wang, M.C. Mechanical properties and microstructure of a graphene oxide-cement composite. Cem. Concr. Compos. 2015, 58, 140–147. [Google Scholar] [CrossRef]
  16. Mohammed, A.; Sanjayan, J.G.; Duan, W.H.; Nazari, A. Incorporating graphene oxide in cement composites: A study of transport properties. Constr. Build. Mater. 2015, 84, 341–347. [Google Scholar] [CrossRef]
  17. Chuah, S.; Pan, Z.; Sanjayan, J.G.; Wang, C.M.; Duan, W.H. Nano reinforced cement and concrete composites and new perspective from graphene oxide. Constr. Build. Mater. 2014, 73, 113–124. [Google Scholar] [CrossRef]
  18. Rehman, S.K.U.; Ibrahim, Z.; Javed, M.F.; Hanif, M.U.; Ghaedi, K. Self-sensing carbon based cement composite material. In Proceedings of the 2nd International Conference on Advances in Engineering and Technology (RTET-2017), Penang, Malaysia, 9–10 February 2017. [Google Scholar]
  19. Zhao, H.; Bai, J. Highly sensitive piezo-resistive graphite nanoplatelet-carbon nanotube hybrids/polydimethylsilicone composites with improved conductive network construction. ACS Appl. Mater. Interfaces 2015, 7, 9652–9659. [Google Scholar] [CrossRef] [PubMed]
  20. Chen, J.; Yao, B.; Li, C.; Shi, G. An improved Hummers method for eco-friendly synthesis of graphene oxide. Carbon 2013, 64, 225–229. [Google Scholar] [CrossRef]
  21. Aunkor, M.; Mahbubul, I.; Saidur, R.; Metselaar, H.S.C. Deoxygenation of graphene oxide using household baking soda as a reducing agent: A green approach. RSC Adv. 2015, 5, 70461–70472. [Google Scholar] [CrossRef]
  22. Roussel, N.; Ovarlez, G.; Garrault, S.; Brumaud, C. The origins of thixotropy of fresh cement pastes. Cem. Concr. Res. 2012, 42, 148–157. [Google Scholar] [CrossRef]
  23. Tattersall, G.H.; Banfill, P. The Rheology of Fresh Concrete; Pitman: London, UK, 1983; Volume 356. [Google Scholar]
  24. American Society for Testing and Materials. Standard Test Method for Flow of Hydraulic Cement Mortar; C1437-15; ASTM International: West Conshohocken, PA, USA, 2015. [Google Scholar]
  25. American Society for Testing and Materials. Standard Test Method for Compressive Strength of Hydraulic Cement Mortars (Using 2-in. or [50-mm] Cube Specimens); ASTM C 109; ASTM International: Philadelphia, PA, USA, 1999; Volume 318. [Google Scholar]
  26. Valdes, L.B. Resistivity measurements on germanium for transistors. Proc. IRE 1954, 42, 420–427. [Google Scholar] [CrossRef]
  27. Aunkor, M.; Mahbubul, I.; Saidur, R.; Metselaar, H. The green reduction of graphene oxide. Rsc Adv. 2016, 6, 27807–27828. [Google Scholar] [CrossRef]
  28. Fan, Z.-J.; Kai, W.; Yan, J.; Wei, T.; Zhi, L.-J.; Feng, J.; Ren, Y.-M.; Song, L.-P.; Wei, F. Facile synthesis of graphene nanosheets via Fe reduction of exfoliated graphite oxide. ACS Nano 2010, 5, 191–198. [Google Scholar] [CrossRef] [PubMed]
  29. Amarnath, C.A.H.; Chang, E.K.; Ku, N.H.; Kuila, B.; Lee, T.; Hee, J. Efficient synthesis of graphene sheets using pyrrole as a reducing agent. Carbon 2011, 49, 3497–3502. [Google Scholar] [CrossRef]
  30. Stankovich, S.; Dikin, D.A.; Piner, R.D.; Kohlhaas, K.A.; Kleinhammes, A.; Jia, Y.; Wu, Y.; Nguyen, S.T.; Ruoff, R.S. Synthesis of graphene-based nanosheets via chemical reduction of exfoliated graphite oxide. Carbon 2007, 45, 1558–1565. [Google Scholar] [CrossRef]
  31. Li, C.; Wang, X.; Liu, Y.; Wang, W.; Wynn, J.; Gao, J. Using glucosamine as a reductant to prepare reduced graphene oxide and its nanocomposites with metal nanoparticles. J. Nanopart. Res. 2012, 14, 1–11. [Google Scholar] [CrossRef]
  32. Jiang, L.; Gao, L.; Sun, J. Production of aqueous colloidal dispersions of carbon nanotubes. J. Colloid Interface Sci. 2003, 260, 89–94. [Google Scholar] [CrossRef]
  33. Perkampus, H.-H.; Grinter, H.-C.; Threlfall, T. UV-VIS Spectroscopy and Its Applications; Springer: Berlin/Heidelberg, Germany, 1992. [Google Scholar]
  34. Kim, J.; Cote, L.J.; Kim, F.; Yuan, W.; Shull, K.R.; Huang, J. Graphene oxide sheets at interfaces. J. Am. Chem. Soc. 2010, 132, 8180–8186. [Google Scholar] [CrossRef] [PubMed]
  35. Wotring, E. Dispersion of Graphene Nanoplatelets in Water with Surfactant and Reinforcement of Mortar with Graphene Nanoplatelets; University of Illinois at Urbana-Champaign: Champaign, IL, USA, 2014. [Google Scholar]
  36. Mehrali, M.; Sadeghinezhad, E.; Latibari, S.T.; Kazi, S.N.; Mehrali, M.; Zubir, M.N.B.M.; Metselaar, H.S.C. Investigation of thermal conductivity and rheological properties of nanofluids containing graphene nanoplatelets. Nanoscale Res. Lett. 2014, 9, 15. [Google Scholar] [CrossRef] [PubMed]
  37. Ortego, J.D.; Jackson, S.; Yu, G.S.; McWhinney, H.; Cocke, D.L. Solidification of hazardous substances—A TGA and FTIR study of Portland cement containing metal nitrates. J. Environ. Sci. Health Part A 1989, 24, 589–602. [Google Scholar] [CrossRef]
  38. Horgnies, M.; Chen, J.; Bouillon, C. Overview about the use of Fourier Transform Infrared spectroscopy to study cementitious materials. In Proceedings of the 6th International Conference on Computational Methods and Experiments in Materials Characterisation, Siena, Italy, 4–6 June 2013; pp. 251–262. [Google Scholar]
  39. Mollah, M.Y.A.; Yu, W.; Schennach, R.; Cocke, D.L. A Fourier transform infrared spectroscopic investigation of the early hydration of Portland cement and the influence of sodium lignosulfonate. Cem. Concr. Res. 2000, 30, 267–273. [Google Scholar] [CrossRef]
  40. Bensted, J.; Varma, S.P. Some applications of infrared and Raman spectroscopy in cement chemistry. Part 3-hydration of Portland cement and its constituents. Cem. Technol. 1974, 5, 440–445. [Google Scholar]
  41. Smith, B.C. Fundamentals of Fourier Transform Infrared Spectroscopy; CRC Press: Boca Raton, FL, USA, 2011. [Google Scholar]
  42. Zhou, Q.; Glasser, F.P. Thermal stability and decomposition mechanisms of ettringite at <120 °C. Cem. Concr. Res. 2001, 31, 1333–1339. [Google Scholar]
  43. Khoury, G. Compressive strength of concrete at high temperatures: A reassessment. Mag. Concr. Res. 1992, 44, 291–309. [Google Scholar] [CrossRef]
  44. Nonnet, E.; Lequeux, N.; Boch, P. Elastic properties of high alumina cement castables from room temperature to 1600 C. J. Eur. Ceram. Soc. 1999, 19, 1575–1583. [Google Scholar] [CrossRef]
  45. Xu, W.; Lo, Y.T.; Ouyang, D.; Memon, S.A.; Xing, F.; Wang, W.; Yuan, X. Corrigendum to ‘‘Effect of rice husk ash fineness on porosity and hydration reaction of blended cement’’ [Constr. Build. Mater. 89 (2015) 90–101]. Constr. Build. Mater. 2015, 93, 1249. [Google Scholar] [CrossRef]
  46. Karim, M.R.; Hashim, H.; Abdul Razak, H. Thermal activation effect on palm oil clinker properties and their influence on strength development in cement mortar. Constr. Build. Mater. 2016, 125, 670–678. [Google Scholar] [CrossRef]
  47. Bernal, S.A.; Juenger, M.C.G.; Ke, X.; Matthes, W.; Lothenbach, B.; De Belie, N.; Provis, J.L. Characterization of supplementary cementitious materials by thermal analysis. Mater. Struct. 2016, 50, 26. [Google Scholar] [CrossRef]
  48. Karim, M.R.; Hashim, H.; Razak, H.A. Assessment of pozzolanic activity of palm oil clinker powder. Constr. Build. Mater. 2016, 127, 335–343. [Google Scholar] [CrossRef]
  49. Trezza, M.A. Hydration study of ordinary portland cement in the presence of zinc ions. Mater. Res. 2007, 10, 331–334. [Google Scholar] [CrossRef]
  50. Jadhav, R.; Debnath, N.C. Computation of X-ray powder diffractograms of cement components and its application to phase analysis and hydration performance of OPC cement. Bull. Mater. Sci. 2011, 34, 1137–1150. [Google Scholar] [CrossRef]
  51. Rendell, F.; Jauberthie, R.; Grantham, M. Deteriorated Concrete: Inspection and Physicochemical Analysis; Thomas Telford: London, UK, 2002. [Google Scholar]
  52. Murugan, M.; Santhanam, M.; Gupta, S.S.; Pradeep, T.; Shah, S.P. Influence of 2D rGO nanosheets on the properties of OPC paste. Cem. Concr. Compos. 2016, 70, 48–59. [Google Scholar] [CrossRef]
  53. Li, G.Y.; Wang, P.M.; Zhao, X. Mechanical behavior and microstructure of cement composites incorporating surface-treated multi-walled carbon nanotubes. Carbon 2005, 43, 1239–1245. [Google Scholar] [CrossRef]
  54. Lv, S.; Ma, Y.; Qiu, C.; Zhou, Q. Regulation of GO on cement hydration crystals and its toughening effect. Mag. Concr. Res. 2013, 65, 1246–1254. [Google Scholar] [CrossRef]
  55. British Standards Institution. Methods of Test for Mortar for Masonry-Determination of Dry Bulk Density of Hardened Mortar; BS EN. 1015-10-1999; BSI Group: London, UK, 1999. [Google Scholar]
  56. Li, Z.; Wang, H.; He, S.; Lu, Y.; Wang, M. Investigations on the preparation and mechanical properties of the nano-alumina reinforced cement composite. Mater. Lett. 2006, 60, 356–359. [Google Scholar] [CrossRef]
  57. Li, H.; Xiao, H.-G.; Ou, J.-P. A study on mechanical and pressure-sensitive properties of cement mortar with nanophase materials. Cem. Concr. Res. 2004, 34, 435–438. [Google Scholar] [CrossRef]
  58. Li, H.; Xiao, H.-G.; Ou, J.-P. Effect of compressive strain on electrical resistivity of carbon black-filled cement-based composites. Cem. Concr. Compos. 2006, 28, 824–828. [Google Scholar] [CrossRef]
  59. Dai Pang, S.; Gao, H.J.; Xu, C.; Quek, S.T.; Du, H. Strain and damage self-sensing cement composites with conductive graphene nanoplatelet. In Proceedings of Sensors and Smart Structures Technologies for Civil, Mechanical, and Aerospace Systems 2014; SPIE: Bellingham, WA, USA, 2014. [Google Scholar]
Figure 1. Schematics of conversion of bulk graphite into GO with corresponding sample appearances at each phase. The solid black lines represent graphite layers; dotted black lines represent single layers of GO; wide blue lines represent H2SO4/HSO4 intercalant; green color shows oxidizing agent; and thick yellow lines represent a layer of the mixture of H2SO4/HSO4 intercalant with the reduced form of the oxidizing agent.
Sustainability 10 00822 g001
Figure 2. Schematic illustration of the electrical connections.
Sustainability 10 00822 g002
Figure 3. Characterization of graphite and GO: (a) XRD; (b) Raman; and (c) FTIR spectra.
Sustainability 10 00822 g003aSustainability 10 00822 g003b
Figure 4. Absorbance peaks of GO aqueous solution with and without SP for λ = 232 nm.
Sustainability 10 00822 g004
Figure 5. Influence of the GO sheets on the rheological behavior of cement paste.
Sustainability 10 00822 g005
Figure 6. Microscale characterization of plain cement and GO–cement composite specimens: (a) FTIR spectra; (b) TGA/DTA curves; and (c) XRD spectra.
Sustainability 10 00822 g006aSustainability 10 00822 g006b
Figure 7. Schematic of bond formation.
Sustainability 10 00822 g007
Figure 8. Field emission scanning electron microscope (FESEM) image of composite material.
Sustainability 10 00822 g008
Figure 9. Crack-bridging mechanism of well-bonded graphene nanosheets in cement composite.
Sustainability 10 00822 g009
Figure 10. Fractional change in resistance against normalized compression load for various samples.
Sustainability 10 00822 g010
Table 1. Chemical composition of cement.
ComponentContent (%)
CaO64.64
SiO221.28
Al2O35.6
MgO2.06
SO32.14
Fe2O33.36
Total Alkalis0.05
Insoluble residue0.22
Loss in ignition0.64
Table 2. Mix proportions of cement composite.
ComponentPasteMortar
Plain Cement GO–Cement Composite Plain Cement GO–Cement Composite
Cement (g)500500500500
Sand (g)N/AN/A15001500
Water (mL)180180180180
Polycarboxylate superplasticizer (mL)7.57.57.57.5
GO (g)00.1500.15
W/C0.360.360.360.36
SP/C (%)1.51.51.51.5
GO/C (%)00.0300.03
Table 3. Chemical composition of graphite and GO nanosheets.
SampleC (%)O (%)Others (%)
Graphite97.520.5
GO58.639.51.9
Table 4. Flow parameters estimated by Bingham equation.
Sampleτₒ (Pa)𝜂 (Pa·s)
Plain cement paste0.680.33
GO–cement composite paste0.210.45
Table 5. Mass loss obtained from TGA/DTA.
Sample/TemperatureMass loss (%)/Mass Loss (mg)Amount of CH using Molecular Mass Ratio (%)
180–300 °C
(Dehydration of Bonded Water)
430–480 °C
(Dehydroxylation of Portlandite)
600–780 °C
(Decarbonation of Calcium Carbonate)
430–480 °C600–780 °C
Plain cement specimen1.22/0.4770.46/0.184.42/1.7291.917.43
GO–cement composite specimen1.01/0.3950.80/0.3134.52/1.7683.277.60
Table 6. Flow diameter, compressive strength and density of mortar.
Sample NameFlow Diameter (mm)/Increase Rate (%)Density (g/m3)/Increase Rate (%)Compressive Strength (MPa)/Increase Rate (%)
Fresh Mortar28-Day3-Day28-Day90-Day
Plain cement mortar121/1002368/10042.7/10066.4/10067.9/100
GO–cement composite mortar107/882402/101.453.6/12584.3/12787.3/128

