Article

Recurrent Translocations in Topoisomerase Inhibitor-Related Leukemia Are Determined by the Features of DNA Breaks Rather Than by the Proximity of the Translocating Genes

by
Nikolai A. Lomov
1,*,
Vladimir S. Viushkov
1,
Sergey V. Ulianov
1,2,
Alexey A. Gavrilov
2,
Daniil A. Alexeyevsky
3,
Artem V. Artemov
4,
Sergey V. Razin
1,2 and
Mikhail A. Rubtsov
1,5
1
Department of Molecular Biology, Faculty of Biology, Lomonosov Moscow State University, Moscow 119234, Russia
2
Institute of Gene Biology, Russian Academy of Sciences, Moscow 119334, Russia
3
A.N. Belozersky Institute of Physico-Chemical Biology, Lomonosov Moscow State University, Moscow 119234, Russia
4
Department of Neuroimmunology, Center for Brain Research, Medical University of Vienna, 1090 Vienna, Austria
5
Department of Biochemistry, Center for Industrial Technologies and Entrepreneurship I.M., Sechenov First Moscow State Medical University (Sechenov University), Moscow 119435, Russia
*
Author to whom correspondence should be addressed.
Int. J. Mol. Sci. 2022, 23(17), 9824; https://doi.org/10.3390/ijms23179824
Submission received: 25 June 2022 / Revised: 9 August 2022 / Accepted: 21 August 2022 / Published: 29 August 2022
(This article belongs to the Special Issue State-of-the-Art Molecular Genetics and Genomics in Russia)

Abstract

:
Topoisomerase inhibitors are widely used in cancer chemotherapy. However, one of the potential long-term adverse effects of such therapy is acute leukemia. A key feature of such therapy-induced acute myeloid leukemia (t-AML) is recurrent chromosomal translocations involving AML1 (RUNX1) or MLL (KMT2A) genes. The formation of chromosomal translocation depends on the spatial proximity of translocation partners and the mobility of the DNA ends. It is unclear which of these two factors might be decisive for recurrent t-AML translocations. Here, we used fluorescence in situ hybridization (FISH) and chromosome conformation capture followed by sequencing (4C-seq) to investigate double-strand DNA break formation and the mobility of broken ends upon etoposide treatment, as well as contacts between translocation partner genes. We detected the separation of the parts of the broken AML1 gene, as well as the increased mobility of these separated parts. 4C-seq analysis showed no evident contacts of AML1 and MLL with loci, implicated in recurrent t-AML translocations, either before or after etoposide treatment. We suggest that separation of the break ends and their increased non-targeted mobility—but not spatial predisposition of the rearrangement partners—plays a major role in the formation of these translocations.

Graphical Abstract

1. Introduction

Targeting topoisomerase II is an effective treatment approach in cancer chemotherapy. DNA topoisomerase II (TopoII) plays a critical role in replication and transcription, where it resolves DNA catenanes and relieves the torsional stress in DNA. During the catalytic cycle, TopoII generates double-strand breaks (DSBs) in one DNA duplex and transits the second one through the DSB. Following the transit, the DSB is re-ligated [1]. The poisoning of TopoII leads to inhibition of both the re-ligation function of the enzyme and the accumulation of multiple DSBs in dividing cancer cells [2,3,4,5]. However, a side effect of this therapy is the formation of DSBs in other proliferating cells such as those in bone marrow. The ends of two DSBs could be ligated by the non-homologous end-joining (NHEJ) mechanism, which leads to the formation of chromosomal translocations [6] associated with an increased risk of leukemia [7]. These topoisomerase inhibitor-related (TI-related) leukemias occur as a late complication of therapy after a 1–2 year latency period [8,9] and often present as overt acute myeloid leukemia (AML) with poorer outcomes compared to de novo AML [10,11,12]. A characteristic feature of tumor cells in TI-related AML is the presence of balanced chromosomal translocations, most often involving the KMT2A gene (also known as MLL) at 11q23.3 and the RUNX1 gene (also known as AML1) at 21q22.1 [13,14]. The KMT2A (histone-lysine N-methyltransferase 2A) gene encodes a protein that methylates histone H3 on lysine 4 (H3K4) to promote genome accessibility and transcription [15,16]. The RUNX1 (runt-related transcription factor 1) gene encodes a transcription factor that regulates hematopoiesis [17]. Recurrent translocations involving AML1 and MLL genes lead to the formation of fusion proteins that exert their leukemogenic effects through the dysregulation of genes involved in cell proliferation [18].
Both AML1 and MLL genes have a limited set of recurrent translocation partners in TI-related AML (Table 1).
It is worth noting that this set of translocations differs from the recurrent translocations in other types of t-AML, such as those induced by alkylating agents or radiotherapy [10,19]. Therefore, the manner in which the DSBs are introduced plays a significant role in the formation of translocations. However, the mechanisms responsible for the formation of recurrent translocations in TI-related AML are poorly understood.
Spatial juxtaposition of translocating loci before or after the formation of DSBs is a prerequisite for effective translocation. However, fluorescence in situ hybridization (FISH) and chromatin conformation capture-based techniques reveal that interphase chromosomes that occupy separate regions of the nucleus and loci on the same chromosome tend to be in spatial proximity to each other [33,34,35]. The formation of chromosomal rearrangements is influenced by this territorial organization of interphase chromosomes [36].
Data from high-throughput chromosome conformation capture (Hi-C) revealed a correlation between the spatial proximity of loci and the probability of translocation between them [37]. Many translocation-prone pairs of regions genome-wide, including the translocation partners BCR-ABL and MYC-IGH, display elevated Hi-C contact frequencies in normal human cells [38]. FISH experiments also showed that close association of neighboring chromosomes in lymphocytes favors myeloma-associated translocations [39]. However, these observations do not exclude the formation of the translocations between initially distant loci as the result of increased mobility after DSB formation. It has been shown that locus mobility increases following DSB formation and DSBs cluster together [40]. Moreover, in vivo imaging of individual loci demonstrates the formation of translocations between initially distant loci [41,42].
In the present study, we investigated the mobility and spatial proximity of translocating loci involved in rearrangements associated with TI-related AML. As previously shown, treatment of lymphoblastoid Jurkat cells with the Topo II inhibitor etoposide leads to separation of the ends of DSB in the MLL gene, which is frequently followed by relocation of the broken ends beyond the chromosomal territory [43]. In our study, similar observations were made for the AML1 gene. Using FISH on three-dimensionally preserved nuclei (3D-FISH), we showed that exposure of Jurkat cells with etoposide caused separation of the ends of DSBs in the AML1 gene, and frequent relocation of broken ends beyond the chromosomal territory. To search the genome for sequences contacting MLL or AML1, we used a 4C-seq method (chromosome conformation capture followed by sequencing). However, we did not detect spatial proximity of MLL or AML1 to their translocation partners either before or after etoposide treatment. This finding suggests that spatial proximity does not play a substantial role in determining patterns of AML1 and MLL translocation partners. Occasional encounters of various translocation partners in cells exposed to etoposide are likely to occur due to the increased mobility of broken DNA ends, whereas the specific patterns of translocations in AML could originate as the result of the selection of cellular clones [44].

2. Results

Our task was to analyze whether etoposide induces DSBs in the AML1 gene and whether the ends of the DSBs move outside the territory of chromosome 21 where they are normally located. We used the FISH technique which enables the detection of DSBs over a wide interval within the gene. Considering the infrequency of the events we were studying, we combined FISH with automated analysis of the results to obtain relevant statistics. Jurkat cells (cultured human lymphoid cells) were used as a convenient cell culture for 3D-FISH.
The subsequent task was to determine whether a spatial predisposition of MLL and AML1 genes to the translocation in non-treated cells occurs and to discover if there is a directed motion of the MLL and AML1 genes to certain loci after treating the cells with etoposide. To analyze the MLL and AML1 genome-wide chromatin contacts, we used the 4C-seq method.

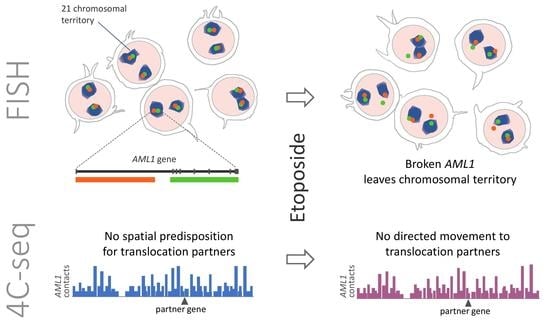
2.1. Etoposide Treatment Leads to the Formation of DSBs in AML1 Followed by Separation of the Break Ends

To verify that etoposide causes DSBs in the AML1 gene and to determine where the broken ends are located relative to the territory of chromosome 21, we treated Jurkat cells with etoposide and performed 3D-FISH with a far-red whole chromosome 21 painting probe and a dual color break-apart (DC BA) AML1 probe, the colors of which correspond to upstream and downstream regions of the AML1 gene. For the quantitative detection of rare events like AML1 breaks, we used custom software, called Conredet, which reconstructs 3D images of the nuclei from Z-stacks of confocal 2D images (see the Materials and Methods section). The program recognizes fluorescent signals of each color and determines the coordinates of the regions of the AML1 gene, as well as the boundaries of the chromosomal territories and cells (Figure 1). Conredet also identifies which regions of AML1 belong to the same allele and applies quality filters: only cells with 2 alleles of the AML1 gene and 2 chromosomal territories (which could merge into one) were used for the downstream analysis (see the description of the algorithm in the Materials and Methods section). The data obtained are in Table S1.
First, we plotted the distribution of the pairwise distances between two regions of the AML1 gene in the untreated (control) cells (Figure 2A). The 99th quantile of the distribution was designated as “broken” alleles, since we demonstrated that beyond this value there is a much larger percentage of alleles in the cells treated with etoposide than in the control cells (Figure 2B).
We subsequently analyzed the cells treated with etoposide (2 replicates of each series in the experiment). In these cells, the percentage of split signals was higher, which indicates the “broken” alleles.
The data confirm that, as in the case of the MLL gene [43], etoposide induces DSBs in the AML1 gene, and the ends of some DSBs move apart (i.e., in 3% of total AML1 alleles under current experimental conditions).
To find out whether the induction of DSBs in AML1 by etoposide differs from the induction of DSBs by ionizing radiation (IR), we performed an experiment with X-rays. Opposite to etoposide treatment, exposure of cells to even a high irradiation dose (7 Gy) did not increase the number of “broken” AML1 compared to control cells (Figure 2C). Thus, separation of the AML1 DSB ends is a characteristic of the etoposide-induced DSBs.

2.2. The Distribution of AML1 Alleles Relative to the Chromosomal Territory Boundaries Changes after Etoposide Treatment

Using the Conredet program, we studied the distances between regions of one allele and the distance to the chromosomal territory boundary for each region of AML1. The results are reflected in the scatterplots (Figure 3).
We found that the percentage of broken alleles localized outside the chromosomal territory was significantly higher (~2.9 times, p < 0.05 in the chi-square test) than that for non-broken alleles. However, we could not guarantee that all “non-broken” alleles in etoposide-treated cells were actually intact. Therefore, we compared broken alleles from etoposide-treated cells with intact alleles from non-treated cells, and the difference was more evident (~5.8 times, p < 0.001 in the chi-square test; see statistic in Table S2).

2.3. MLL and AML1 Do Not Demonstrate Increased Contact Frequency with Their TI-Related Rearrangement Partners in Both Control and Etoposide-Treated Cells

To determine whether there is a spatial predisposition of genes rearranged in TI-related AML, we performed a 4C-seq analysis. DNA-protein complexes were crosslinked with formaldehyde, and DNA was digested using HindIII, diluted and ligated. The resulting DNA fragments, which are fusions of physically associated in 3D space DNA regions, were self-circularized by DpnII-treatment and ligation. Then, circular DNA molecules were amplified by reverse PCR with primers designed to loci of interest (4C bait loci). This 4C library was sequenced with Illumina to find the sequences contacting with bait loci, that have been selected on the AML1, MLL, and CCND1 genes (Figure S1). The CCND1 gene was chosen as a control because it is not involved in chromosomal translocations and is localized on the same chromosome 11 as the MLL gene. We also performed the same 4C-seq analysis of cells treated with etoposide to determine if a spatial proximity to translocations occurs as a result of etoposide treatment. 4C libraries for all biological conditions were prepared in two independent replicates. We obtained 7–20 million uniquely mapped reads per library, and because the replicates demonstrated a high correlation (Pearson’s r > 0.999, p-value < 2.2 × 10⁻¹⁶, Figure S2), we combined them after normalization to the total library size (Table S3).
4C-seq profiles were visualized using the UCSC genome browser. First, we do not observe the pattern that AML1 or MLL contact more often with their partner genes. This observation denotes the absence of spatial predisposition for the rearrangements associated with TI-related AML. Second, we also did not observe an increase in the number of AML1- and MLL-centered contacts with partner genes after etoposide treatment (Figure 4 and Figure 5). We therefore concluded that translocation partners do not spatially co-localize preferably with each other after induction of DSBs. To confirm the conclusions based on the 4C-seq profiles, we compared the number of AML1 contacts (4C-seq signal) with its translocation partner genes and the average number of AML1 contacts with each human gene. Translocation partners of AML1 did not show significantly different levels of 4C-seq signal in AML1 4C libraries as compared to other human genes on non-bait chromosomes (p-value ranging from 0.35 to 0.97 in individual samples, Table S4). Translocation partners of MLL also did not show altered 4C-seq signal in MLL 4C libraries as compared to other human genes on non-bait chromosomes (p-values ranging from 0.15 to 0.78, Table S4). Finally, the 4C-seq data showed that most of the 4C-captured contacts are established in cis, which is consistent with previously published Hi-C data [34]. The proportion of the trans-contacts among all contacts did not change in etoposide-treated cells for AML1, and this proportion decreased by only 2.4% for MLL and 3.2% for CCND1. The latter observation is consistent with the FISH data, demonstrating that chromosomal territories do not expand and most AML1 alleles do not leave their chromosomal territories following treatment with etoposide.

3. Discussion

Previous studies of chromosomal translocations have provided a variety of data that are sometimes contradictory. Some studies have demonstrated the importance of the spatial proximity of loci for translocation [37,38,39,41]. Other studies have shown the increased mobility of DSBs compared to that of intact loci [40,42,45]. Collectively, the results reported to date have been interpreted in the context of two hypotheses that emphasize either the importance of the initial position of the rearranged loci or the mobility of broken alleles. The “contact-first” hypothesis proposes that the misrepair of chromosome breaks can take place only when the breaks occur in colocalized chromatin fibers. The “breakage-first” hypothesis assumes that DSBs move across large distances in the nucleus before interacting, suggesting that the spatial predisposition of the loci is not necessary for rearrangement [46]. However, data obtained to date do not reveal a single mechanism that determines which translocation will occur. Rather, all factors affect the probability of translocation, in different situations and with varying degrees of probability [47]. For example, experiments on cells with a genomic loci visualization system in vivo showed that both close and distant loci form translocations after DSB induction, with this effect observed more frequently in the close loci [48]. In addition to the proximity of genes and the mobility of DSBs, the formation of certain translocations is determined by the probability of a break occurring at a particular site [37,49,50,51], as well as the origin of the break. For example, DSBs caused by topoisomerase poisons are more mobile than those caused by radiation [52], and sites at the anchors of chromatin loops are preferred for etoposide-induced DNA breaks [53,54]. It is apparent that some of these factors are related to each other; for example, the manner in which DSB is induced affects the probability of the break occurring at a given locus, its repair pathway, persistence time, and the number of DNA breaks at other loci.
As mentioned above, topoisomerase inhibitor-related leukemias are characterized by a limited set of recurrent translocations (Table 1). The selective advantage of translocations for cells plays a substantial role in the observation that we see this particular translocation in patients. However, the selective advantage is not the only factor, as different recurrent translocations are observed in other types of therapy-related leukemia, such as that induced by alkylating agents or radiotherapy [10,19]. In our work, we investigated the factors affecting the formation of recurrent translocations in TI-related AML, with a particular focus on the factors preceding the translocation, such as the frequency of translocation partner contacts and the dynamics of DSBs prior to the rearrangement.
It has been shown that MLL and AML1 genes are susceptible to DSB damage caused by treatment with topoisomerase inhibitors [13,55,56,57,58]. In the present study, we have shown that exposure of cells to topoisomerase II inhibitor etoposide causes the AML1 ends to move apart. This finding demonstrates the free movement of unrepaired DNA ends, although the ends of DSB do not typically move separately since their ends are held by the repair proteins that perform DNA end-bridging [59]. When single DSBs were induced by meganuclease, the ends of the DSBs did not usually separate [41,48]. Possibly, the unrepaired ends move apart if the cell repair systems are unable to cope with a large number of DSBs. Etoposide treatment results in many DSBs, which has been confirmed by comet assay [60] or by measuring γH2AX levels [61,62]. Another possible explanation for the split DSB ends is that topoisomerase II poisoning results in a permanent DSB, which persists for a lengthy amount of time because they require a special repair pathway: proteasomal degradation of the stalled enzyme and end-processing of DNA [3,63,64]. As a result, the ends of DSBs are not held together by proteins of the repair systems, which increases the likelihood of misrepair and translocation.
In case of IR-treatment we did not see AML1 ends moving apart. We can suggest two explanations. First, unlike etoposide, IR should lead to DSBs that are more evenly distributed throughout the genome. When cells were treated even with a high dose of IR, we did not see DSBs specifically in AML1. Second, it is possible that IR-induced breaks are repaired faster than etoposide-induced breaks, which may explain the absence of separated parts of AML1 in IR-treated cells.
The broken ends of AML1 are more often localized outside the chromosome territory compared to intact alleles. This can be interpreted in terms of increased mobility of the broken ends in the nucleus space. This mobility may allow for occasional colocalization of genes that were originally located far apart in the nucleus.
The 4C-seq data suggest that there are no preferential contacts of AML1 and MLL with their recurrent translocation partner genes. Therefore, for translocations associated with TI-related AML, spatial proximity is not a determining factor. This observation is consistent with data showing that chromosome conformation capture (3C) did not detect interactions between AF9 or AF4 with MLL [27]. Furthermore, the number of contacts between translocation partner genes does not increase relative to the number of contacts with other genes on non-bait chromosomes after etoposide treatment. Thus, we have not revealed directed movement of the broken translocation partner genes toward each other. Such directed movement would take place if the ends of DSBs moved to some nuclear compartment for repair, such as the nucleolus, for example, as previously suggested [65].
The results of both FISH experiments and 4C-seq show that, in the population of etoposide-treated cells, most of the AML1 and MLL alleles still reside within their chromosomal territories. The resulting translocations can be explained by the long persistence time of these “wandering” ends of DSBs that require a substrate for repair, even if the repair is erroneous.
To summarize, the limited set of recurrent translocations in TI-related AML cannot be explained by spatial predisposition of translocation partner genes, but rather by the characteristics of DSBs and the functional role of the translocations. Such translocations give a clonal advantage to these cells, compared to others with different translocations, which surely occur, but are not found in cancer cells [44].

4. Materials and Methods

4.1. Cell Culture

The Jurkat human lymphoid cell line [66] was obtained from the collection of the Medical Genetics Research Center, RAMS. Cells were grown at 37 °C in a 5% CO2 incubator. RPMI 1640 medium supplemented with 10% FBS was used. Treatment of cells with etoposide was performed in the same medium at a concentration of 100 µg/mL for 1 h. Radgil (Gilardoni, Italy), a special medical X-ray unit for the irradiation of blood components, was used to irradiate the cells. The cells were irradiated for 6.5 min (7 Gy). The ionizing radiation doses for Jurkat cells have been selected based on literature [37,67].

4.2. 3D-FISH

3D-FISH was performed as previously described [43,68]. Briefly, cells were attached to glass coverslips coated with Cell-Tak™ (BD Bioscience) and fixed in 4% paraformaldehyde. Then, cells were permeabilized in 0.5% (w/v) Triton X-100/1x PBS, incubated for 12 h in 20% (v/v) glycerol/1x PBS, frozen four times in liquid nitrogen, treated with RNAse A (200 µg/mL) and equilibrated in 50% (v/v) deionized formamide for at least one week at +4 °C.
The AML1 gene was visualized using fluorescently labeled bacterial artificial chromosome (BAC) probes (BlueGnome, UK). BAC RP11-299D9 is 140 kb long and labelled with AlexaFluor 488 green fluorophore, while BAC RP11-177L11 is 160 kb long and labelled with Cy3 orange fluorophore. Whole Chromosome 21 Painting probe (Human IDetect Chr 21 Paint Probe FAR RED) was labeled with far-red fluorophore IDYE 647. Denatured nuclei were hybridized with denatured probes for 48–72 h at 37 °C.
Images were acquired using a confocal laser scanning microscope LSM-510 Meta (Zeiss). Each experiment was captured in 10–15 microscopic fields. Each field was Z-stacked with a resolution of 1024 × 1024 and contained about 100 cells. A typical confocal series (Z-stack) contained 15–30 images with 400–800 nm intervals.

4.3. Image Processing

All Z-stacks obtained from a confocal microscope were exported as an image series and processed using our specifically tailored software called Conredet. The goal of image processing is to detect AML1 alleles, 21 chromosomal territory, and whole nuclei as 3-dimensional objects and to measure the distances between them. The input to image processing is a Z-stack with three color channels, one each for the dual-color fluorescent probe, visualizing the two regions of AML1 allele, and for the chromosomal territory. Nuclei were detected using background DNA fluorescence in one of the channels.
Image processing consists of the following steps: image pre-processing, nuclei detection, and detection of territory and DNA loci within each nucleus. Image pre-processing includes one filter: despeckling (3D 1 × 1 × 3 median filter). Nuclei are detected in an iterative process. First, the 3D gaussian blur (sigma = 1) is applied. Subsequently, the brightest voxel is selected as the nuclei center, and the cylindrical model of the nucleus is fit to the image to maximize total brightness within the cylinder using gradient descent and starting with the selected center. The nucleus is then removed from the image and the process is repeated starting from the next brightest voxel. To detect the DNA locus, a fixed number of the top brightest voxels is selected. Each locus is detected as a connected component on the graph of neighboring voxels. Chromosomal territory is detected using an identical process after the corresponding color channel is passed through a 3-dimensional Gaussian filter (sigma = 1).
To reduce object detection errors, several filters are applied to the resulting objects. First, for each kind of object, a threshold is defined for a minimal and maximal number of voxels in each object, and the objects not matching the threshold are removed. Following this procedure, only nuclei in which there are exactly two objects for each DNA locus and at least one detected territory are retained. The nuclei that do not match the nearest-locus criterion are removed. Signals with different colors between those centers which had the smallest possible distance in the cell were determined as paired signals. The nearest-locus criterion checks that the signals are correctly paired: 2 signals of different colors that are closest to each other are considered a pair. The criterion is defined as follows: if the green signal G1 is nearest to the red signal R1, then R1 is nearest to G1. The nearest-locus criterion removes the cells in which the loci were not detected. Instead, noise was detected as the DNA locus signal in the other location of the nucleus. All nuclei in which the distance between locus and pair (locus) was greater than 2000 nm were identified by the researchers in the images and considered incorrect detection results. All such cases were removed from the resulting data.
The resulting dataset was used to analyze distances between paired DNA loci and distances between DNA locus and the nearest chromosomal territory.
For the purposes of distance calculations, the DNA locus was treated as a single point that is the center of mass of the voxels detected as part of the locus, with voxel brightness defined as its weight. To calculate the distance between DNA locus and chromosomal territory, the distance between a DNA locus point and a plane containing three nearest points of chromosomal territory was determined using distance metrics as follows: distance is positive if the DNA locus is outside the chromosomal territory and negative if it is inside. All cells with broken alleles were identified in the images and the split signals were visually confirmed.
Cells with signals separated by 2000 nm or more from each other, or from the chromosomal territory, were not included in the analysis, as such examples are ultimately found to be recognition errors upon closer examination.

4.4. 3C and 4C-seq Libraries

The 4C-seq procedure was carried out as described in [69,70,71]. 4C-seq workflow and localization of the 4C-seq primers are in Figure S1A. HindIII and DpnII were used as primary and secondary restriction enzymes, respectively. The PCR reactions for 4C library preparation were performed using the Expand Long Template PCR system (Roche) following the manufacturers’ protocol. The HindIII/DpnII 4C primers are as follows (5′-3′):
4C-AML1-HCAGGTGAGTGTGGAGGTAGAGAG
4C-AML1-DCTTGGTTCCCCAGCTGAGAT
4C-MLL-HATAGGCTCCATGTTGGCTCA
4C-MLL-DCACAGGATACAAAGCAGAACTACTC
4C-CCND1-HCCTGCCAACTTCGGTGTCC
4C-CCND1-DAAGTTACCCGAGGCGGAGTC
(See Figure S1B for the mapping 4C primers regarding the HindIII/DpnII sites on the AML1 gene as example).
The PCR products were purified and concentrated using the QIAquick PCR purification kit (Qiagen). 4C libraries obtained with different pairs of primers were mixed in equal weights. Paired-end sequencing was performed on Illumina HiSeq 4000.

4.5. 4C-seq Analysis

4C-seq analysis was performed as previously described [70]. Briefly, sequencing reads originated from the bait sequence were trimmed and only the read containing the HindIII ligation site was chosen, whereas its pair (read) was discarded. The bait-originating subsequence of the read located before the HindIII site was used to classify the reads by the 4C anchor. Sequences located after the HindIII site were mapped to the reference genome hg19 using the bowtie aligner.
For every fragment between HindIII restriction sites, the number of reads that mapped to its left or right end was added and the resulting value was considered to be the raw 4C-seq signal for that restriction fragment. To explore contact frequencies of the genes being studied, the genome was partitioned into 500-kilobase non-overlapping windows and the number of fragments containing at least one 4C-captured contact was calculated for each window. Sequencing statistics for the 4C libraries are shown in Table S5.

4.6. Statistics

To test the hypothesis of non-randomness of the tail on the histogram of distances between regions of one allele distribution after etoposide treatment, we used the following approach after formulating the following hypothesis: the true probability measure P of the tail is greater than zero. Based on the desired confidence level of 0.997, we accept the three-sigma rule; then, according to the theorem on the asymptotic of the empirical distribution [72], the true P differs from the experimental P* by no more than the value x = three sigmas divided by the square root of the total number of points, where sigma is the square root of the value P × (1 − P). If P * − x > 0, then with a reliability >0.997, the tail of the distribution has a strictly positive probability measure. If P is assumed to be approximately equal to the value P * = 0.029 calculated through the data, then for our case the tail detection is a relevant factor with reliability >0.997.
To test the hypothesis that the distribution of broken alleles localized outside/inside the chromosomal territory differs from that proportion for the non-broken alleles, we used the chi-square test (Table S2).
A correlation matrix and plot were obtained for all 4C experiments (Figure S2). Pearson’s correlation coefficient showed a high correlation for the 4C replicates. The Mann–Whitney test was used to compare 4C-seq signal on translocation partners with 4C-seq signal on other human genes in all 4C libraries.

5. Conclusions

The following factors are responsible for recurrent translocations in TI-related AML. First, etoposide induces DSBs in the AML1 and MLL genes. Second, some etoposide-induced DSBs persist for a lengthy period of time, and their ends split apart. Third, the split DSB ends are more mobile than the intact alleles, although determined movement has not been observed. Finally, there is no spatial proximity in translocating genes, so the determining factor of recurrent translocations is their selective advantage. In addition, since the mobility of DSBs induced by topoisomerase inhibitors has a role in chromosome translocation, the ability to manipulate the movements of the break ends could reduce the serious side effects of anticancer TI-therapy.

Supplementary Materials

The supporting information can be downloaded at: https://www.mdpi.com/article/10.3390/ijms23179824/s1.

Author Contributions

Conceptualization, N.A.L., M.A.R., S.V.U. and S.V.R.; methodology, M.A.R., A.A.G. and S.V.U.; software, D.A.A. and A.V.A.; validation, V.S.V.; formal analysis, D.A.A. and A.V.A.; investigation, N.A.L. and V.S.V.; resources, M.A.R., S.V.U. and S.V.R.; data curation, V.S.V., D.A.A. and A.V.A.; writing—original draft preparation, N.A.L.; review and editing, M.A.R., S.V.U. and S.V.R.; visualization, N.A.L. and V.S.V.; supervision, N.A.L., S.V.U. and M.A.R.; project administration, N.A.L. and M.A.R.; funding acquisition, M.A.R. and S.V.R. All authors have read and agreed to the published version of the manuscript.

Funding

This research was funded the Russian Foundation for Basic Research, grant number 19-04-00531_A, by the Interdisciplinary Scientific and Educational School of Moscow University ”Molecular Technologies of the Living Systems and Synthetic Biology”, and by Ministry of Science and Higher Education of the Russian Federation, grant number 075-15-2021-1062.

Institutional Review Board Statement

Not applicable.

Informed Consent Statement

Not applicable.

Data Availability Statement

3D-FISH data generated during the study can be downloaded at: disk.yandex.ru/d/WKXi5sWygeD6FA (accessed on 24 August 2022). The Conredet code is available at: https://github.com/dendik/conredet (accessed on 24 August 2022).

Acknowledgments

The work was made using the equipment located at the User Facilities Center of Moscow State University, including the equipment purchased on account of the MSU Development Program to 2020. We are grateful to Mikhail Moisenovich and Anastasia Arkhipova (Lomonosov Moscow State University, Moscow, Russia) for their kind help with confocal microscopy, Maria Logacheva (Skoltech, Moscow, Russia) for her kind help with Illumina sequencing of 4C libraries, and Professor Andrey Lomov (Novosibirsk State University, Novosibirsk, Russia) for his kind help with statistics.

Conflicts of Interest

The authors declare no conflict of interest.

References

  1. Riccio, A.A.; Schellenberg, M.J.; Williams, R.S. Molecular Mechanisms of Topoisomerase 2 DNA–Protein Crosslink Resolution. Cell. Mol. Life Sci. 2020, 77, 81–91. [Google Scholar] [CrossRef] [PubMed]
  2. Nitiss, J.L. Targeting DNA Topoisomerase II in Cancer Chemotherapy. Nat. Rev. Cancer 2009, 9, 338–350. [Google Scholar] [CrossRef] [PubMed]
  3. Pommier, Y.; Leo, E.; Zhang, H.; Marchand, C. DNA Topoisomerases and Their Poisoning by Anticancer and Antibacterial Drugs. Chem. Biol. 2010, 17, 421–433. [Google Scholar] [CrossRef] [PubMed]
  4. Wu, C.-C.; Li, Y.-C.; Wang, Y.-R.; Li, T.-K.; Chan, N.-L. On the Structural Basis and Design Guidelines for Type II Topoisomerase-Targeting Anticancer Drugs. Nucleic Acids Res. 2013, 41, 10630–10640. [Google Scholar] [CrossRef] [PubMed]
  5. Hevener, K.E.; Verstak, T.A.; Lutat, K.E.; Riggsbee, D.L.; Mooney, J.W. Recent Developments in Topoisomerase-Targeted Cancer Chemotherapy. Acta Pharm. Sin. B 2018, 8, 844–861. [Google Scholar] [CrossRef]
  6. Bunting, S.F.; Nussenzweig, A. End-Joining, Translocations and Cancer. Nat. Cancer 2013, 13, 443–454. [Google Scholar] [CrossRef]
  7. Lieber, M.R.; Gu, J.; Lu, H.; Shimazaki, N.; Tsai, A.G. Nonhomologous DNA end joining (NHEJ) and chromosomal translocations in humans. Subcell Biochem. 2010, 50, 279–296. [Google Scholar] [CrossRef]
  8. Ratain, M.J.; Rowley, J.D. Therapy-Related Acute Myeloid Leukemia Secondary to Inhibitors of Topoisomerase II: From the Bedside to the Target Genes. Ann. Oncol. 1992, 3, 107–111. [Google Scholar] [CrossRef]
  9. McNerney, M.E.; Godley, L.A.; Le Beau, M.M. Therapy-Related Myeloid Neoplasms: When Genetics and Environment Collide. Nat. Rev. Cancer 2017, 17, 513–527. [Google Scholar] [CrossRef]
  10. Bhatia, S. Therapy-Related Myelodysplasia and Acute Myeloid Leukemia. Semin. Oncol. 2013, 40, 666–675. [Google Scholar] [CrossRef] [Green Version]
  11. Kayser, S.; Döhner, K.; Krauter, J.; Köhne, C.H.; Horst, H.A.; Held, G.; Von Lilienfeld-Toal, M.; Wilhelm, S.; Kündgen, A.; Götze, K.; et al. The Impact of Therapy-Related Acute Myeloid Leukemia (AML) on Outcome in 2853 Adult Patients with Newly Diagnosed AML. Blood 2011, 117, 2137–2145. [Google Scholar] [CrossRef] [PubMed]
  12. Schoch, C.; Kern, W.; Schnittger, S.; Hiddemann, W.; Haferlach, T. Karyotype Is an Independent Prognostic Parameter in Therapy-Related Acute Myeloid Leukemia (t-AML): An Analysis of 93 Patients with t-AML in Comparison to 1091 Patients with de Novo AML. Leukemia 2004, 18, 120–125. [Google Scholar] [CrossRef] [PubMed]
  13. Smith, K.; Cowell, I. The Role of Topoisomerase II Beta on Breakage and Proximity of RUNX1 to Partner Alleles RUNX1T1 and EVI1. Genes 2014, 128, 117–128. [Google Scholar] [CrossRef]
  14. Rowley, J.D.; Olney, H.J. International Workshop on the Relationship of Prior Therapy to Balanced Chromosome Aberrations in Therapy-Related Myelodysplastic Syndromes and Acute Leukemia: Overview Report. Genes Chromosom. Cancer 2002, 33, 331–345. [Google Scholar] [CrossRef] [PubMed]
  15. Rao, R.C.; Dou, Y. Hijacked in Cancer: The KMT2 (MLL) Family of Methyltransferases. Nat. Rev. Cancer 2015, 15, 334–346. [Google Scholar] [CrossRef]
  16. Guenther, M.G.; Jenner, R.G.; Chevalier, B.; Nakamura, T.; Croce, C.M.; Canaani, E.; Young, R.A. Global and Hox-Specific Roles for the MLL1 Methyltransferase. Proc. Natl. Acad. Sci. USA 2005, 102, 8603–8608. [Google Scholar] [CrossRef]
  17. Ichikawa, M.; Goyama, S.; Asai, T.; Kawazu, M.; Nakagawa, M.; Takeshita, M.; Chiba, S.; Ogawa, S.; Kurokawa, M. AML1/Runx1 Negatively Regulates Quiescent Hematopoietic Stem Cells in Adult Hematopoiesis. J. Immunol. 2008, 180, 4402–4408. [Google Scholar] [CrossRef]
  18. De Braekeleer, E.; Douet-Guilbert, N.; Morel, F.; Le Bris, M.J.; Férec, C.; De Braekeleer, M. RUNX1 Translocations and Fusion Genes in Malignant Hemopathies. Future Oncol. 2011, 7, 77–91. [Google Scholar] [CrossRef]
  19. Pedersen-Bjergaard, J.; Andersen, M.K.; Andersen, M.T.; Christiansen, D.H. Genetics of Therapy-Related Myelodysplasia and Acute Myeloid Leukemia. Leukemia 2008, 22, 240–248. [Google Scholar] [CrossRef]
  20. Imamura, T.; Taga, T.; Takagi, M.; Kawasaki, H.; Koh, K.; Taki, T.; Adachi, S.; Manabe, A.; Ishida, Y. Nationwide Survey of Therapy-Related Leukemia in Childhood in Japan. Int. J. Hematol. 2018, 108, 91–97. [Google Scholar] [CrossRef]
  21. Gustafson, S.A.; Lin, P.; Chen, S.S.; Chen, L.; Abruzzo, L.V.; Luthra, R.; Medeiros, L.J.; Wang, S.A. Therapy-Related Acute Myeloid Leukemia with t(8;21) (Q22;Q22) Shares Many Features with de Novo Acute Myeloid Leukemia with t(8;21)(Q22;Q22) but Does Not Have a Favorable Outcome. Am. J. Clin. Pathol. 2009, 131, 647–655. [Google Scholar] [CrossRef] [PubMed]
  22. Sood, R.; Kamikubo, Y.; Liu, P. Role of RUNX1 in Hematological Malignancies. Blood 2017, 129, 2070–2082. [Google Scholar] [CrossRef] [PubMed]
  23. Tanaka, K.; Oshikawa, G.; Akiyama, H.; Ishida, S.; Nagao, T.; Yamamoto, M.; Miura, O. Acute Myeloid Leukemia with t(3;21)(Q26.2;Q22) Developing Following Low-Dose Methotrexate Therapy for Rheumatoid Arthritis and Expressing Two AML1/MDS1/EVI1 Fusion Proteins: A Case Report. Oncol. Lett. 2017, 14, 97–102. [Google Scholar] [CrossRef] [PubMed]
  24. Sato, Y.; Izumi, T.; Kanamori, H.; Davis, E.M.; Miura, Y.; Larson, R.A.; Le Beau, M.M.; Ozawa, K.; Rowley, J.D. T(1;3)(P36;P21) Is a Recurring Therapy-Related Translocation. Genes Chromosom. Cancer 2002, 34, 186–192. [Google Scholar] [CrossRef]
  25. Duhoux, F.P.; Ameye, G.; Montano-Almendras, C.P.; Bahloula, K.; Mozziconacci, M.J.; Laibe, S.; Wlodarska, I.; Michaux, L.; Talmant, P.; Richebourg, S.; et al. PRDM16 (1p36) Translocations Define a Distinct Entity of Myeloid Malignancies with Poor Prognosis but May Also Occur in Lymphoid Malignancies. Br. J. Haematol. 2012, 156, 76–88. [Google Scholar] [CrossRef]
  26. Andersen, M.K.; Christiansen, D.H.; Jensen, B.A.; Ernst, P.; Hauge, G.; Pedersen-Bjergaard, J. Therapy-Related Acute Lymphoblastic Leukaemia with MLL Rearrangements Following DNA Topoisomerase II Inhibitors, an Increasing Problem: Report on Two New Cases and Review of the Literature since 1992. Br. J. Haematol. 2001, 114, 539–543. [Google Scholar] [CrossRef]
  27. Cowell, I.G.; Austin, C.A. Mechanism of Generation of Therapy Related Leukemia in Response to Anti-Topoisomerase II Agents. J. Environ. Res. Public 2012, 9, 2075–2091. [Google Scholar] [CrossRef]
  28. Moorman, A.V.; Hagemeijer, A.; Charrin, C.; Rieder, H.; Secker-walker, L.M. Clinical Profile of 53 Patients. Leukemia 1998, 12, 805–810. [Google Scholar] [CrossRef]
  29. Meyer, C.; Burmeister, T.; Strehl, S.; Schneider, B.; Hubert, D.; Zach, O.; Haas, O.; Klingebiel, T.; Dingermann, T.; Marschalek, R. Spliced MLL Fusions: A Novel Mechanism to Generate Functional Chimeric MLL-MLLT1 Transcripts in t(11;19)(Q23;P13.3) Leukemia. Leuk. Off. J. Leuk. Soc. Am. Leuk. Res. Fund UK 2007, 21, 588–590. [Google Scholar] [CrossRef]
  30. Lavau, C.; Du, C.; Thirman, M.; Zeleznik-Le, N. Chromatin-Related Properties of CBP Fused to MLL Generate a Myelodysplastic-like Syndrome That Evolves into Myeloid Leukemia. EMBO J. 2000, 19, 4655–4664. [Google Scholar] [CrossRef] [Green Version]
  31. Yoo, B.J.; Nam, M.H.; Sung, H.J.; Lim, C.S.; Lee, C.K.; Cho, Y.J.; Lee, K.N.; Yoon, S.Y. A Case of Therapy-Related Acute Lymphoblastic Leukemia with t(11;19) (Q23;P13.3) and MLL/MLLT1 Gene Rearrangement. Korean J. Lab. Med. 2011, 31, 13–17. [Google Scholar] [CrossRef] [PubMed]
  32. Xie, W.; Tang, G.; Wang, E.; Kim, Y.; Cloe, A.; Shen, Q.; Zhou, Y.; Garcia-Manero, G.; Loghavi, S.; Hu, A.Y.; et al. T(11;16)(Q23;P13)/KMT2A-CREBBP in Hematologic Malignancies: Presumptive Evidence of Myelodysplasia or Therapy-Related Neoplasm? Ann. Hematol. 2020, 99, 487–500. [Google Scholar] [CrossRef] [PubMed]
  33. Cremer, M.; von Hase, J.; Volm, T.; Brero, A.; Kreth, G.; Walter, J.; Fischer, C.; Solovei, I.; Cremer, C.; Cremer, T. Non-Random Radial Higher-Order Chromatin Arrangements in Nuclei of Diploid Human Cells. Chromosome Res. 2001, 9, 541–567. [Google Scholar] [CrossRef] [PubMed]
  34. Lieberman-Aiden, E.; van Berkum, N.L.; Williams, L.; Imakaev, M.; Ragoczy, T.; Telling, A.; Amit, I.; Lajoie, B.R.; Sabo, P.J.; Dorschner, M.O.; et al. Comprehensive Mapping of Long-Range Interactions Reveals Folding Principles of the Human Genome. Science 2009, 326, 289–293. [Google Scholar] [CrossRef]
  35. Cremer, T.; Cremer, M. Chromosome Territories. Cold Spring Harb. Perspect. Biol. 2010, 2, a003889. [Google Scholar] [CrossRef]
  36. Rosin, L.F.; Crocker, O.; Isenhart, R.L.; Nguyen, S.C.; Xu, Z.; Joyce, E.F. Chromosome Territory Formation Attenuates the Translocation Potential of Cells. Elife 2019, 8, e49553. [Google Scholar] [CrossRef]
  37. Zhang, Y.; McCord, R.P.; Ho, Y.-J.; Lajoie, B.R.; Hildebrand, D.G.; Simon, A.C.; Becker, M.S.; Alt, F.W.; Dekker, J. Chromosomal Translocations Are Guided by the Spatial Organization of the Genome. Cell 2012, 148, 908–921. [Google Scholar] [CrossRef]
  38. Engreitz, J.M.; Agarwala, V.; Mirny, L.A. Three-Dimensional Genome Architecture Influences Partner Selection for Chromosomal Translocations in Human Disease. PLoS ONE 2012, 7, e44196. [Google Scholar] [CrossRef]
  39. Sathitruangsak, C.; Righolt, C.H.; Klewes, L.; Tung Chang, D.; Kotb, R.; Mai, S. Distinct and Shared Three-Dimensional Chromosome Organization Patterns in Lymphocytes, Monoclonal Gammopathy of Undetermined Significance and Multiple Myeloma. Int. J. Cancer 2017, 140, 400–410. [Google Scholar] [CrossRef]
  40. Aymard, F.; Aguirrebengoa, M.; Guillou, E.; Javierre, B.M.; Bugler, B.; Arnould, C.; Rocher, V.; Iacovoni, J.S.; Biernacka, A.; Skrzypczak, M.; et al. Genome-Wide Mapping of Long-Range Contacts Unveils Clustering of DNA Double-Strand Breaks at Damaged Active Genes. Nat. Struct. Mol. Biol. 2017, 24, 353–361. [Google Scholar] [CrossRef]
  41. Soutoglou, E.; Dorn, J.F.; Sengupta, K.; Jasin, M.; Nussenzweig, A.; Ried, T.; Danuser, G.; Misteli, T. Positional Stability of Single Double-Strand Breaks in Mammalian Cells. Nat. Cell Biol. 2007, 9, 675–682. [Google Scholar] [CrossRef] [PubMed]
  42. Wang, H.; Nakamura, M.; Abbott, T.R.; Zhao, D.; Luo, K.; Yu, C.; Nguyen, C.M.; Lo, A.; Daley, T.P.; La Russa, M.; et al. CRISPR-Mediated Live Imaging of Genome Editing and Transcription. Science 2019, 365, 1301–1305. [Google Scholar] [CrossRef] [PubMed]
  43. Glukhov, S.I.; Rubtsov, M.A.; Alexeyevsky, D.A.; Alexeevski, A.V.; Razin, S.V.; Iarovaia, O.V. The Broken MLL Gene Is Frequently Located Outside the Inherent Chromosome Territory in Human Lymphoid Cells Treated with DNA Topoisomerase II Poison Etoposide. PLoS ONE 2013, 8, e75871. [Google Scholar] [CrossRef]
  44. Bystritskiy, A.A.; Razin, S.V. Breakpoint Clusters: Reason or Consequence? Crit. Rev. Eukaryot. Gene Expr. 2004, 14, 65–78. [Google Scholar] [CrossRef] [PubMed]
  45. Falk, M.; Lukasova, E.; Gabrielova, B.; Ondrej, V.; Kozubek, S. Chromatin Dynamics during DSB Repair. Biochim. Biophys. Acta Mol. Cell Res. 2007, 1773, 1534–1545. [Google Scholar] [CrossRef] [PubMed]
  46. Aten, J.A.; Stap, J.; Krawczyk, P.M.; van Oven, C.H.; Hoebe, R.A.; Essers, J.; Kanaar, R. Dynamics of DNA Double-Strand Breaks Revealed by Clustering of Damaged Chromosome Domains. Science 2004, 303, 92–95. [Google Scholar] [CrossRef]
  47. Ramsden, D.A.; Nussenzweig, A. Mechanisms Driving Chromosomal Translocations: Lost in Time and Space. Oncogene 2021, 40, 4263–4270. [Google Scholar] [CrossRef]
  48. Roukos, V.; Voss, T.C.; Schmidt, C.K.; Lee, S.; Wangsa, D.; Misteli, T. Spatial Dynamics of Chromosome Translocations in Living Cells. Science 2013, 341, 660–664. [Google Scholar] [CrossRef]
  49. Chiarle, R.; Zhang, Y.; Frock, R.L.; Lewis, S.M.; Molinie, B.; Ho, Y.J.; Myers, D.R.; Choi, V.W.; Compagno, M.; Malkin, D.J.; et al. Genome-Wide Translocation Sequencing Reveals Mechanisms of Chromosome Breaks and Rearrangements in B Cells. Cell 2011, 147, 107–119. [Google Scholar] [CrossRef]
  50. Klein, I.A.; Resch, W.; Jankovic, M.; Oliveira, T.; Yamane, A.; Nakahashi, H.; Di Virgilio, M.; Bothmer, A.; Nussenzweig, A.; Robbiani, D.F.; et al. Translocation-Capture Sequencing Reveals the Extent and Nature of Chromosomal Rearrangements in B Lymphocytes. Cell 2011, 147, 95–106. [Google Scholar] [CrossRef] [Green Version]
  51. Hakim, O.; Resch, W.; Yamane, A.; Klein, I.; Kieffer-Kwon, K.-R.; Jankovic, M.; Oliveira, T.; Bothmer, A.; Voss, T.C.; Ansarah-Sobrinho, C.; et al. DNA Damage Defines Sites of Recurrent Chromosomal Translocations in B Lymphocytes. Nature 2012, 484, 69–74. [Google Scholar] [CrossRef] [PubMed]
  52. Krawczyk, P.M.; Borovski, T.; Stap, J.; Cijsouw, T.; ten Cate, R.; Medema, J.P.; Kanaar, R.; Franken, N.A.P.; Aten, J.A. Chromatin Mobility Is Increased at Sites of DNA Double-Strand Breaks. J. Cell Sci. 2012, 125, 2127–2133. [Google Scholar] [CrossRef] [PubMed]
  53. Kantidze, O.L.; Razin, S.V. Chromatin Loops, Illegitimate Recombination, and Genome Evolution. BioEssays 2009, 31, 278–286. [Google Scholar] [CrossRef] [PubMed]
  54. Canela, A.; Maman, Y.; Huang, S.-Y.N.; Wutz, G.; Tang, W.; Zagnoli-Vieira, G.; Callen, E.; Wong, N.; Day, A.; Peters, J.M.; et al. Topoisomerase II-Induced Chromosome Breakage and Translocation Is Determined by Chromosome Architecture and Transcriptional Activity. Mol. Cell 2019, 75, 252–266.e8. [Google Scholar] [CrossRef]
  55. Kantidze, O.L.; Razin, S.V. Chemotherapy-Related Secondary Leukemias: A Role for DNA Repair by Error-Prone Non-Homologous End Joining in Topoisomerase II—Induced Chromosomal Rearrangements. Gene 2007, 391, 76–79. [Google Scholar] [CrossRef]
  56. Strissel, P.L.; Strick, R.; Tomek, R.J.; Roe, B.A.; Rowley, J.D.; Zeleznik-Le, N.J. DNA Structural Properties of AF9 Are Similar to MLL and Could Act as Recombination Hot Spots Resulting in MLL/AF9 Translocations and Leukemogenesis. Hum. Mol. Genet. 2000, 9, 1671–1679. [Google Scholar] [CrossRef]
  57. Zhang, Y.; Strissel, P.; Strick, R.; Chen, J.; Nucifora, G.; Le Beau, M.M.; Larson, R.A.; Rowley, J.D.; Le Beau, M.M. Genomic DNA Breakpoints in AML1/RUNX1 and ETO Cluster with Topoisomerase II DNA Cleavage and DNase I Hypersensitive Sites in t(8;21) Leukemia. Proc. Natl. Acad. Sci. USA 2002, 99, 3070–3075. [Google Scholar] [CrossRef]
  58. Gole, B.; Wiesmüller, L. Leukemogenic rearrangements at the mixed lineage leukemia gene (MLL)-multiple rather than a single mechanism. Front Cell Dev Biol. 2015, 3, 41. [Google Scholar] [CrossRef]
  59. Pannunzio, N.R.; Watanabe, G.; Lieber, M.R. Nonhomologous DNA End-Joining for Repair of DNA Double-Strand Breaks. J. Biol. Chem. 2018, 293, 10512–10523. [Google Scholar] [CrossRef]
  60. Luzhin, A.V.; Velichko, A.K.; Razin, S.V.; Kantidze, O.L. Automated Analysis of Cell Cycle Phase-Specific DNA Damage Reveals Phase-Specific Differences in Cell Sensitivity to Etoposide. J. Cell. Biochem. 2016, 117, 2209–2214. [Google Scholar] [CrossRef]
  61. Ivashkevich, A.N.; Martin, O.A.; Smith, A.J.; Redon, C.E.; Bonner, W.M.; Martin, R.F.; Lobachevsky, P.N. ΓH2AX Foci as a Measure of DNA Damage: A Computational Approach to Automatic Analysis. Mutat. Res. Fundam. Mol. Mech. Mutagen. 2011, 711, 49–60. [Google Scholar] [CrossRef]
  62. Reddig, A.; Roggenbuck, D.; Reinhold, D. Comparison of Different Immunoassays for ΓH2AX Quantification. J. Lab. Precis. Med. 2018, 3, 80. [Google Scholar] [CrossRef]
  63. Sun, Y.; Saha, S.; Wang, W.; Saha, L.K.; Huang, S.-Y.N.; Pommier, Y. Excision Repair of Topoisomerase DNA-Protein Crosslinks (TOP-DPC). DNA Repair 2020, 89, 102837. [Google Scholar] [CrossRef] [PubMed]
  64. Waters, C.A.; Strande, N.T.; Wyatt, D.W.; Pryor, J.M.; Ramsden, D.A. Nonhomologous End Joining: A Good Solution for Bad Ends. DNA Repair 2014, 17, 39–51. [Google Scholar] [CrossRef] [PubMed]
  65. Rubtsov, M.A.; Glukhov, S.I.; Allinne, J.; Pichugin, A.; Vassetzky, Y.S.; Razin, S.V.; Iarovaia, O.V. Treatment of Lymphoid Cells with the Topoisomerase II Poison Etoposide Leads to an Increased Juxtaposition of AML1 and ETO genes on the surface of nucleoli. Biopolym. Cell 2011, 27, 398–403. [Google Scholar] [CrossRef]
  66. Schneider, U.; Schwenk, H.-U.; Bornkamm, G. Characterization of EBV-genome Negative “Null” and “T” Cell Lines Derived from Children with Acute Lymphoblastic Leukemia and Leukemic Transformed Non-Hodgkin Lymphoma. Int. J. Cancer 1977, 19, 621–626. [Google Scholar] [CrossRef] [PubMed]
  67. Syljuåsen, R.G.; McBride, W.H. Radiation-induced apoptosis and cell cycle progression in Jurkat T cells. Radiat. Res. 1999, 152, 328–331. [Google Scholar] [CrossRef]
  68. Cremer, M.; Müller, S.; Köhler, D.; Brero, A.; Solovei, I. Cell Preparation and Multicolor FISH in 3D Preserved Cultured Mammalian Cells. Cold Spring Harb. Protoc. 2007, 2007, pdb.prot4723. [Google Scholar] [CrossRef]
  69. Splinter, E.; de Wit, E.; van de Werken, H.J.G.; Klous, P.; de Laat, W. Determining Long-Range Chromatin Interactions for Selected Genomic Sites Using 4C-Seq Technology: From Fixation to Computation. Methods 2012, 58, 221–230. [Google Scholar] [CrossRef] [PubMed]
  70. Gushchanskaya, E.S.; Artemov, A.V.; Ulyanov, S.V.; Logacheva, M.D.; Penin, A.A.; Kotova, E.S.; Akopov, S.B.; Nikolaev, L.G.; Iarovaia, O.V.; Sverdlov, E.D.; et al. The Clustering of CpG Islands May Constitute an Important Determinant of the 3D Organization of Interphase Chromosomes. Epigenetics 2014, 9, 951–963. [Google Scholar] [CrossRef] [Green Version]
  71. Krijger, P.H.L.; Geeven, G.; Bianchi, V.; Hilvering, C.R.E.; de Laat, W. 4C-Seq from Beginning to End: A Detailed Protocol for Sample Preparation and Data Analysis. Methods 2020, 170, 17–32. [Google Scholar] [CrossRef] [PubMed]
  72. Borovkov, A.A. Mathematical Statistics; Sobolev Institute of Mathematics: Novosibirsk, Russia, 1997; p. 32. [Google Scholar]
Figure 1. Example of program recognition of nuclei borders (A), chromosome territories (B), and upstream and downstream regions of the AML1 gene (C,D). Merged images from 3 channels are shown. Bold circles indicate the cells used for analysis (which passed all quality filters). The lower panels show an example of a cell with a “broken” AML1 allele (marked with arrows), one region of which is located outside the chromosomal territory visualized by a far-red whole chromosome painting probe (WCP). Probe 1 and probe 2 visualize upstream and downstream regions of the AML1 gene (Figure S1B).
Ijms 23 09824 g001
Figure 2. The distribution of pairwise distances within paired signals in control cells (A), in etoposide-treated cells (B) and cells treated with ionizing radiation (IR) (C). The red line separates the 99% quantile for the control experiment. The tail on the histogram of pairwise distances of signals in etoposide-treated cells is non-random with a confidence level of 0.997 (see Statistics in the Section 4).
Ijms 23 09824 g002
Figure 3. (A) Scatterplots reflect the distances between regions of one allele (x-axis) and the distance to the territory (y-axis, the value 0 reflects the border of the chromosome territory) for each AML1 region. Red and green colors reflect upstream and downstream regions of the AML1 break-apart FISH probe. (B) The upper scatter plot shows the data for the control cells, and the lower scatterplot depicts the etoposide-treated cells. N is the total number of dots in the scatterplot. (C) Percentage of alleles localized outside the chromosomal territory in control cells, as well as non-broken alleles and broken alleles in etoposide-treated cells (see statistic in Table S2).
Ijms 23 09824 g003
Figure 4. 4C-seq profiles of AML1 from untreated cells (blue) and from cells treated with etoposide (byzantium). The 4C-seq profiles of AML1 on chromosome 21 show cis-contacts (first pair of rows), and the 4C-seq profiles of AML1 on chromosomes 1, 3, and 8 show AML1 trans-contacts with chromosomes that bear AML1 translocation partners in TI-related AML (other pairs of rows). AML1 translocation partner genes are indicated by arrows. Data resolution is 500 kb. 4C-seq data are collected in Table S3.
Ijms 23 09824 g004
Figure 5. 4C-seq profiles of MLL from untreated cells (orange) and from cells treated with etoposide (green). The 4C-seq profiles of MLL on chromosome 11 show cis-contacts (first pair of rows), and the 4C-seq profiles of MLL on chromosomes 4, 9, and 19 show MLL trans-contacts with chromosomes that bear MLL translocation partners in TI-related AML (other pairs of rows). MLL translocation partner genes are indicated by arrows. Data resolution is 500 kb. 4C-seq data are collected in Table S3.
Ijms 23 09824 g005
Table 1. Recurrent translocations in TI-related AML. The HUGO Gene Nomenclature Committee’s gene names are highlighted in bold.
Gene Translocation Partner References
t(8;21)(q22;q22)ETO (RUNX1T1)[13,14,19,20,21]
AML1 (RUNX1)t(3;21)(q26.2;q22)MDS1-EVI1 (MECOM, PRDM3)[22,23]
t(1;21)(p36;q21)PRDM16[24,25]
t(9;11)(p22;q23)AF9 (MLLT3)[14,20]
t(4;11)(q21;q23)AF4 (AFF1, MLLT2)[26,27]
MLL (KMT2A)t(19;11)(q13;q23)ELL[20,28]
t(11;19)(q23;p13.3)ENL (MLLT1)[20,28,29]
t(11;16)(q23;p13)CREBBP[30,31,32]
Publisher’s Note: MDPI stays neutral with regard to jurisdictional claims in published maps and institutional affiliations.

