New Data on the Messapian Necropolis of Monte D’Elia in Alezio (Apulia, Italy) from Topographical and Geophysical Surveys

 and
and 
Abstract
:1. Introduction
2. Study Area
3. Topographical and Archaeological Survey
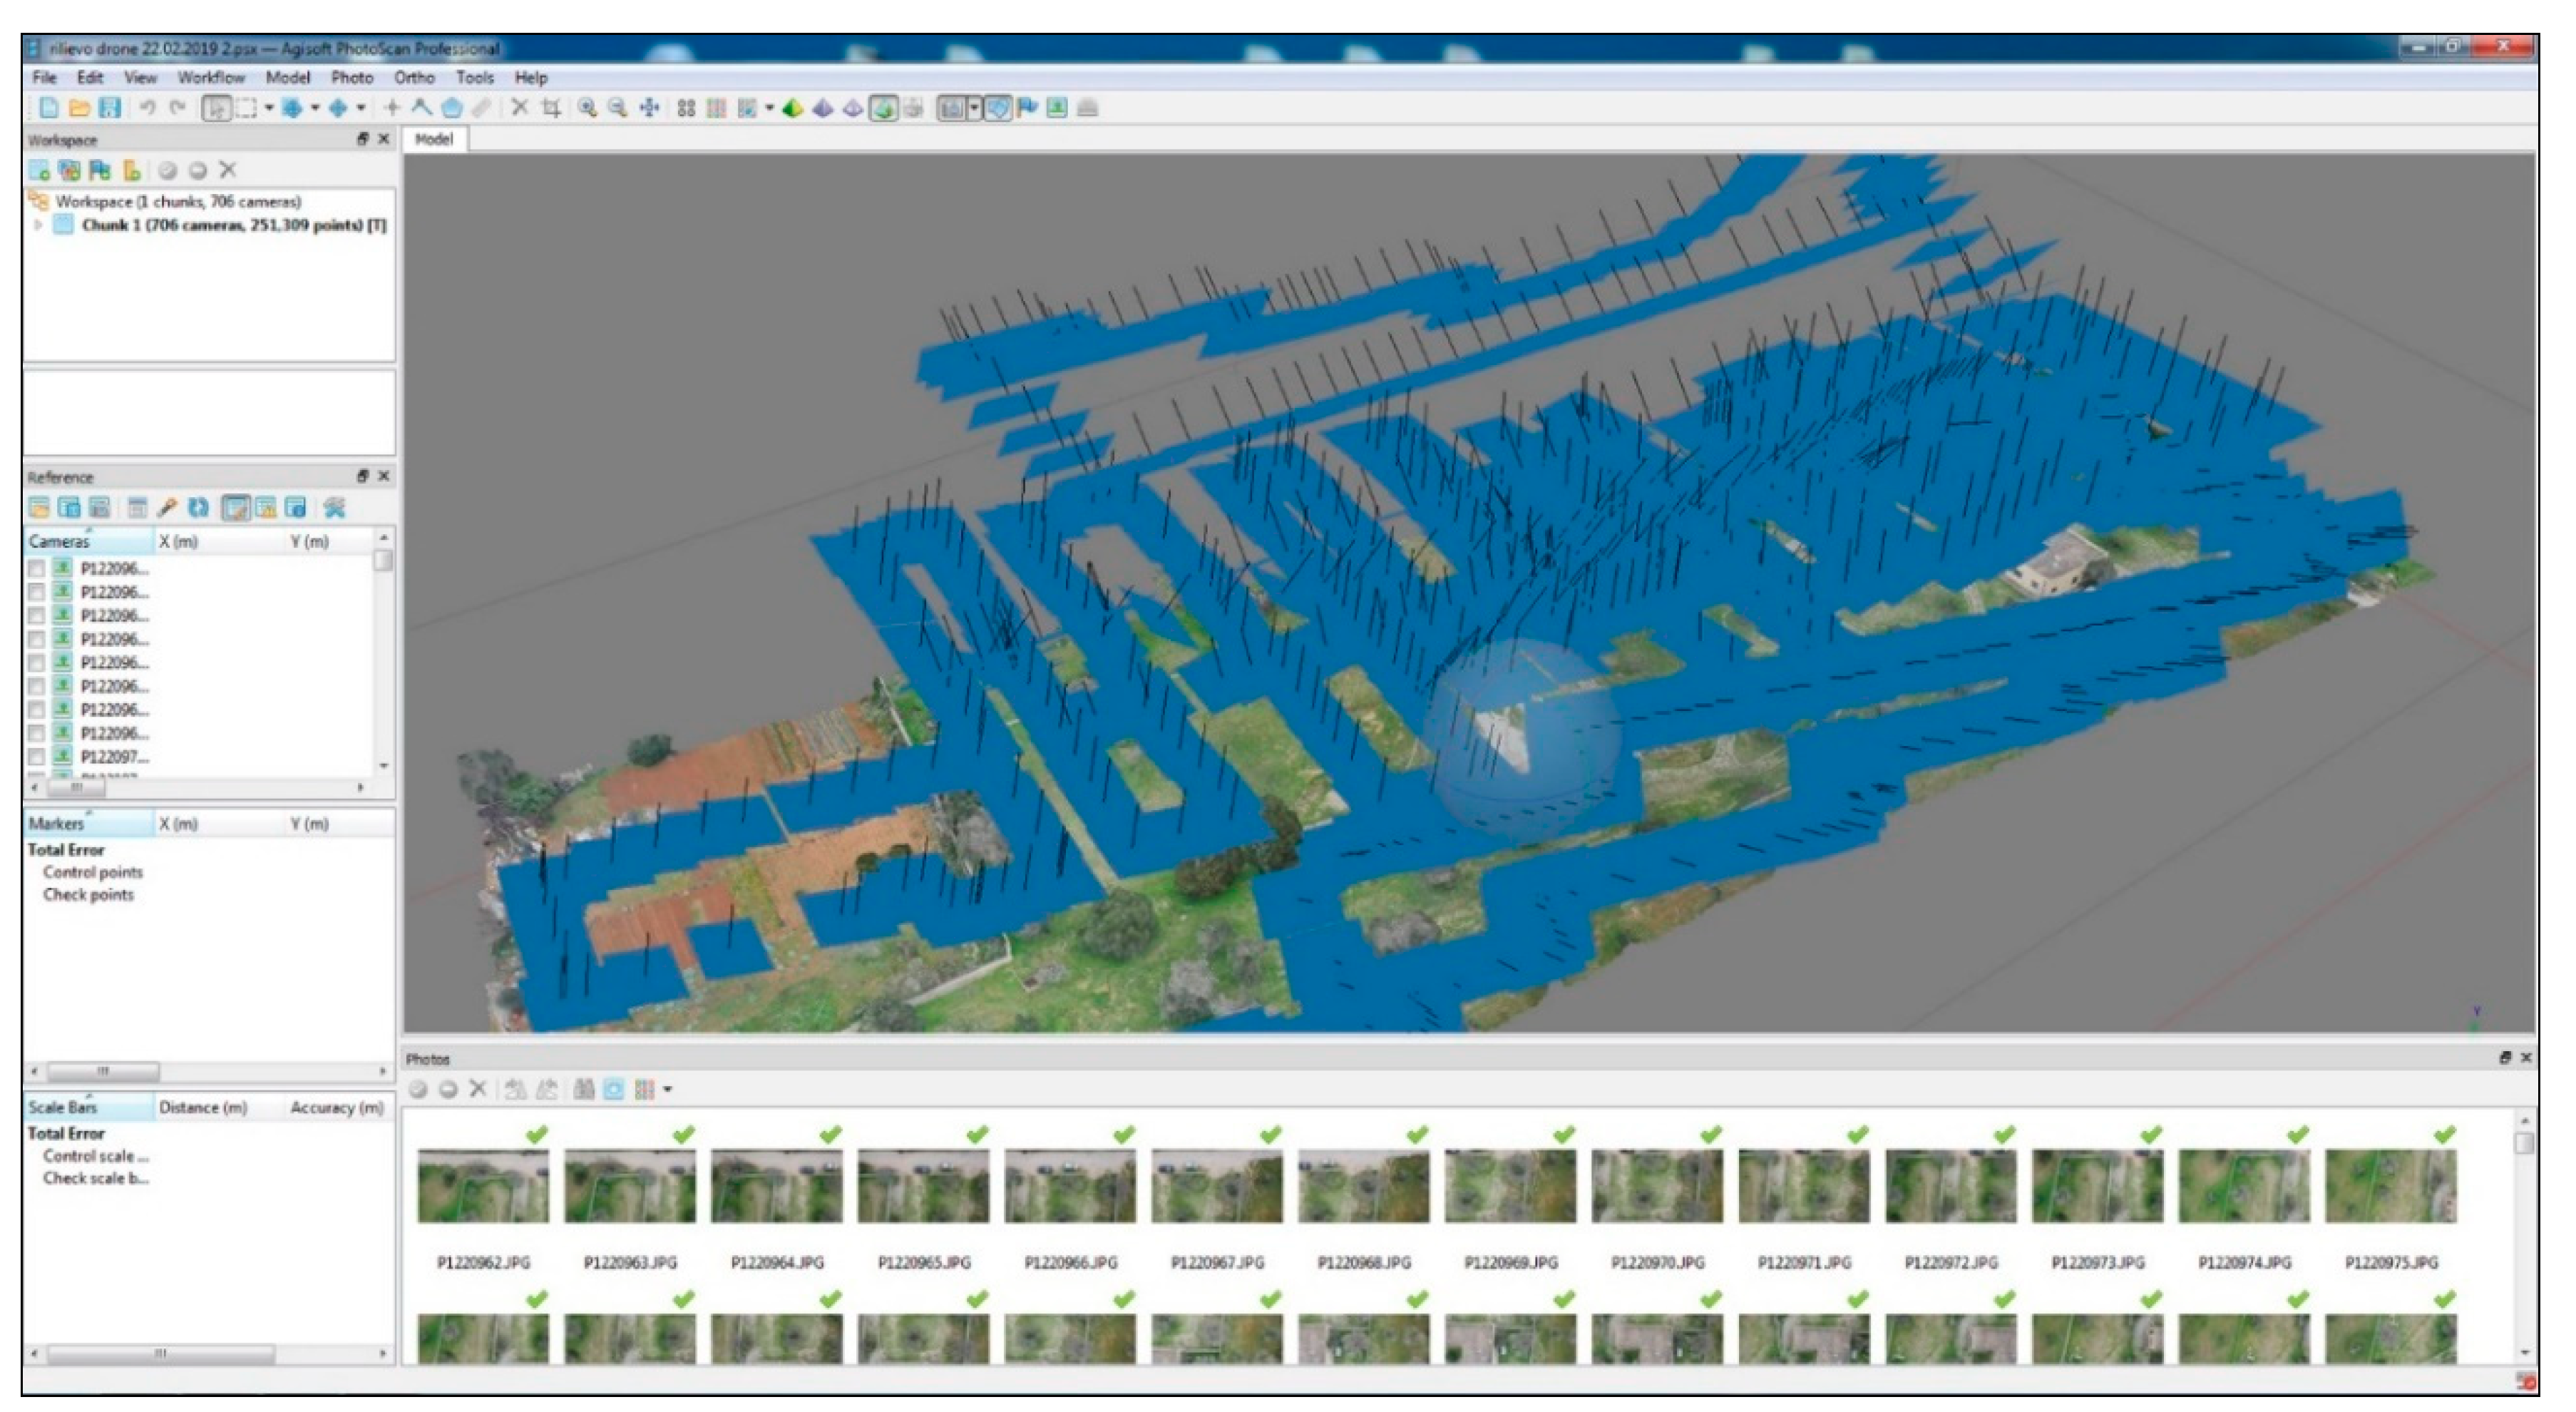
3.1. Topographical and 3D Survey
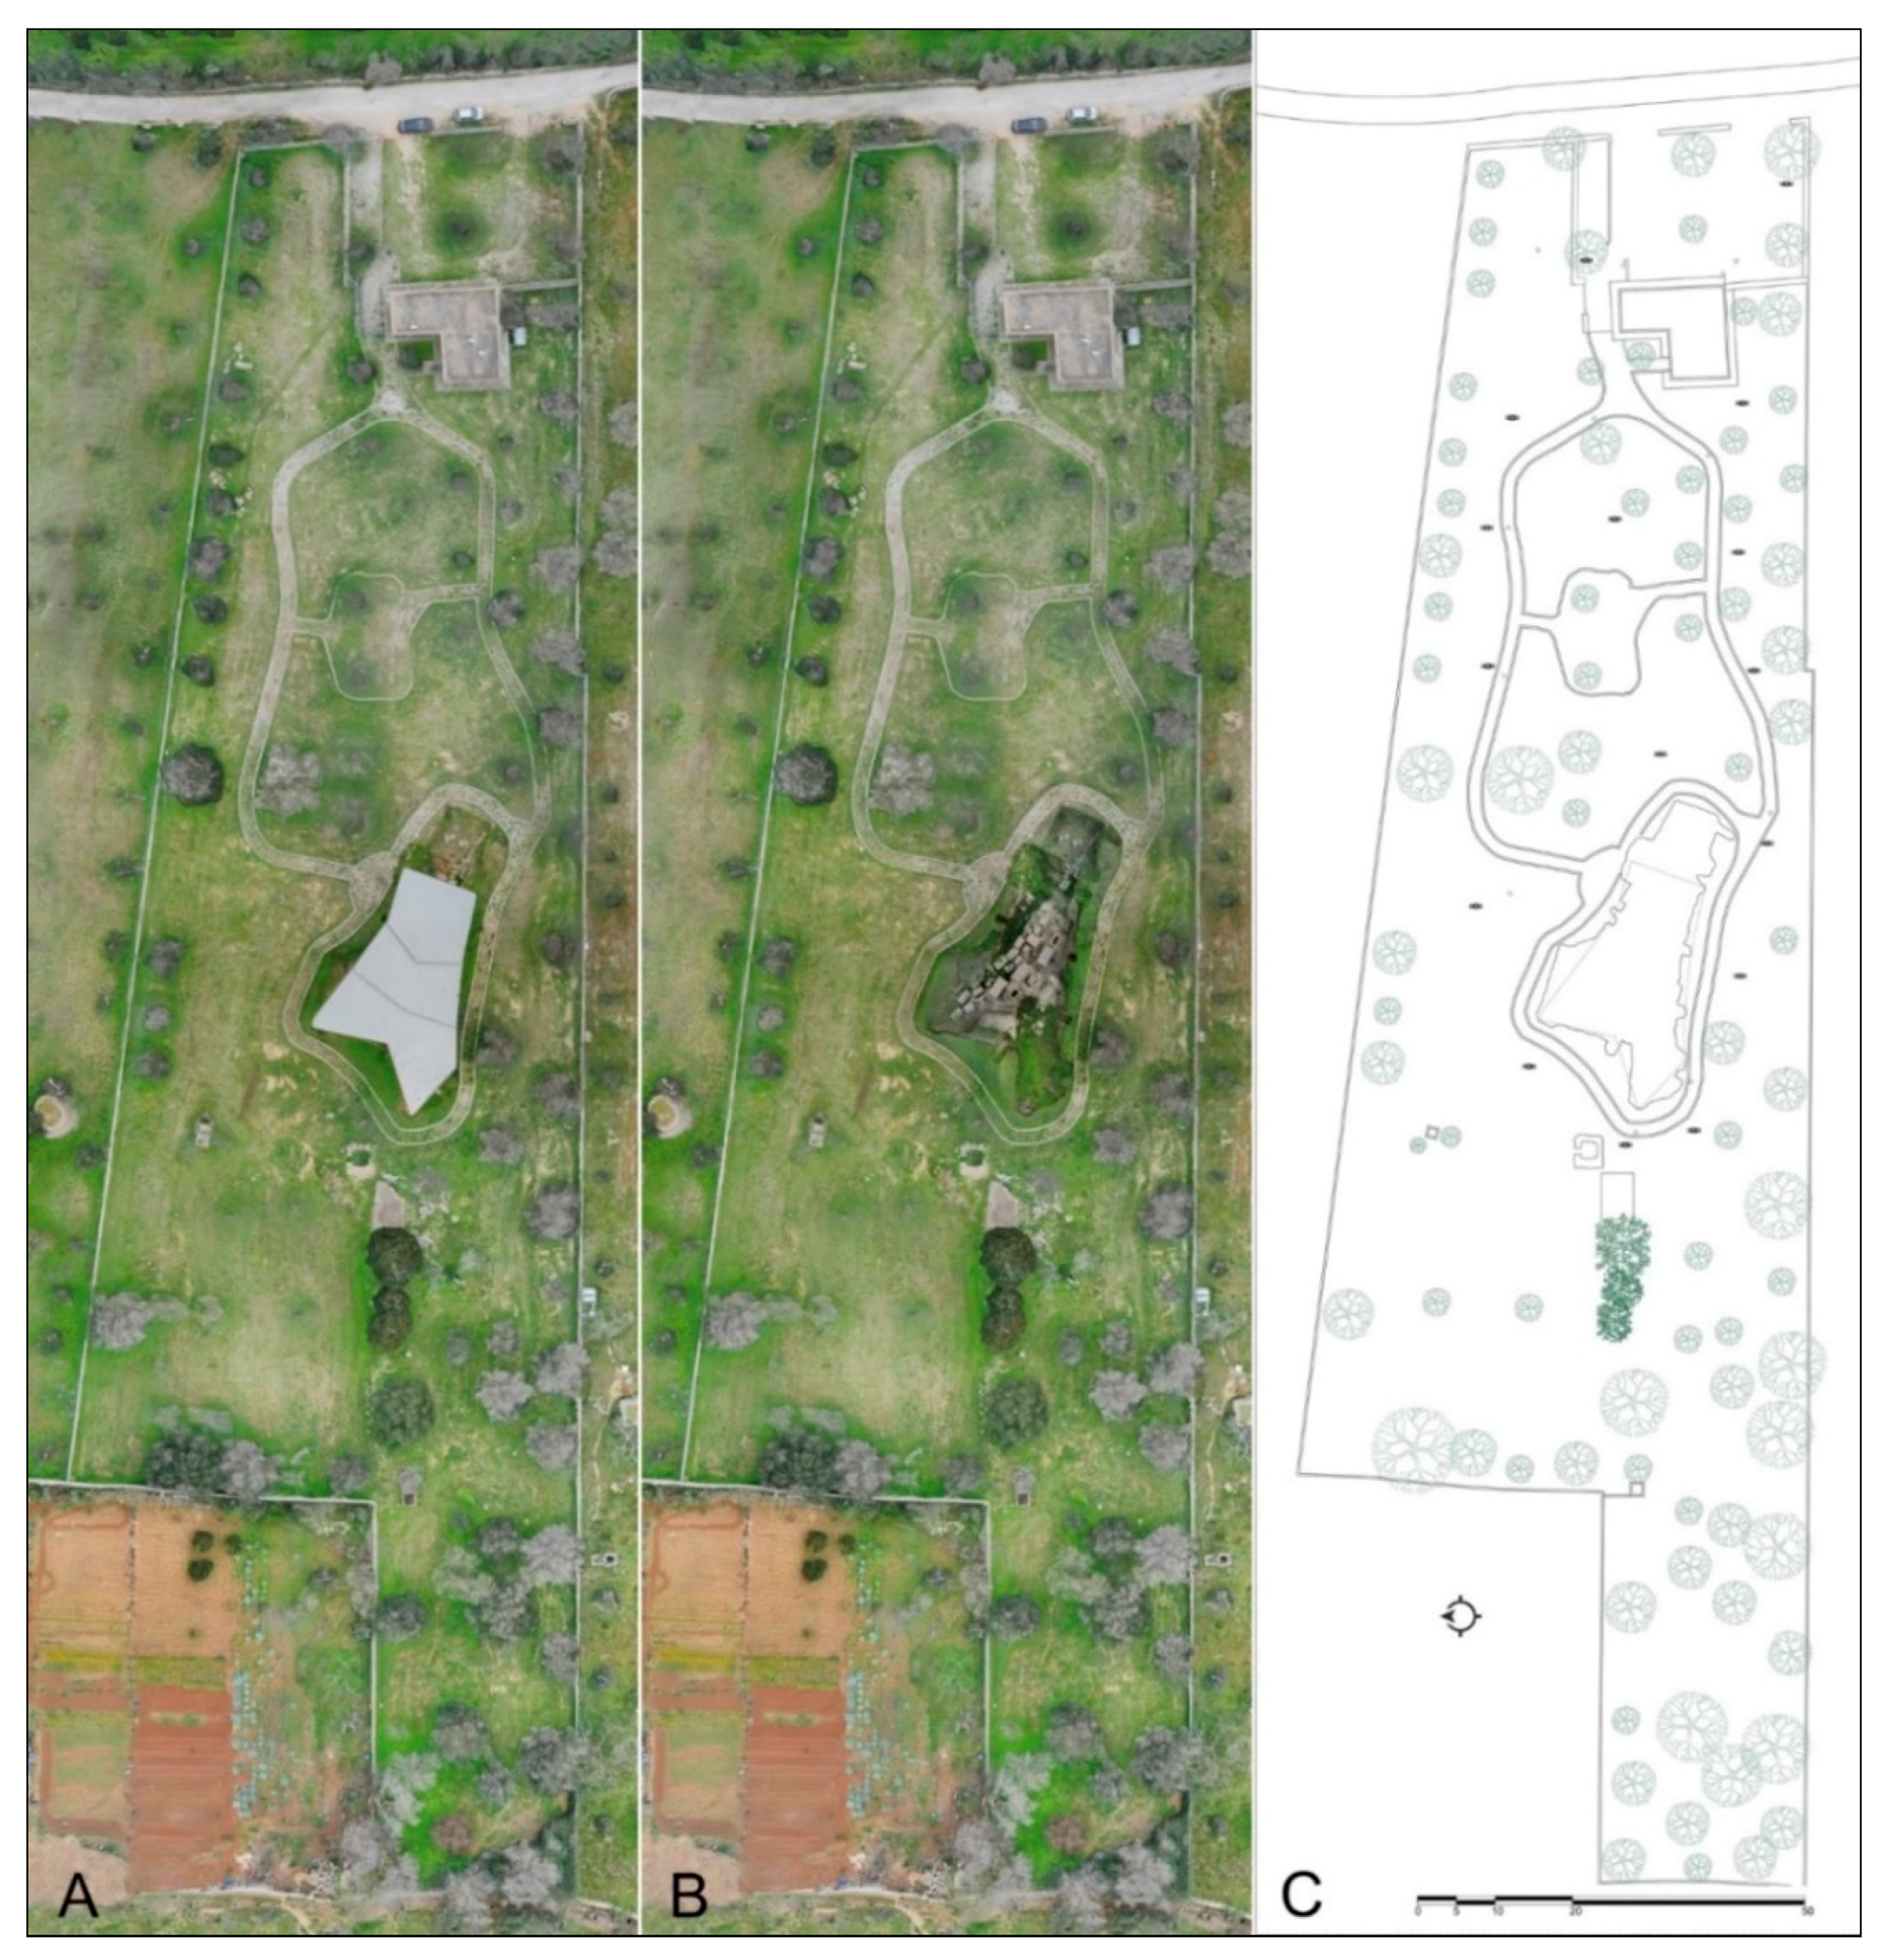
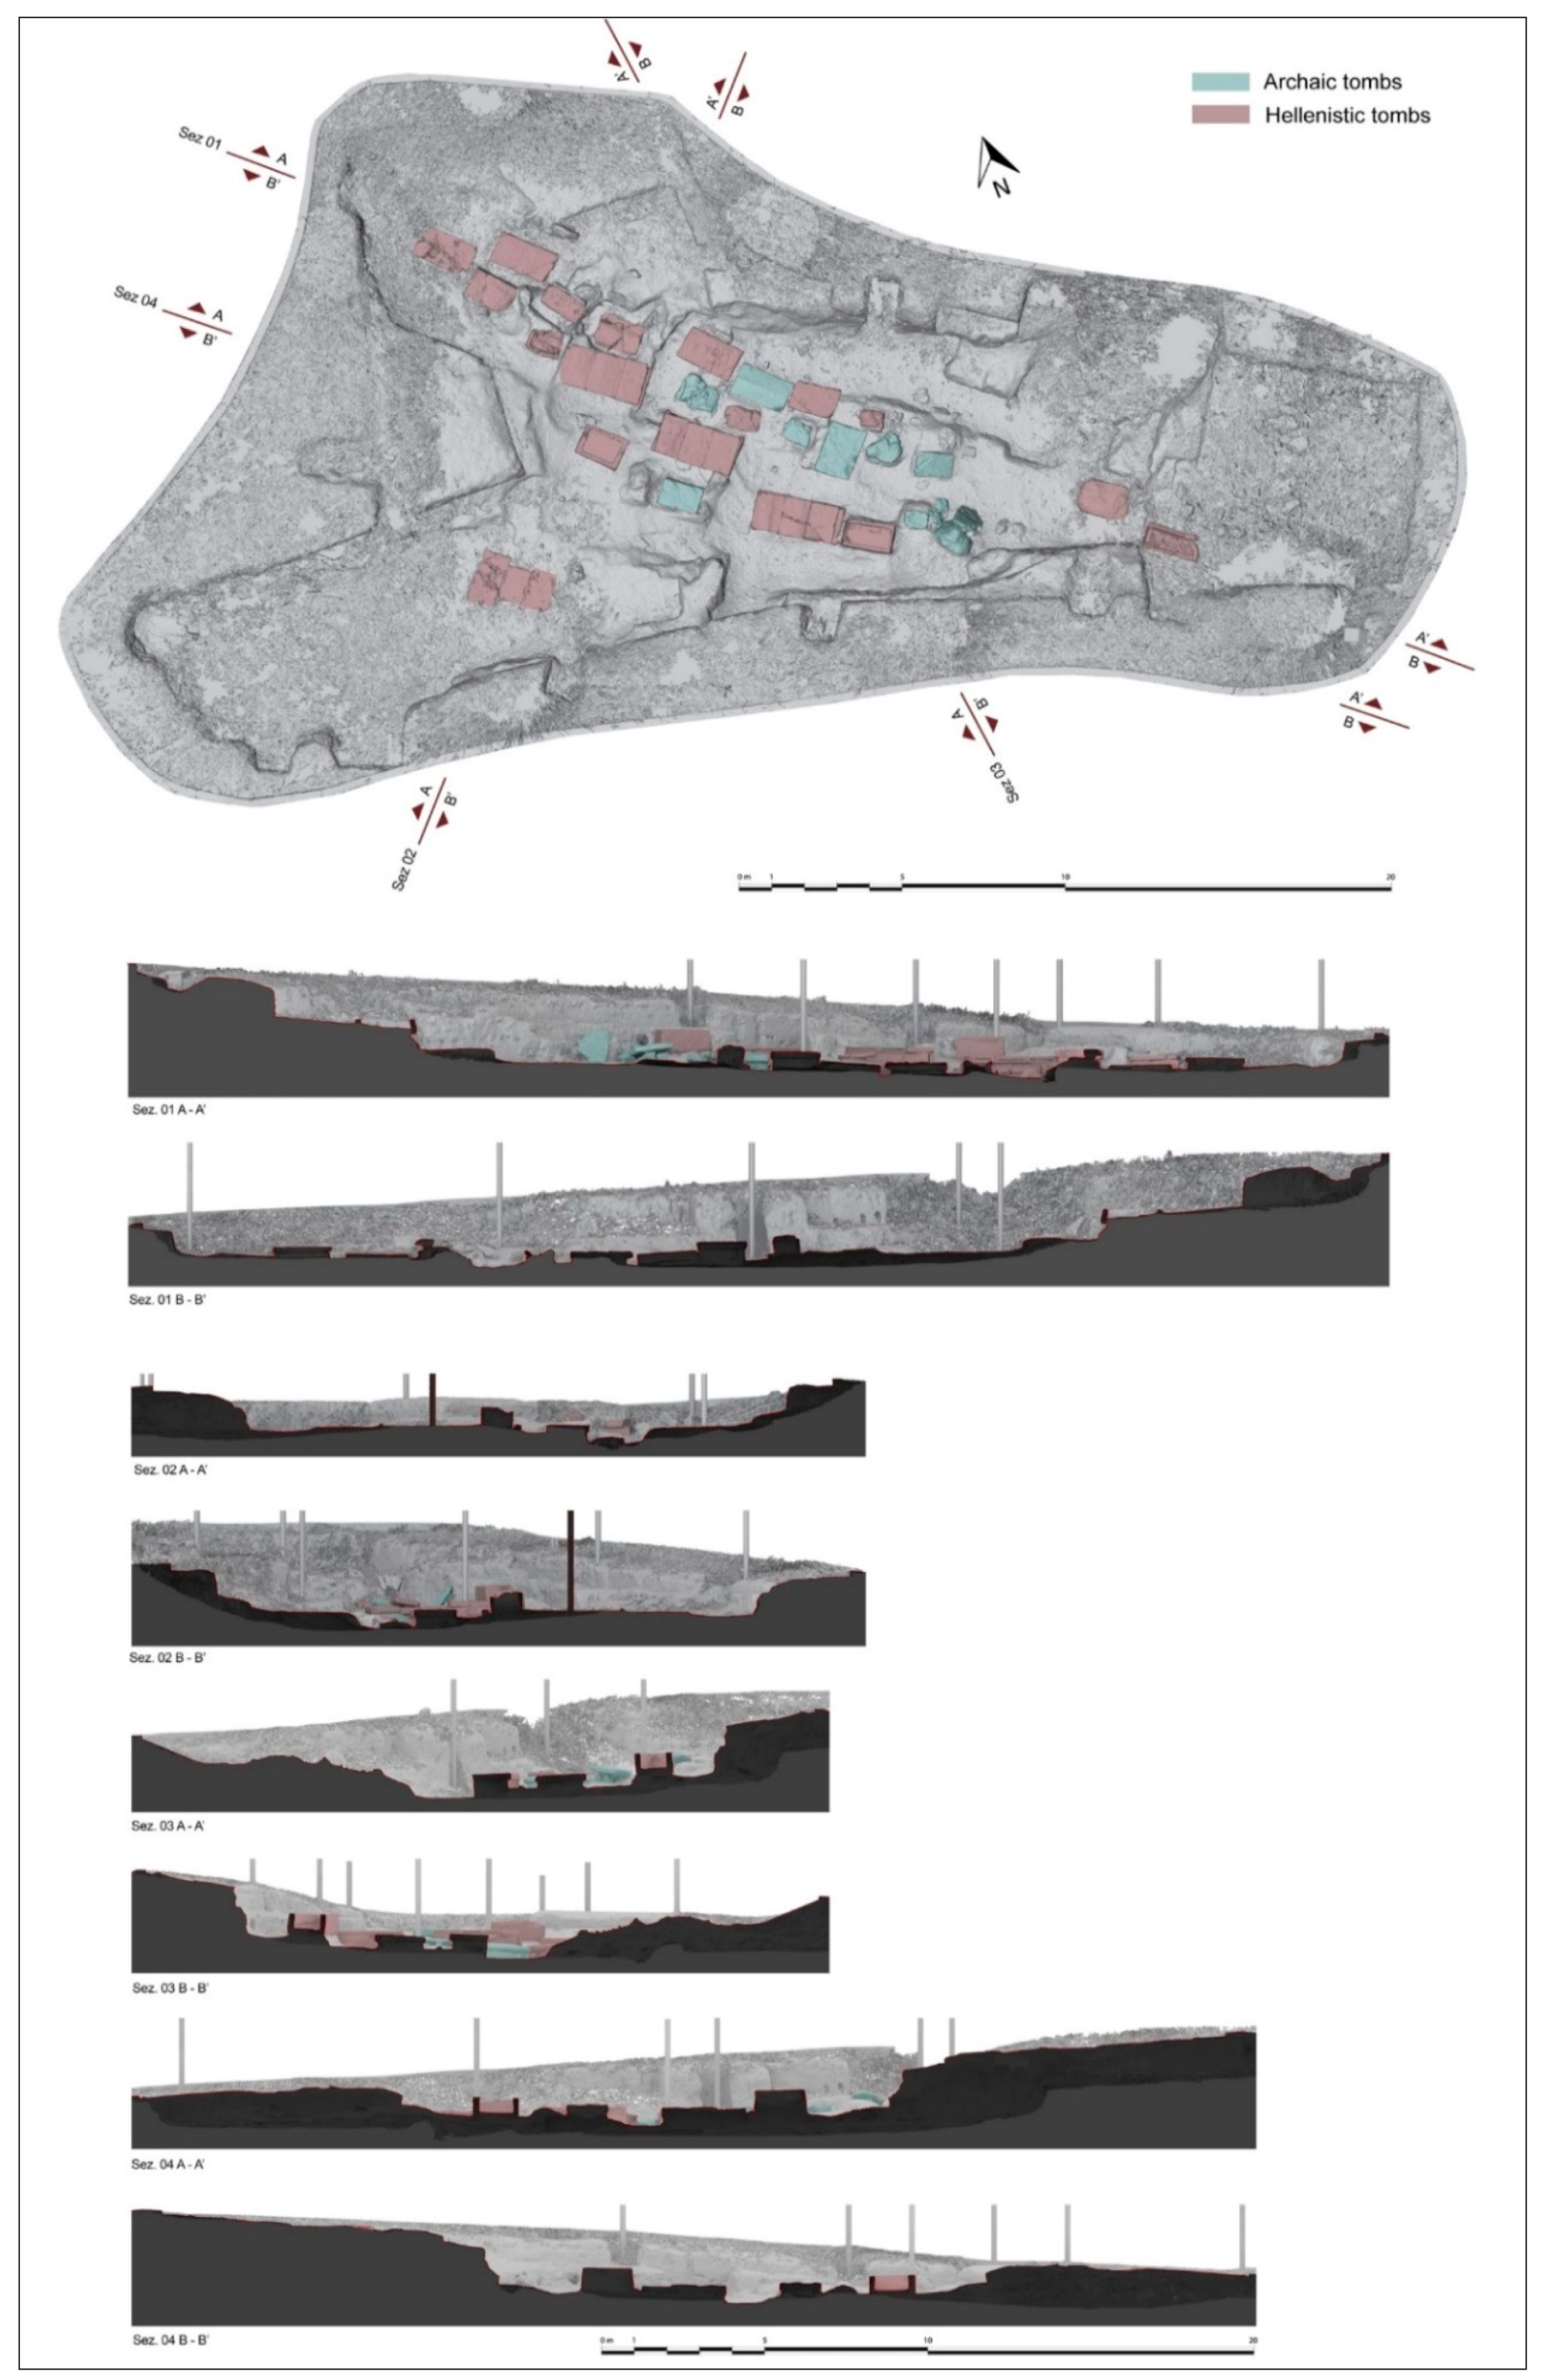
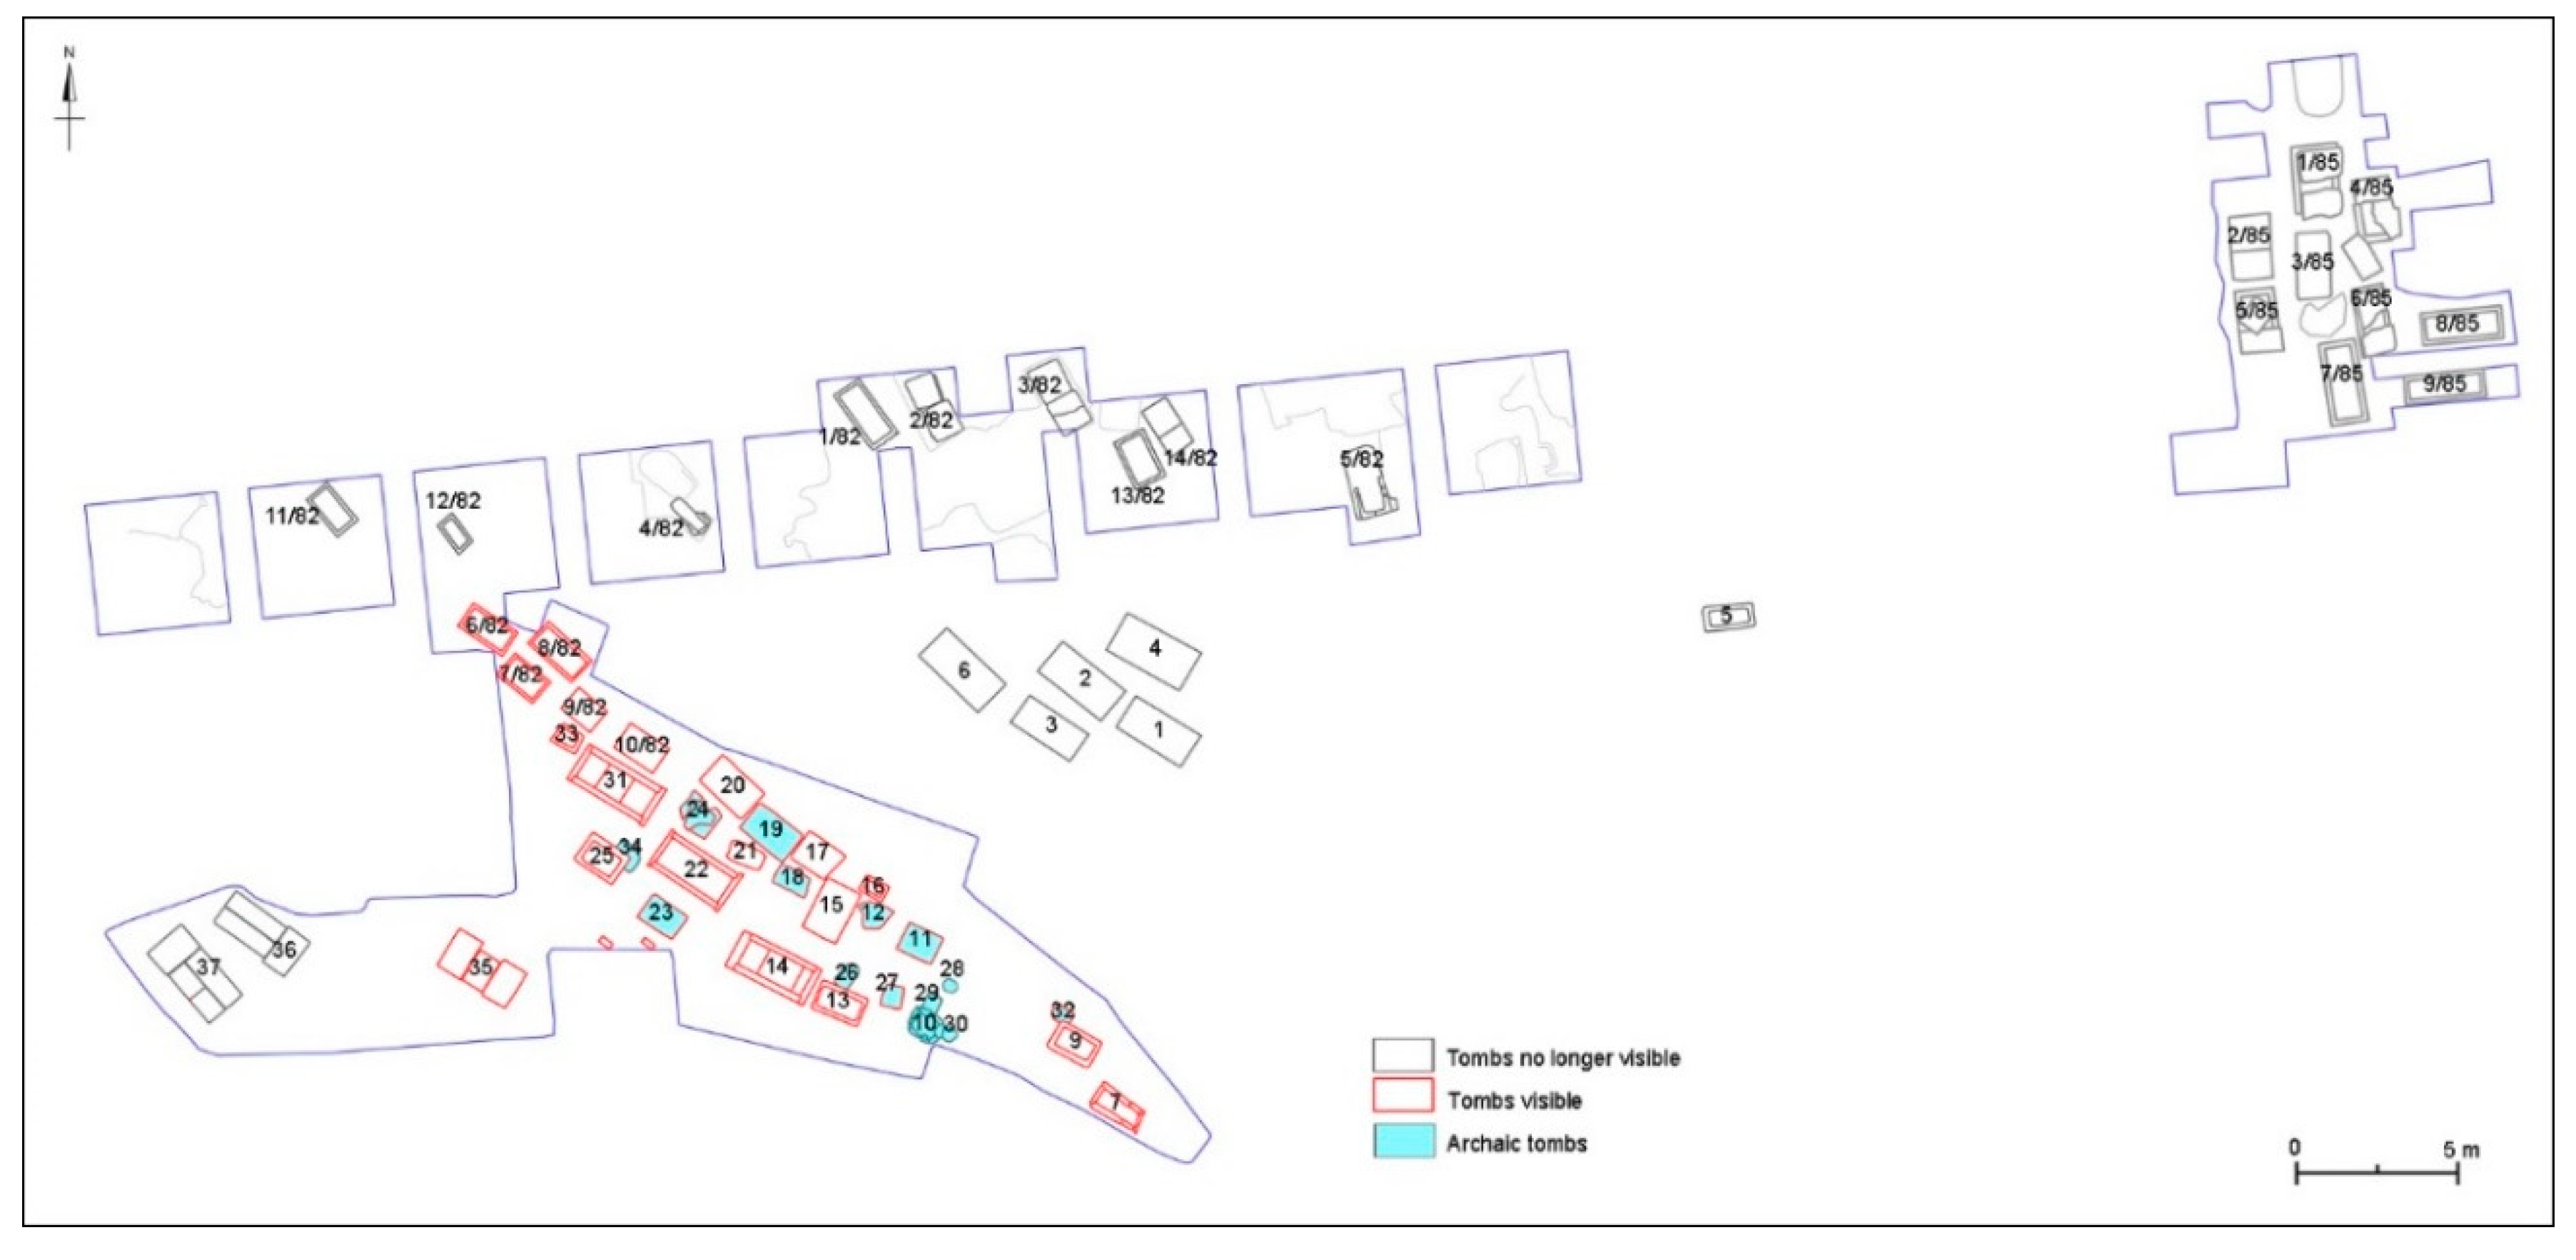
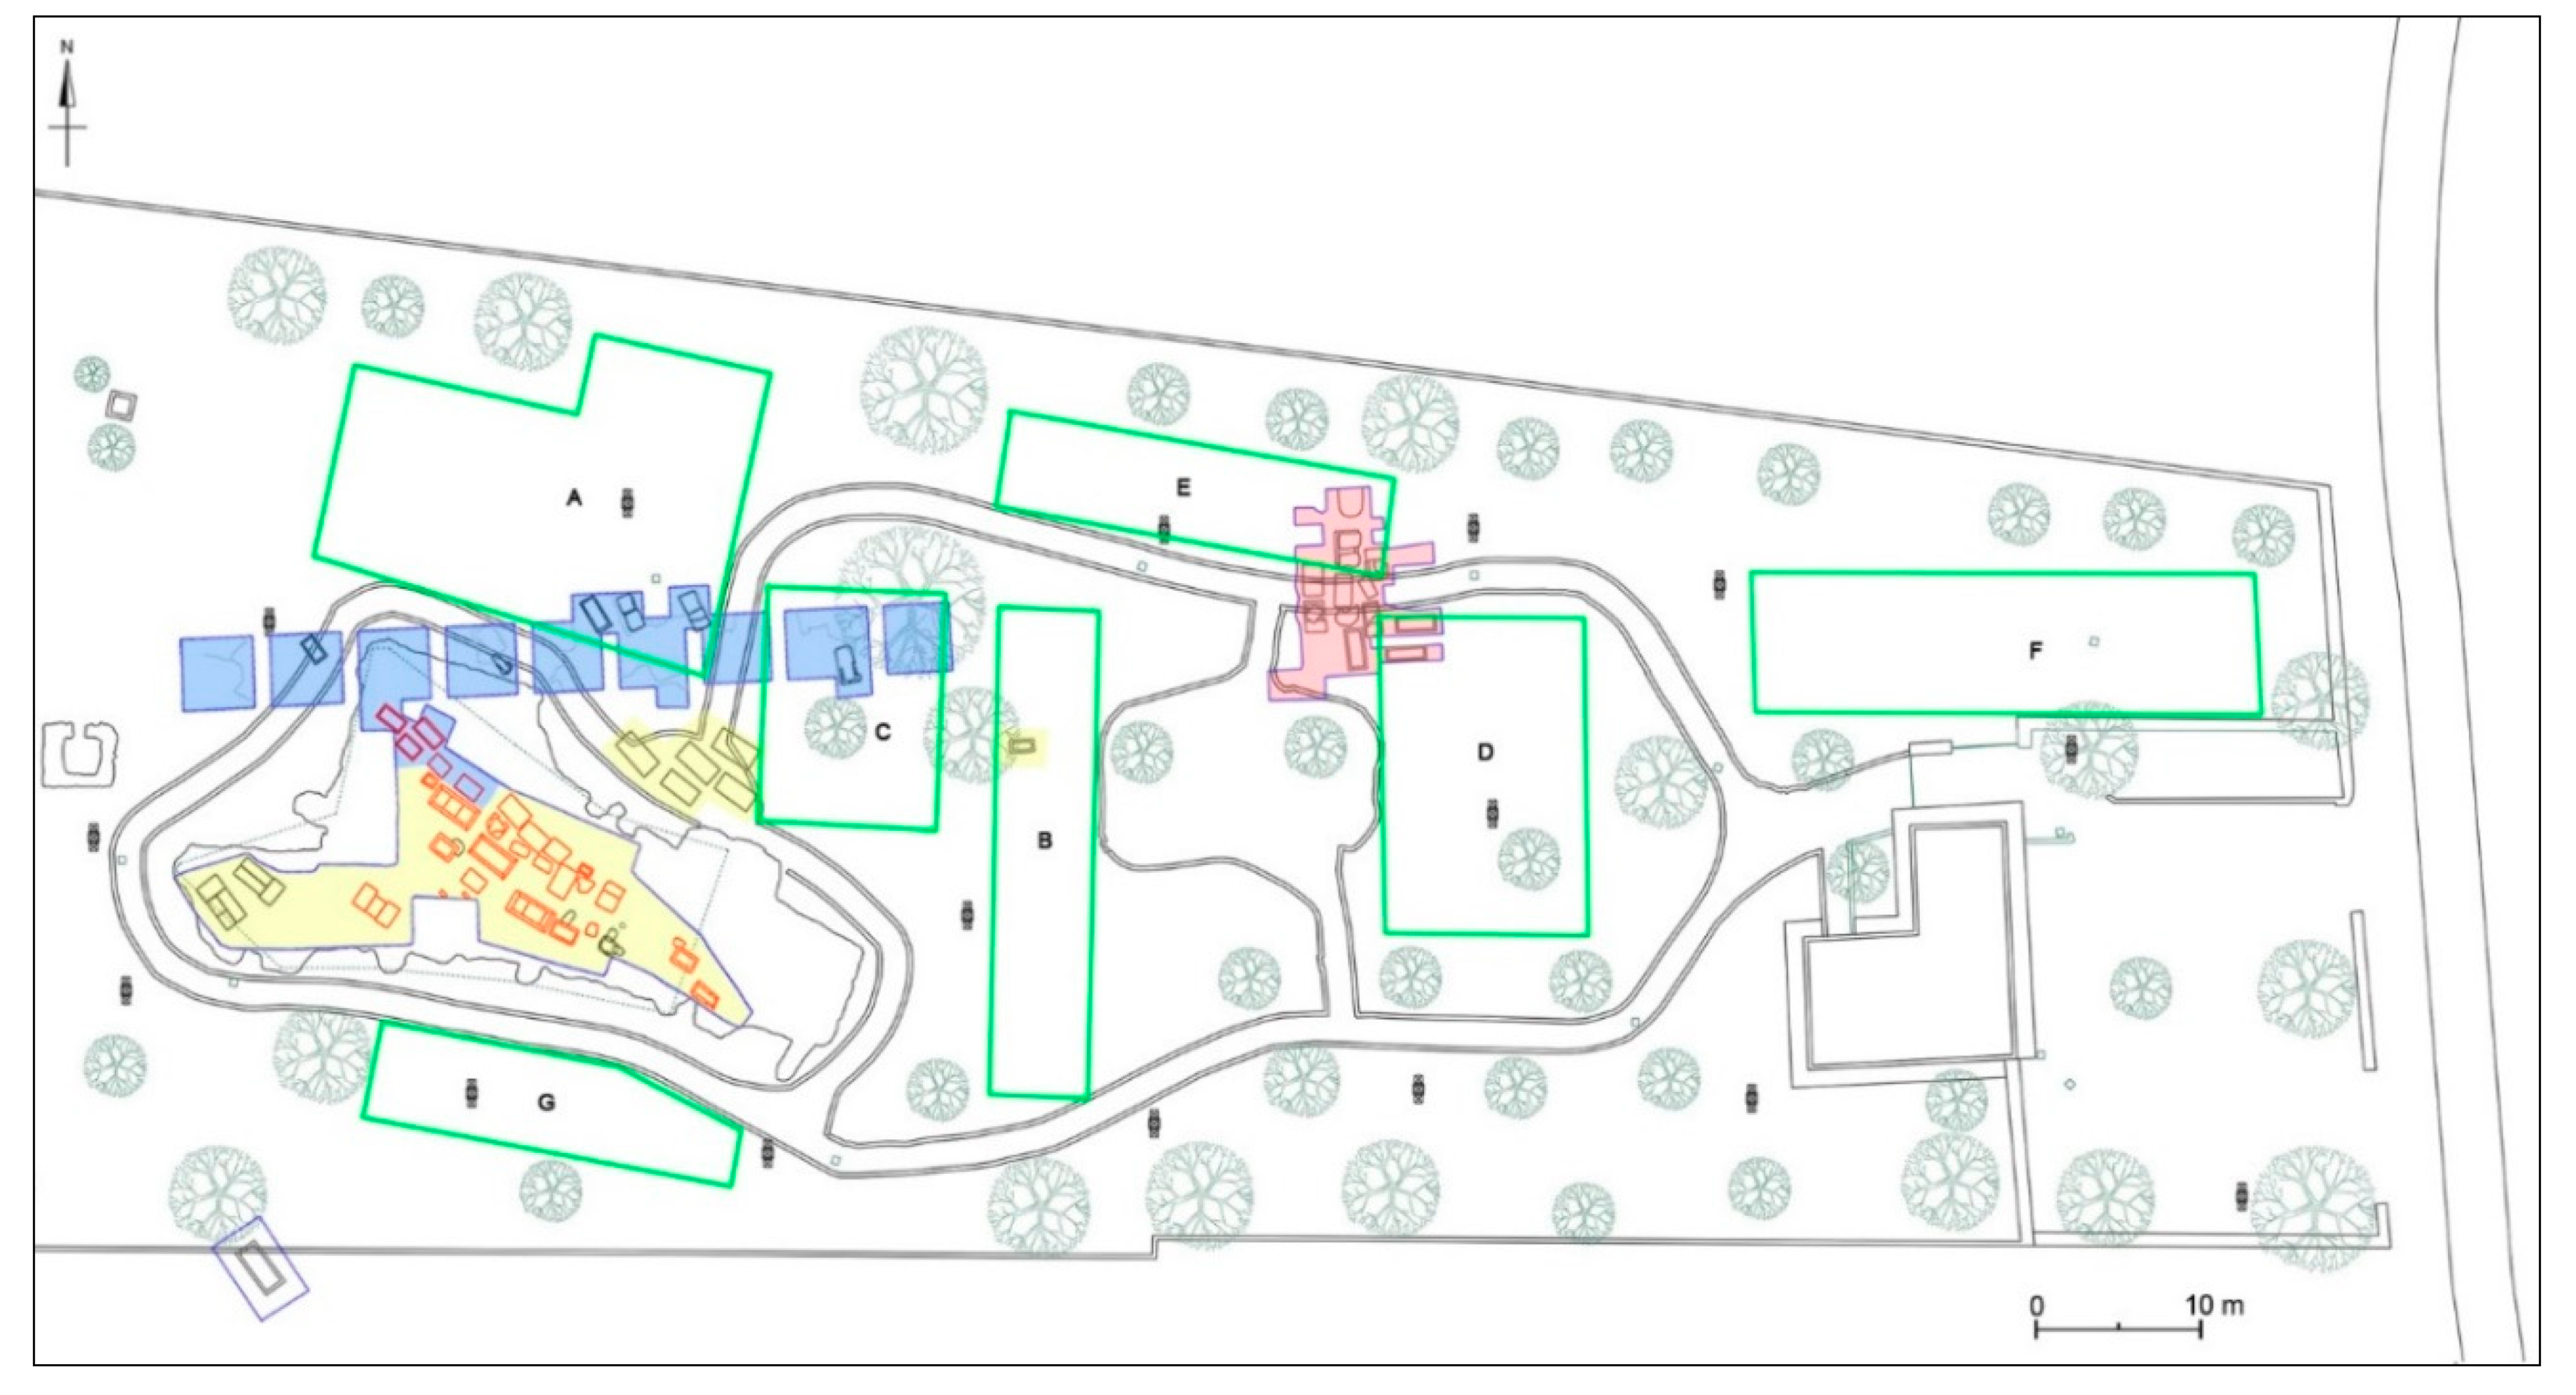
3.2. Archaeological Map
4. Geophysical Survey
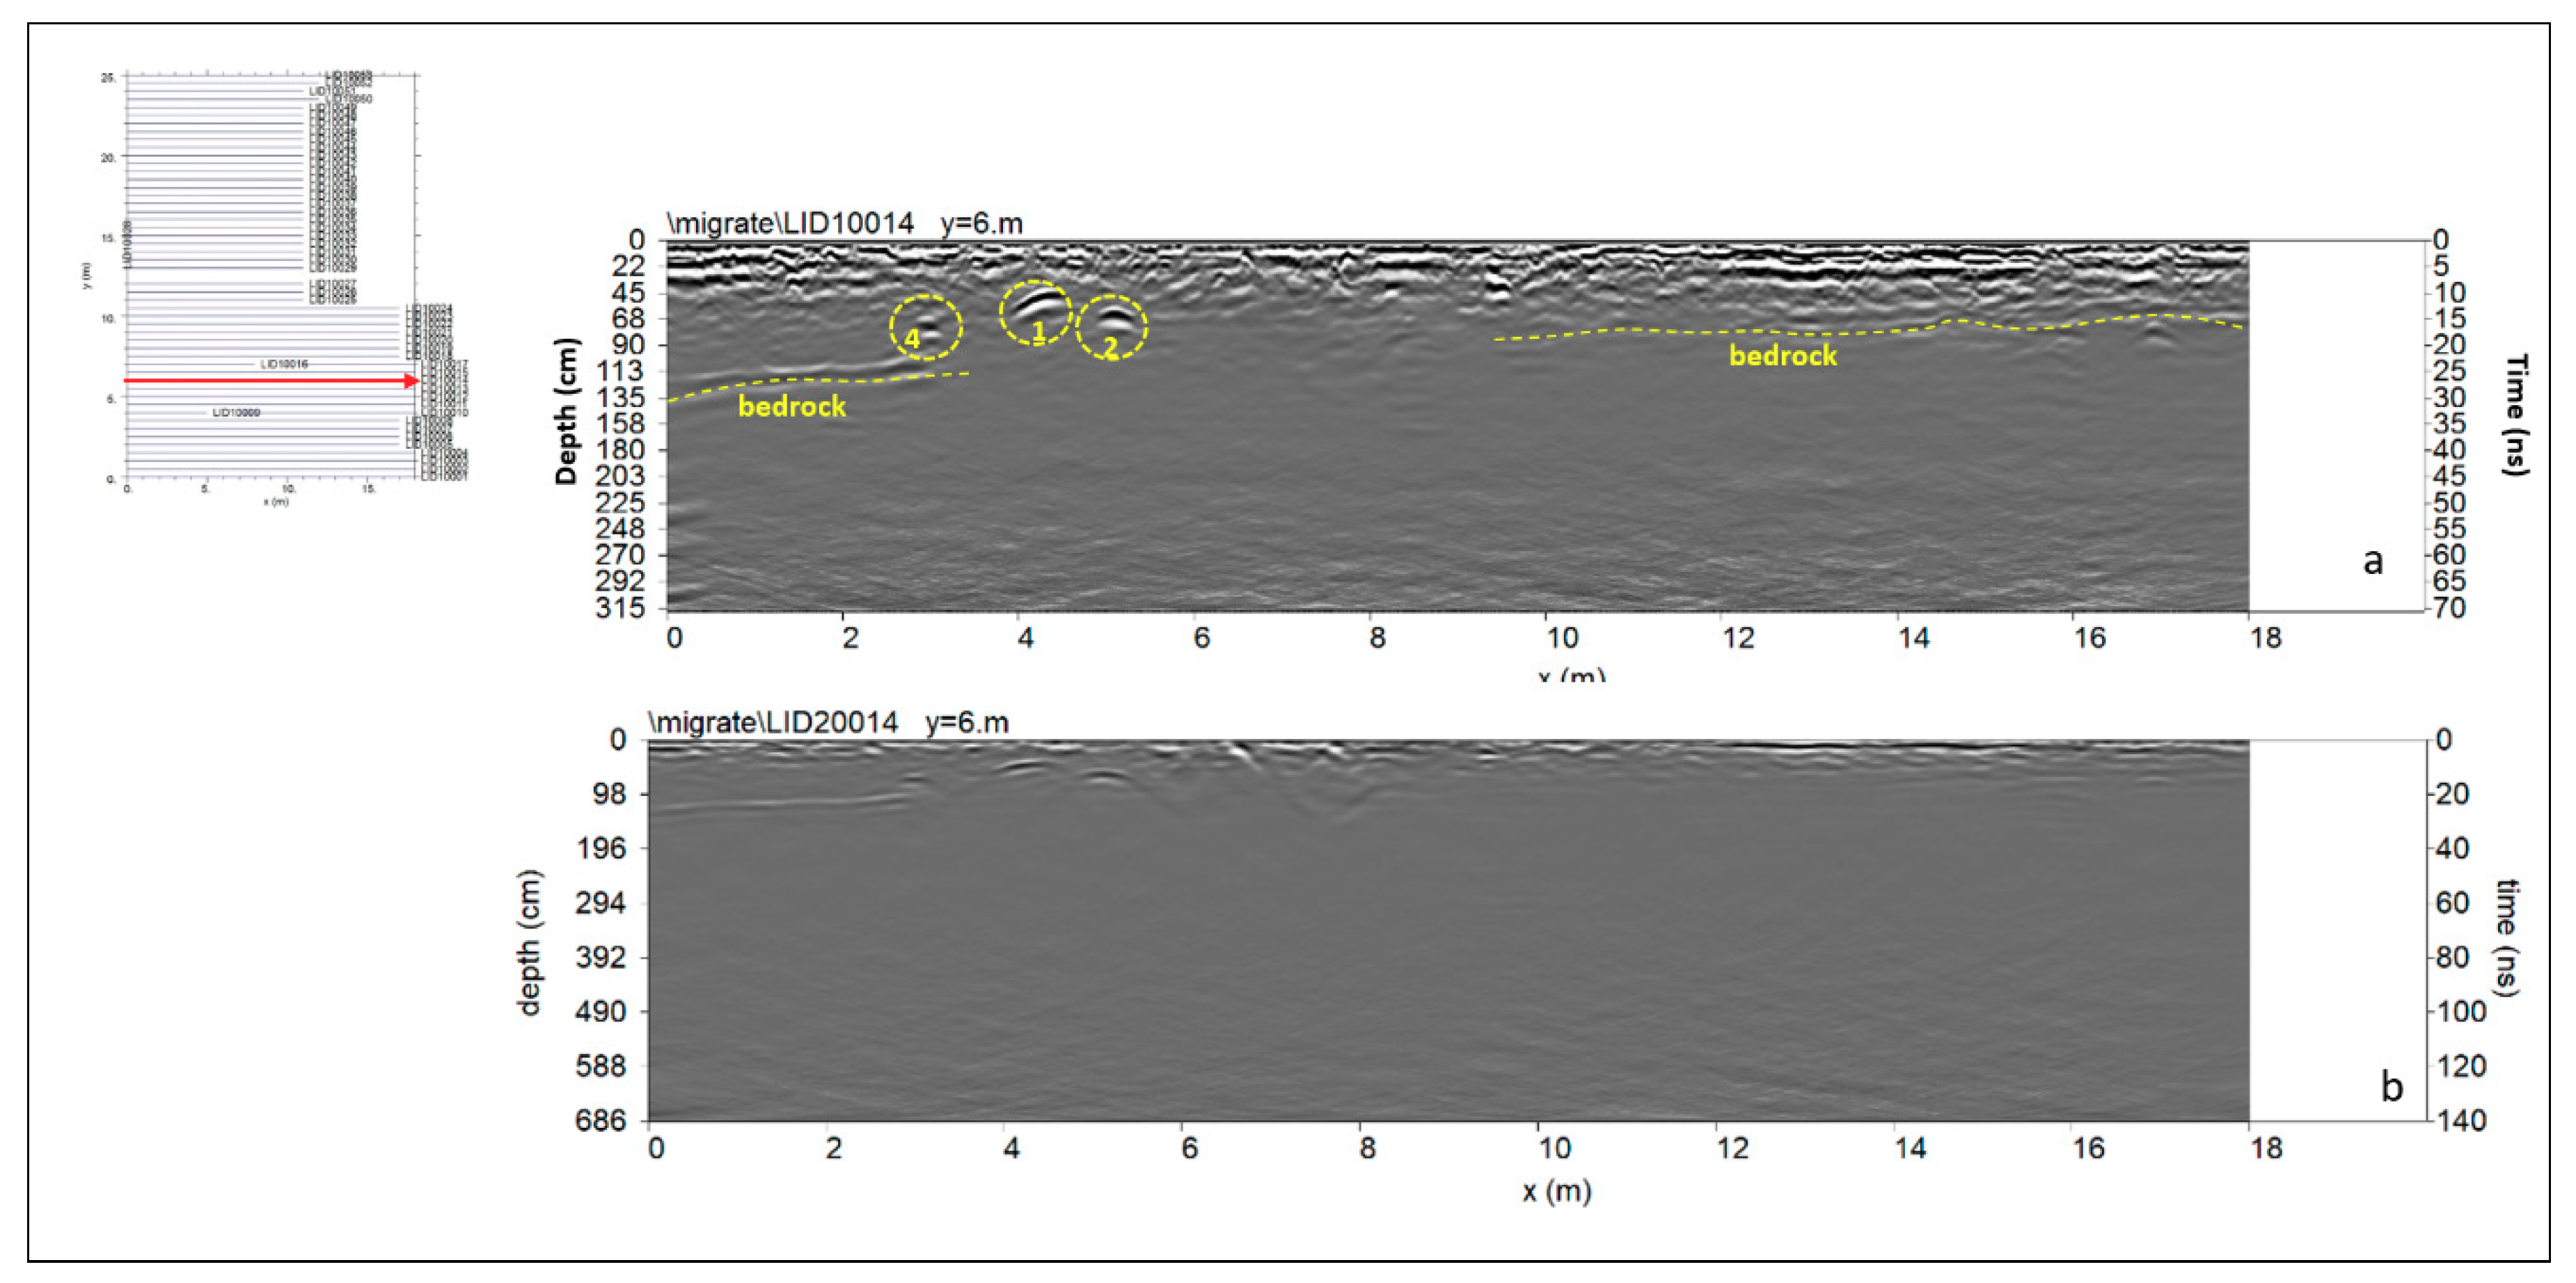
4.1. GPR Data Acquisition and Analysis
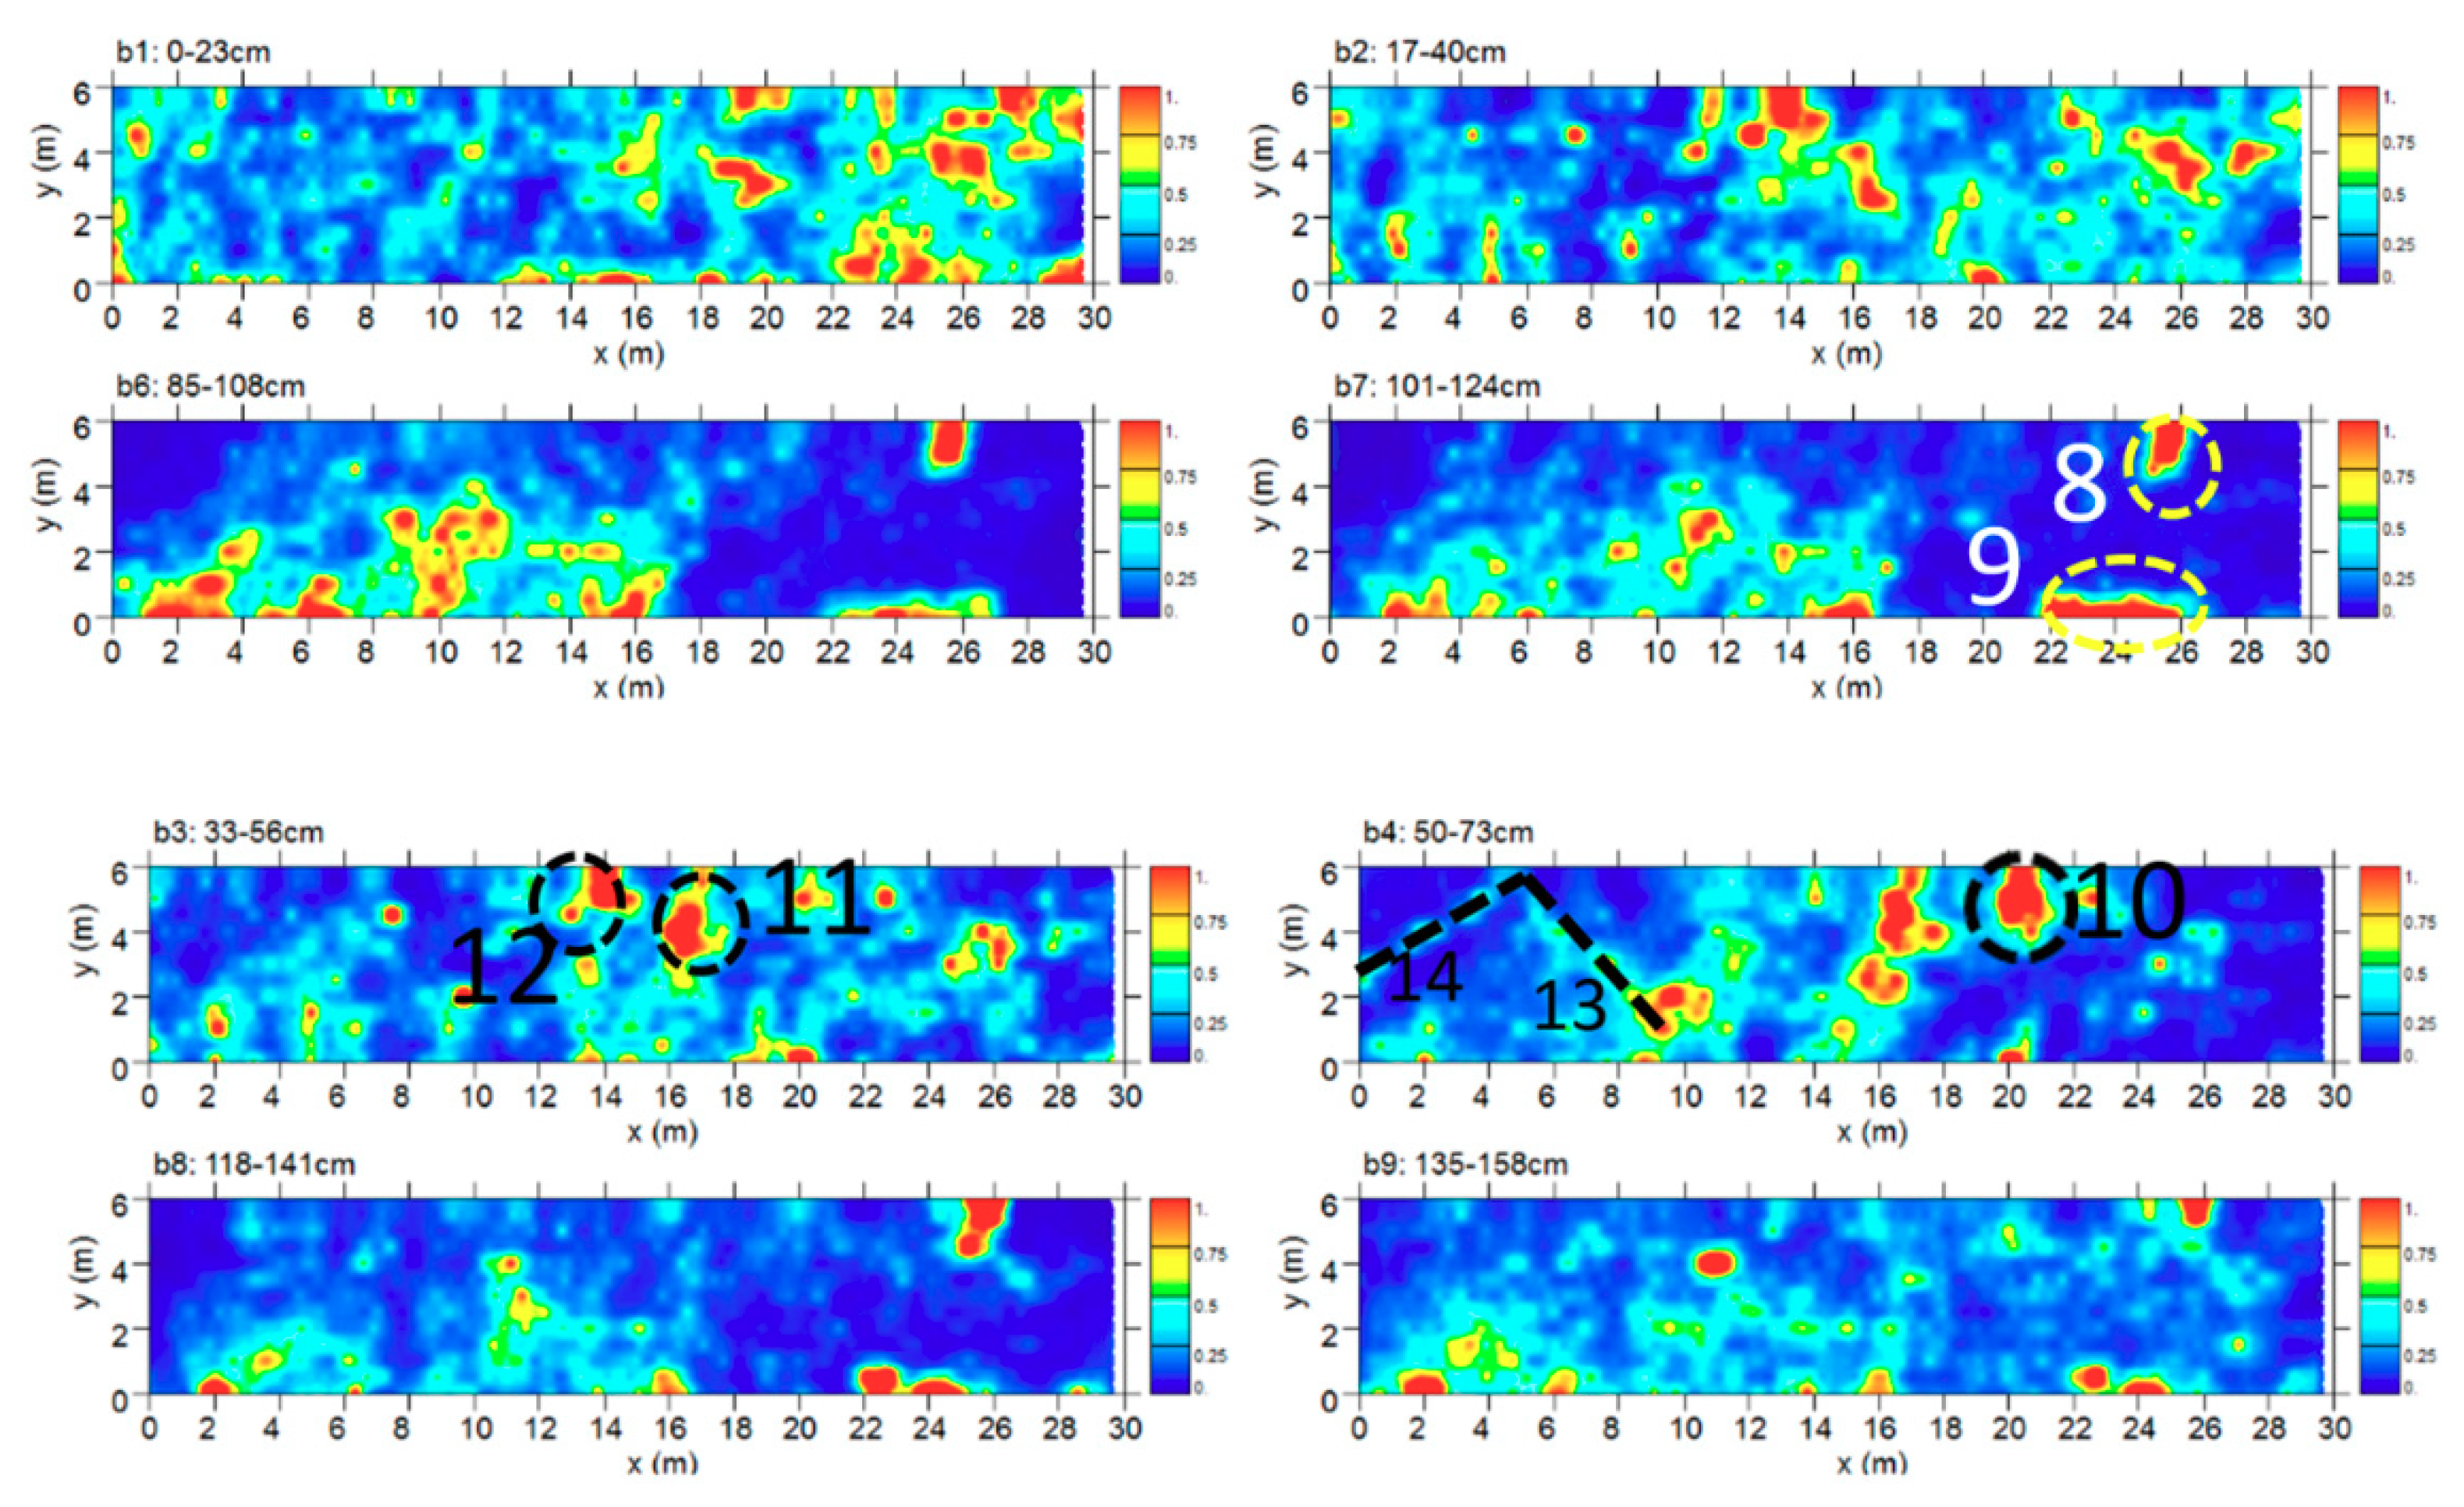
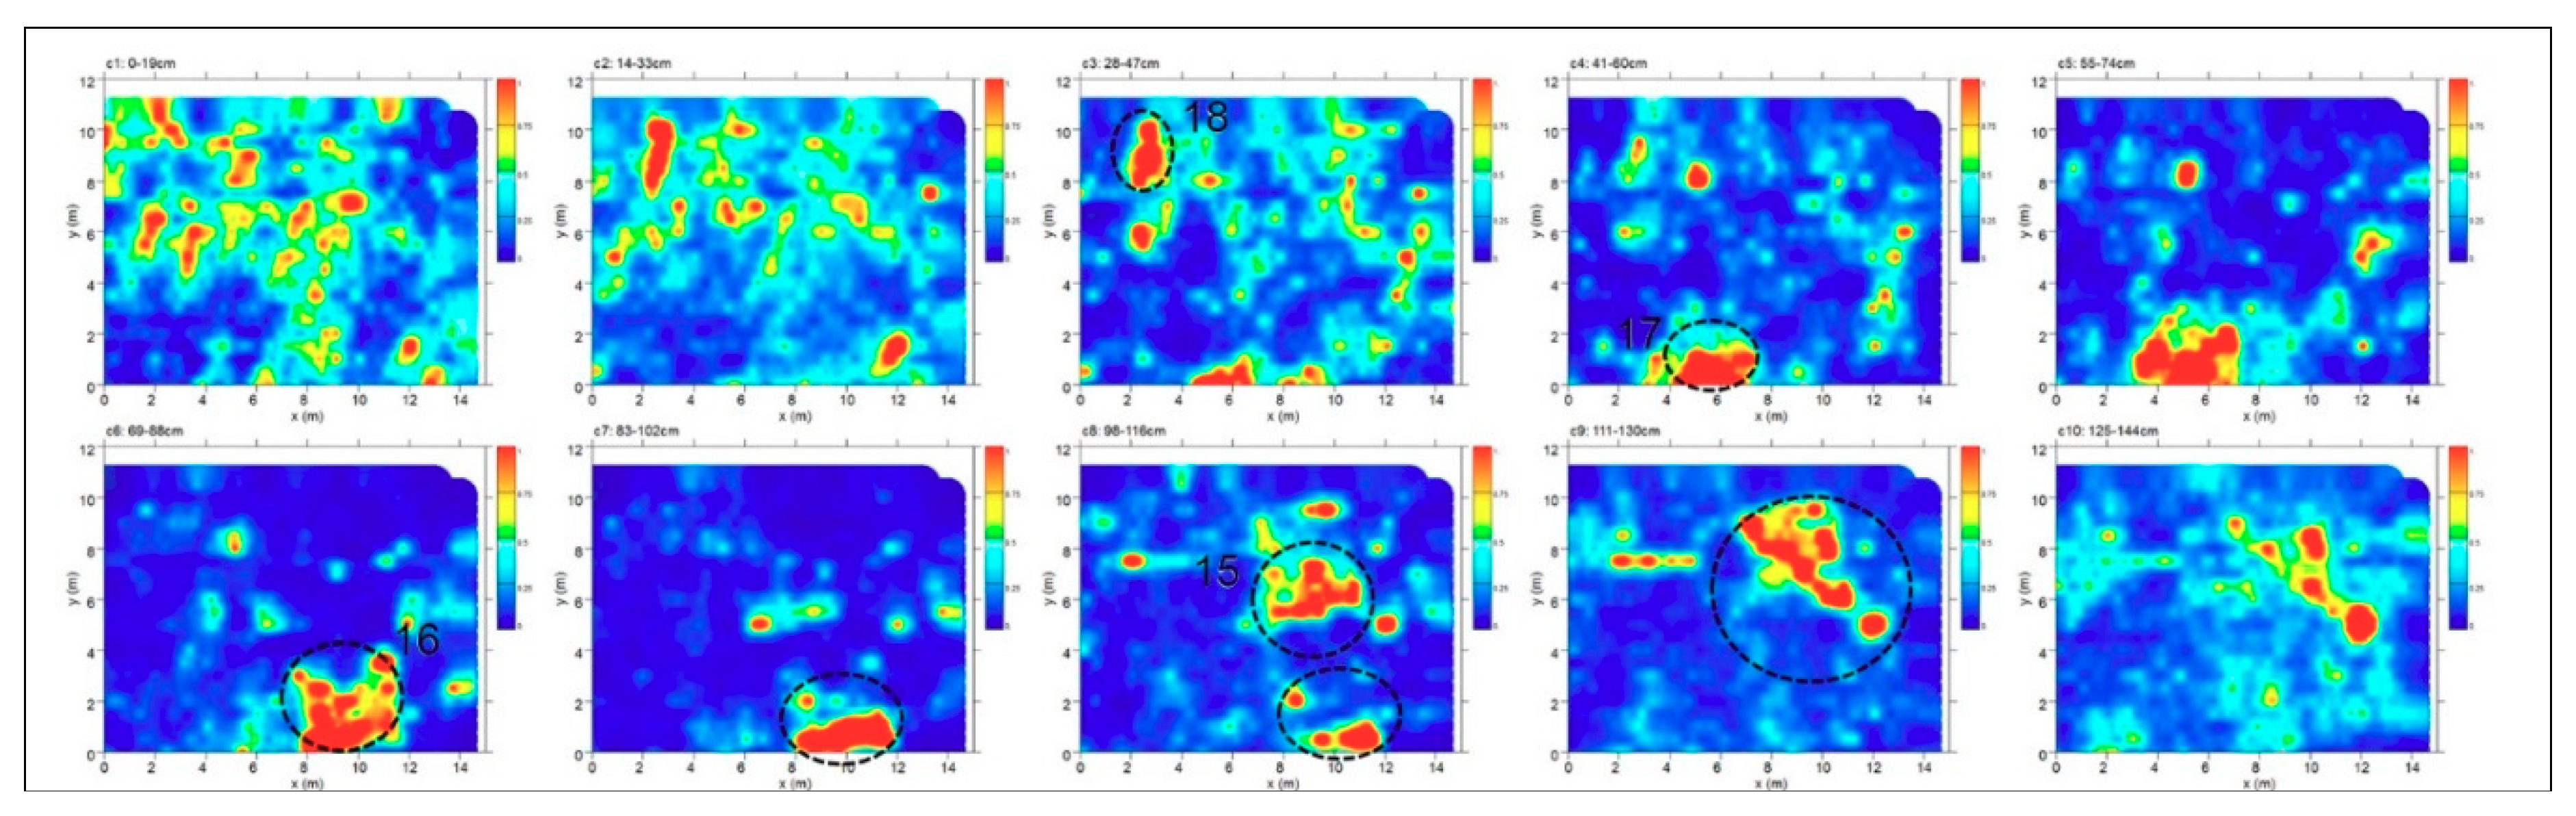
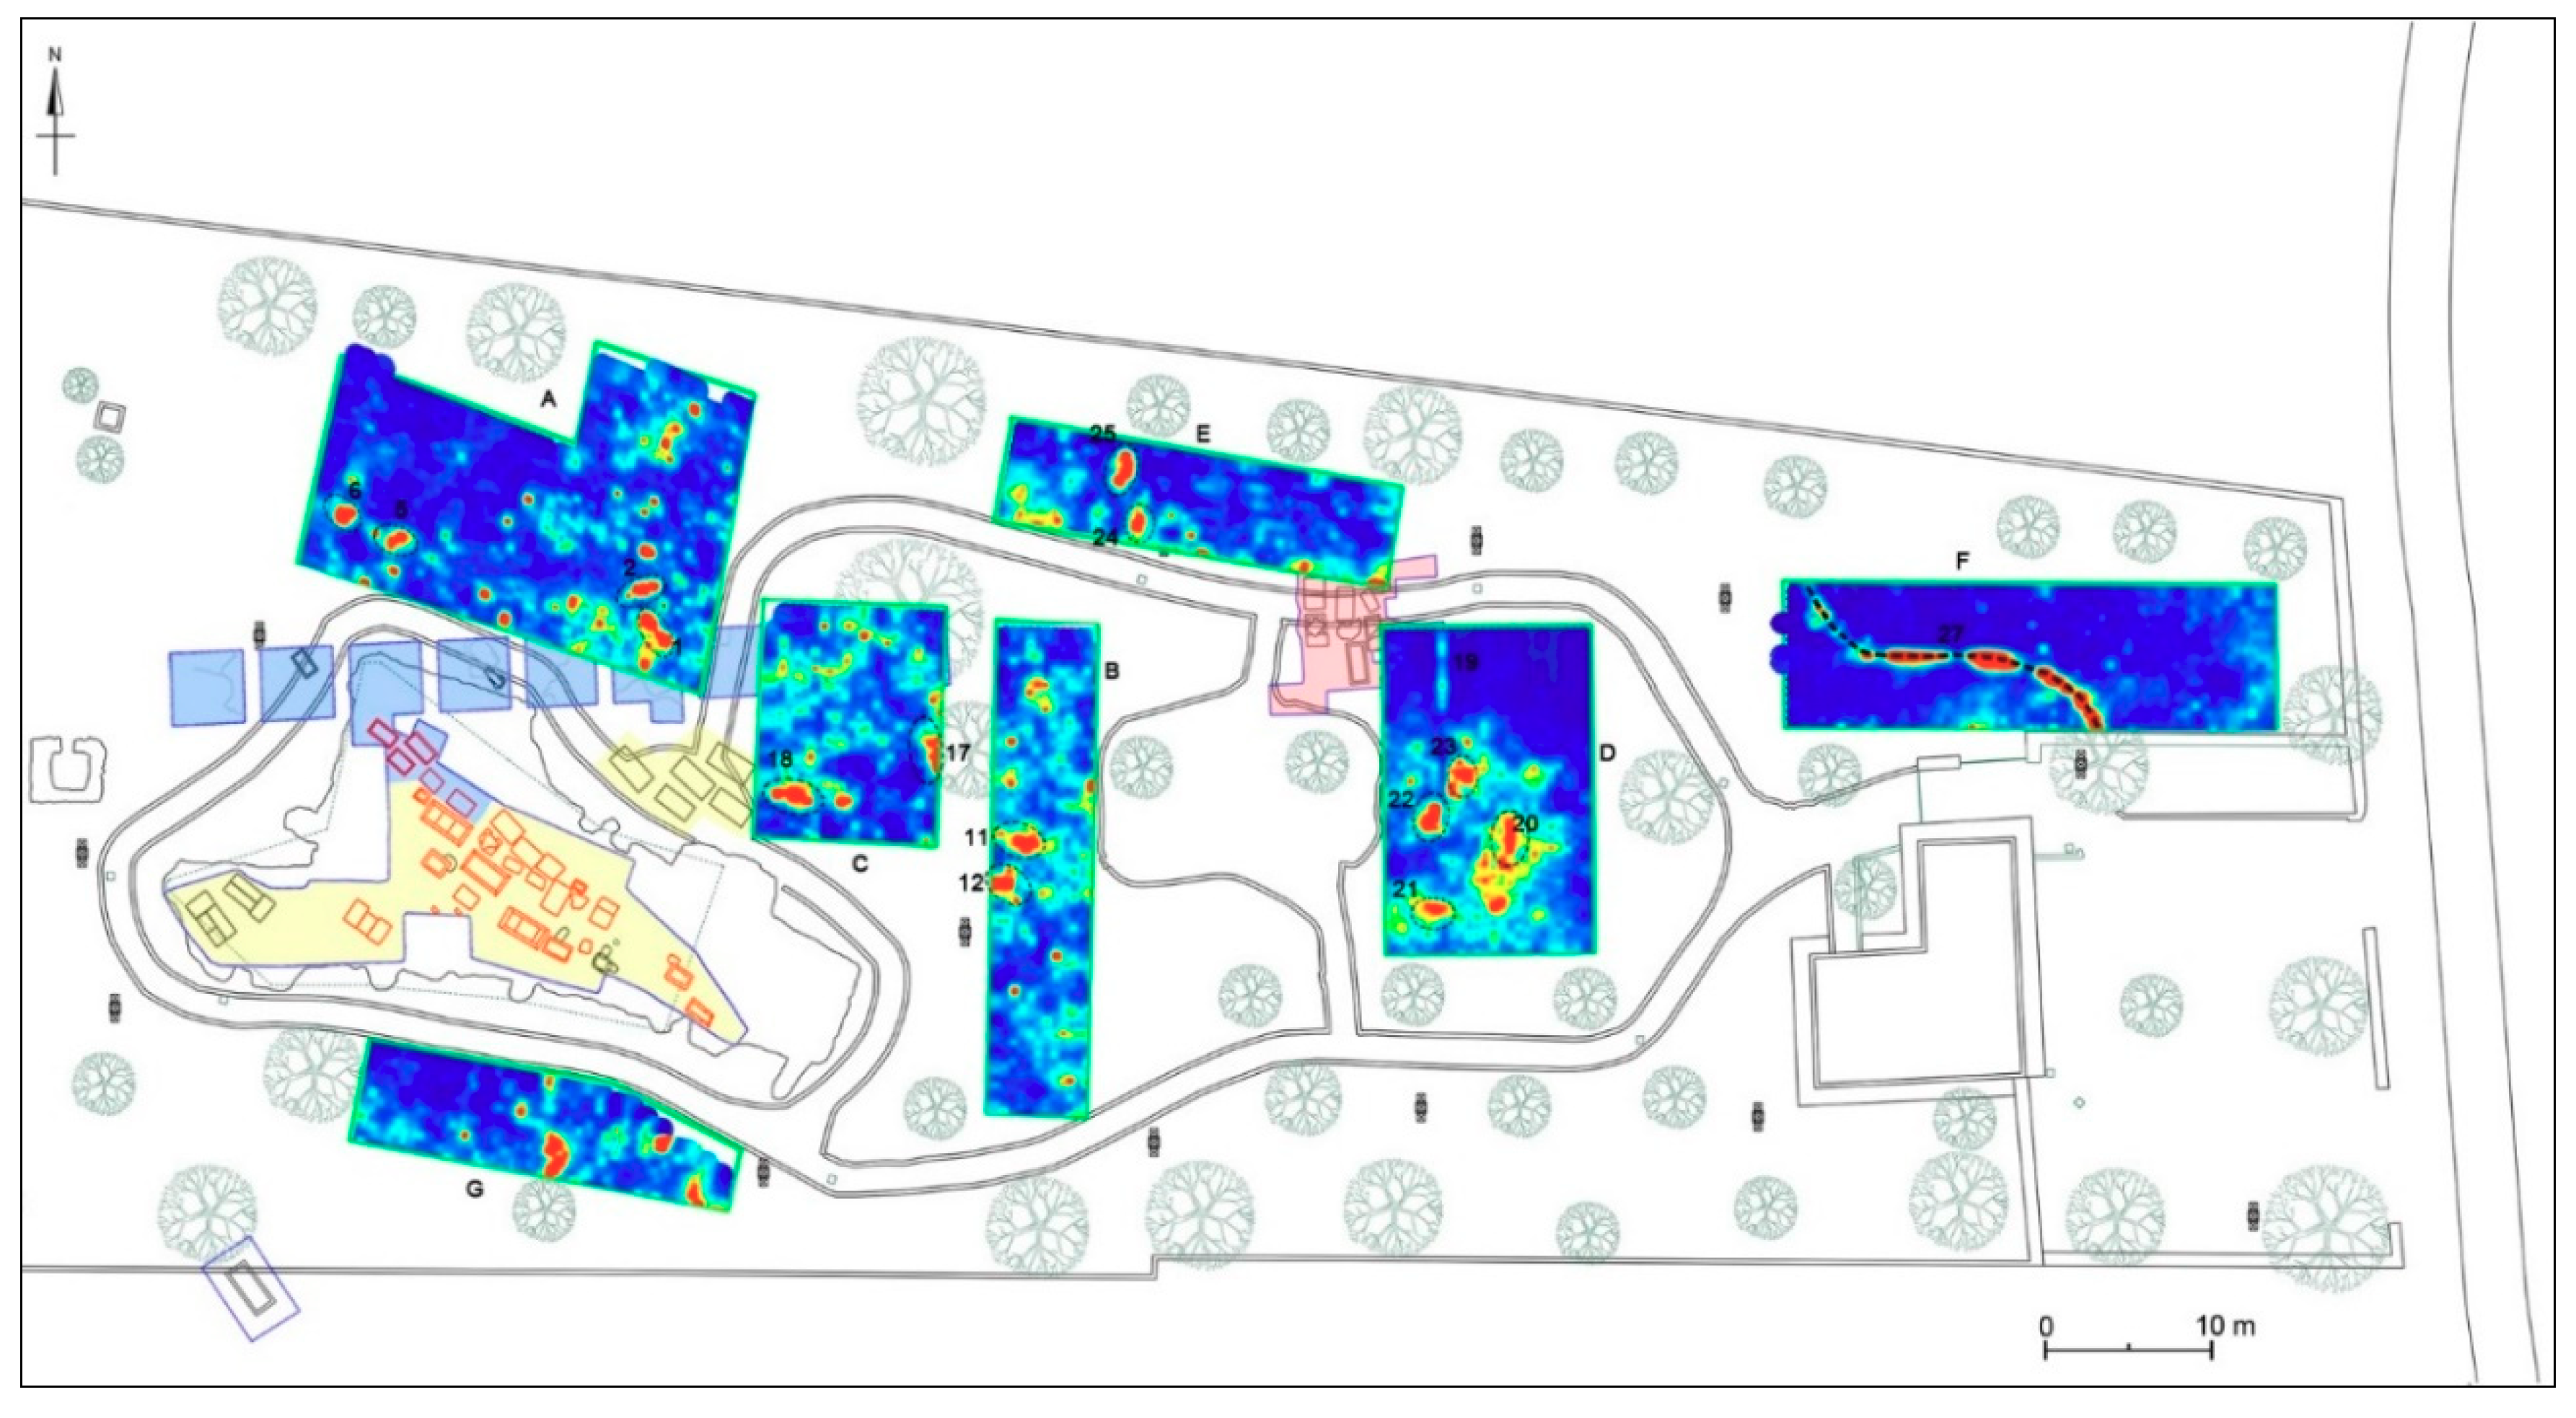
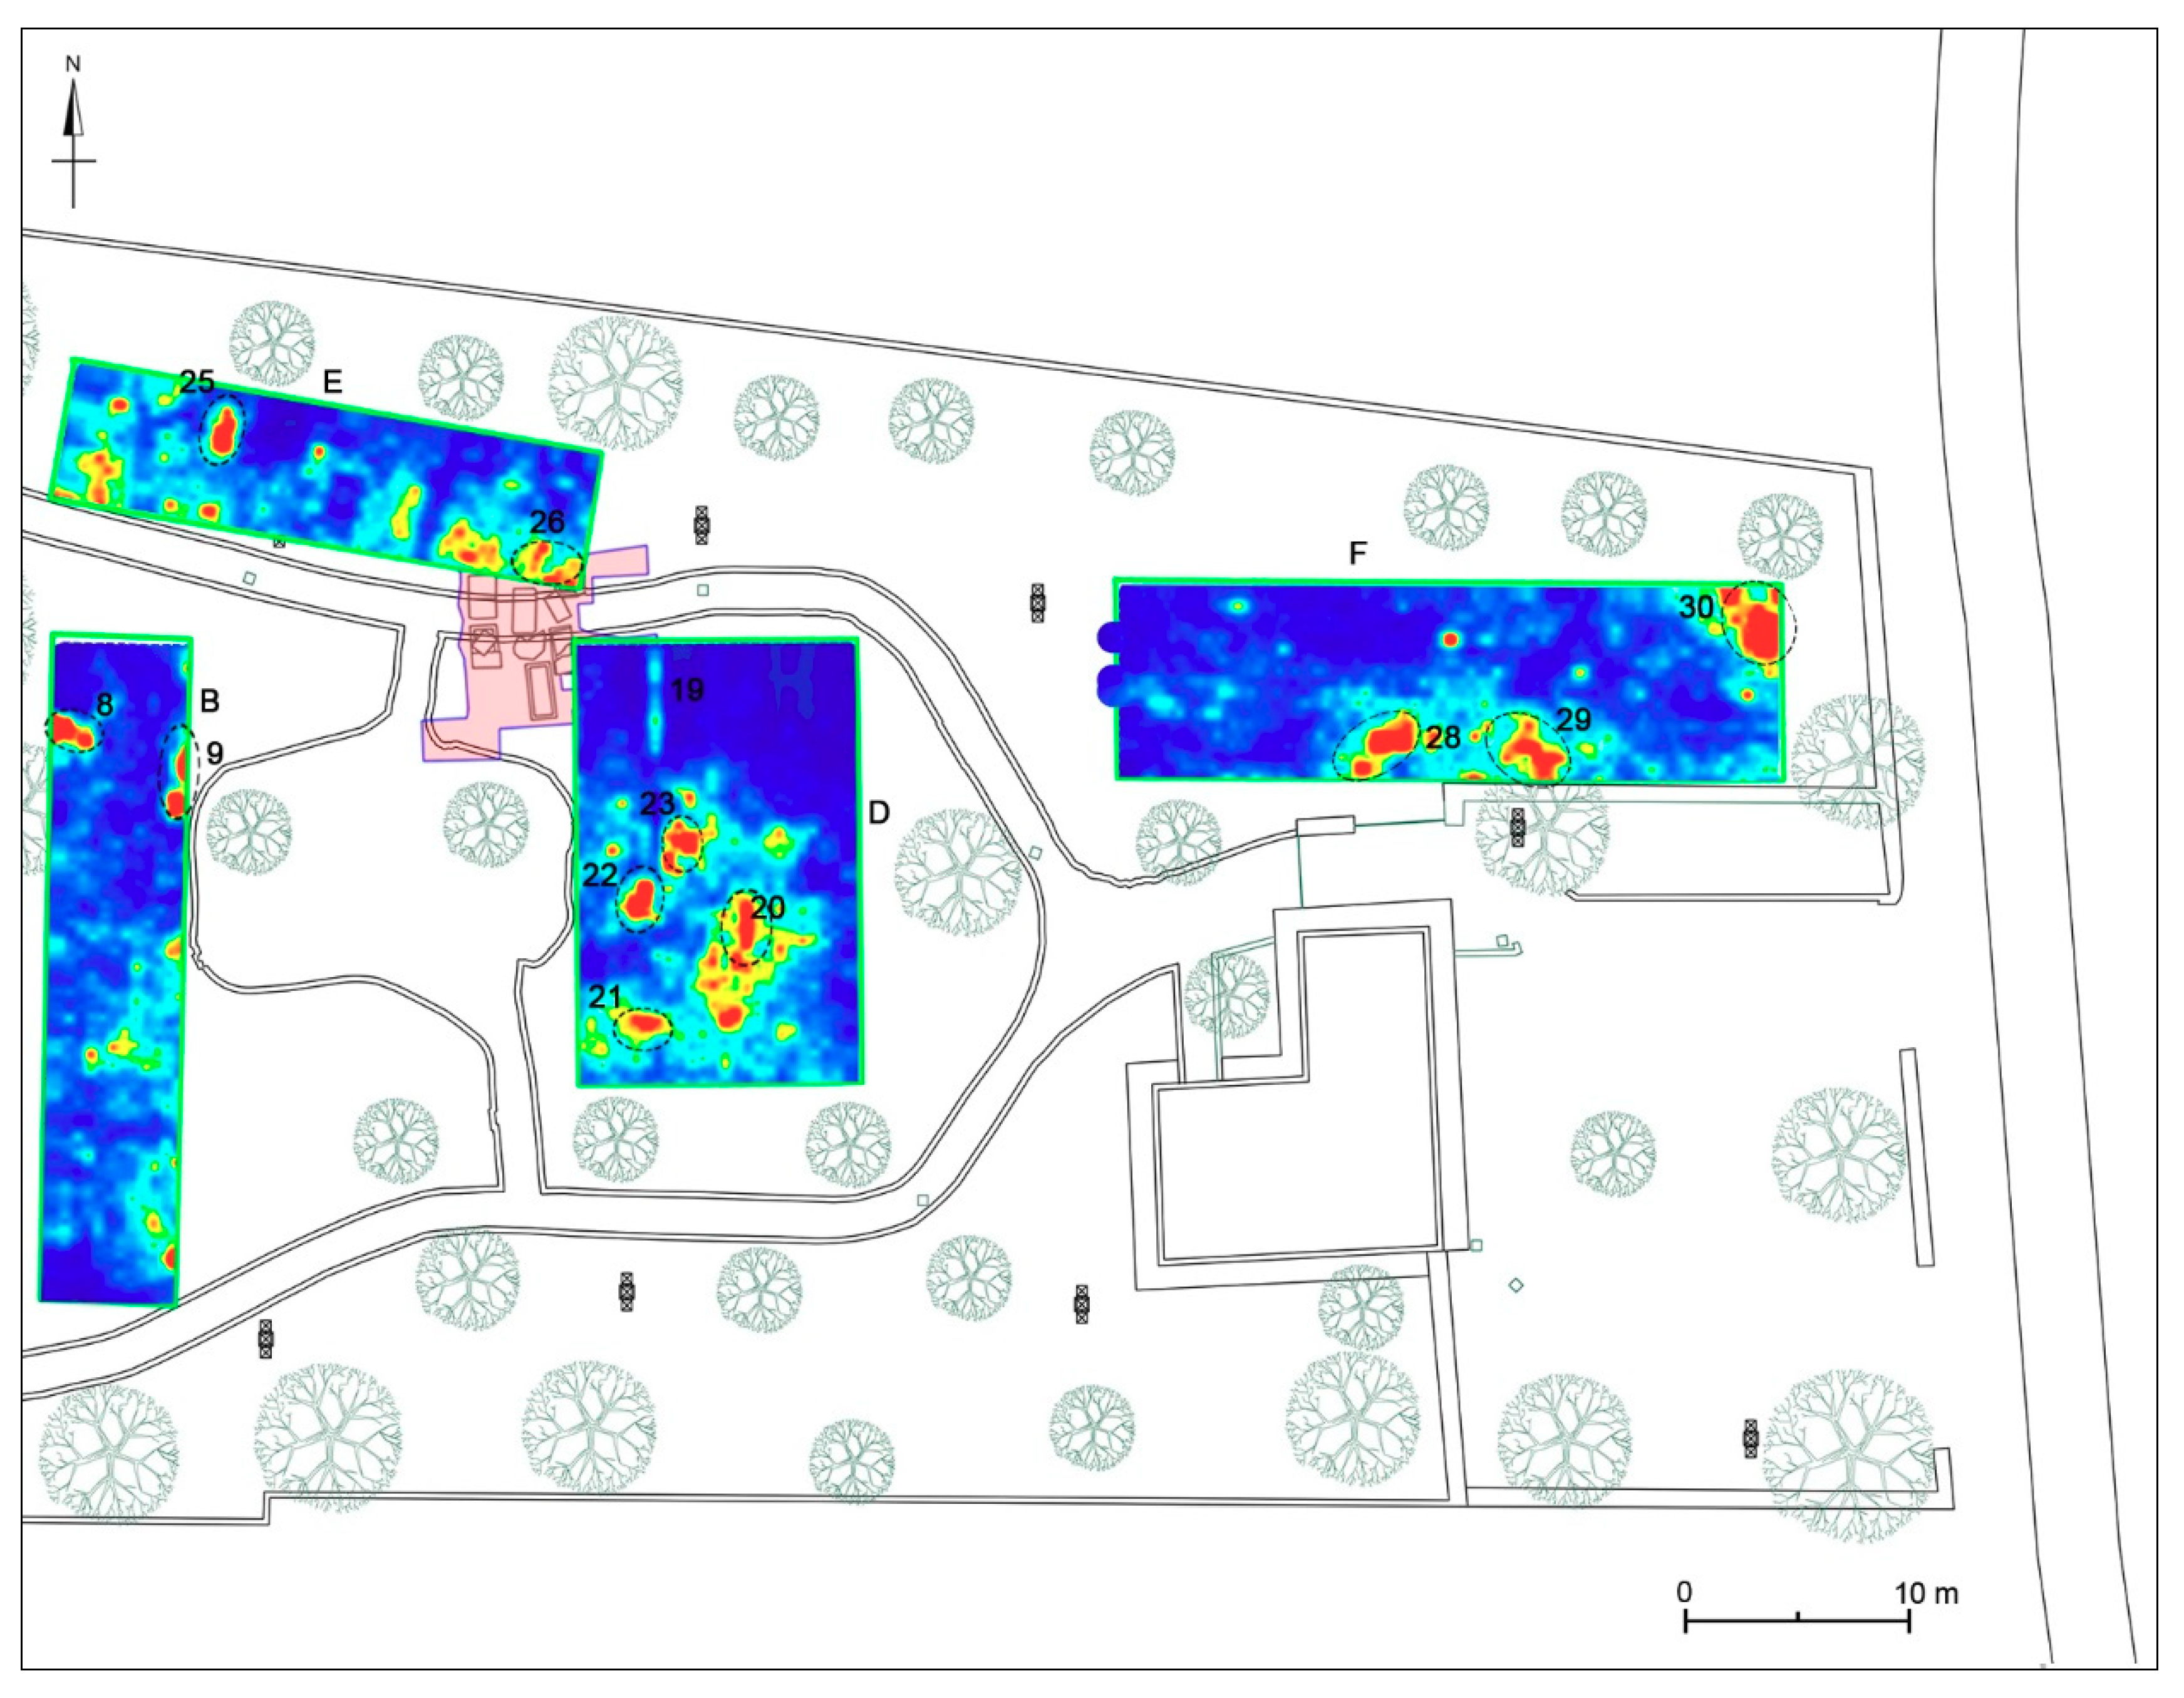
4.2. Geophysical Anomalies
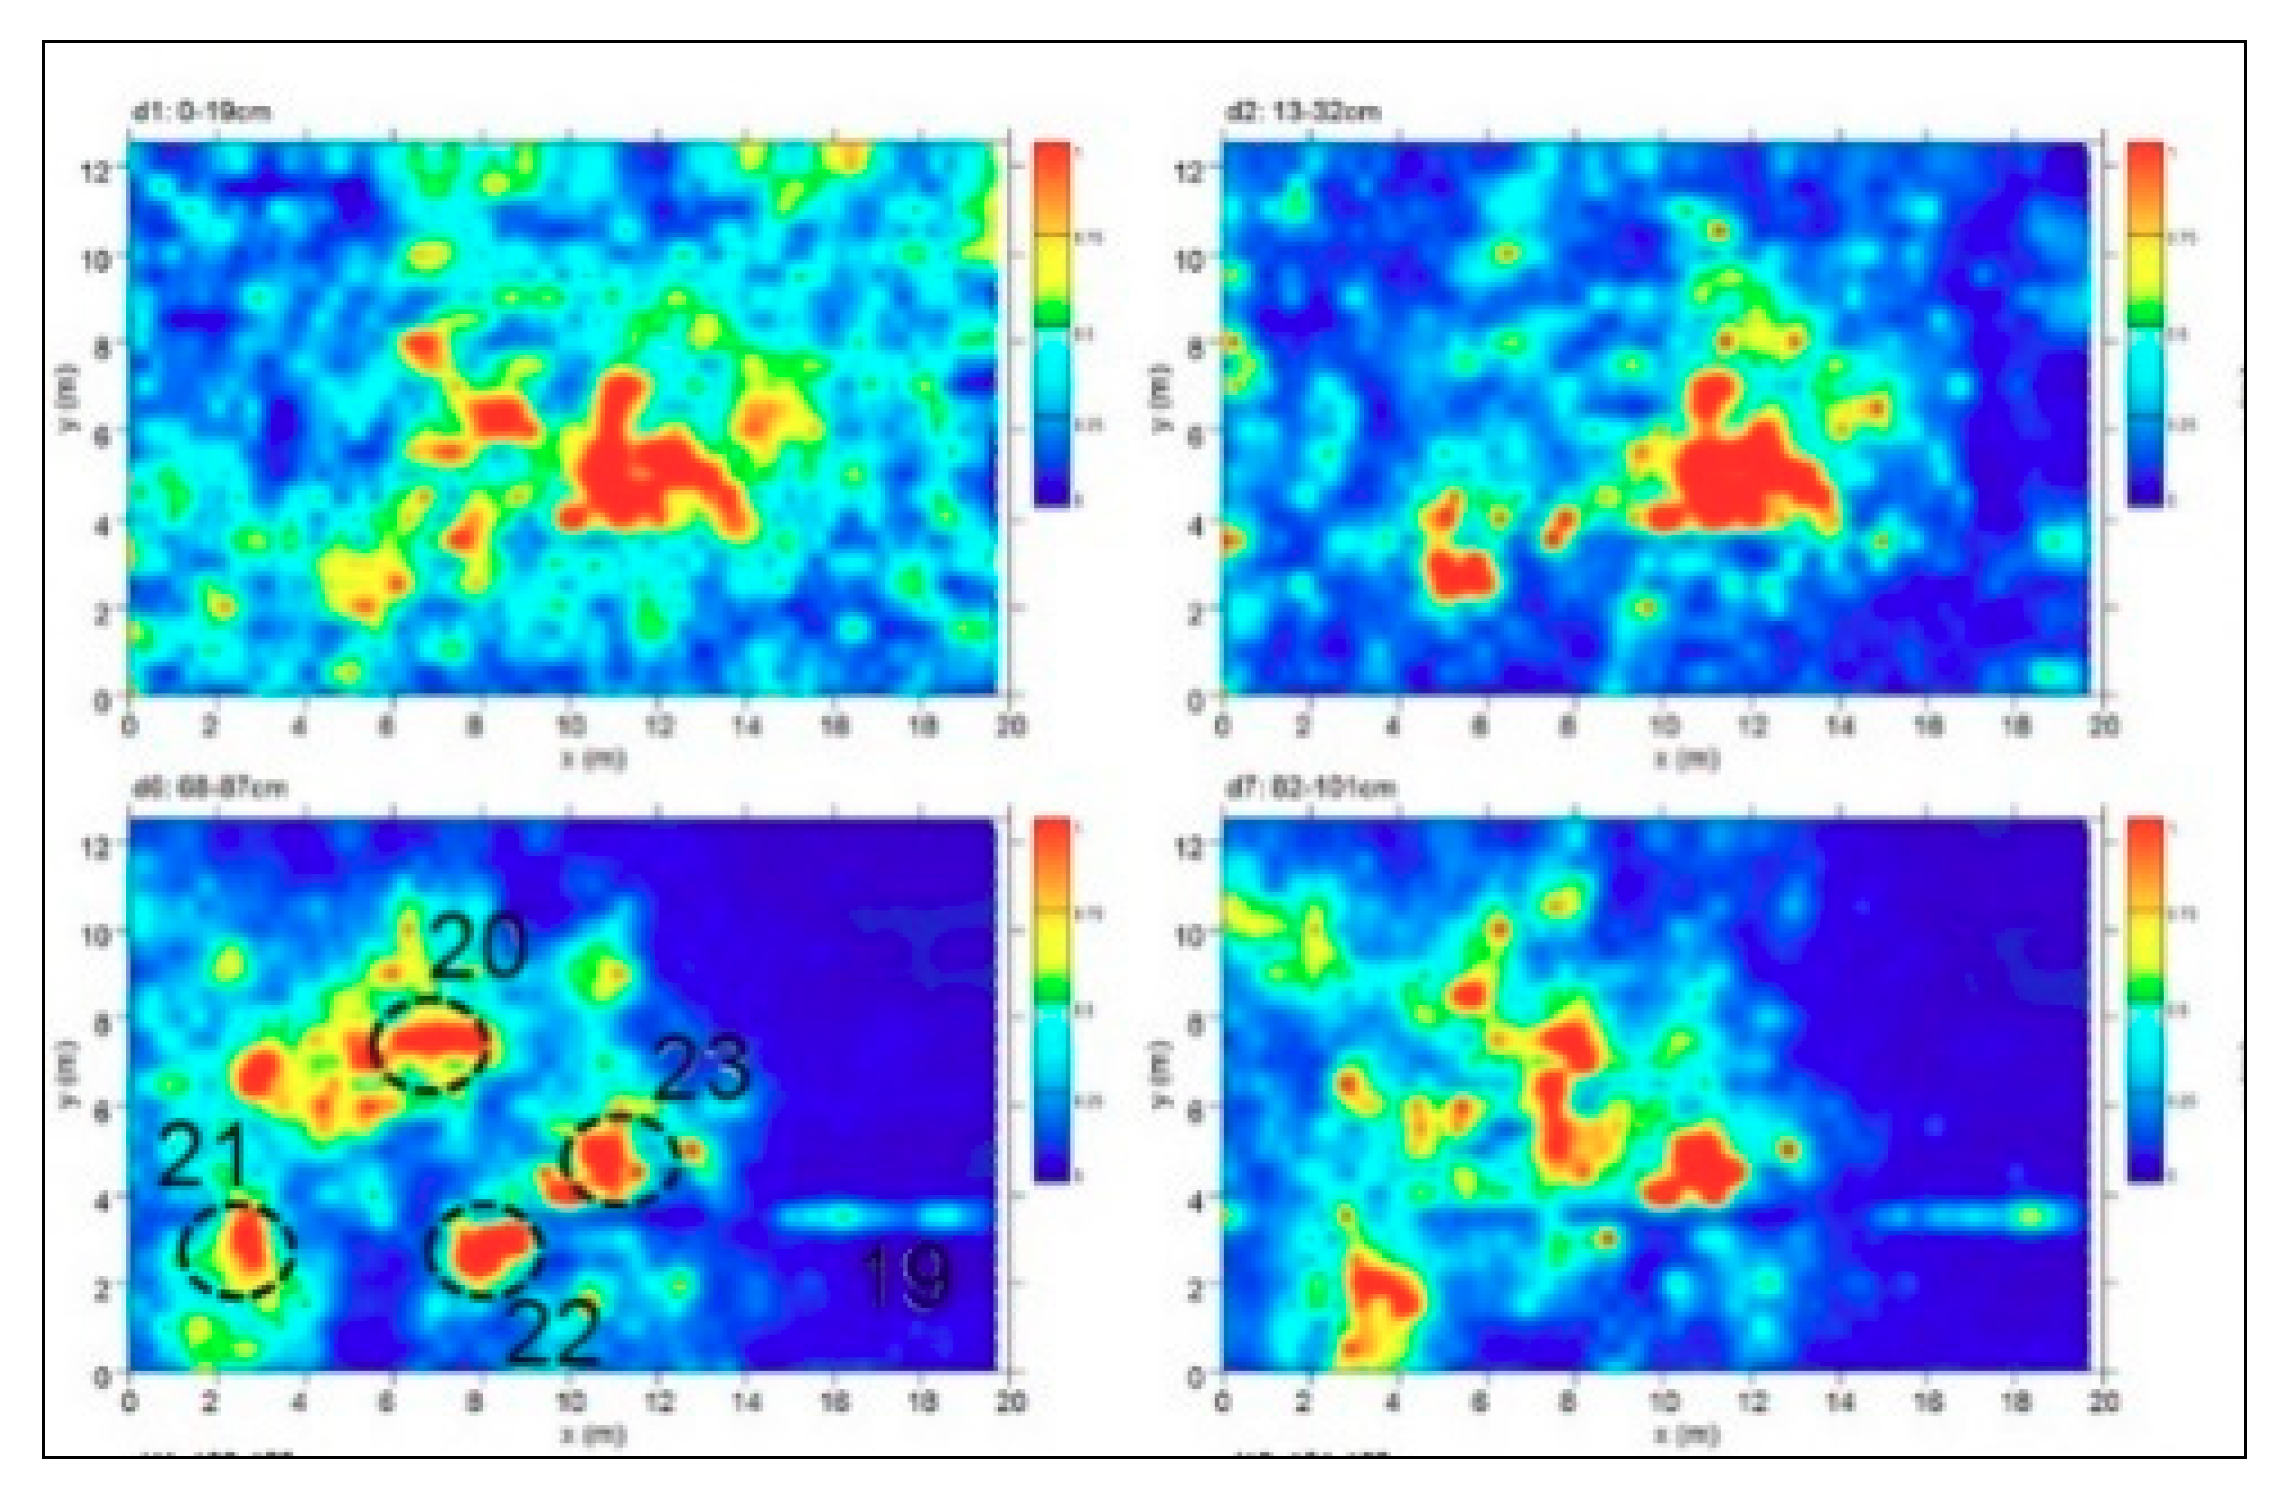
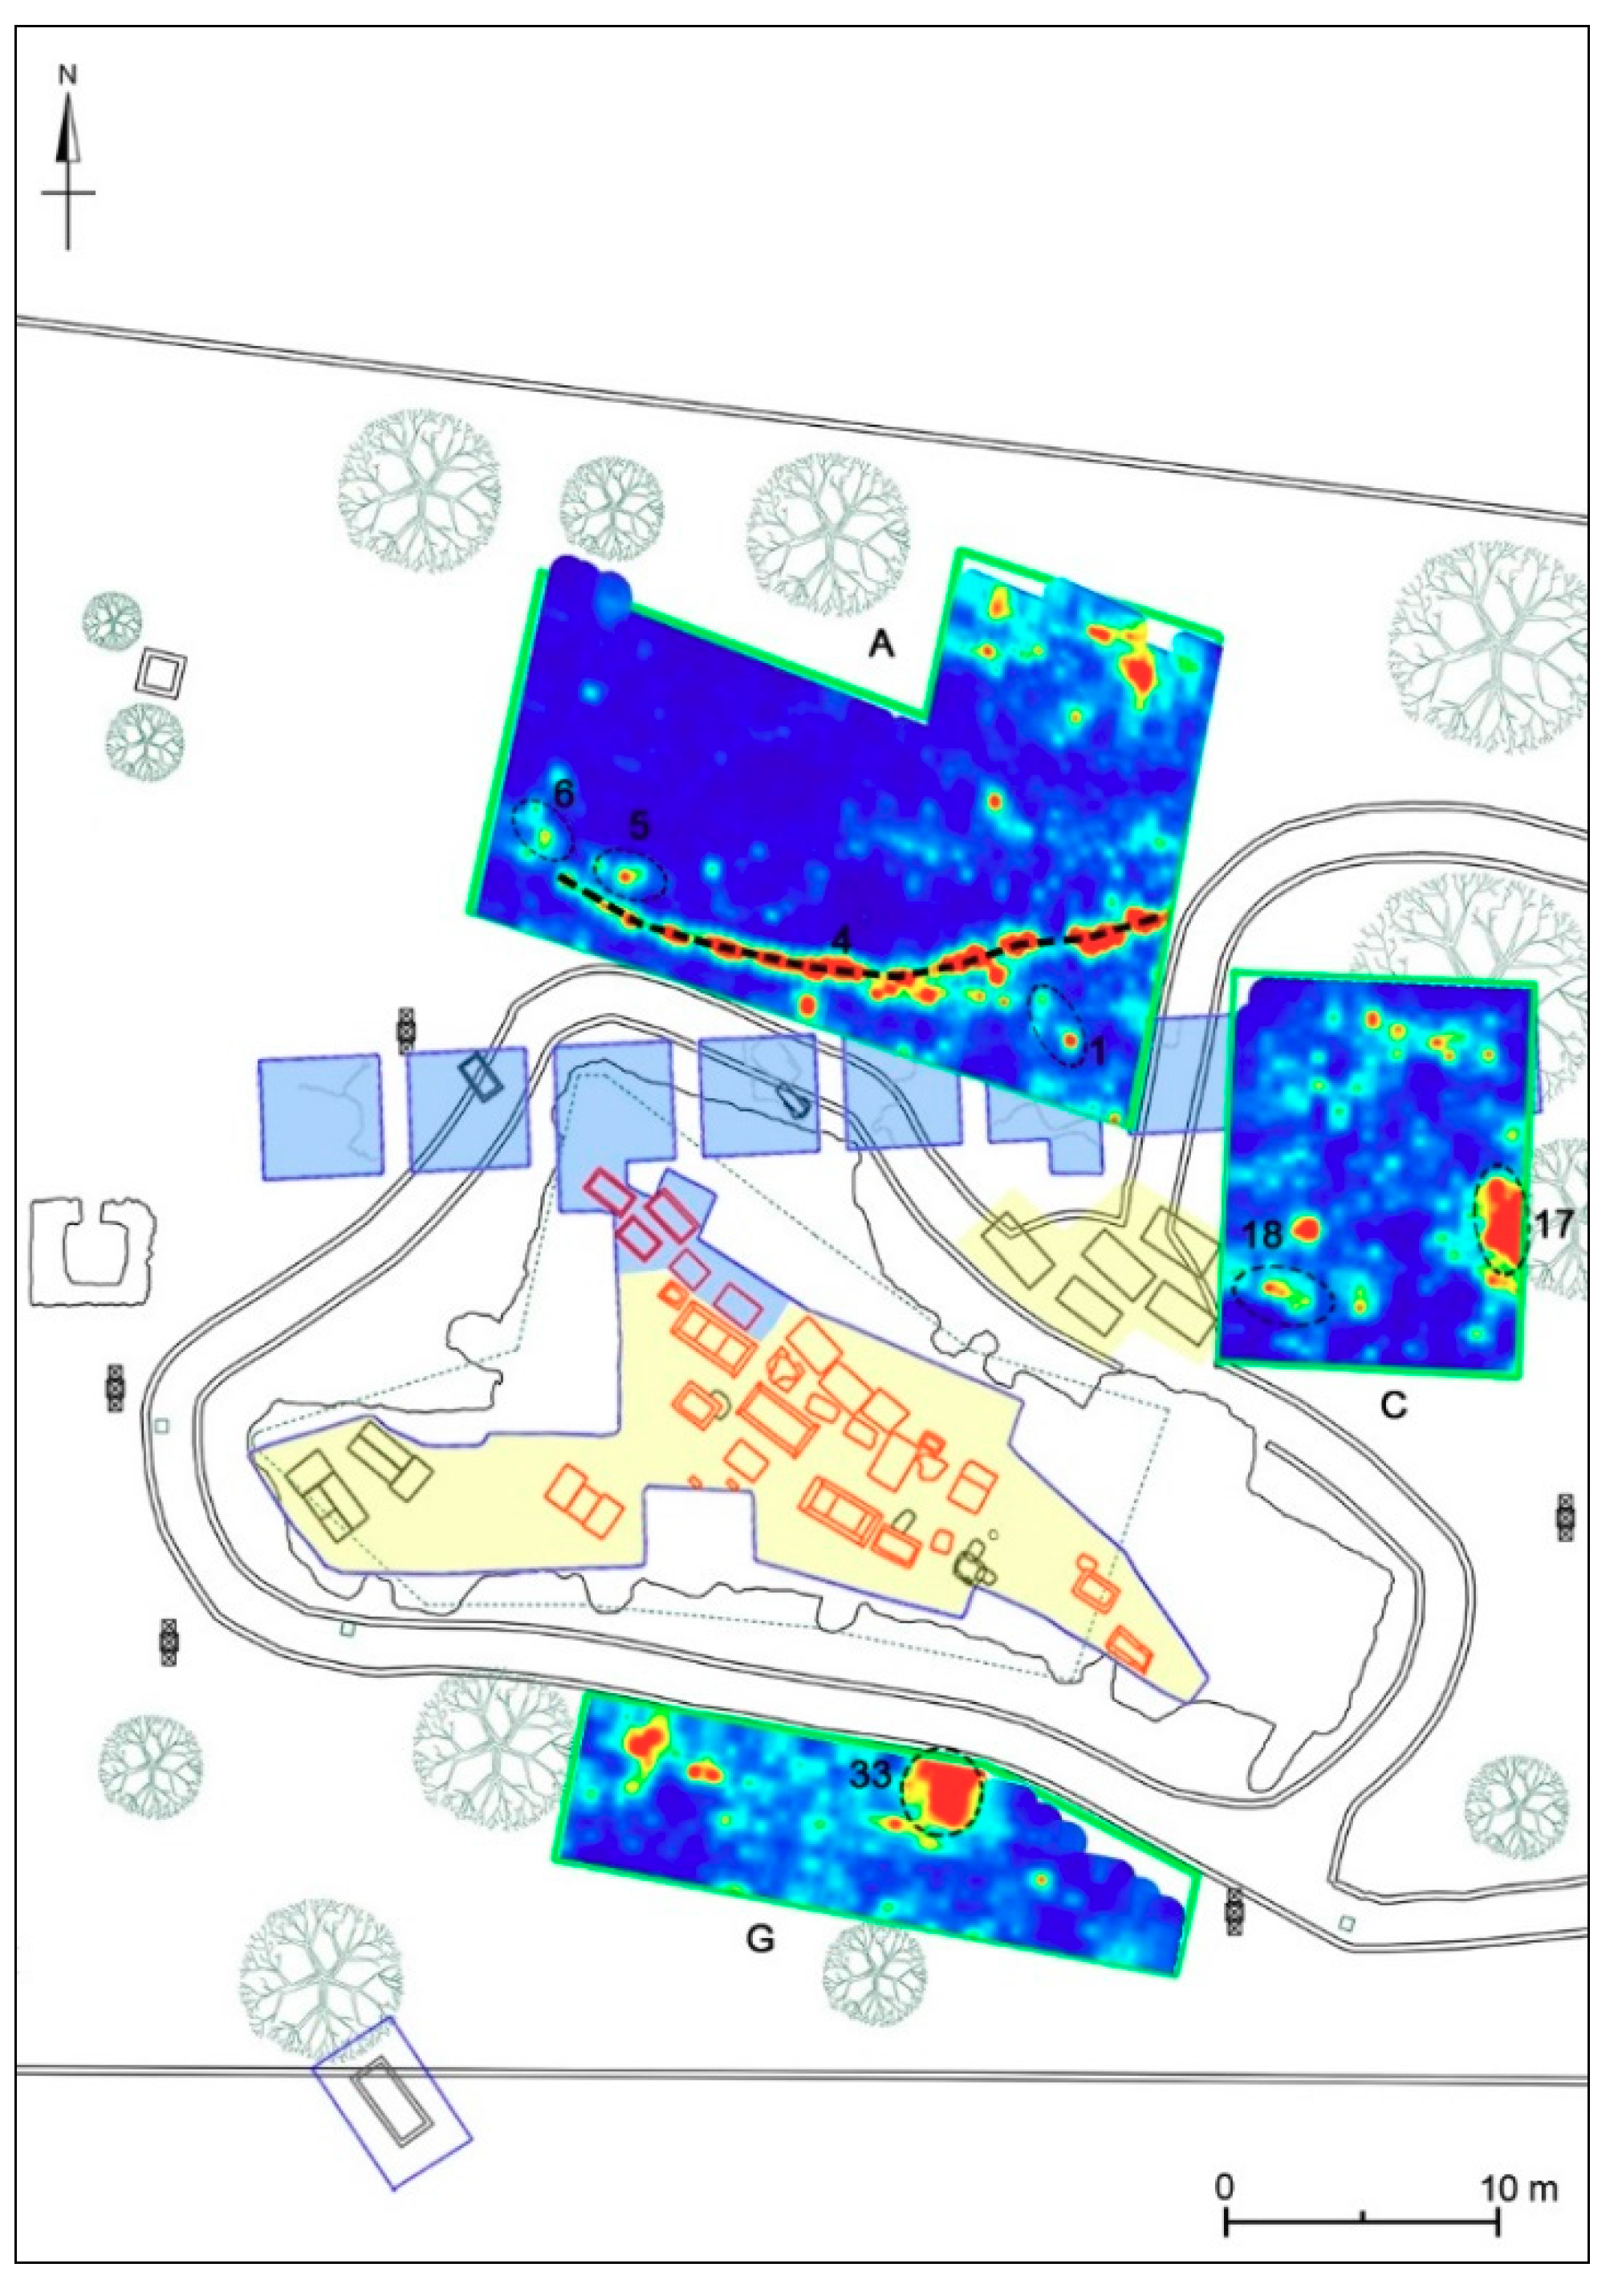
4.2.1. Area A
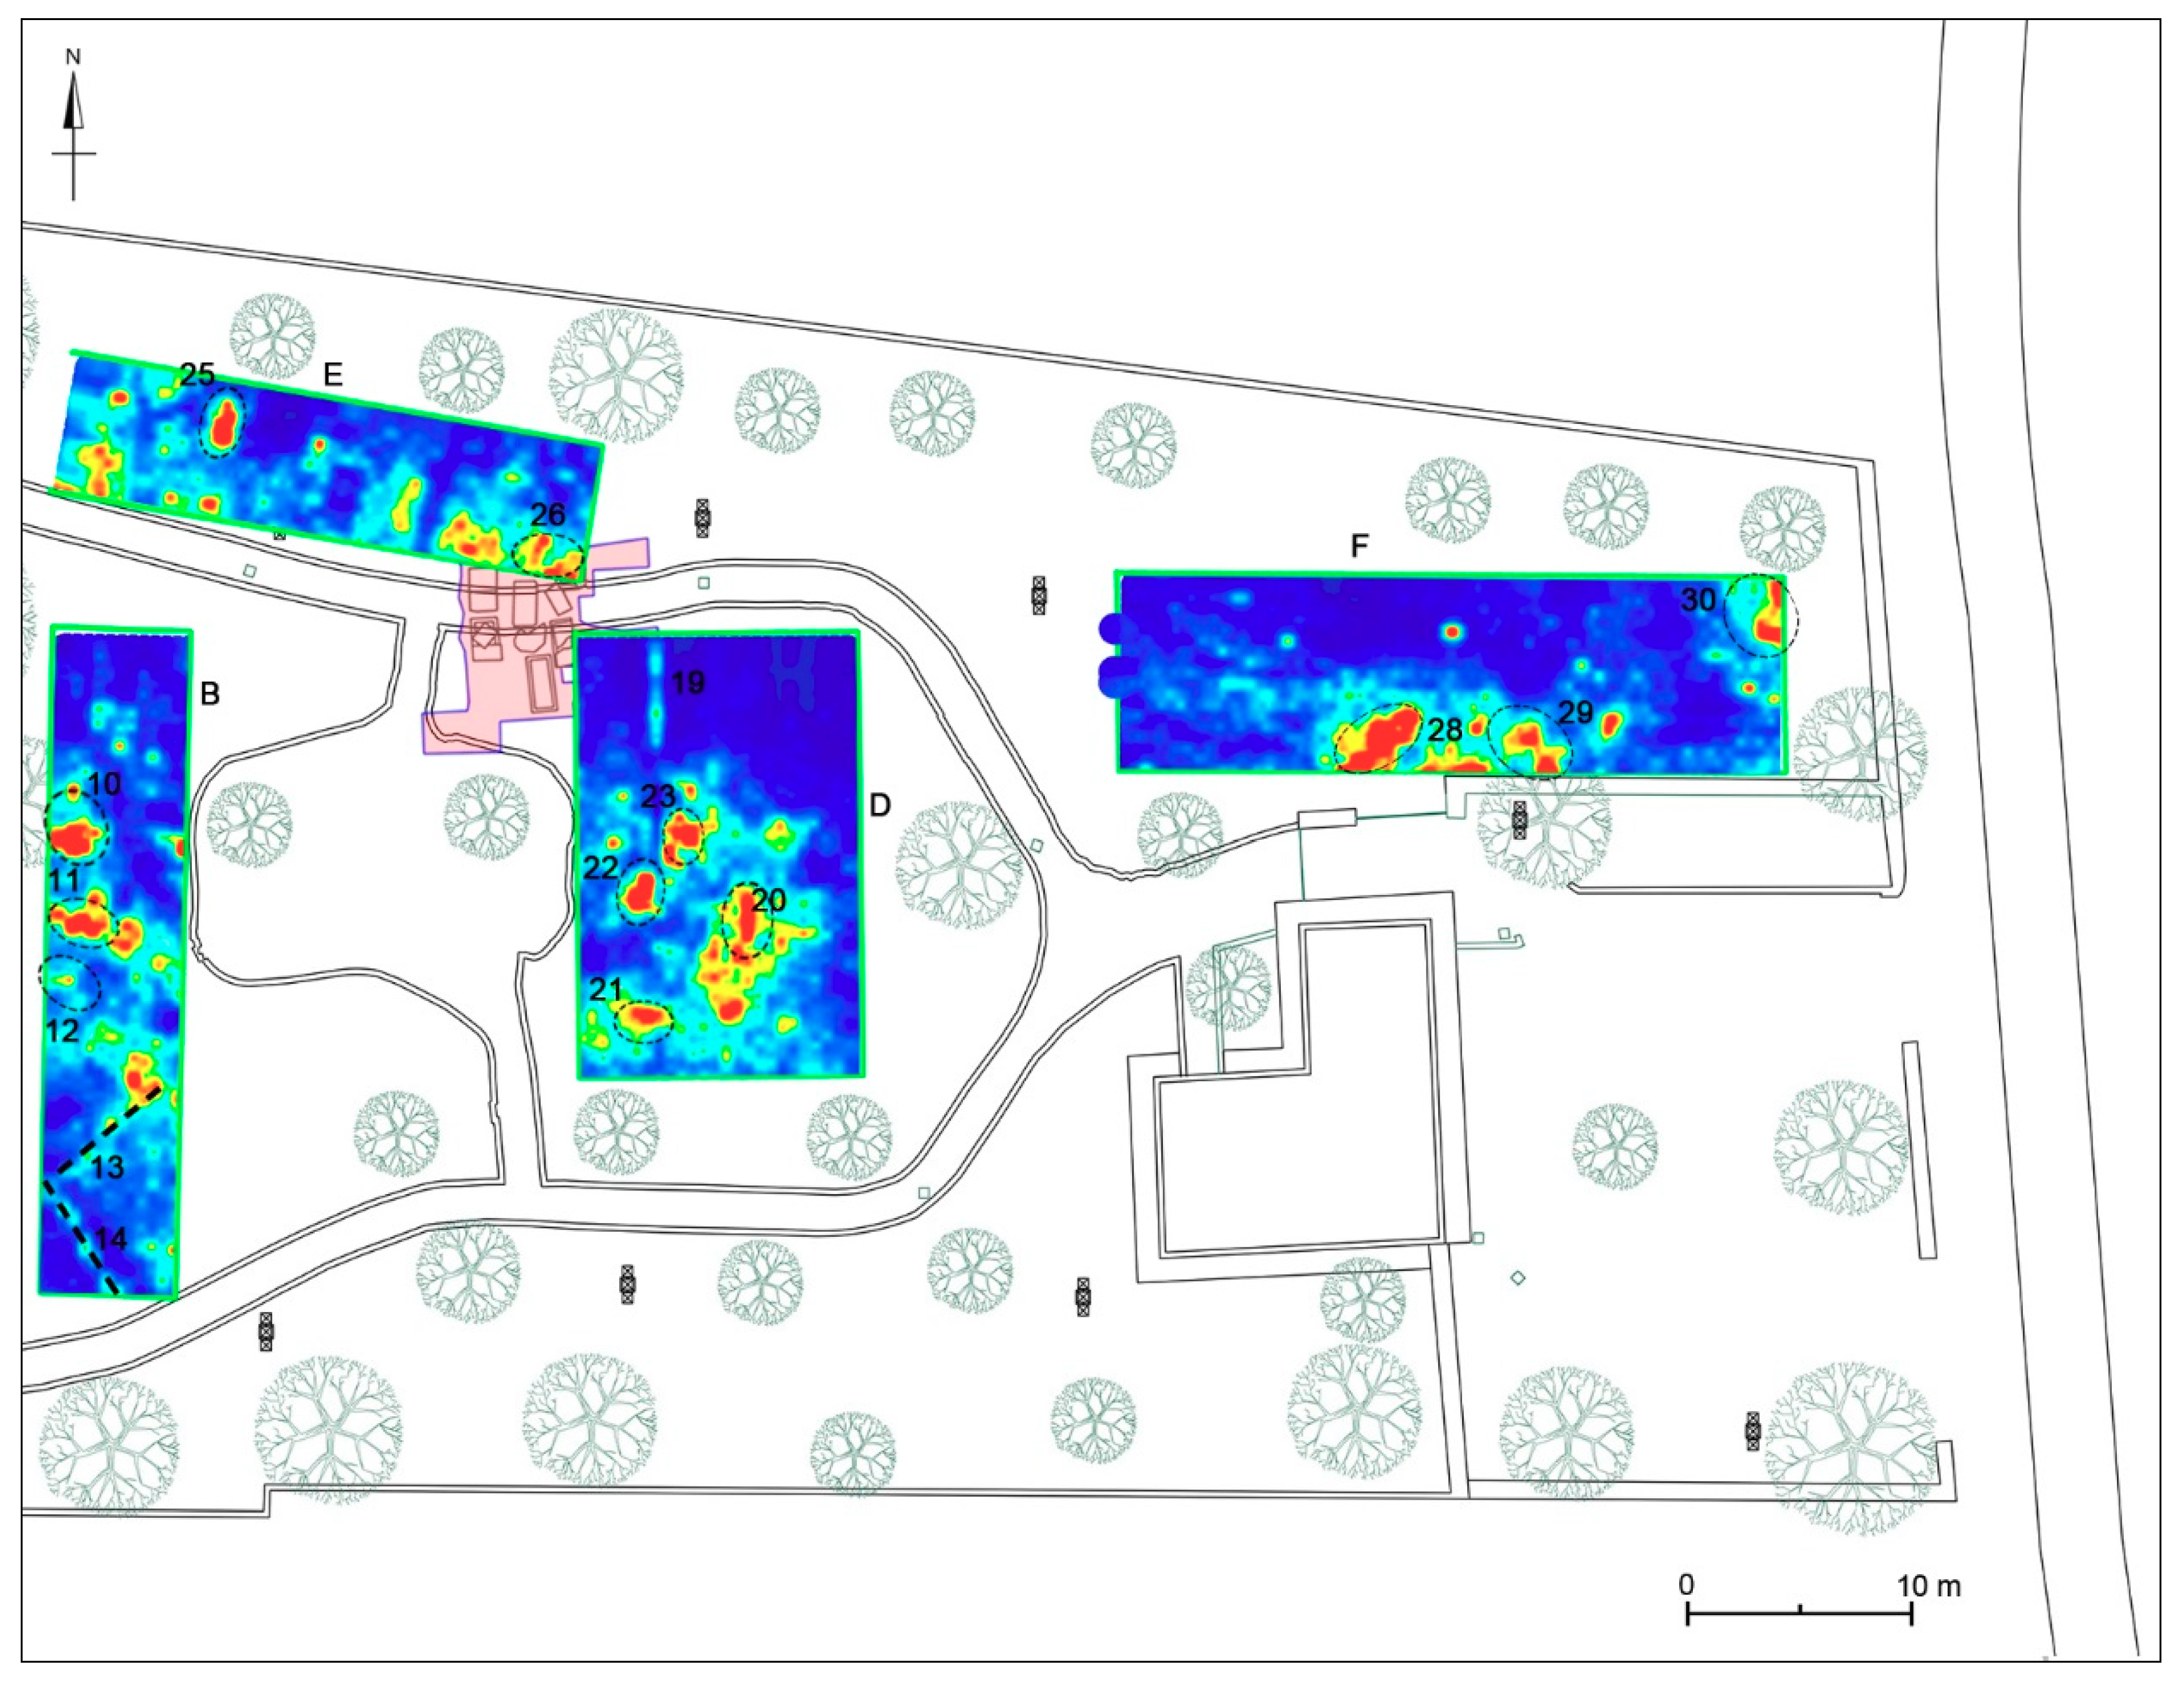
4.2.2. Area B
4.2.3. Area C
4.2.4. Area D
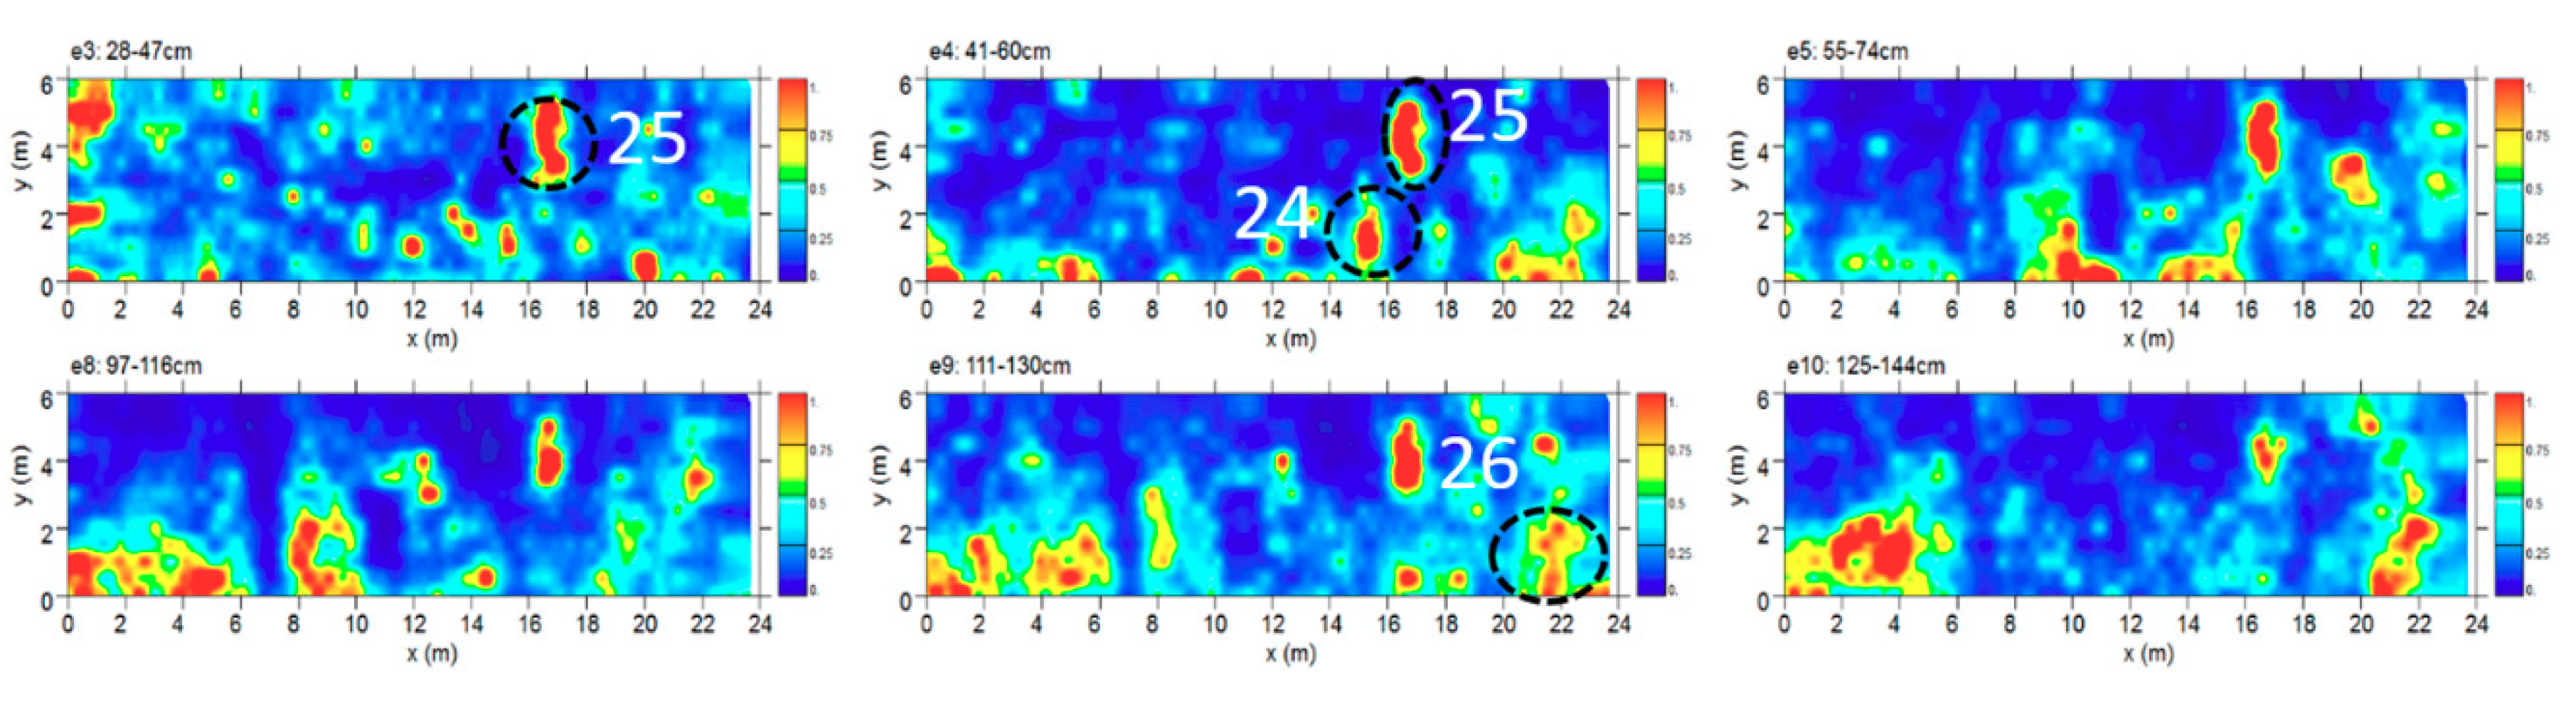
4.2.5. Area E
4.2.6. Area F
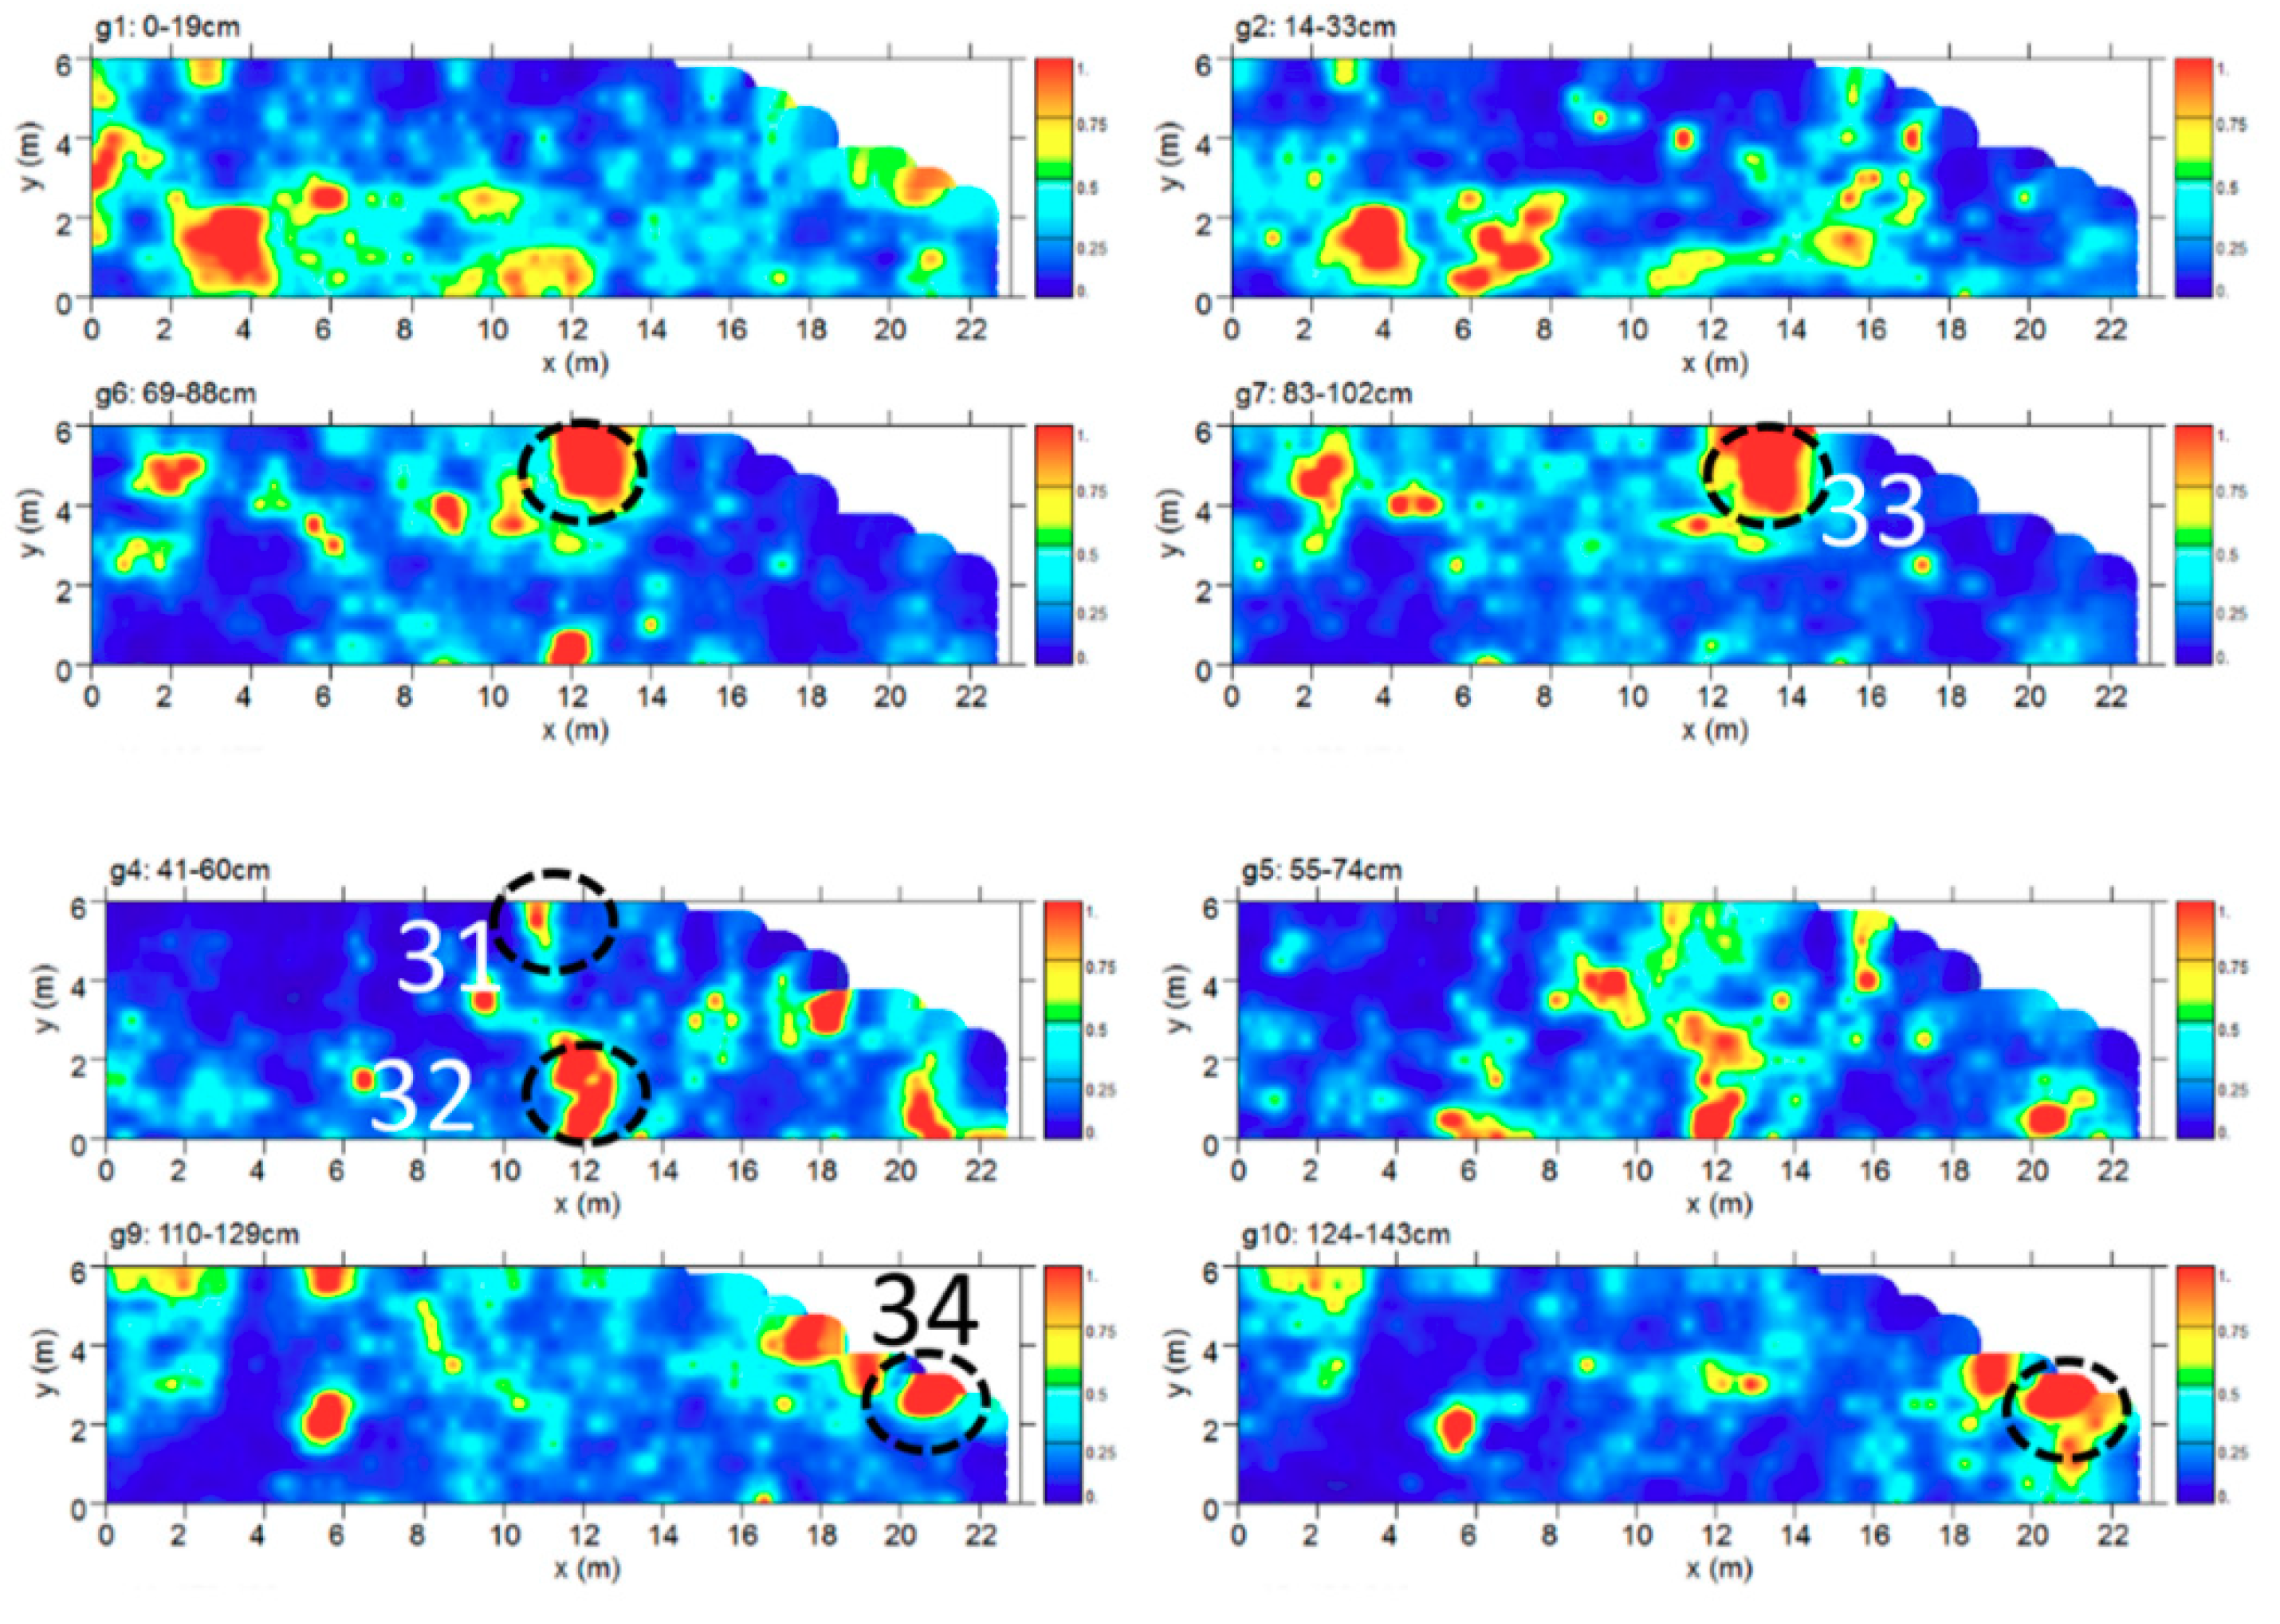
4.2.7. Area G
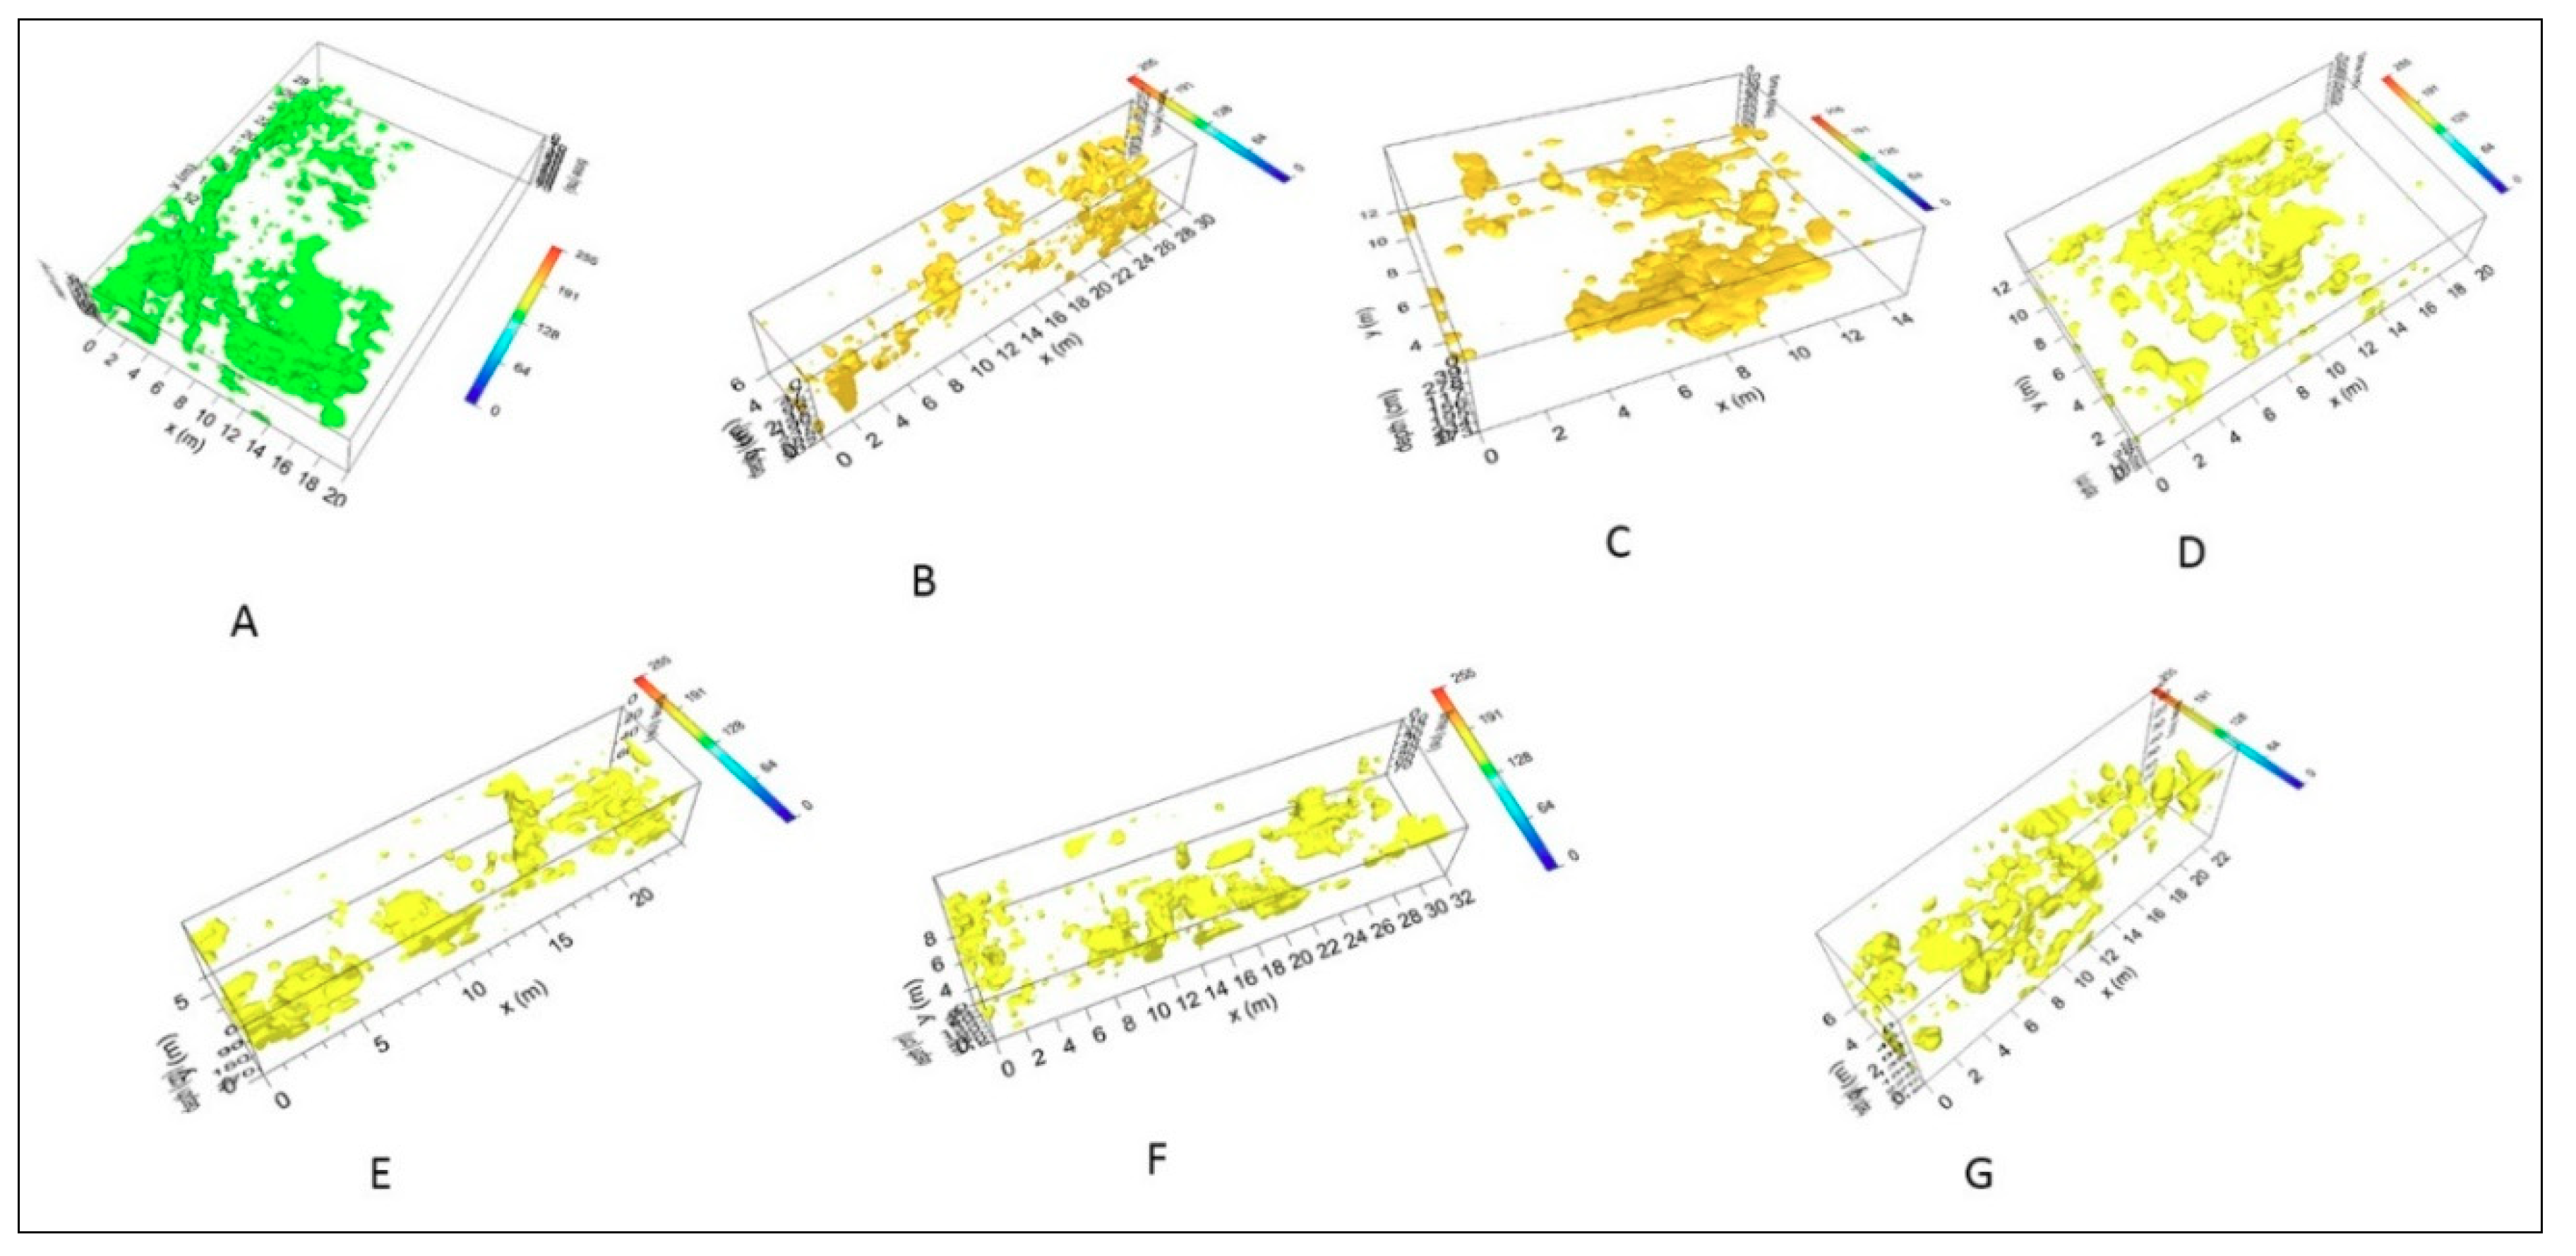
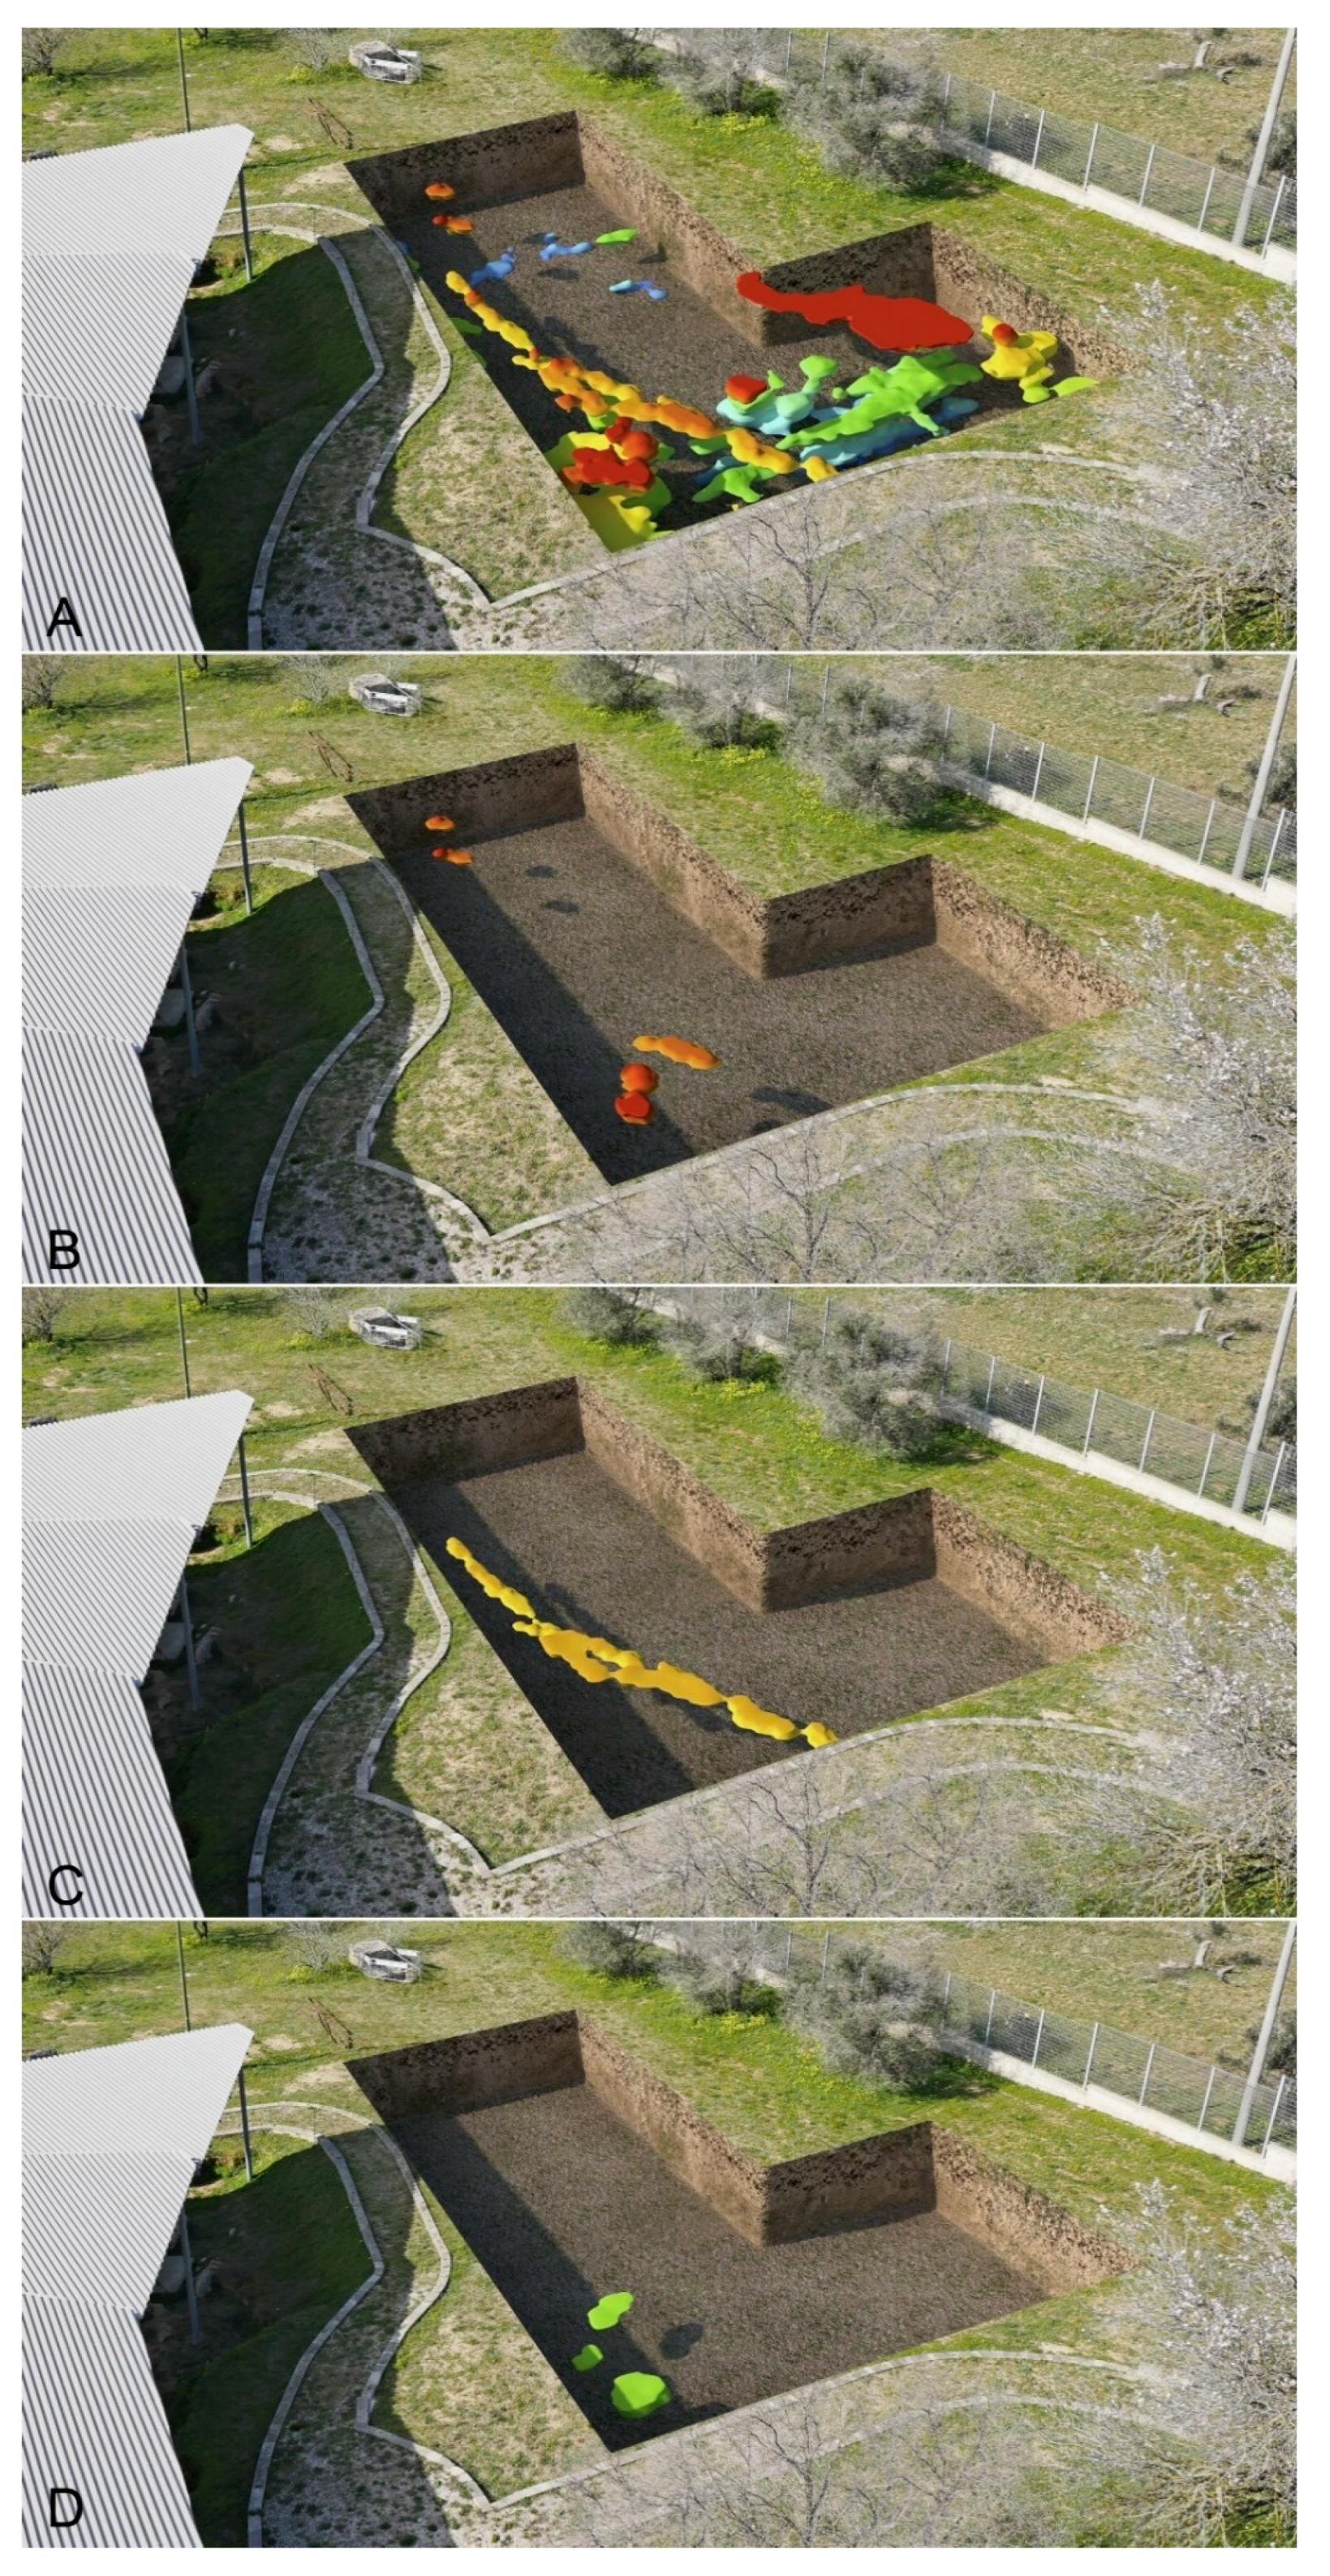
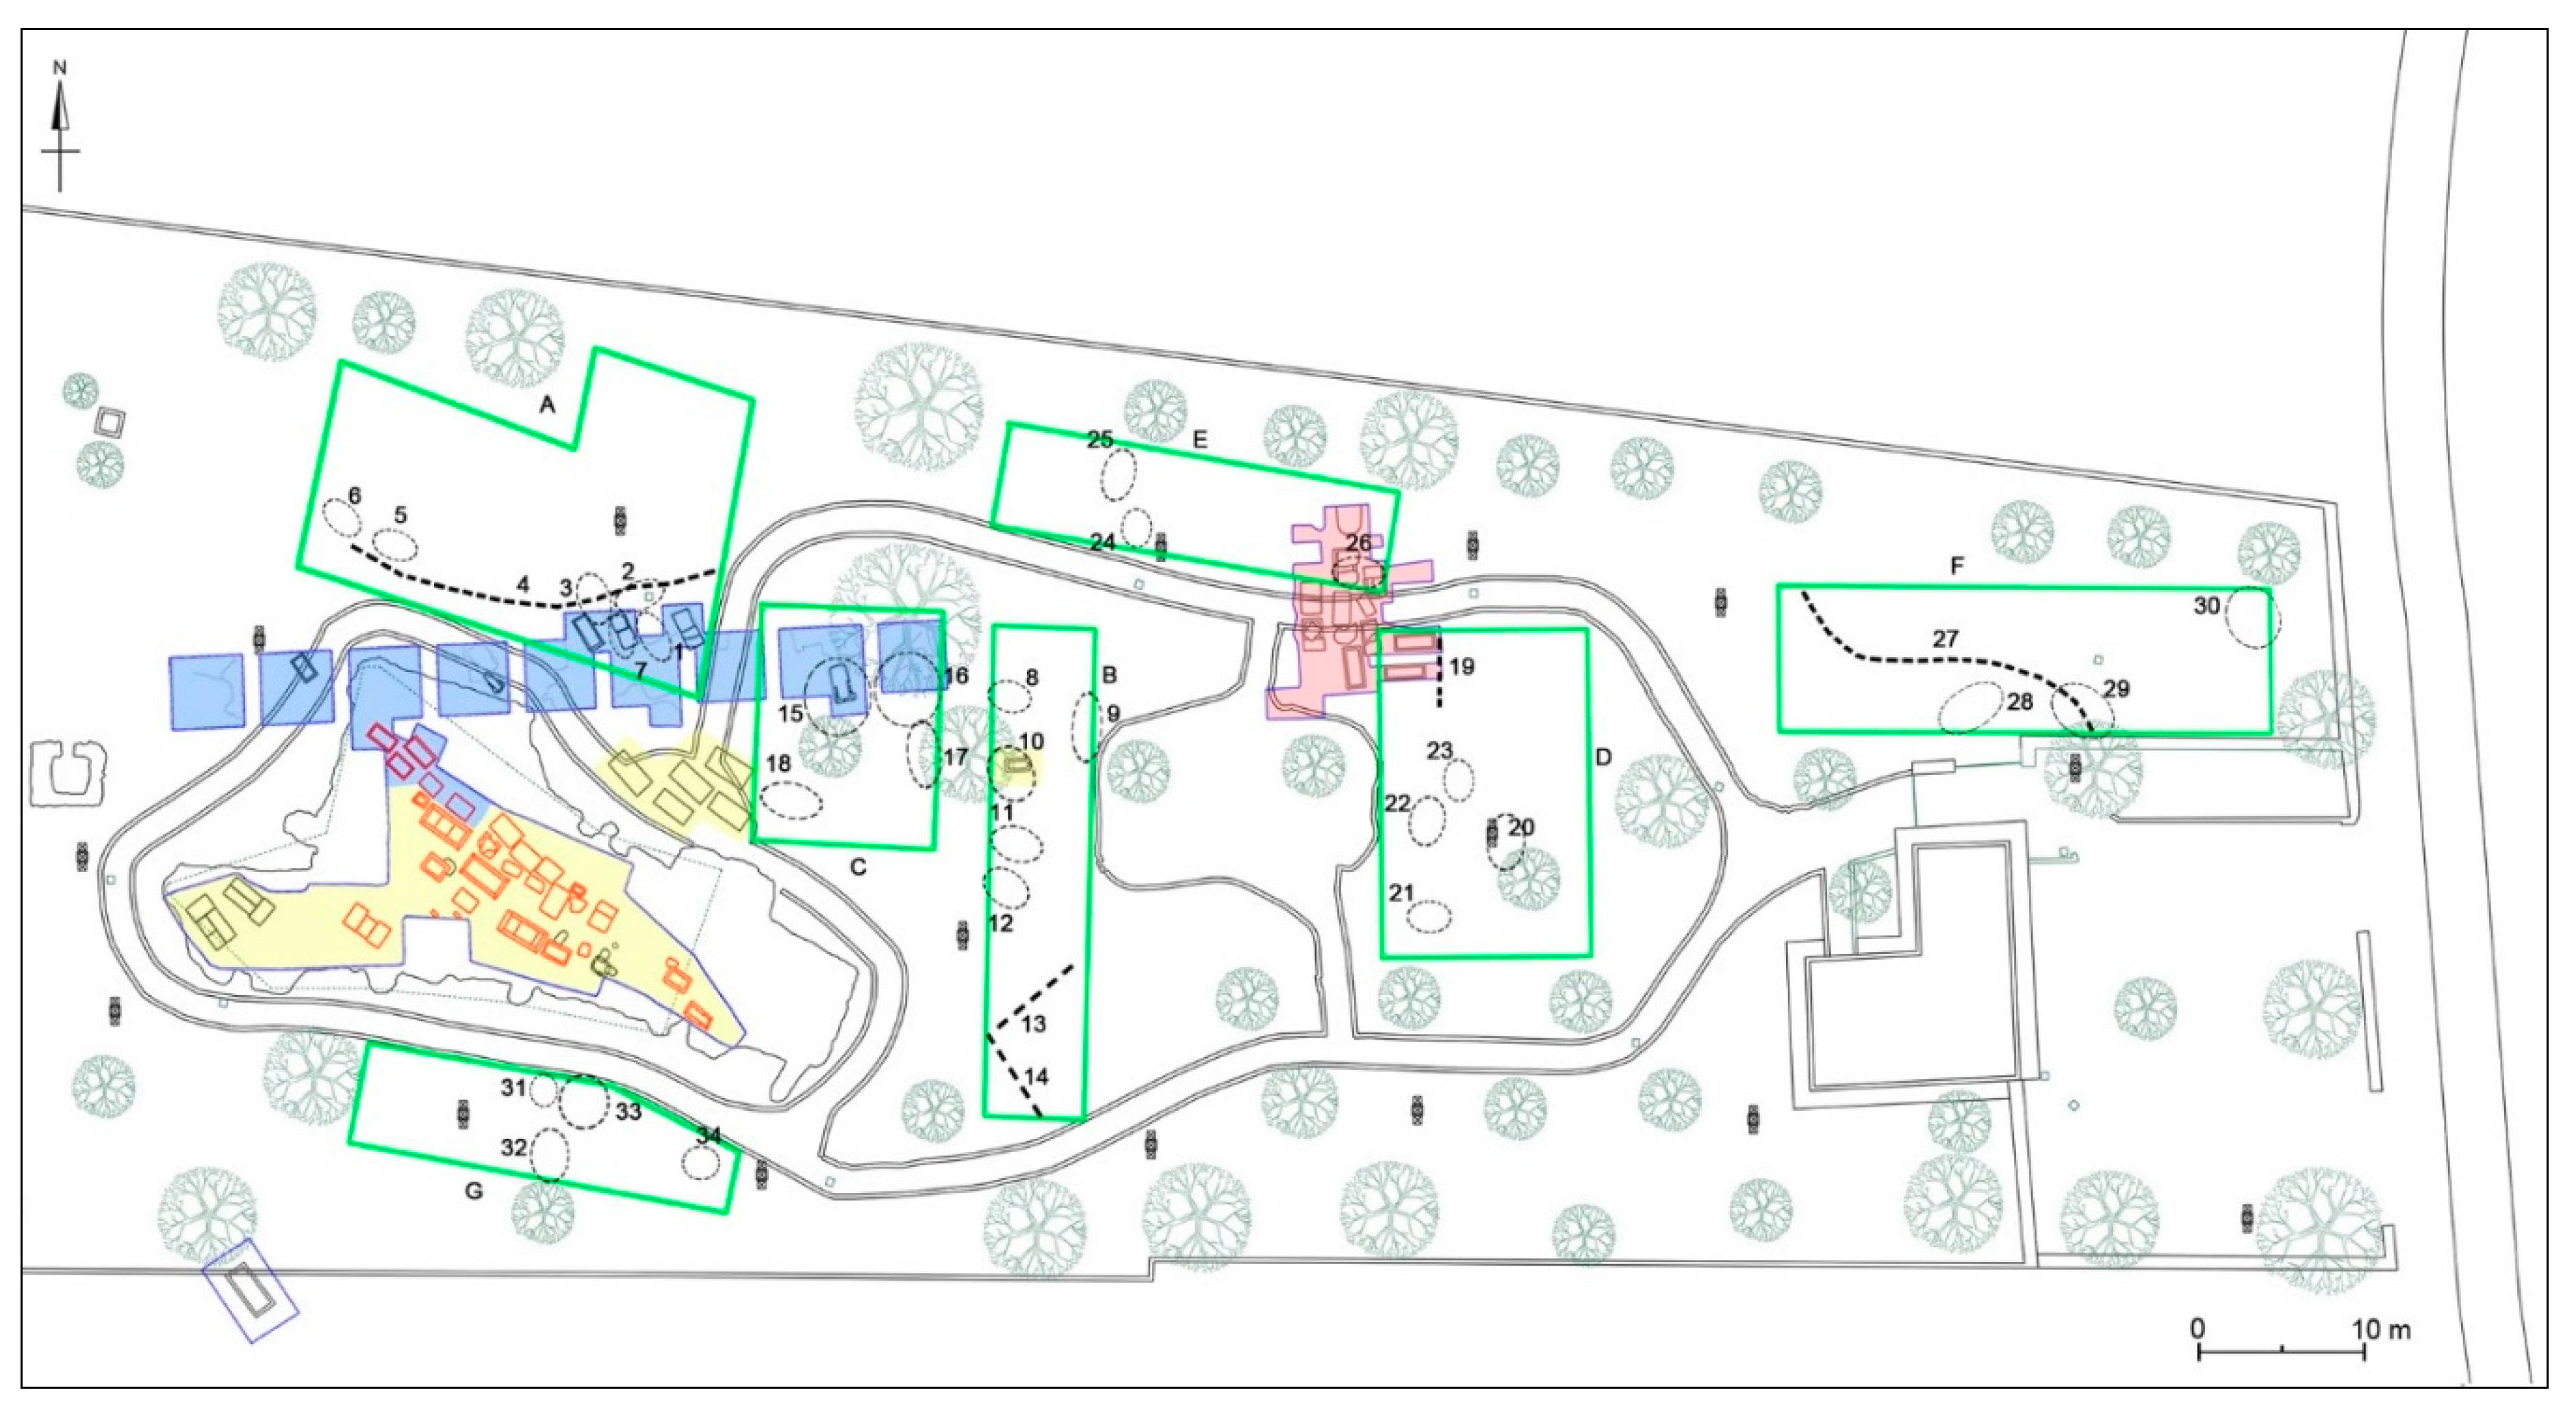
4.3. Integration of Topographical and Geophysical 3D Data
4.4. Archaeological Interpretation
4.4.1. Areas A-C
4.4.2. Areas D-G
5. Conclusions
Author Contributions
Funding
Acknowledgments
Conflicts of Interest
References
- Ferrari, I.; Scardozzi, G. Contributo Alla Carta Archeologica di Alezio; Scirocco Editore: Bari, Italy, 2016. [Google Scholar]
- Bolognese, S. Rinvenimenti di tombe ad Alezio. In Atti del Convegno dei Comuni Messapi, Peuceti e Dauni, VIII; Scientific Committee: Bari, Italy, 1983; pp. 165–173. [Google Scholar]
- Zezza, G.M. Alezio: Continuità di Vita in un Centro Antico del Salento; Arti Grafiche Pugliesi: Martina Franca, Italy, 1991. [Google Scholar]
- Lamboley, J.L. Recherches sur les Messapiens IV-II Siècle Avant J.-C; Ecole Française de Rome: Roma, Italy, 1996. [Google Scholar]
- D’Elia. Alezio—Archeologia e Storia di un Comune del Salento; D’Elia: Alezio, Italy, 2001. [Google Scholar]
- Robinson, E.G.D. Recent Australian and New Zeland field work in the Mediterranean Region. Field survey at Alezio, 2001. Mediterr. Archaeol. 2003, 16, 149–170. [Google Scholar]
- De Simone, C.; Marchesini, S. Monumenta Linguae Messapicae, I–II; Reichert: Wiesbaden, Germany, 2002. [Google Scholar]
- D’Andria, F. Insediamenti e territorio: l’età storica. In Atti del Convegno di Studi Sulla Magna Grecia, XXX; Scientific Committee: Lecce, Italy, 1991; pp. 393–478. [Google Scholar]
- Beraldin, J.A. Integration of laser scanning and close-range photogrammetry. The last decade and beyond. In Proceedings of the XXth ISPRS Congress, Commission VII, Istambul, Turkey, 12–23 July 2004; pp. 972–983. [Google Scholar]
- Russo, M.; Remondino, F.; Guidi, G. Principali tecniche e strumenti per il rilievo tridimensionale in ambito archeologico. Archeol. Calc. 2011, 22, 169–198. [Google Scholar]
- Gabellone, F.; Ferrari, I.; Giuri, F. Digital restoration using Image-Based 3D models. In Proceedings of the 1st International Conference on Metrology for Archaeology, Benevento, Italy, 22–23 October 2015; pp. 478–482. [Google Scholar]
- Ferrari, I.; Giuri, F. Rilievo e restituzione grafica delle aree delle Pozzelle di Pirro e di Apigliano. In Conservare l’acqua. Le pozzelle di Zollino tra Memoria Storica e Indagini Scientifiche; Chiga, A., Durante, P., Giammaruco, S., Eds.; Editrice Salentina: Galatina, Italy, 2015; pp. 63–70. [Google Scholar]
- Gabellone, F.; Ferrari, I.; Giuri, F.; Chiffi, M. Image-Based techniques for the virtualization of Egyptian contexts. In Proceedings of the 3rd IMEKO International Conference on Metrology for Archaeology and Cultural Heritage, Lecce, Italy, 23–25 October 2017; pp. 601–606. [Google Scholar]
- Ferrari, I.; Quarta, A. The Roman pier of San Cataldo: From archaeological data to 3D reconstruction. VAR Virtual Archaeol. Rev. 2019, 10, 28–39. [Google Scholar] [CrossRef]
- Gabellone, F.; Ferrari, I.; Giuri, F. A quick method for the texture mapping of meshes acquired by laser scanner. J. Geoinform. FCE CTU 2012, 9, 17–26. [Google Scholar] [CrossRef]
- Gabellone, F.; Ferrari, I.; Giannotta, M.T.; Dell’Aglio, A. From museum to original site: 3D environment for the virtual visit of finds re-contextualized in their original provenance. In Proceedings of the 2013 Digital Heritage International Congress, Marseille, France, 8 October–1 November 2013; Volume II, pp. 215–222. [Google Scholar]
- Gabellone, F.; Ferrari, I.; Giuri, F. The Palmieri hypogeum in Lecce. From the integrated survey to the dissemination of contents. In Proceedings of the 2015 Digital Heritage International Congress, Granada, Spain, 28 September–2 October 2015; Volume I, pp. 247–254. [Google Scholar]
- Malfitana, D.; Gabellone, F.; Cacciaguerra, G.; Ferrari, I.; Giuri, F.; Pantellaro, C. Critical reading of surviving structures starting from old studies for new reconstructive proposal of the Roman theatre of Catania. In Proceedings of the 8th International Congress on Archaeology, Computer Graphics, Cultural Heritage and Innovation, Valencia, Spain, 5–7 September 2016; pp. 155–161. [Google Scholar]
- De Juliis, E.M. L’attività archeologica in Puglia. In Atti del Convegno di Studi Sulla Magna Grecia, XXI; Scientific Committee: Taranto, Italy, 1982; pp. 293–322. [Google Scholar]
- De Juliis, E.M. L’attività archeologica in Puglia. In Atti del Convegno di Studi Sulla Magna Grecia, XXII; Scientific Committee: Taranto, Italy, 1983; pp. 503–530. [Google Scholar]
- De Juliis, E.M. L’attività archeologica in Puglia. In Atti del Convegno di Studi Sulla Magna Grecia, XXIII; Scientific Committee: Taranto, Italy, 1984; pp. 421–446. [Google Scholar]
- De Juliis, E.M. Un quindicennio di ricerche archeologiche in Puglia: 1970–1984. Parte II: 1978–1984. Taras 1985, 2, 177–227. [Google Scholar]
- Andreassi, G. L’attività archeologica in Puglia. In Atti del Convegno di Studi Sulla Magna Grecia, XXV; Scientific Committee: Taranto, Italy, 1986; pp. 371–396. [Google Scholar]
- Ciongoli, G.P. Alezio. In Archeologia dei Messapi; D’Andria, F., Ed.; Edipuglia: Bari, Italia, 1990; pp. 197–200. [Google Scholar]
- De Santis, V.; Congedo, F. Alezio (Lecce). Monte d’Elia; Raggi. Taras 2010, 1, 179–182. [Google Scholar]
- De Pascalis, A.L. Storia dei Rinvenimenti Archeologici di Alezio. Carta Archeologica Dell’area Urbana. MSc Degree Thesis, University of Lecce, Lecce, Italy, 2000–2001. Unpublished. [Google Scholar]
- Pagliara, C. Materiali iscritti arcaici del Salento. In Annali della Scuola Normale di Pisa, XIII; Scientific Committee: Pisa, Italy, 1983; Volume 1, pp. 1–99. [Google Scholar]
- Lombardo, M. Tombe, necropoli e riti funerari in Messapia: Evidenze e problemi. Studi Antich. 1994, 7, 25–45. [Google Scholar]
- Semeraro, G. ἐν νηυσί: Ceramica Greca e Società nel Salento Arcaico; Edipuglia: Bari, Italy, 1997. [Google Scholar]
- Santoro, C. Osservazioni preliminari sui nuovi documenti epigrafici prelatini. Ling. Storia Puglia 1981, 12, 33–80. [Google Scholar]
- Santoro, C. Le epigrafi di Alezio e i problemi della lingua messapica. ACCMPD 1983, 8, 59–113. [Google Scholar]
- Santoro, C. Nuovi Studi Messapici III, Primo Supplemento; Congedo Editore: Galatina, Italy, 1984. [Google Scholar]
- Santoro, C. Alezio. Studi Etruschi 1986, 52, 352–370. [Google Scholar]
- Santoro, C. Alezio. Studi Etruschi 1991, 56, 411–417. [Google Scholar]
- Uggeri, G. La Viabilità Romana nel Salento; Grafischena: Fasano, Italy, 1983. [Google Scholar]
- Conyers, L.B.; Goodman, D. Ground-Penetrating Radar: An. Introduction for Archaeologists; Altamira Press: Walnut Creek, CA, USA, 1997. [Google Scholar]
- Persico, R. Introduction on Ground Penetrating Radar: Inverse Scattering and Data Processing; Wiley: New York, NY, USA, 2014. [Google Scholar]
- Leucci, G. Non Destructive Testing for Archaeology and Cultural Heritage A Practical Guide and New Perspectives; Springer: Berlin, Germany, 2019. [Google Scholar]
- Goodman, D. GPR Slice Version 7.0 Manual. Available online: http://www.gpr-survey.com.
- Conyers, L.B. Innovative ground-penetrating radar methods for archaeological mapping. Archaeol. Prospect. 2006, 13, 139–141. [Google Scholar] [CrossRef]
- Goodman, D.; Steinberg, J.; Damiata, B.; Nishimure, Y.; Schneider, K.; Hiromichi, H.; Hisashi, N. GPR overlay analysis for archaeological prospection. In Proceedings of the 11th International Conference on Ground Penetrating Radar, Columbus, Ohio, 19–22 June 2006. [Google Scholar]
- Conyers, L.B. Ground-Penetrating Radar for Archaeology; Altamira Press: Walnut Creek, CA, USA, 2004. [Google Scholar]
- Conyers, L.B. Interpreting Ground-Penetrating Radar for Archaeology; Left Coast Press: Walnut Creek, CA, USA, 2012. [Google Scholar]
- Conyers, L.B.; Daniels, J.M.; Haws, J.; Benedetti, M. An Upper Palaeolithic landscape analysis of coastal Portugal using ground-penetrating radar. Archaeol. Prospect. 2013, 20, 45–51. [Google Scholar] [CrossRef]
- Goodman, D.; Piro, S. GPR Remote Sensing in Archaeology; Geotechnologies and the Environment Series; Springer: Berlin, Germany, 2013; Volume 9. [Google Scholar]


© 2019 by the authors. Licensee MDPI, Basel, Switzerland. This article is an open access article distributed under the terms and conditions of the Creative Commons Attribution (CC BY) license (http://creativecommons.org/licenses/by/4.0/).
Share and Cite
Leucci, G.; Giorgi, L.D.; Ditaranto, I.; Giuri, F.; Ferrari, I.; Scardozzi, G. New Data on the Messapian Necropolis of Monte D’Elia in Alezio (Apulia, Italy) from Topographical and Geophysical Surveys. Sensors 2019, 19, 3494. https://doi.org/10.3390/s19163494
Leucci G, Giorgi LD, Ditaranto I, Giuri F, Ferrari I, Scardozzi G. New Data on the Messapian Necropolis of Monte D’Elia in Alezio (Apulia, Italy) from Topographical and Geophysical Surveys. Sensors. 2019; 19(16):3494. https://doi.org/10.3390/s19163494
Chicago/Turabian StyleLeucci, Giovanni, Lara De Giorgi, Immacolata Ditaranto, Francesco Giuri, Ivan Ferrari, and Giuseppe Scardozzi. 2019. "New Data on the Messapian Necropolis of Monte D’Elia in Alezio (Apulia, Italy) from Topographical and Geophysical Surveys" Sensors 19, no. 16: 3494. https://doi.org/10.3390/s19163494