Investigation of Dissolution Mechanism and Release Kinetics of Poorly Water-Soluble Tadalafil from Amorphous Solid Dispersions Prepared by Various Methods


Abstract
:
1. Introduction
1.1. Theoretical Background
1.1.1. Techniques for Improving Dissolution Rate of TAD
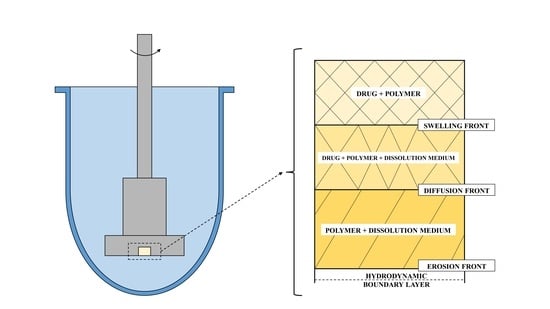
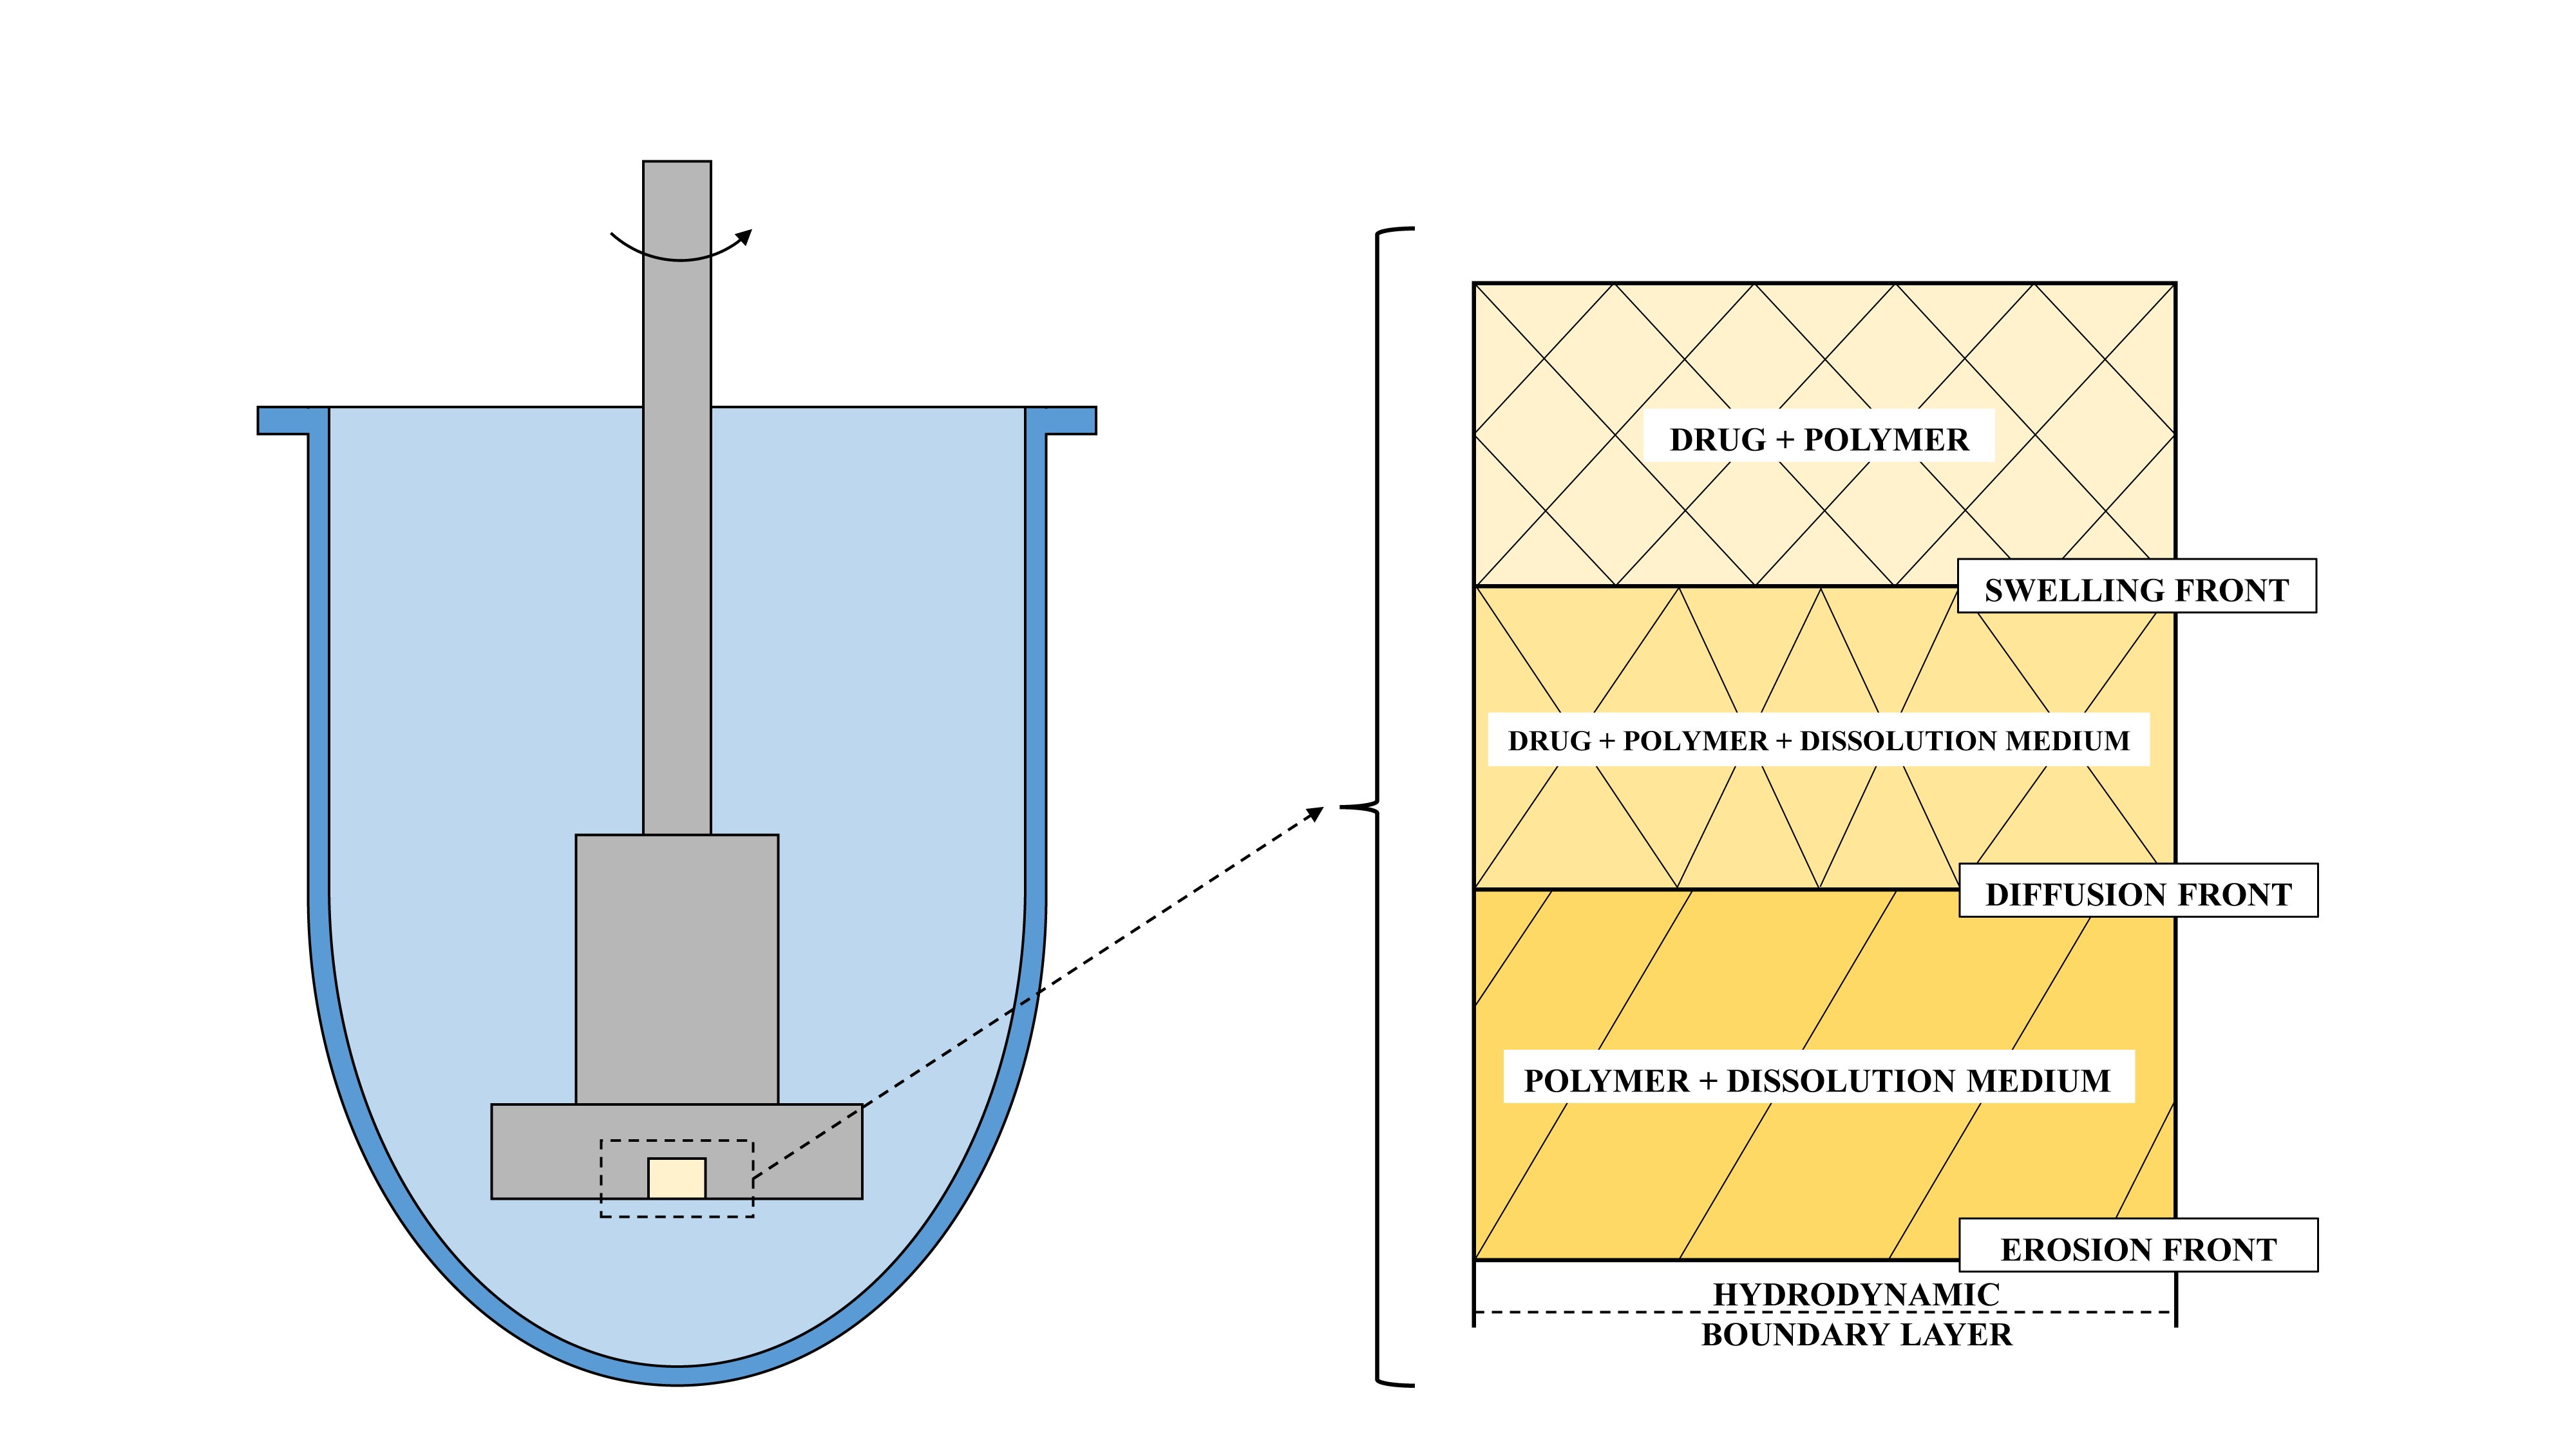
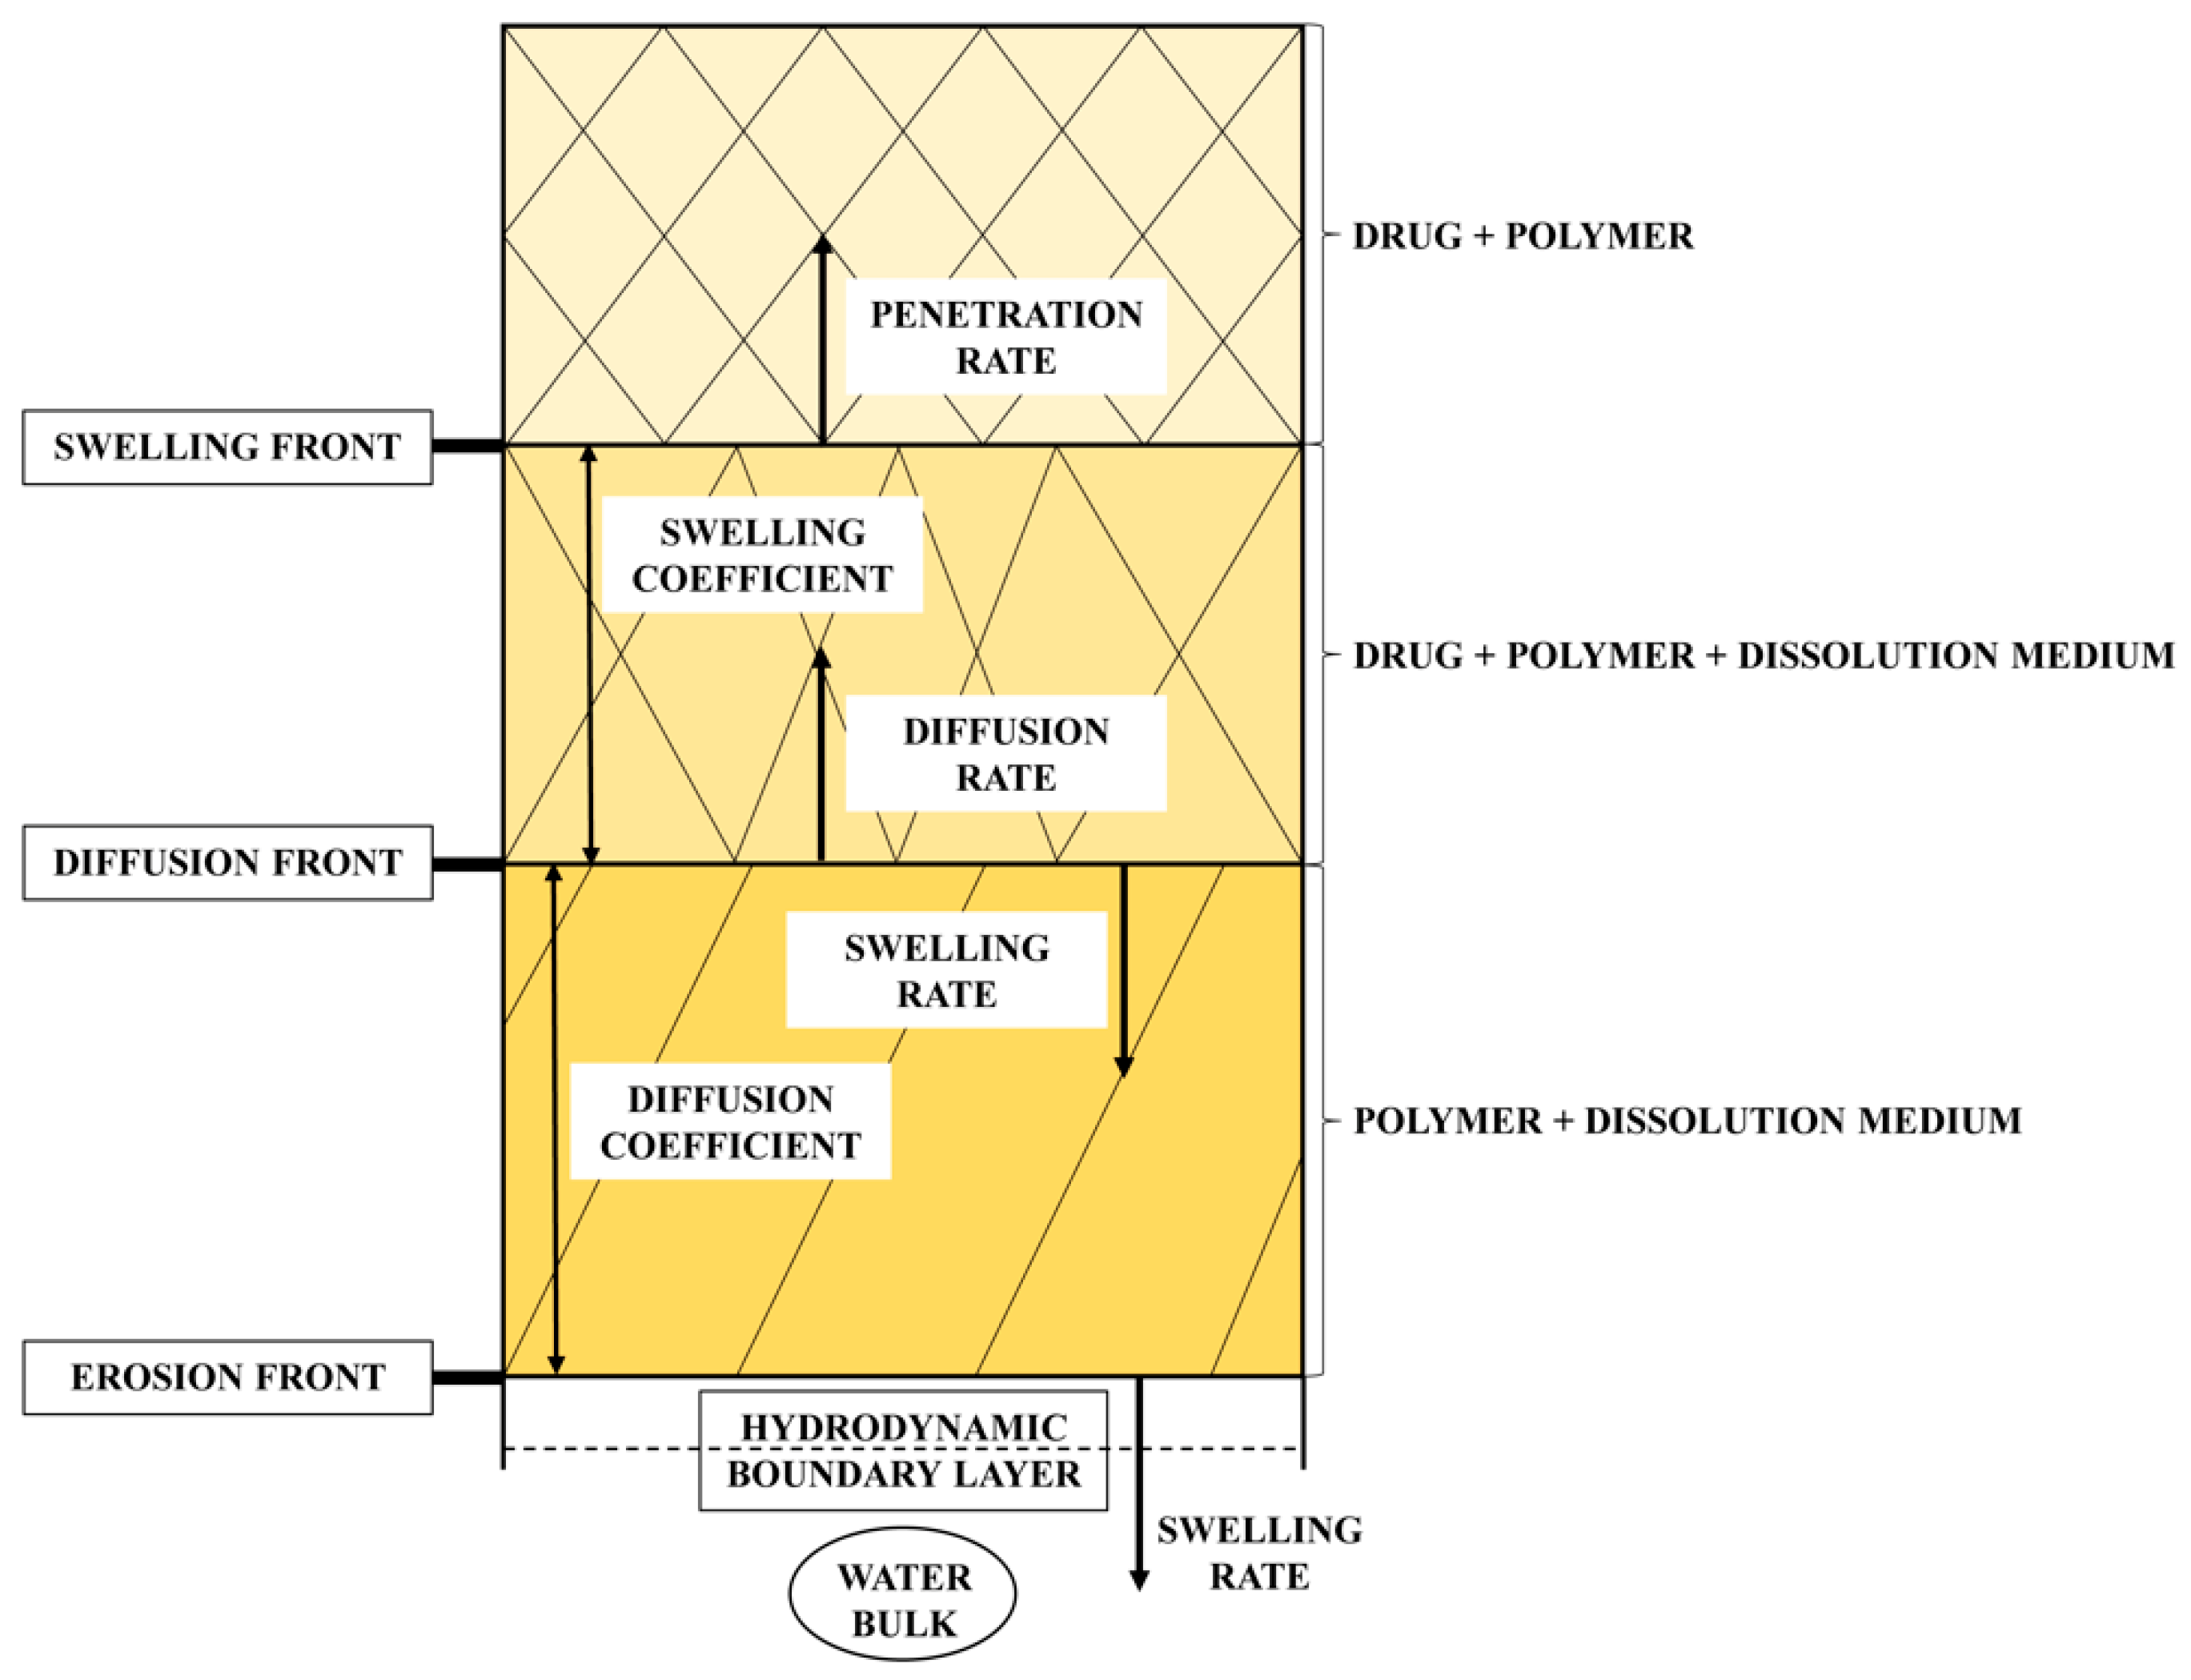
1.1.2. Dissolution Phenomena in Polymer Matrix Systems
2. Materials and Methods
2.1. Materials
2.2. Preparation of Physical Mixtures
2.3. Preparation of Solid Dispersions
2.3.1. Solvent Evaporation Method (SE)
2.3.2. Spray Drying Technique (SPD)
2.3.3. Hot-Melt Extrusion (HME)
2.4. X-Ray Powder Diffraction (XRD)
2.5. Scanning Electron Microscopy (SEM)
2.6. Fourier Transform-Infrared (FT-IR) Spectroscopy
2.7. Stability Studies
2.8. Tadalafil Solubility Test
2.9. Dissolution Studies
2.9.1. Flow-Through Cell Method
2.9.2. Apparent Intrinsic Dissolution Rate (Wood´s Apparatus)
2.10. HPLC
2.11. Differential Scanning Calorimetry (DSC)
3. Results and Discussion
3.1. Characterization of Solid Dispersions
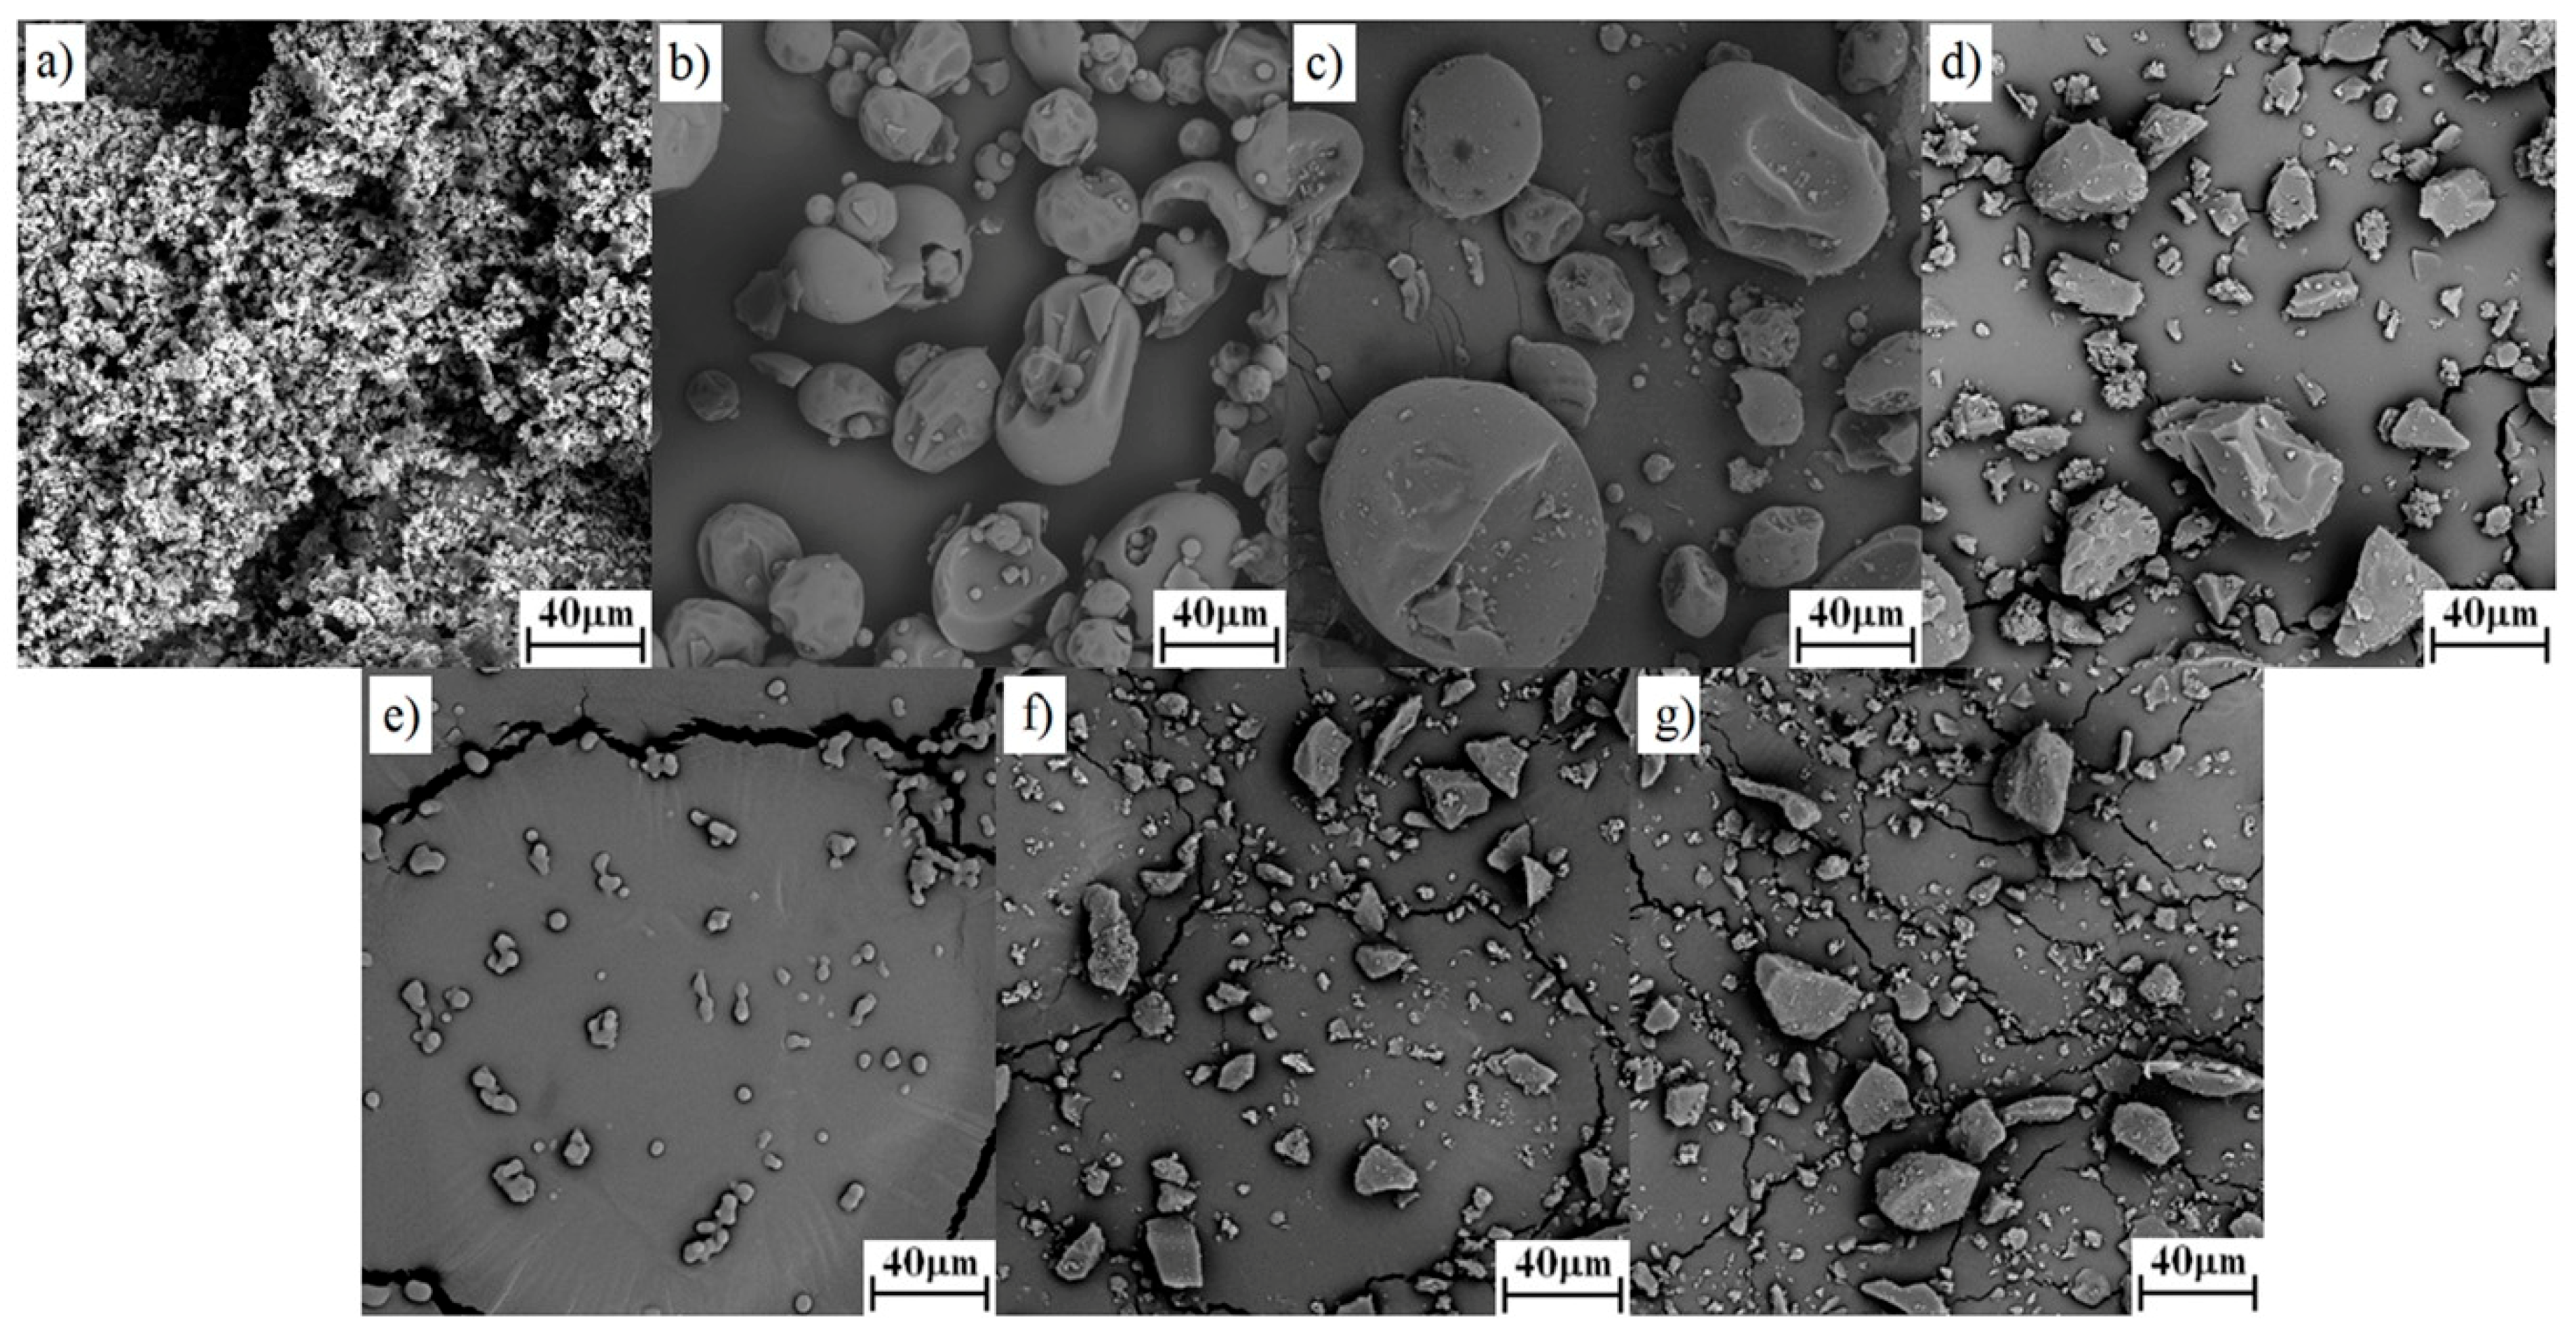
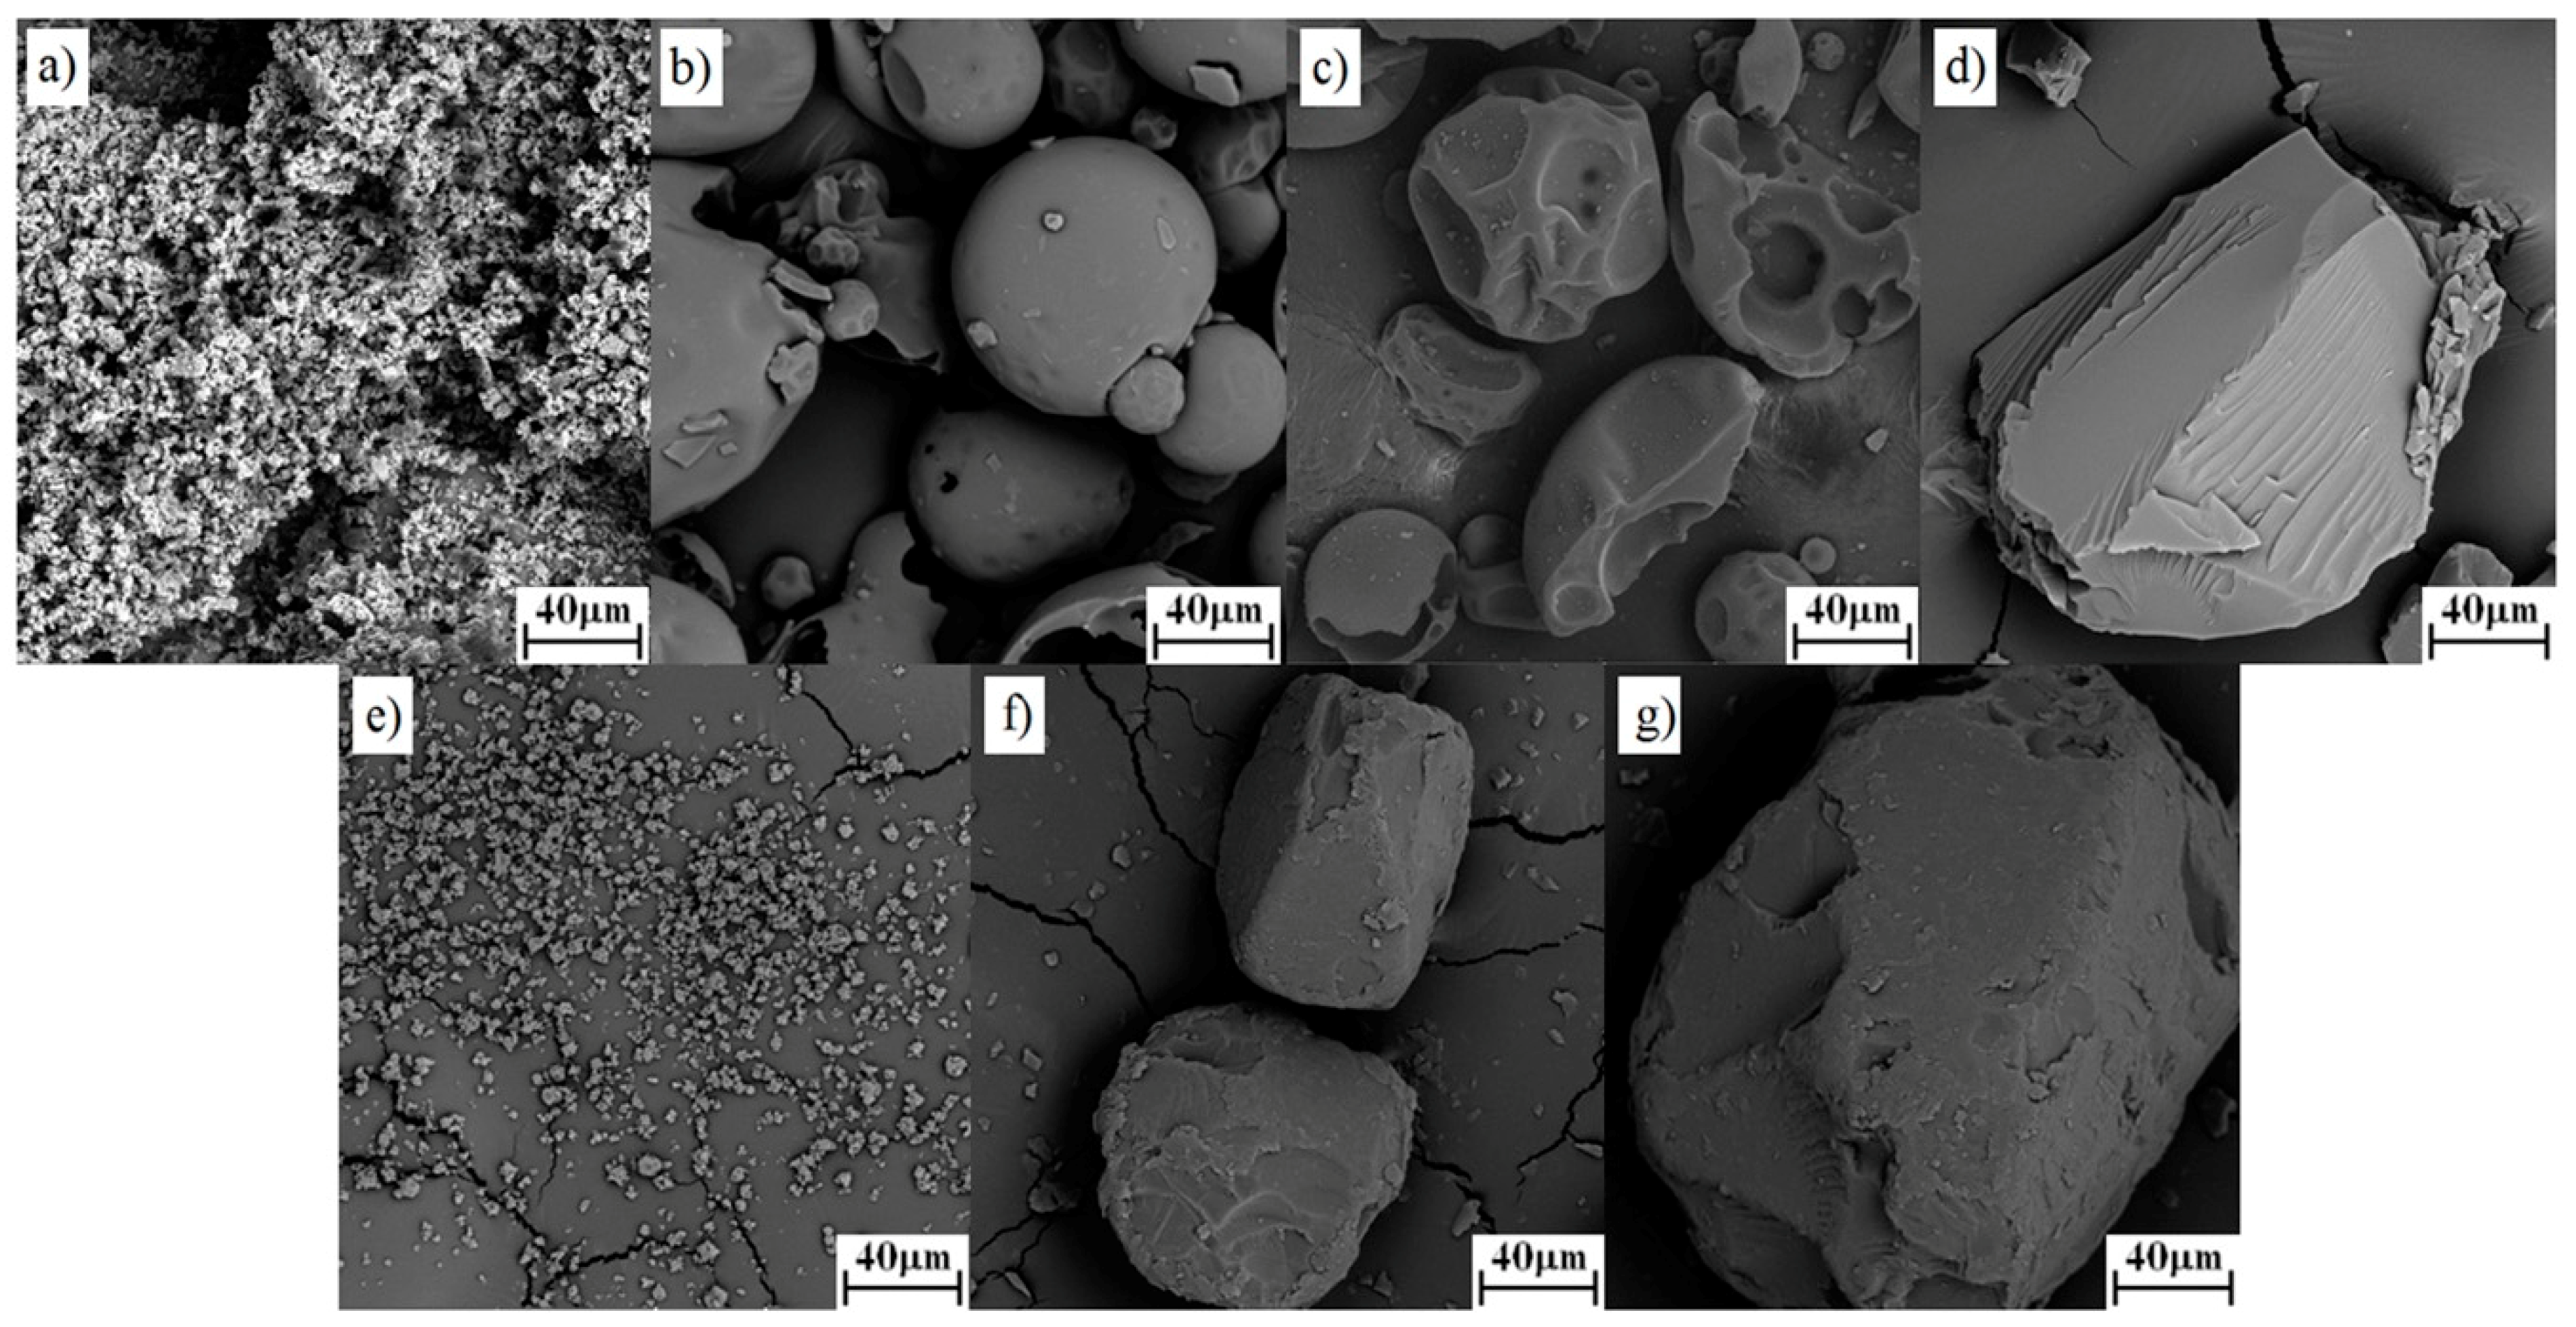
3.1.1. SEM
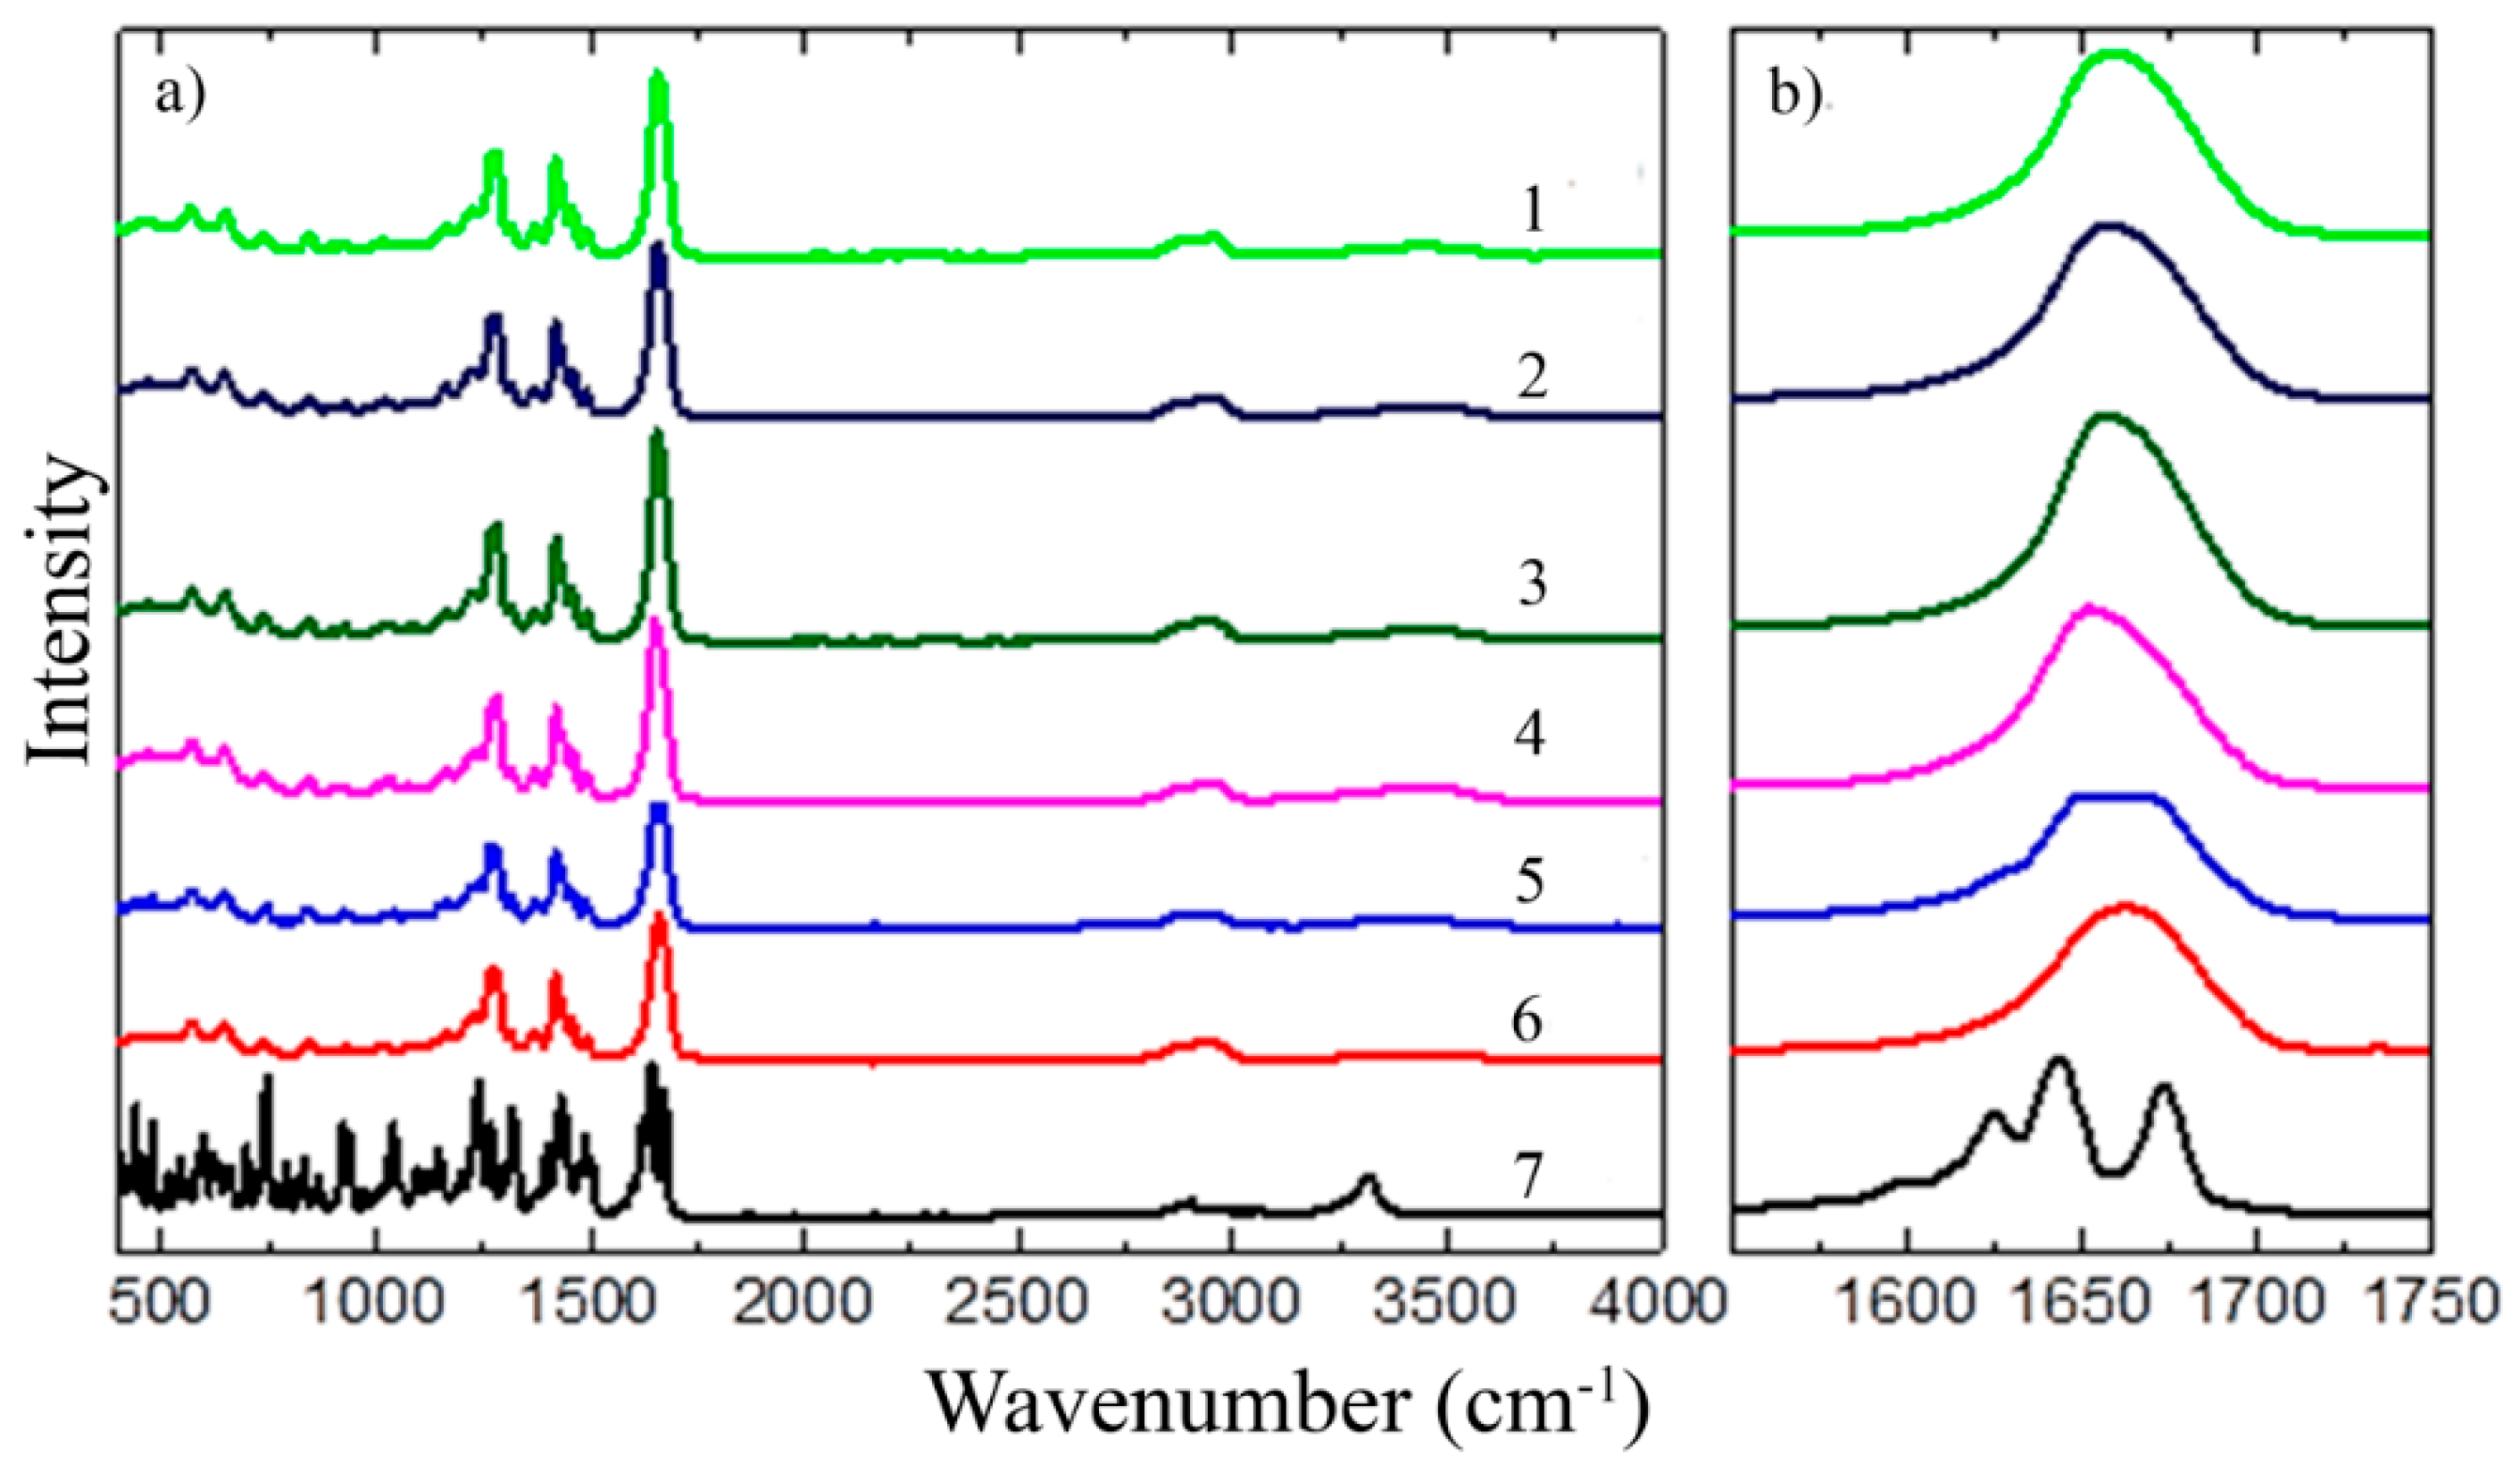
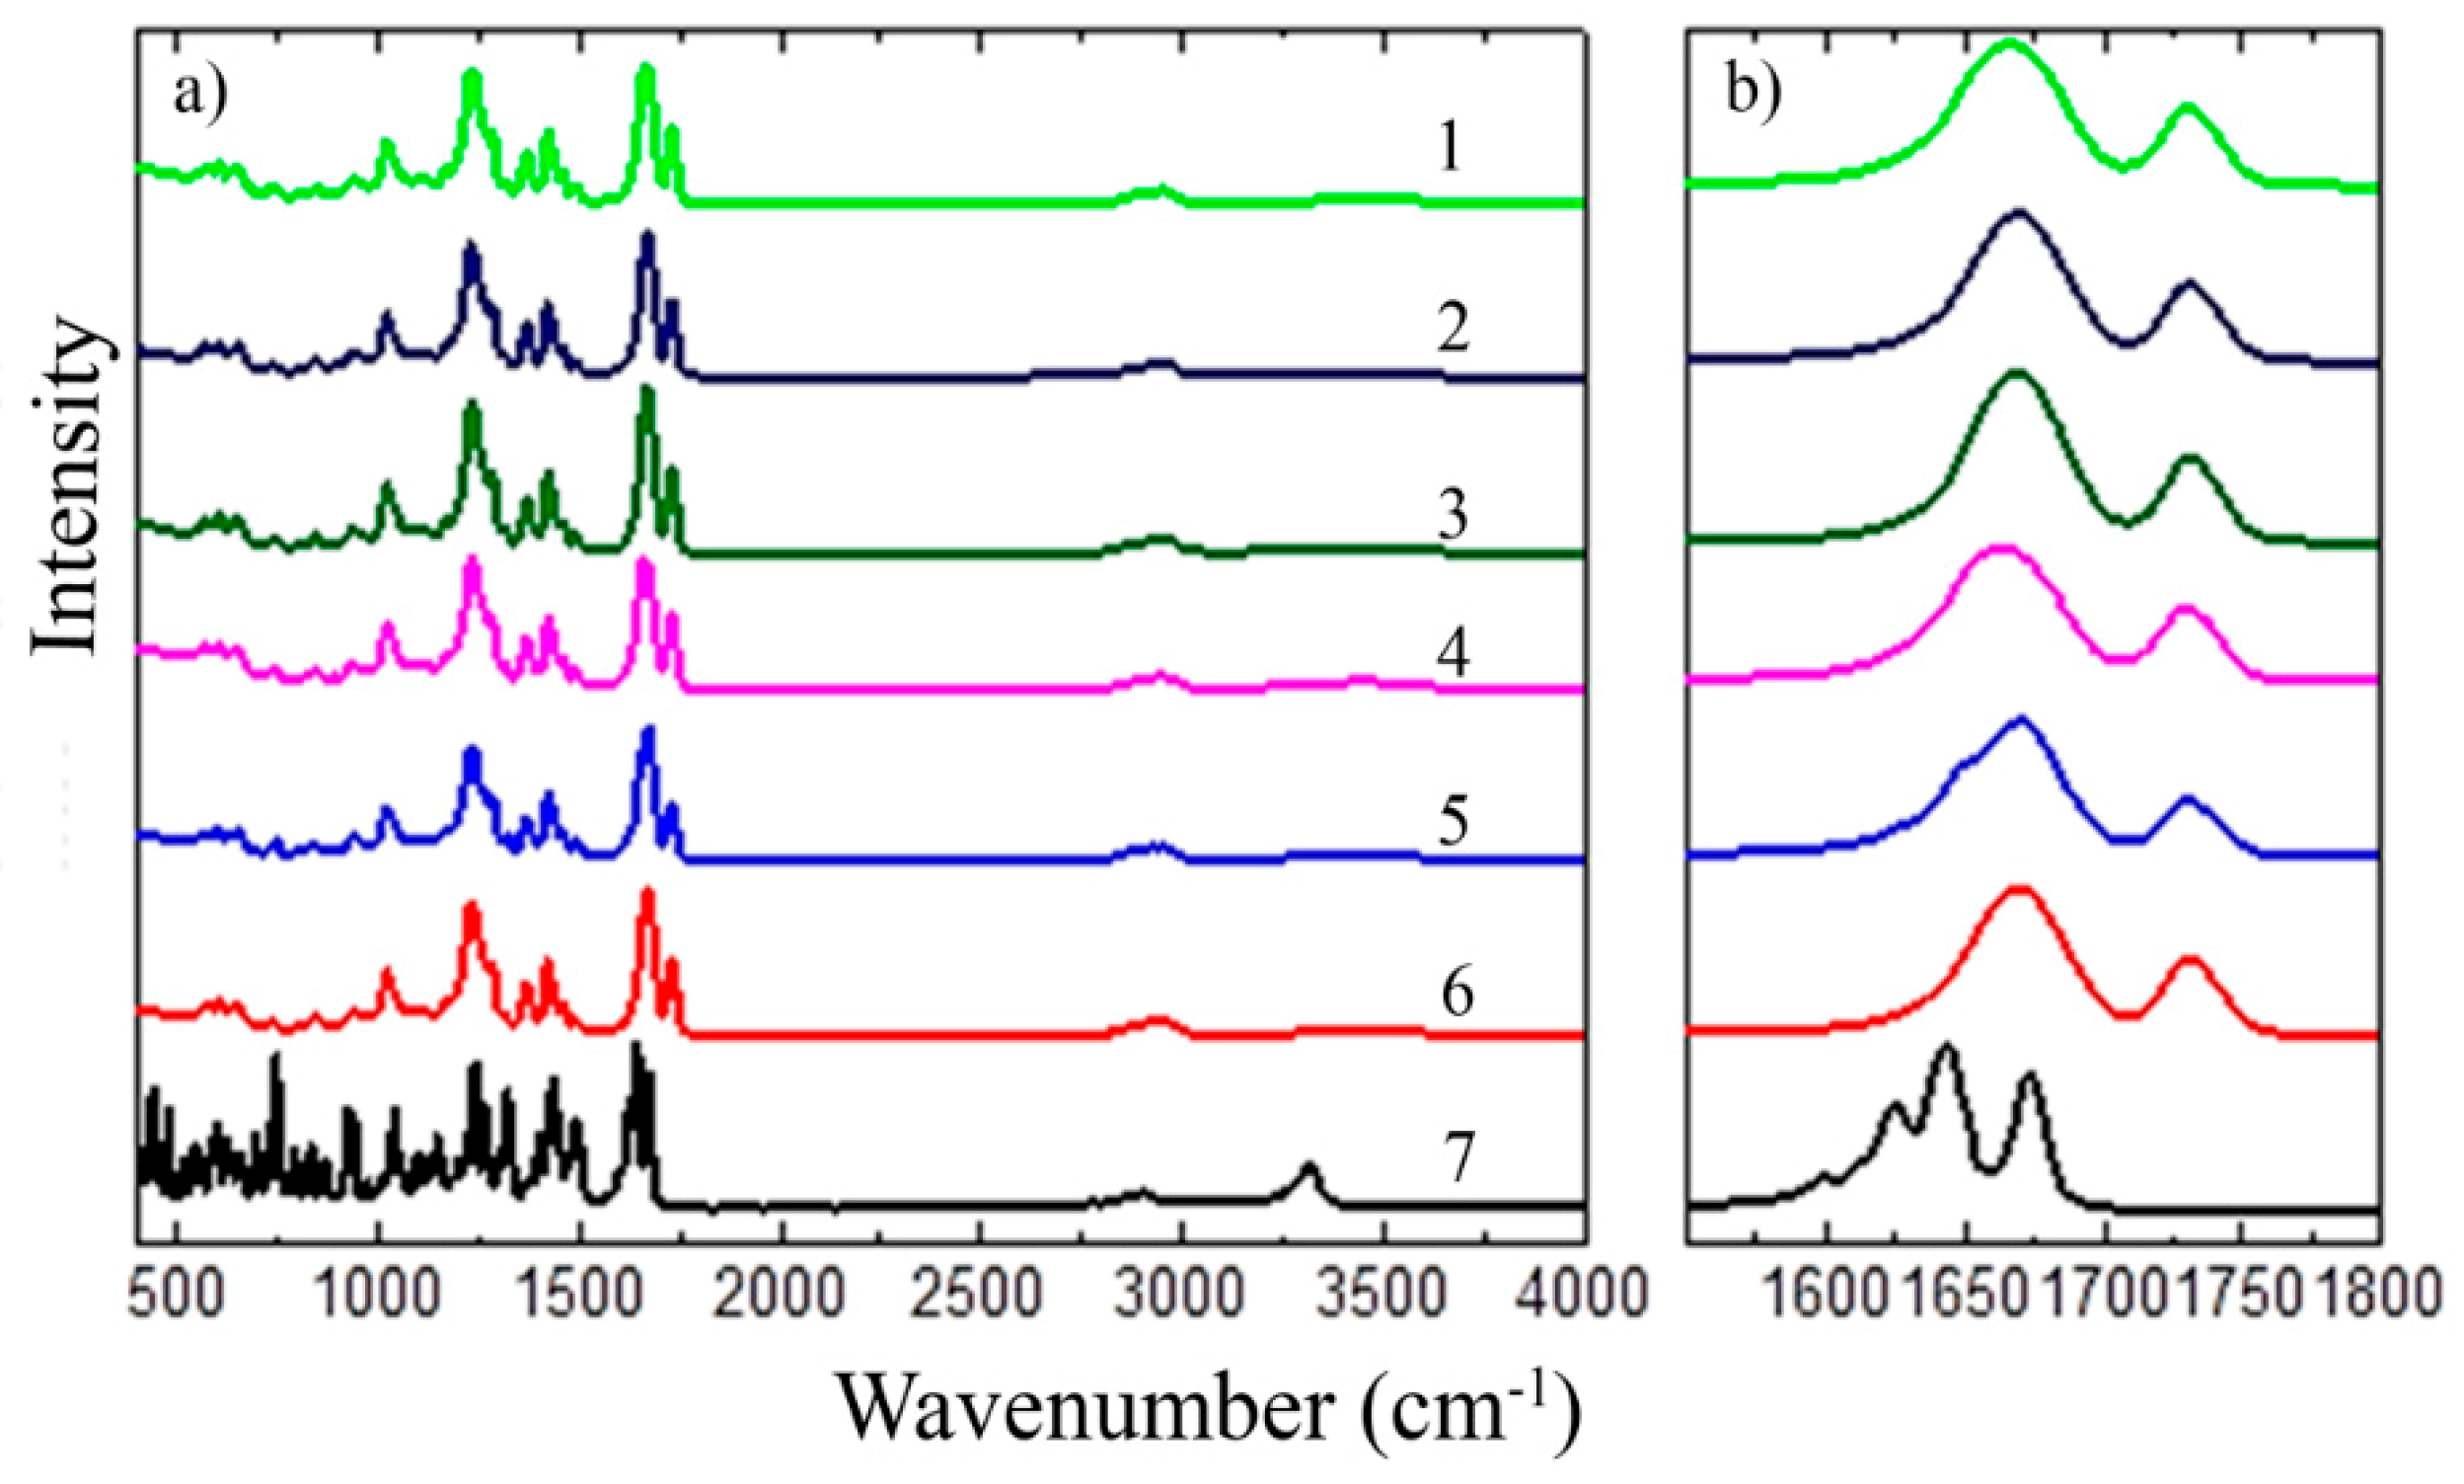
3.1.2. FT-IR
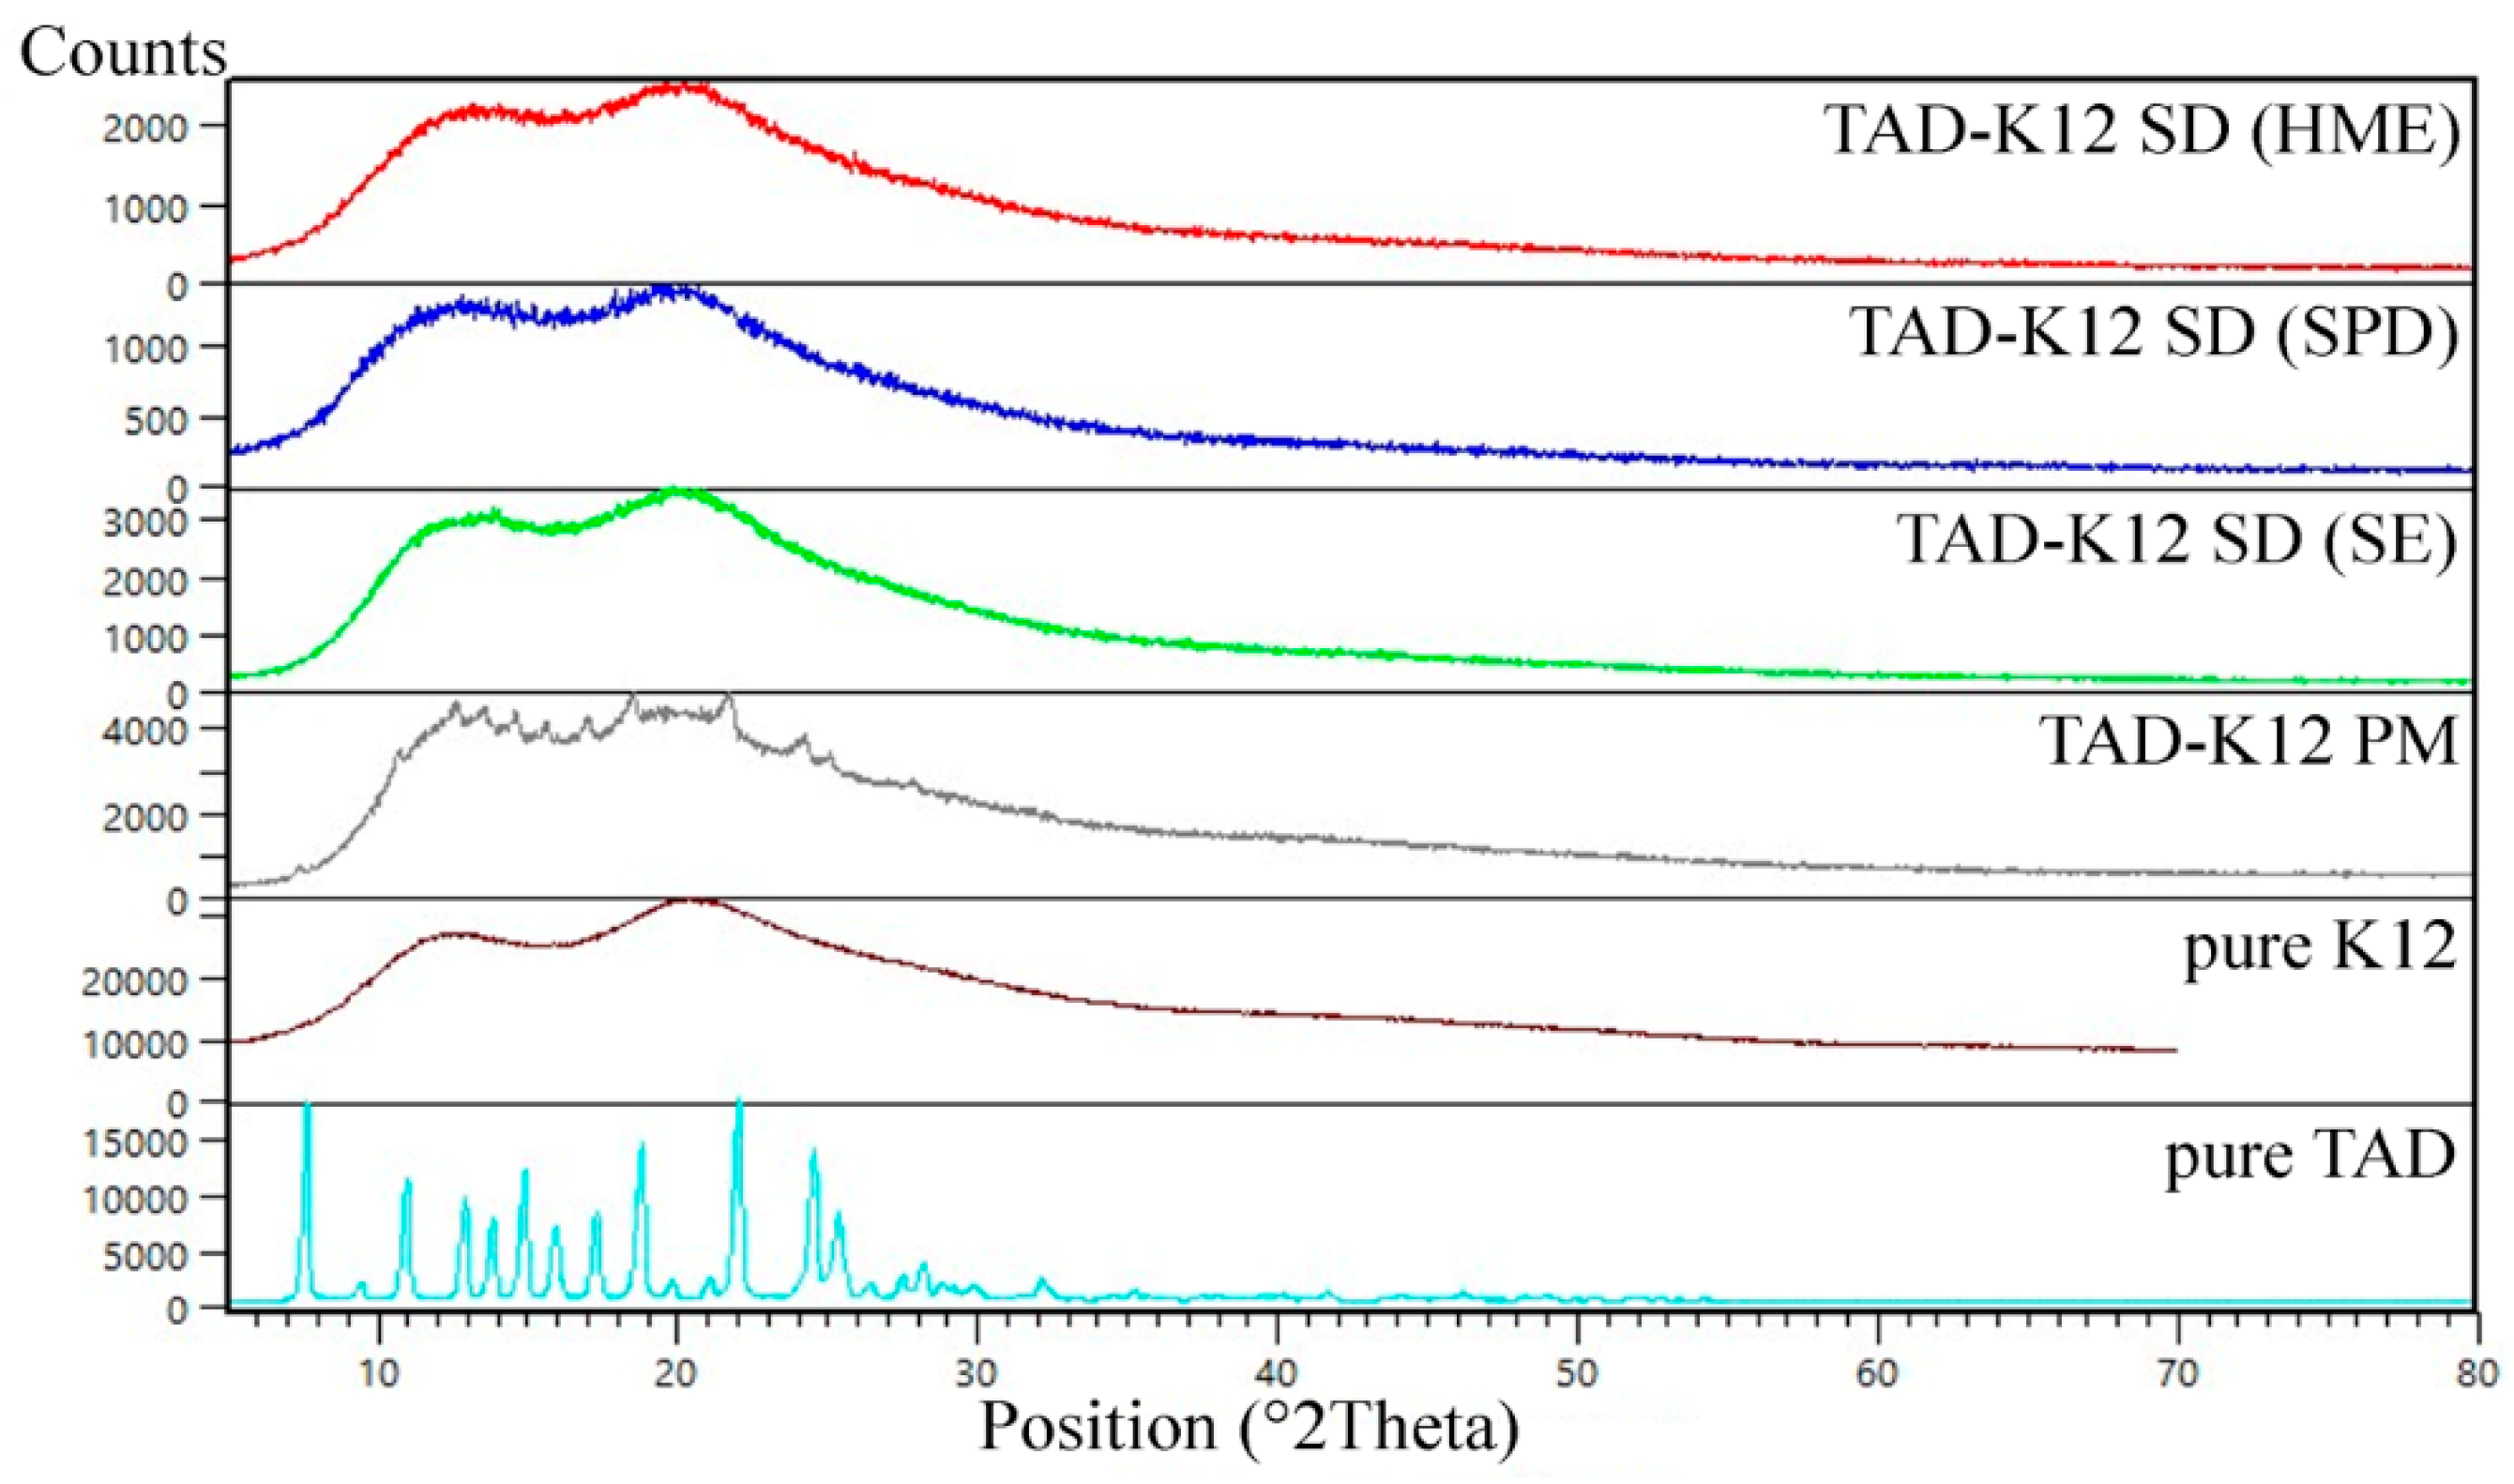
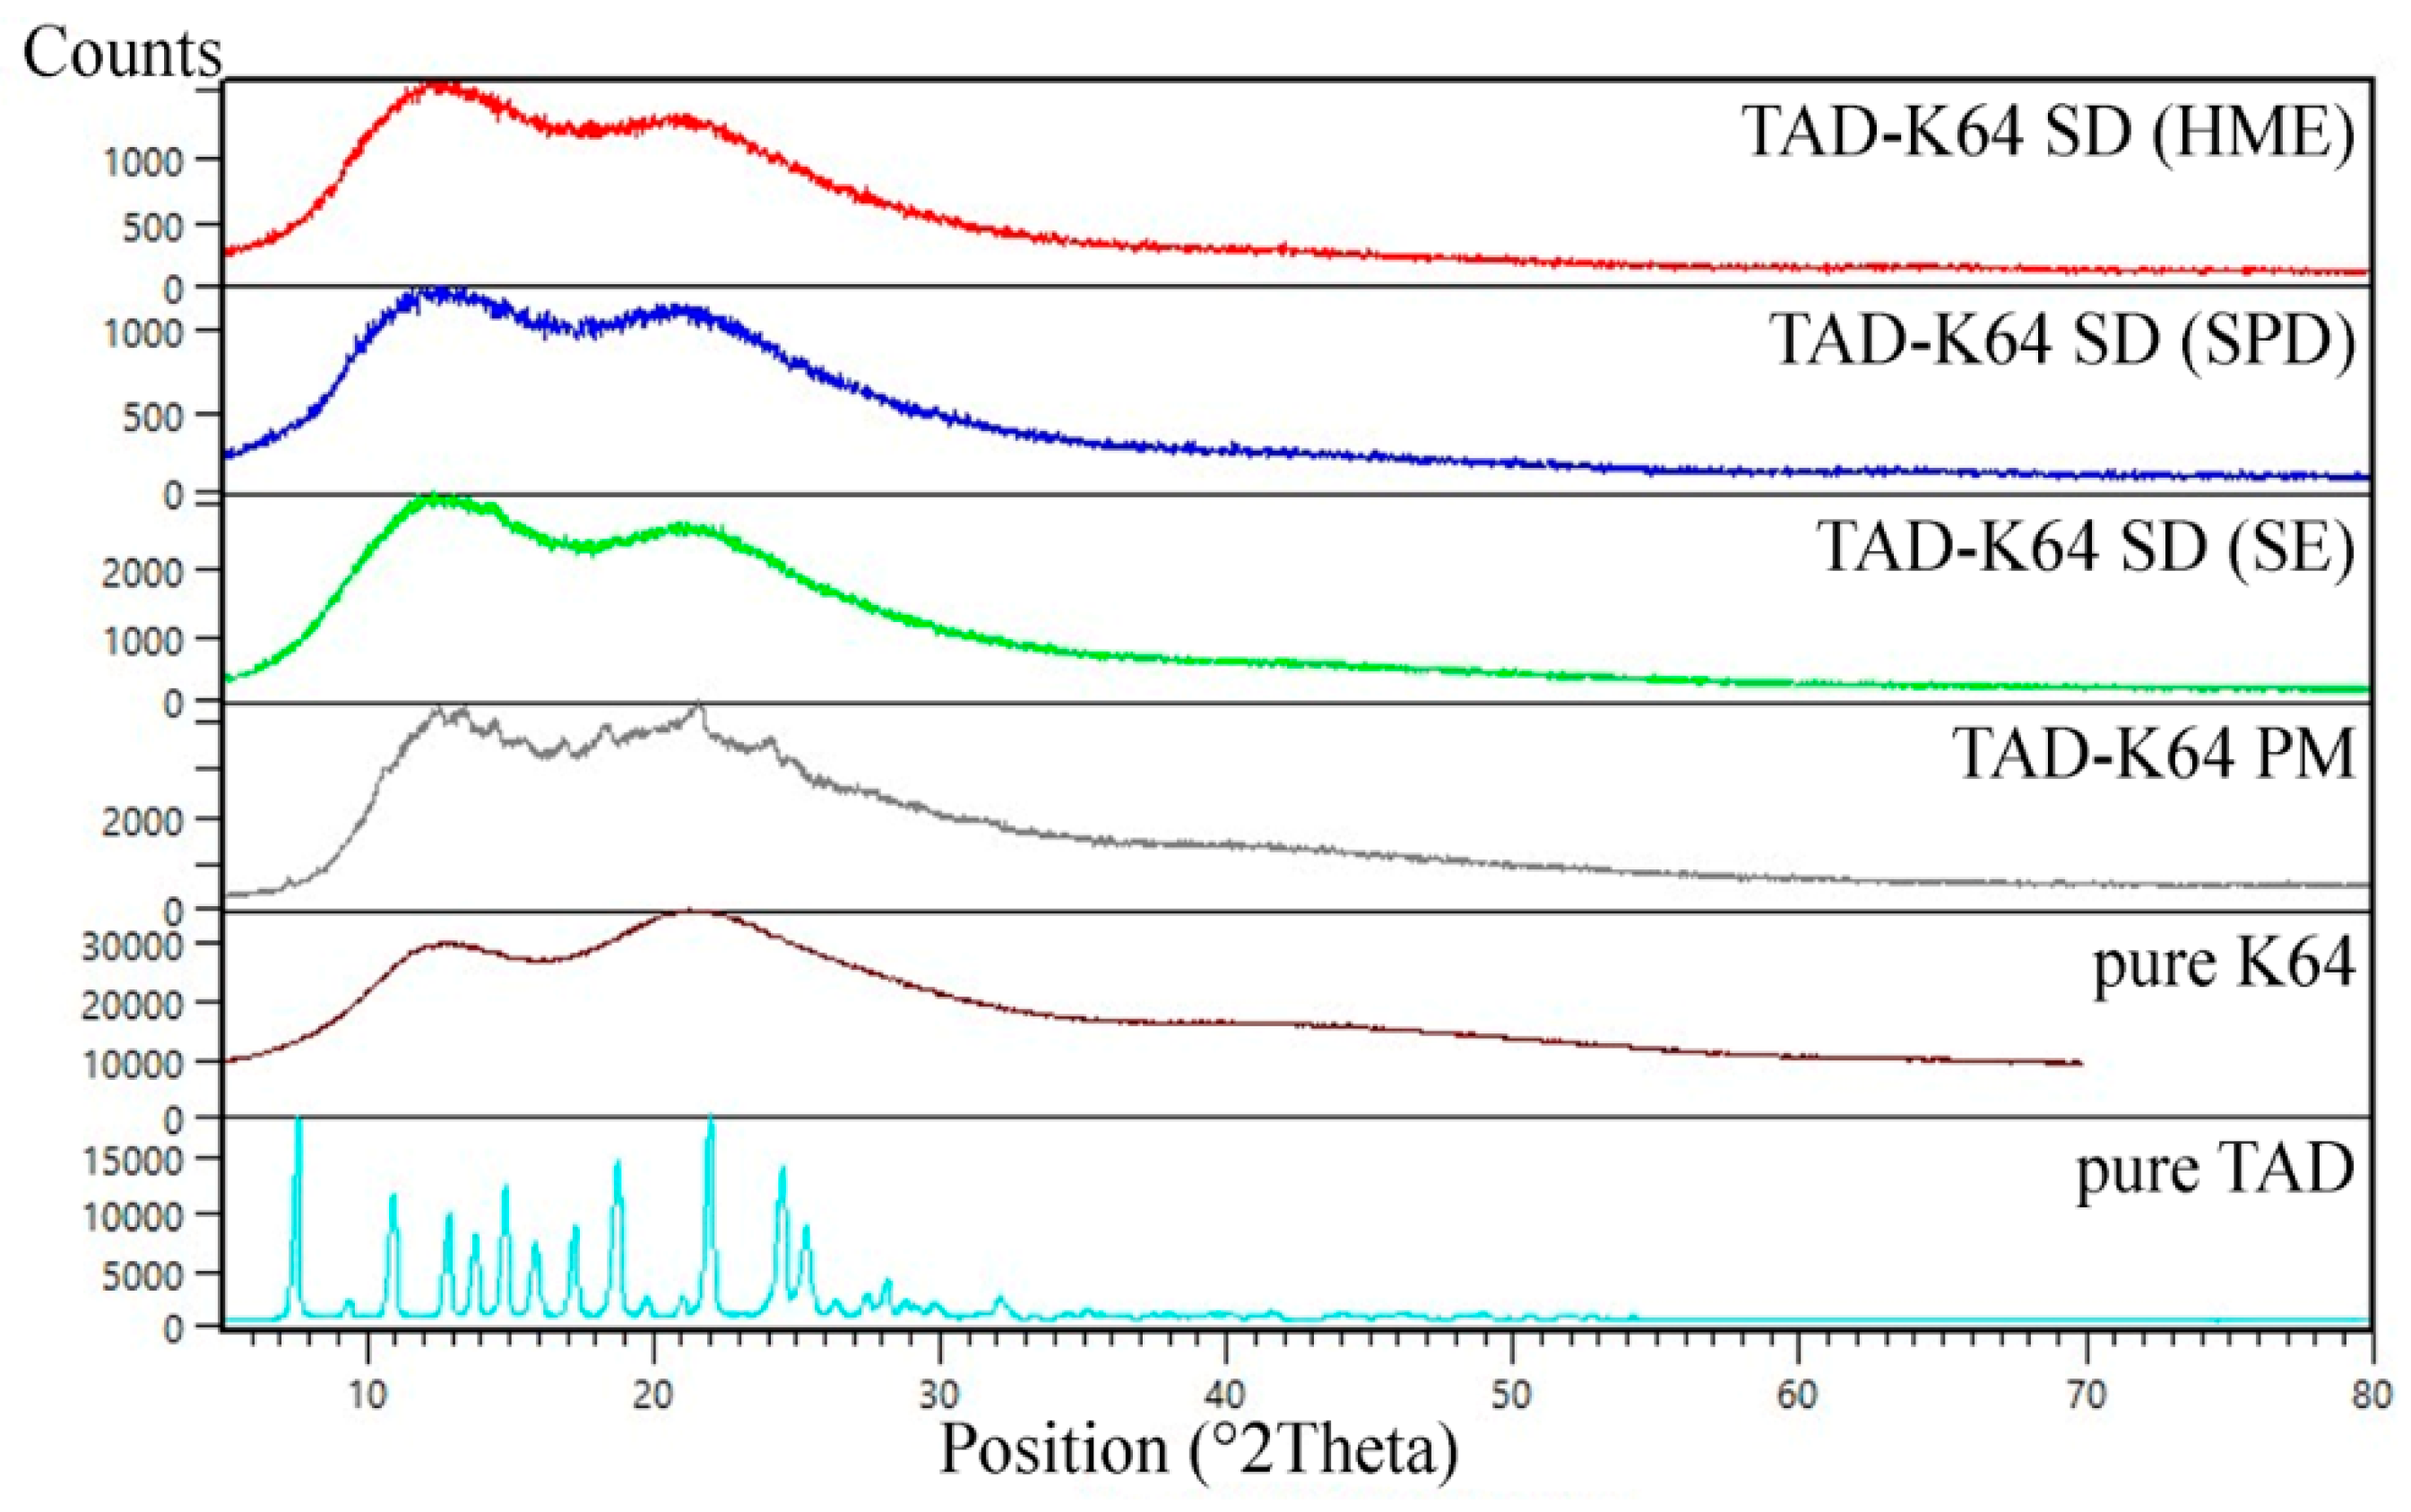
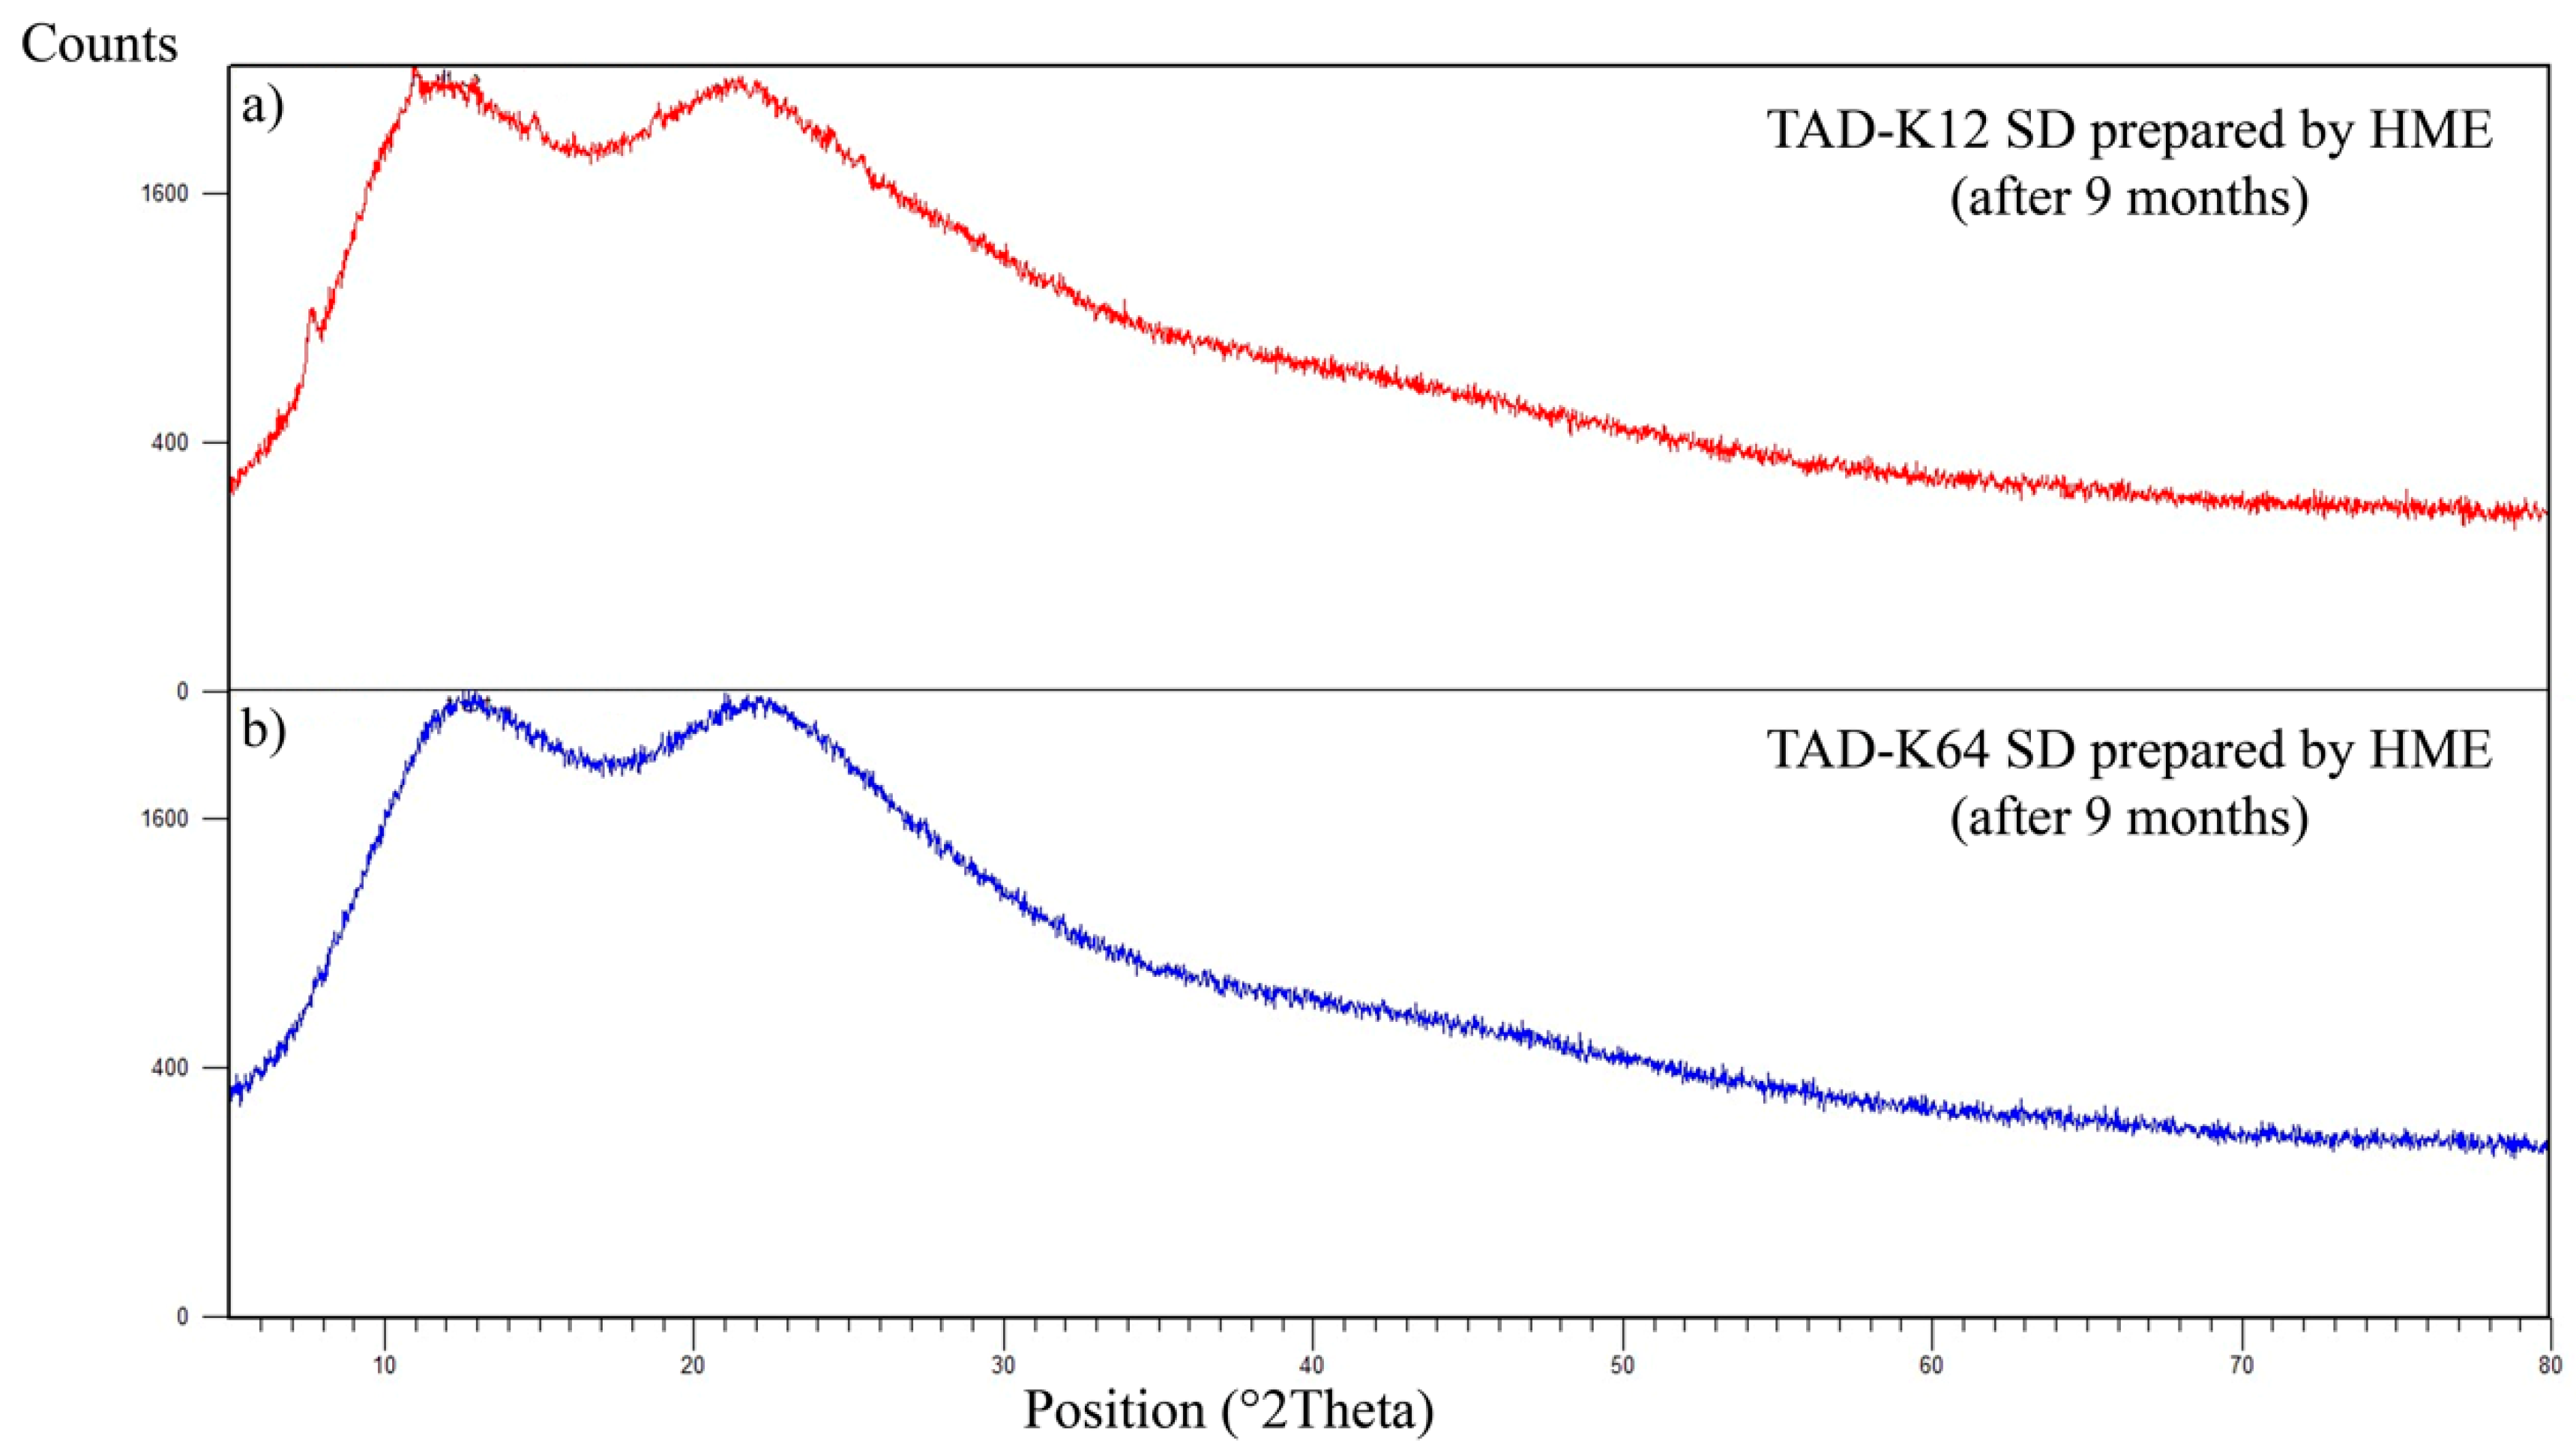
3.1.3. XRD
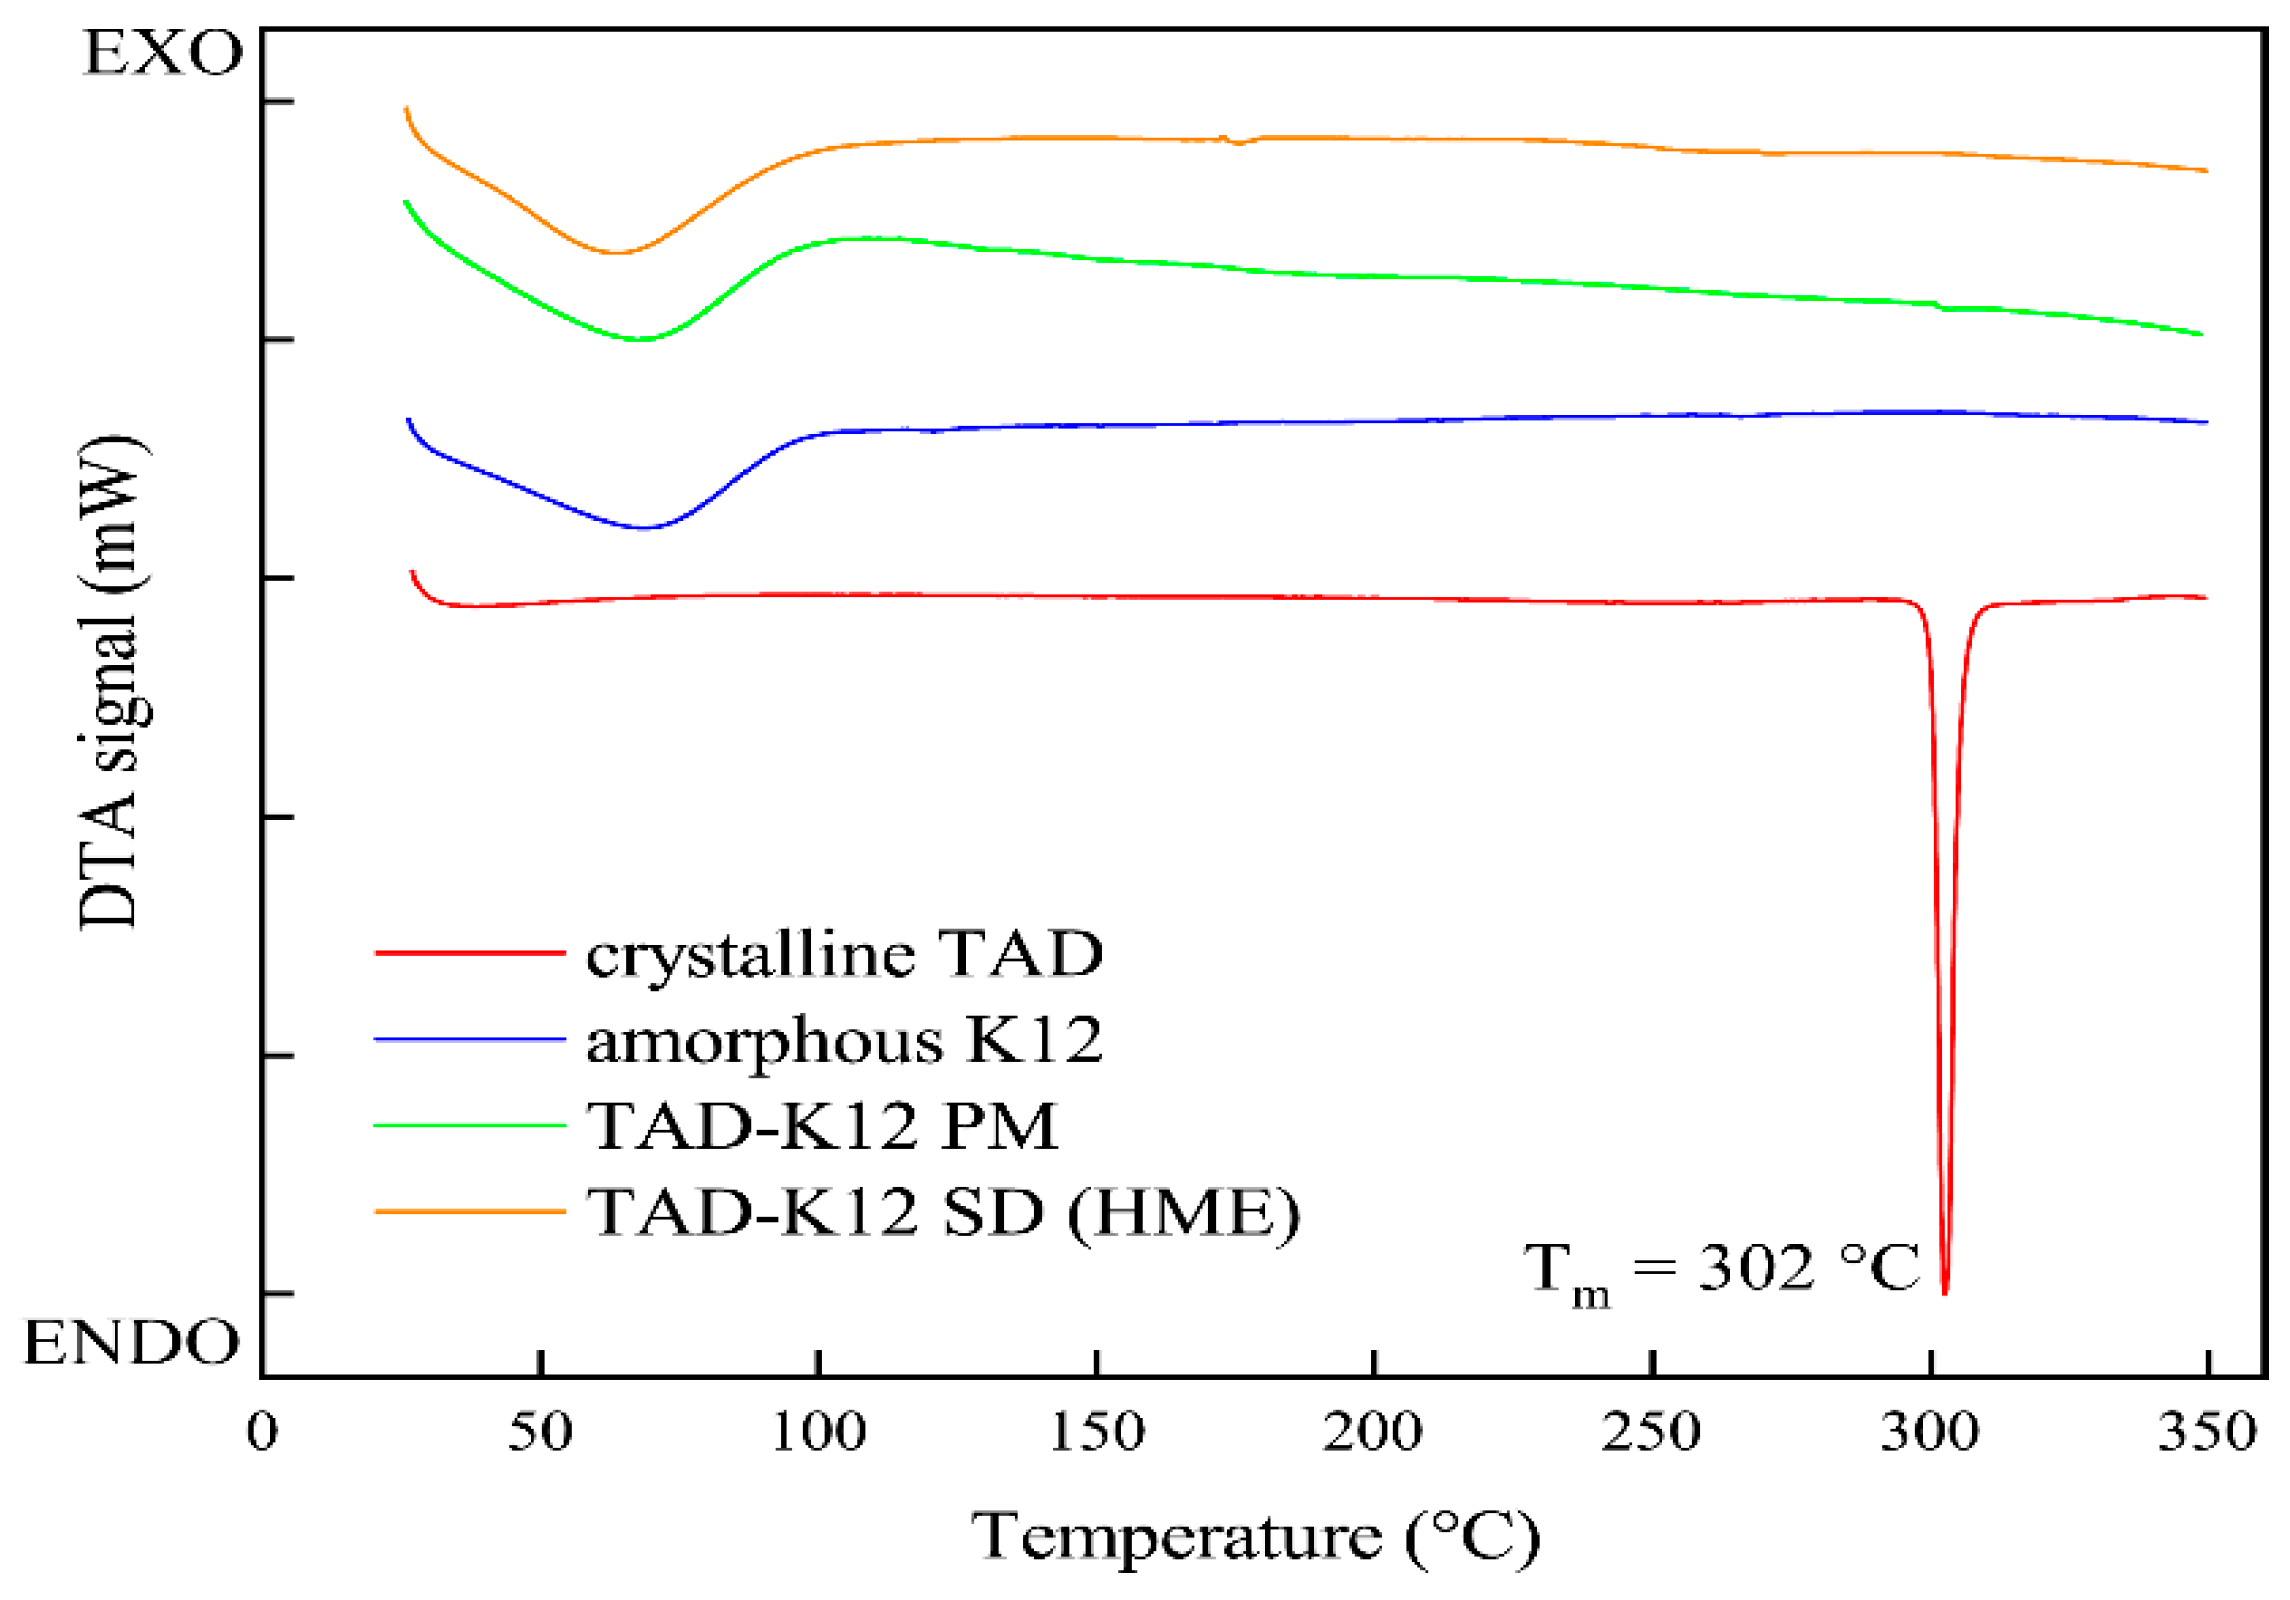
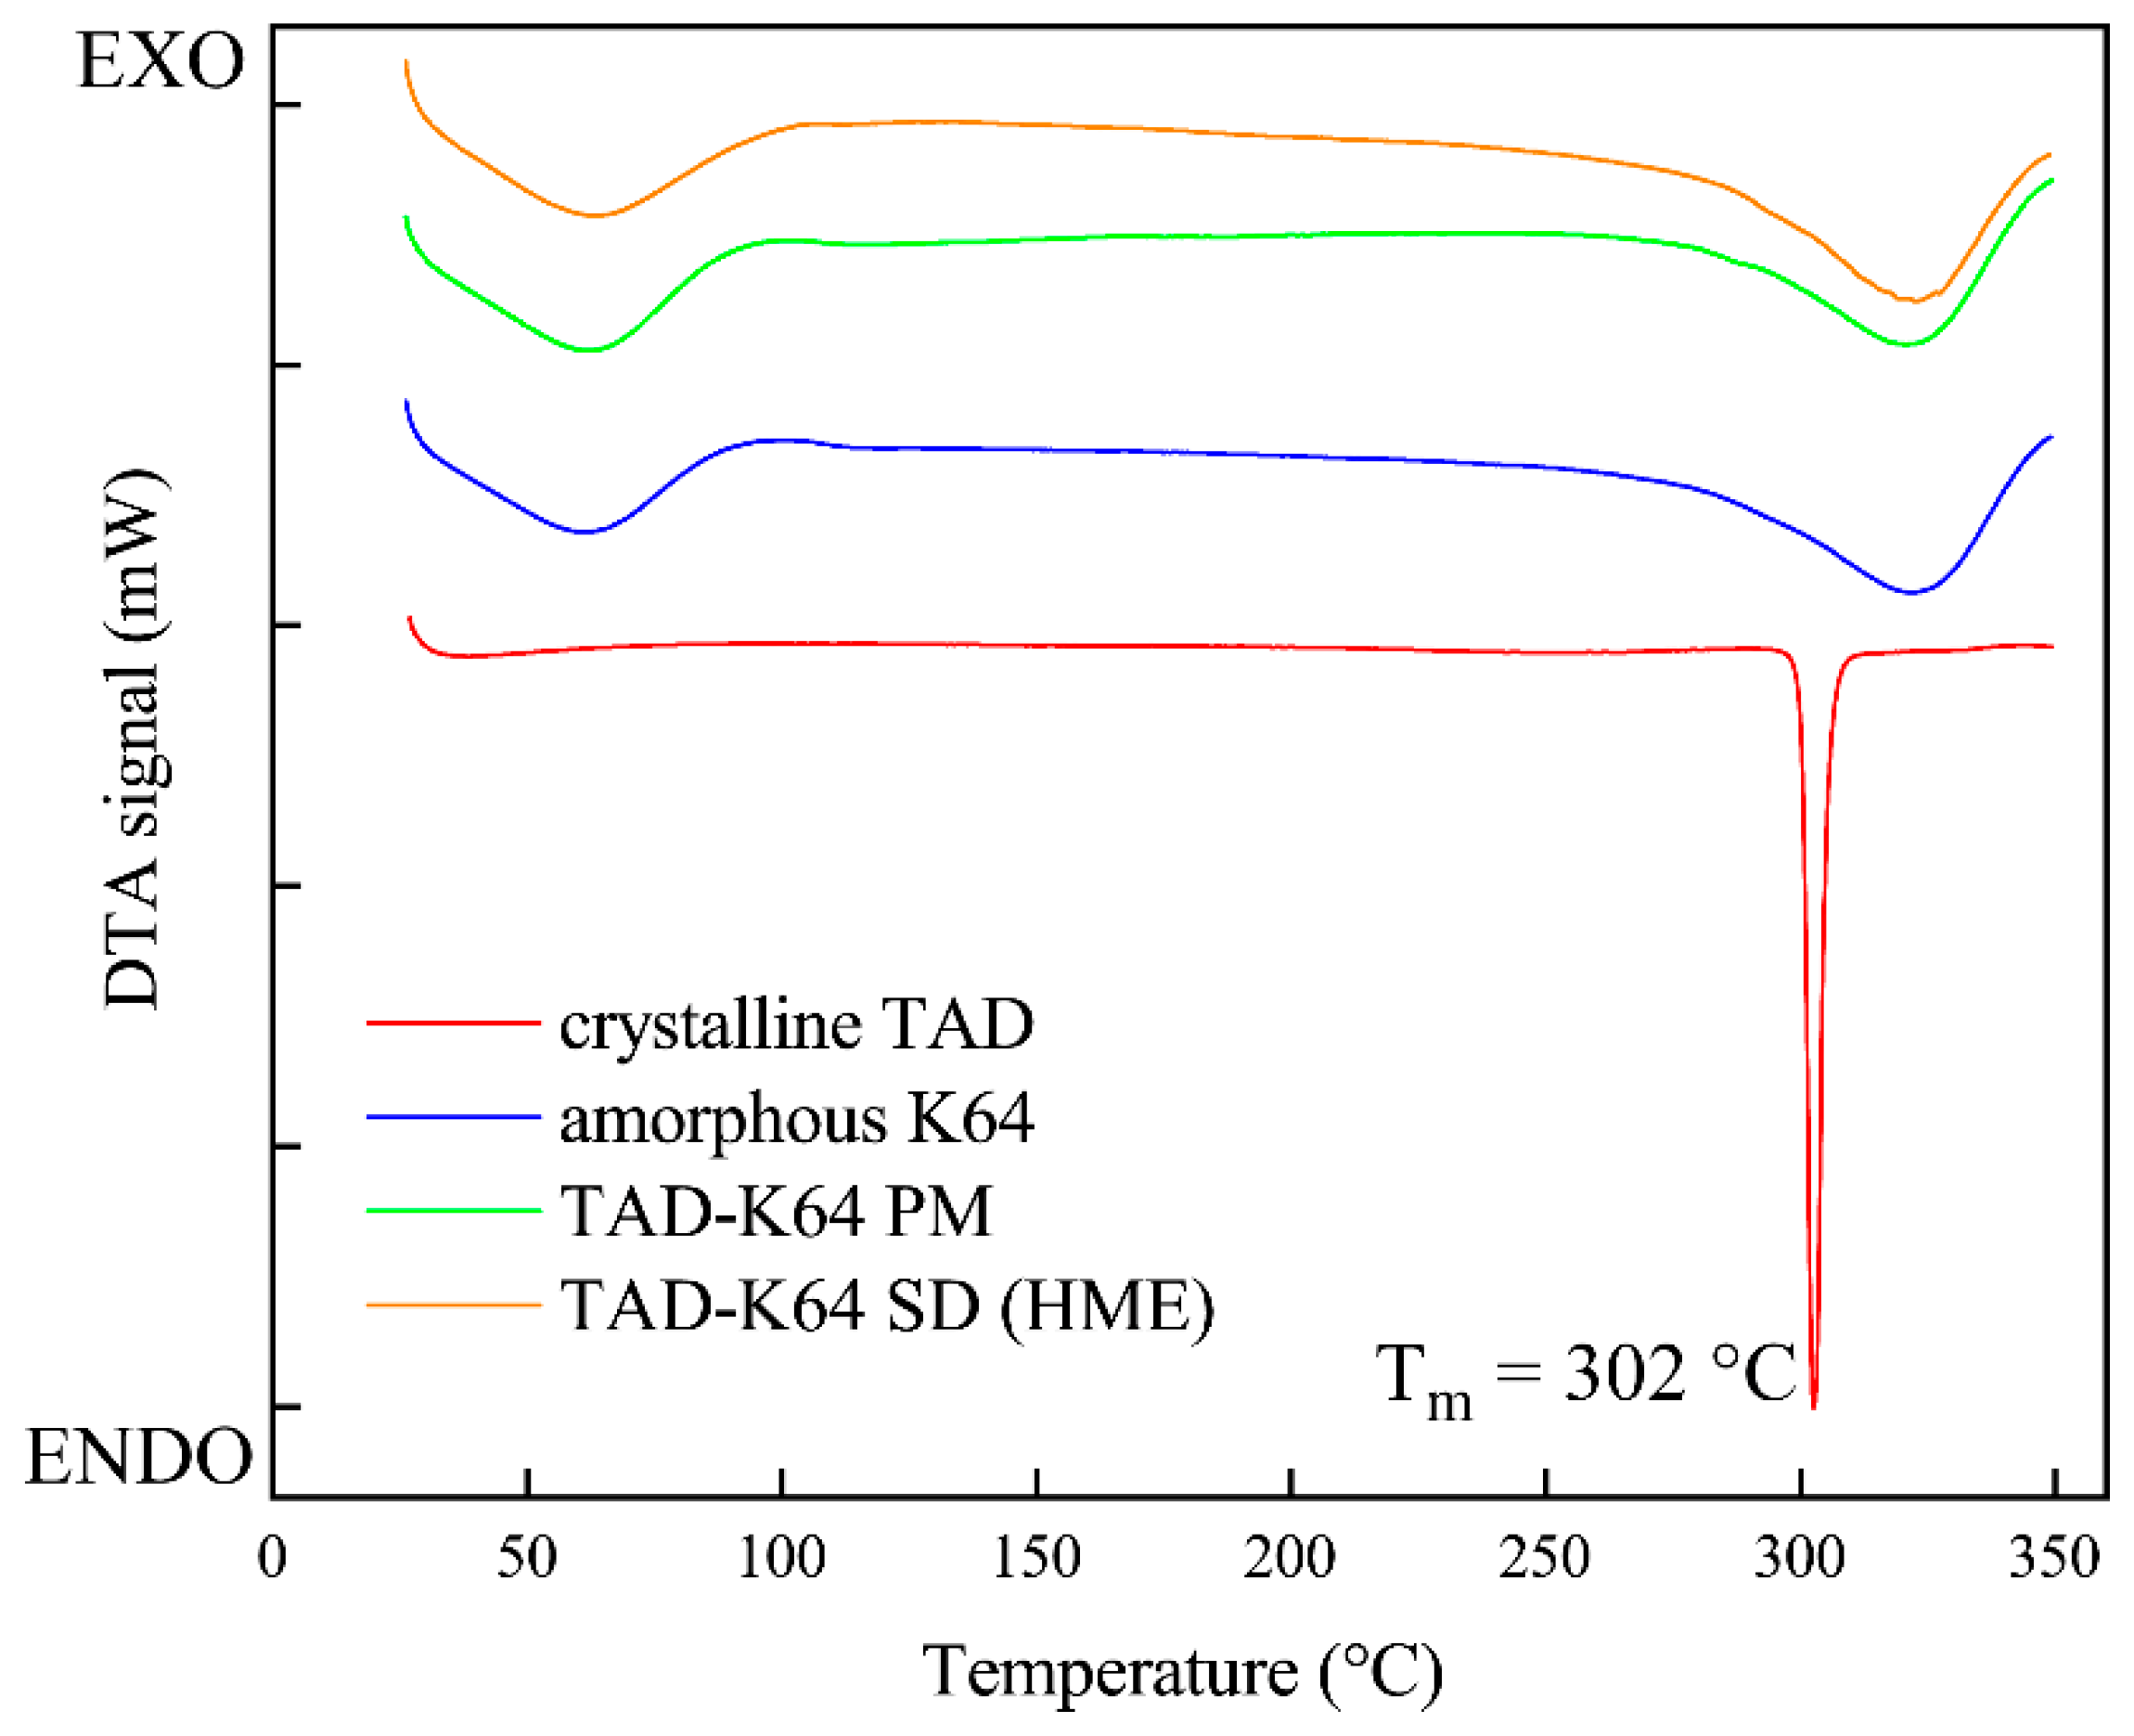
3.1.4. DSC Analysis
3.2. Physical Stability of Solid Dispersions
3.3. Dissolution Tests of TAD Solid Dispersions
3.3.1. Solubility Testing
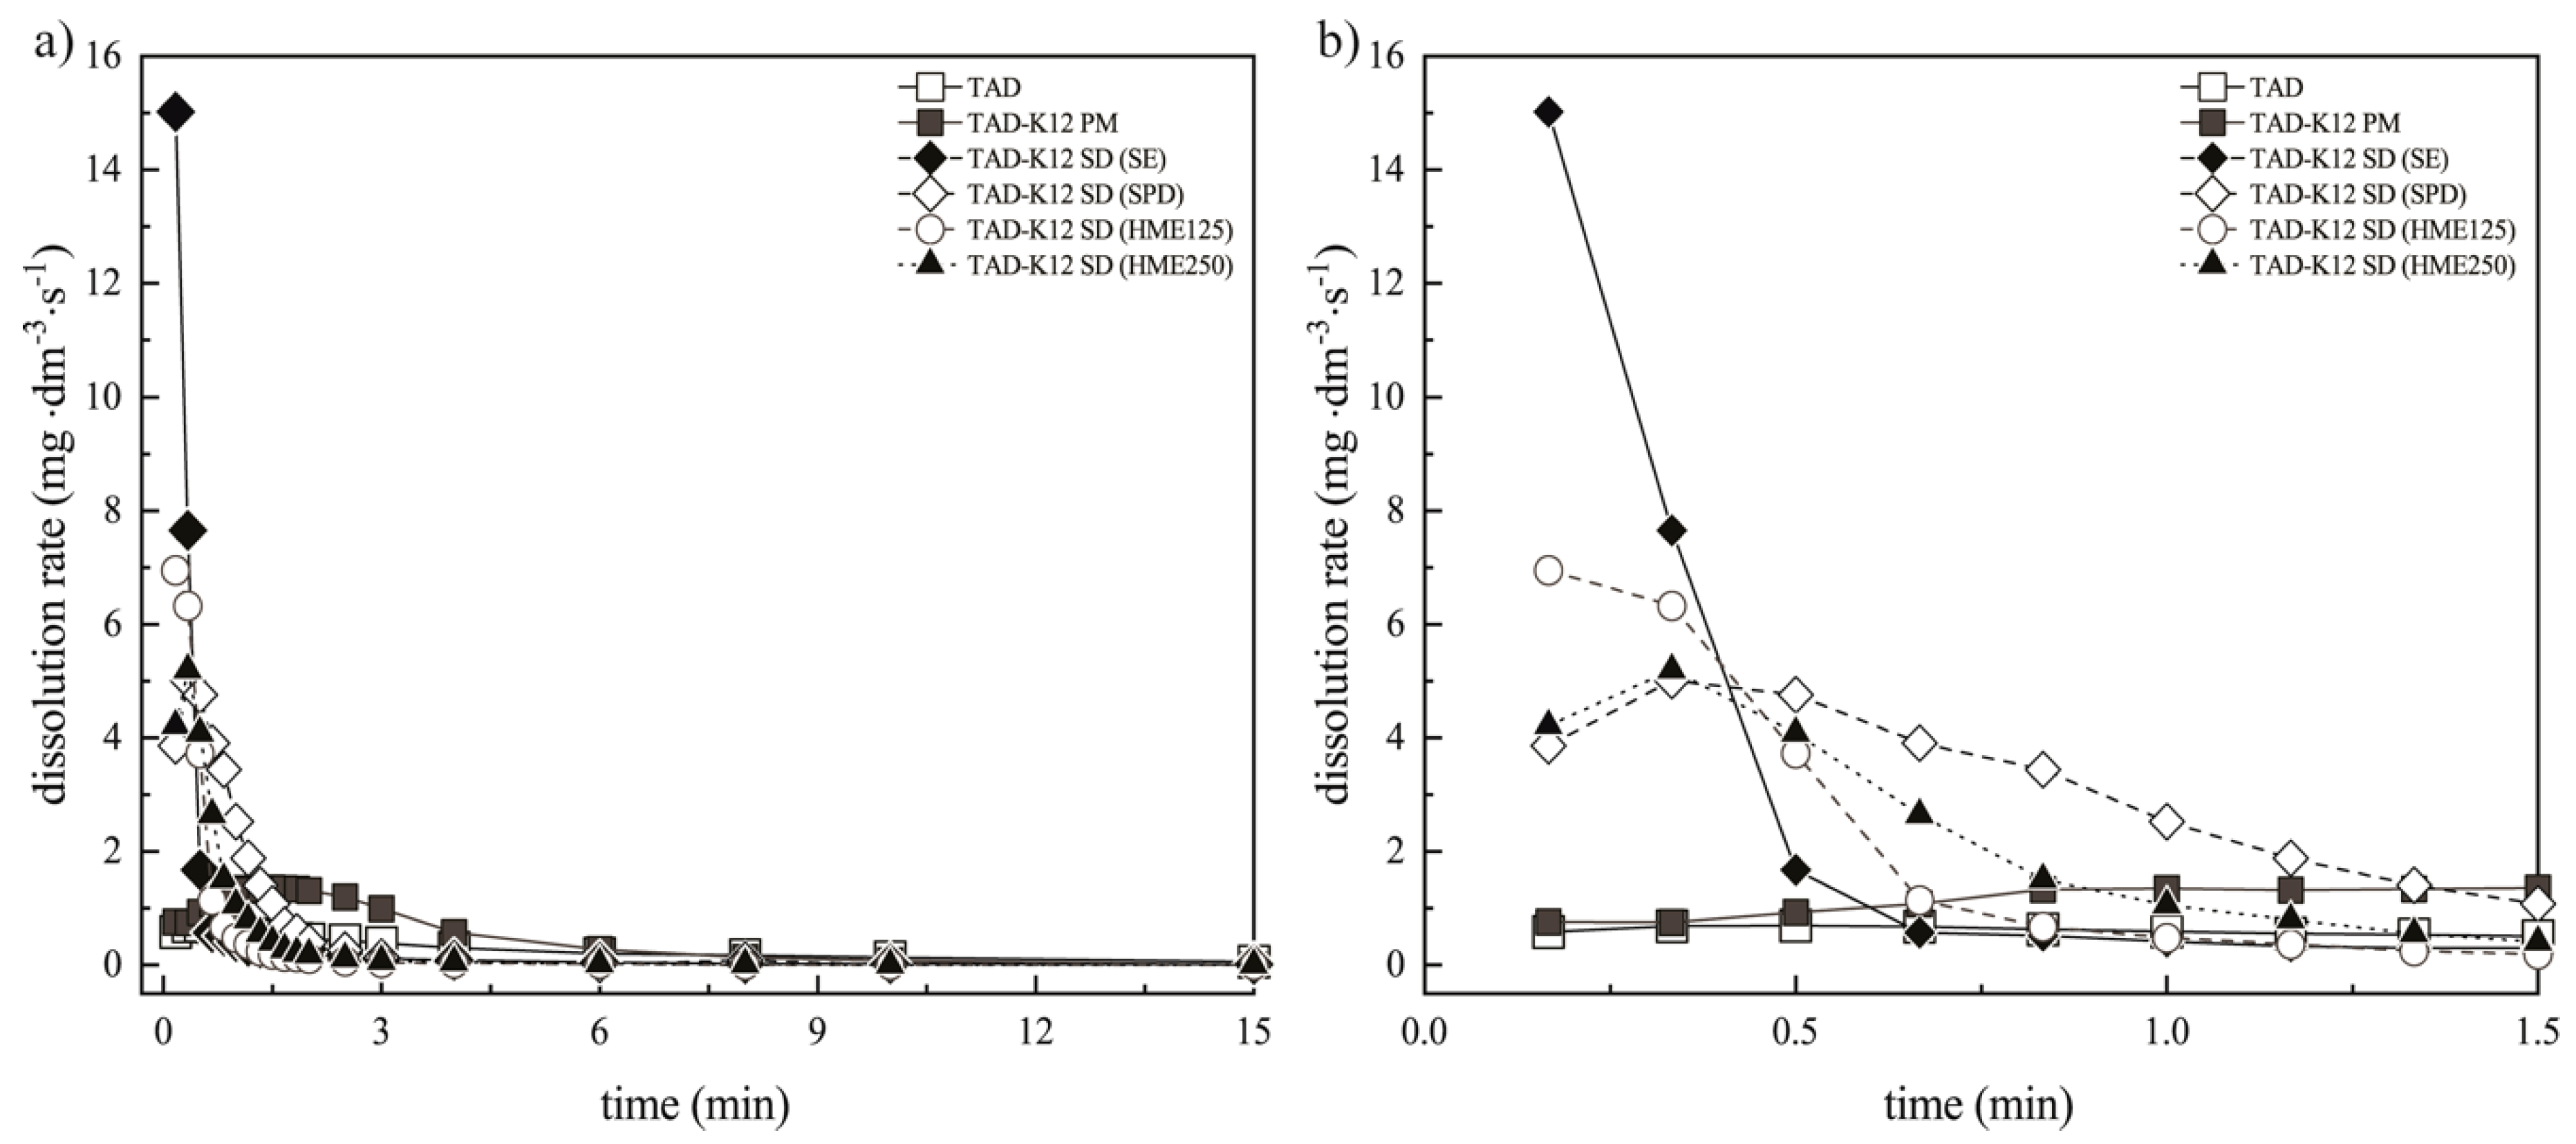
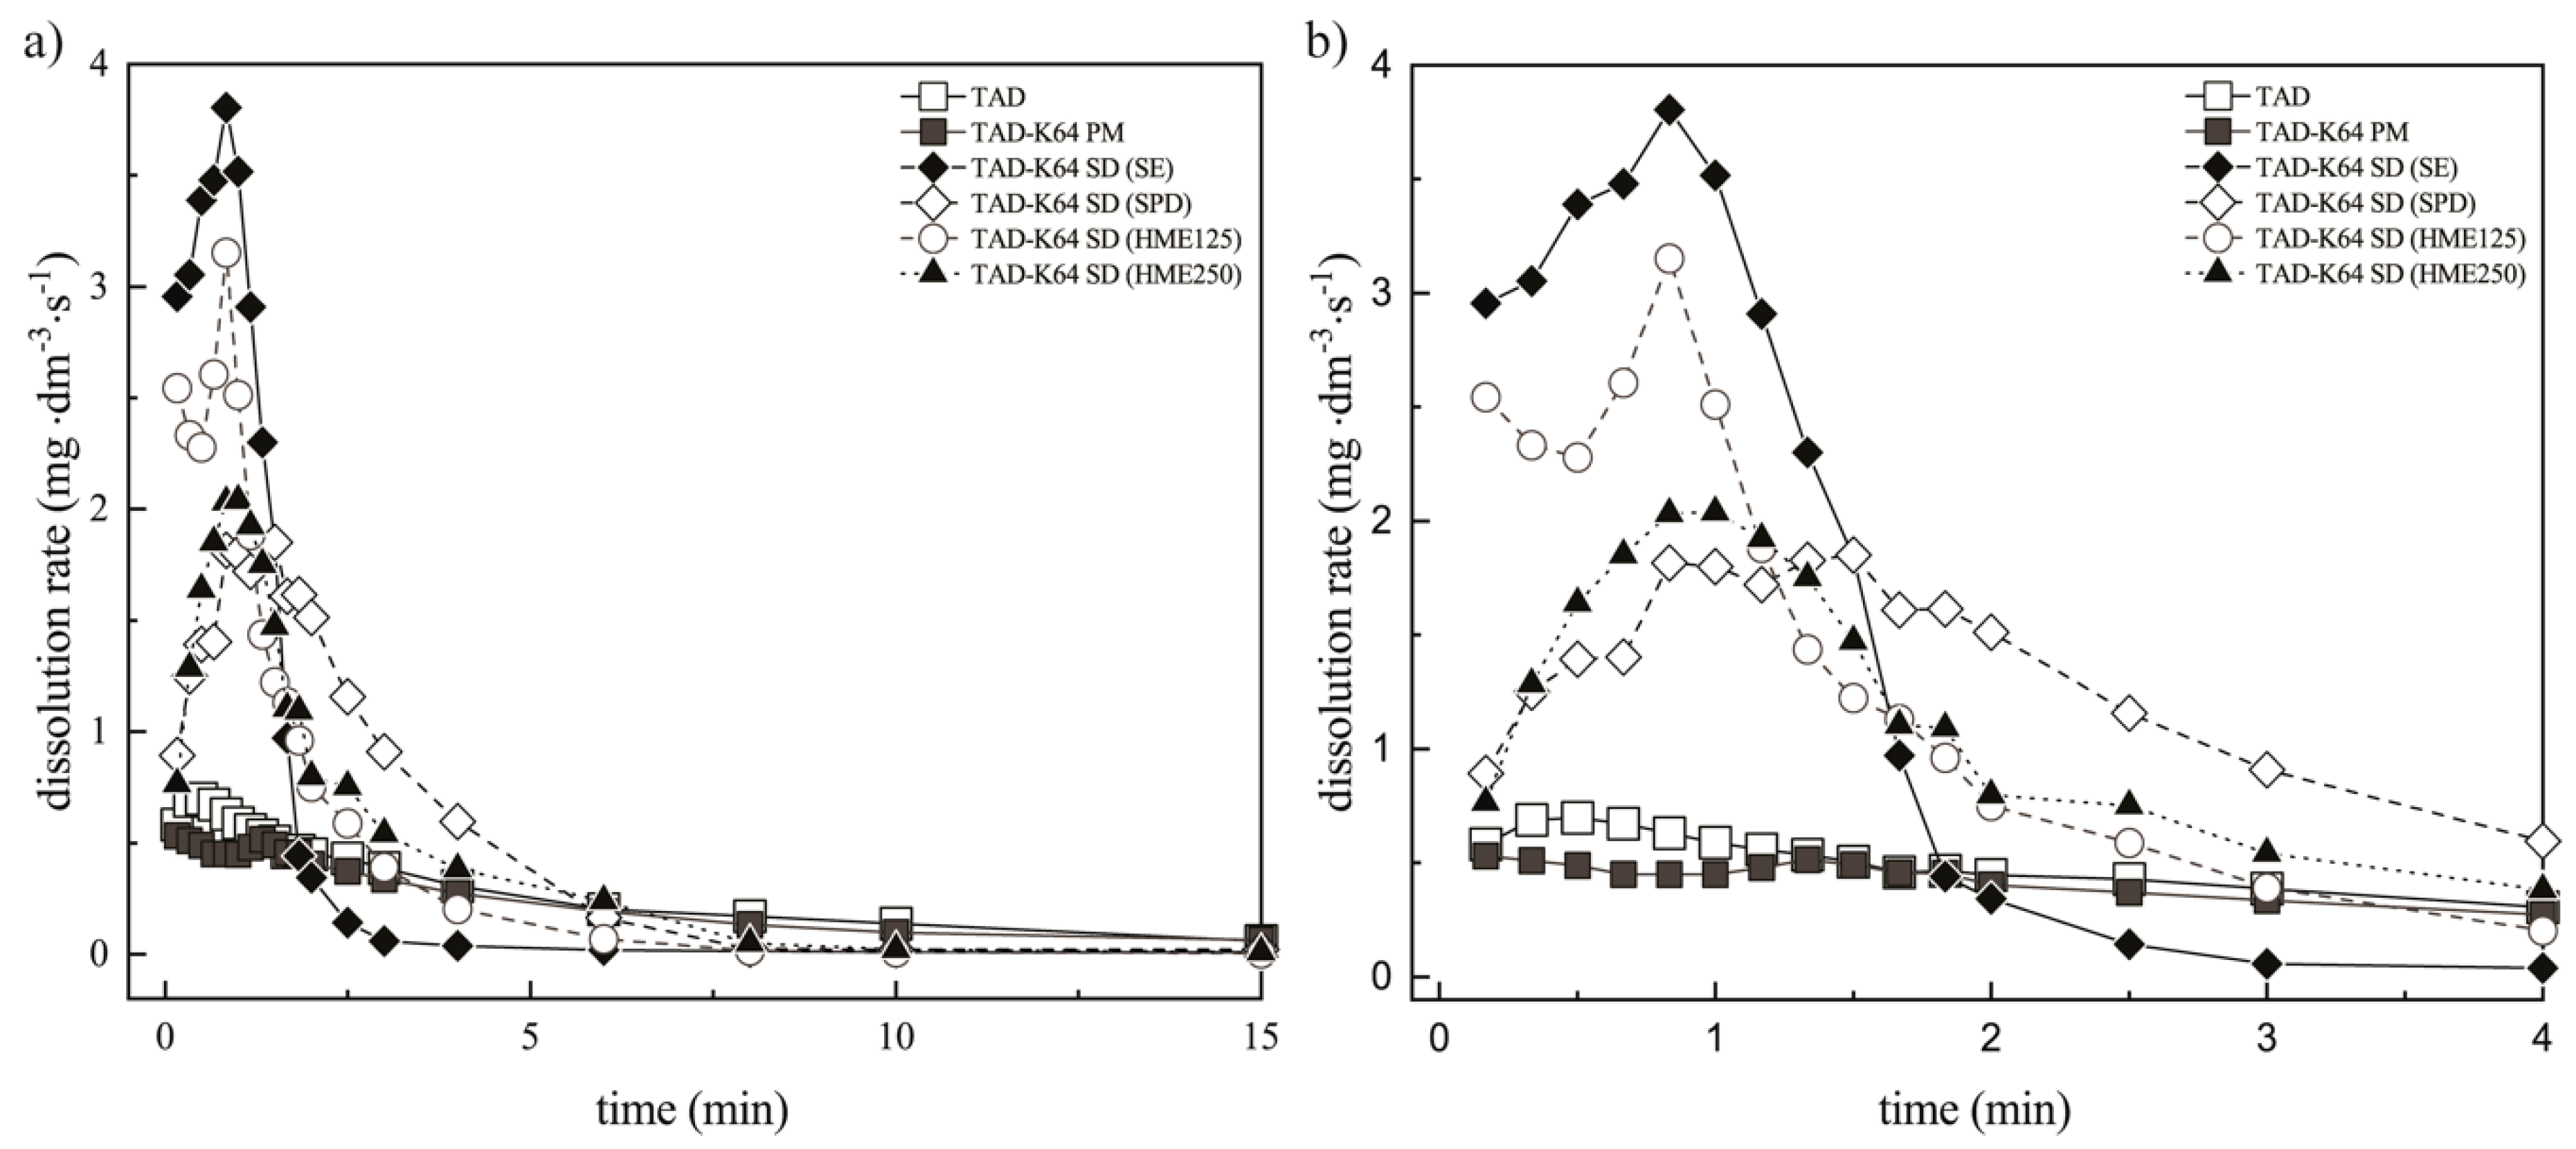
3.3.2. Assessment of the Erosion-Diffusion Mechanism of TAD Release Using Wood´s Apparatus (AIDR Measurements)
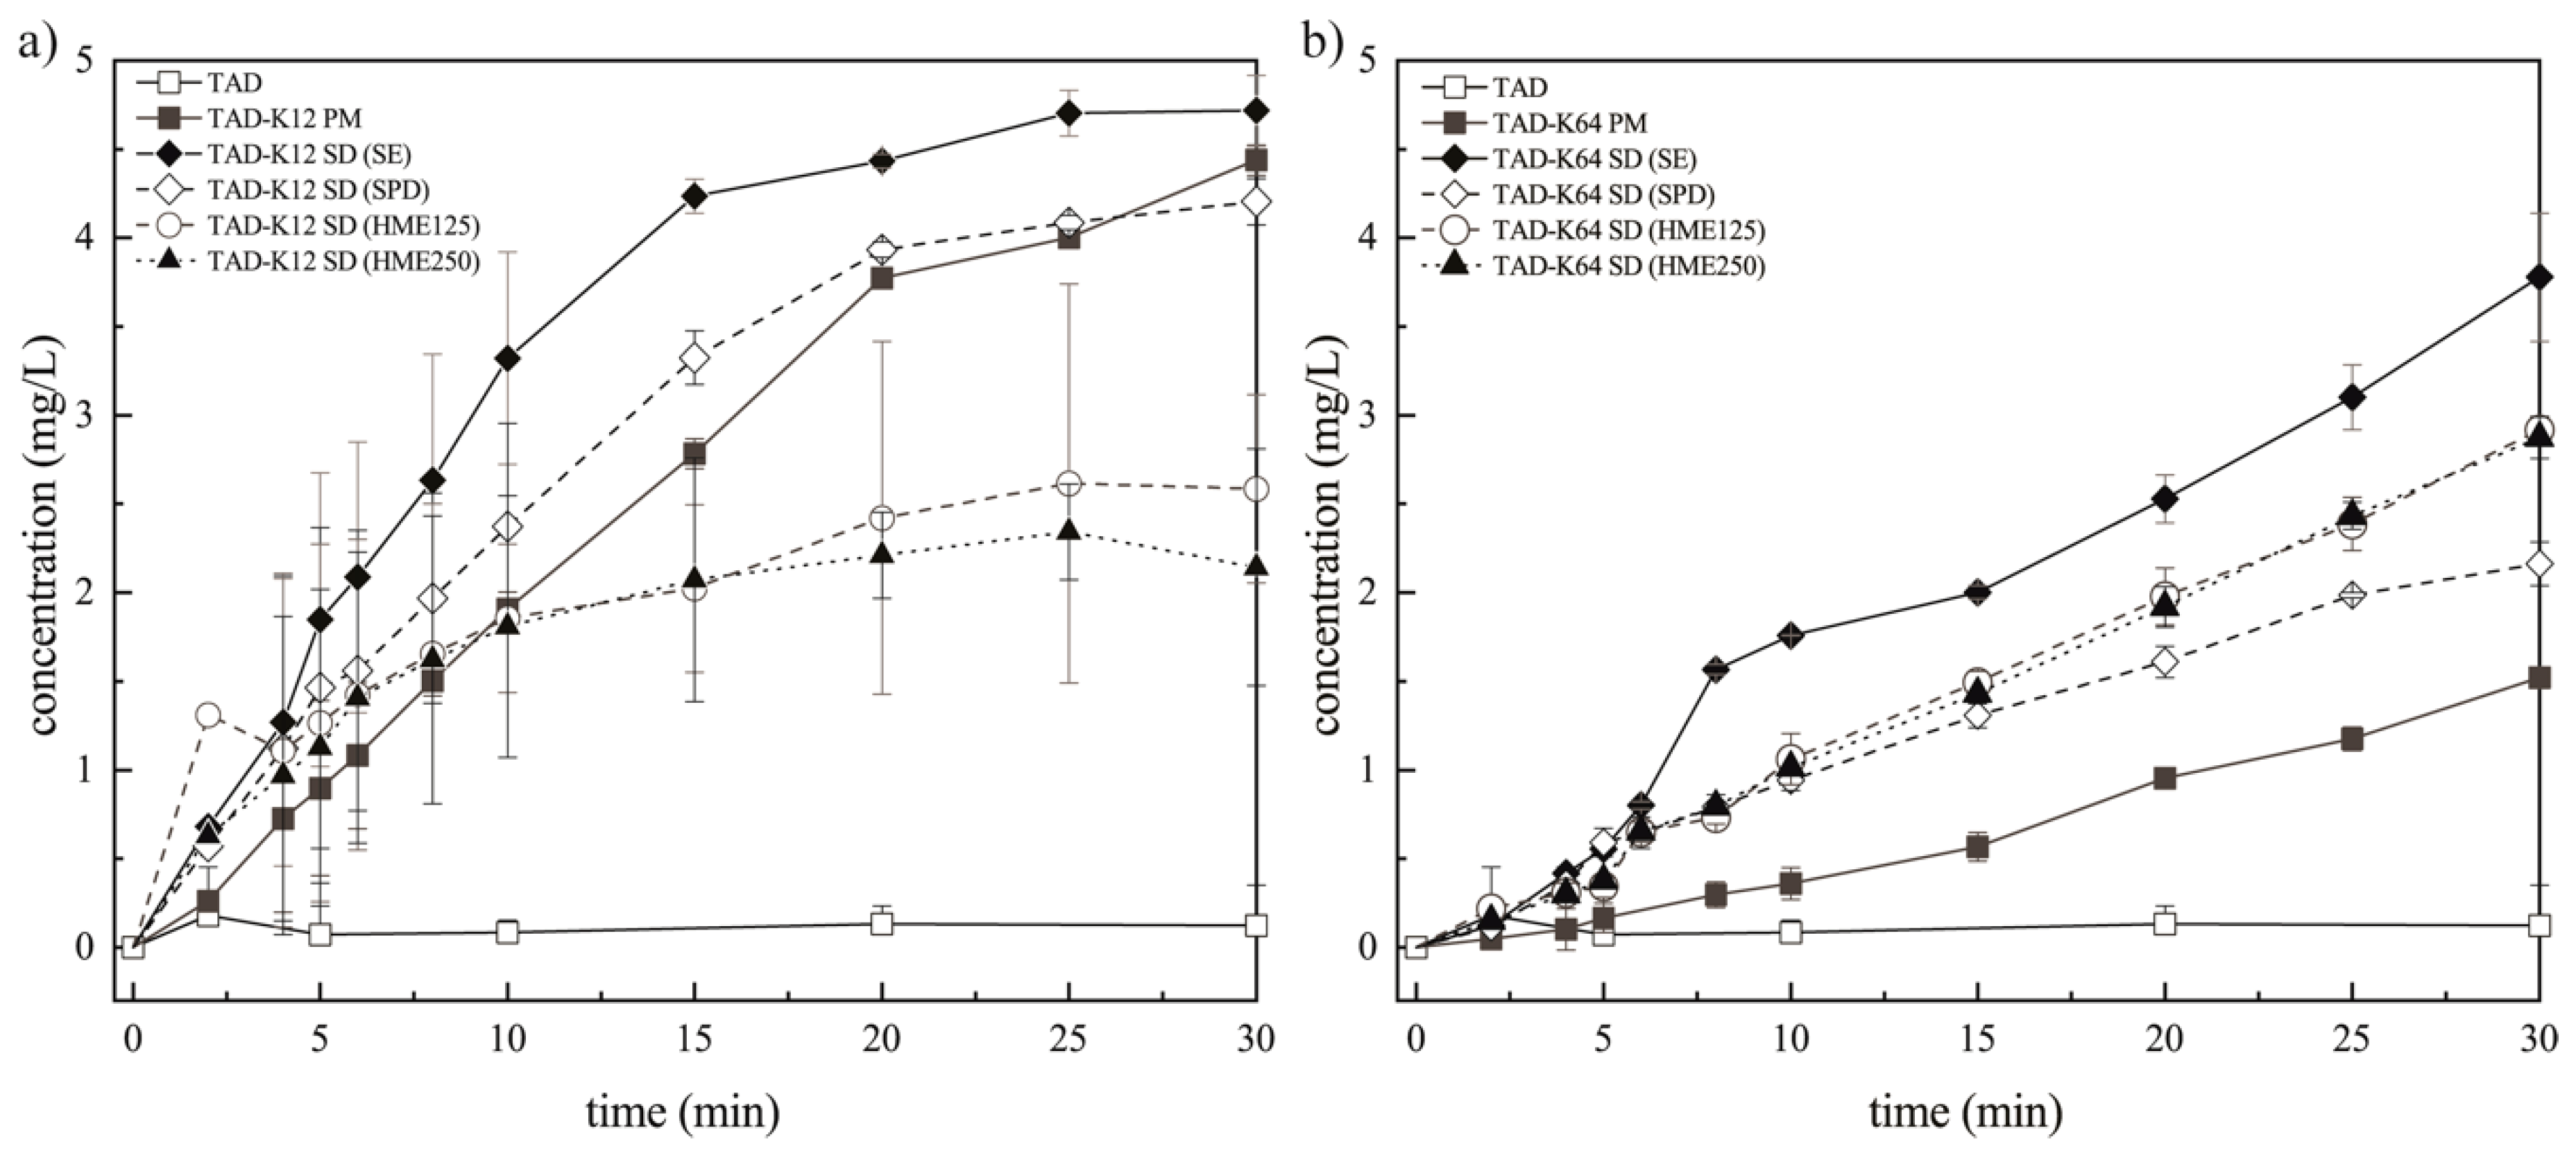
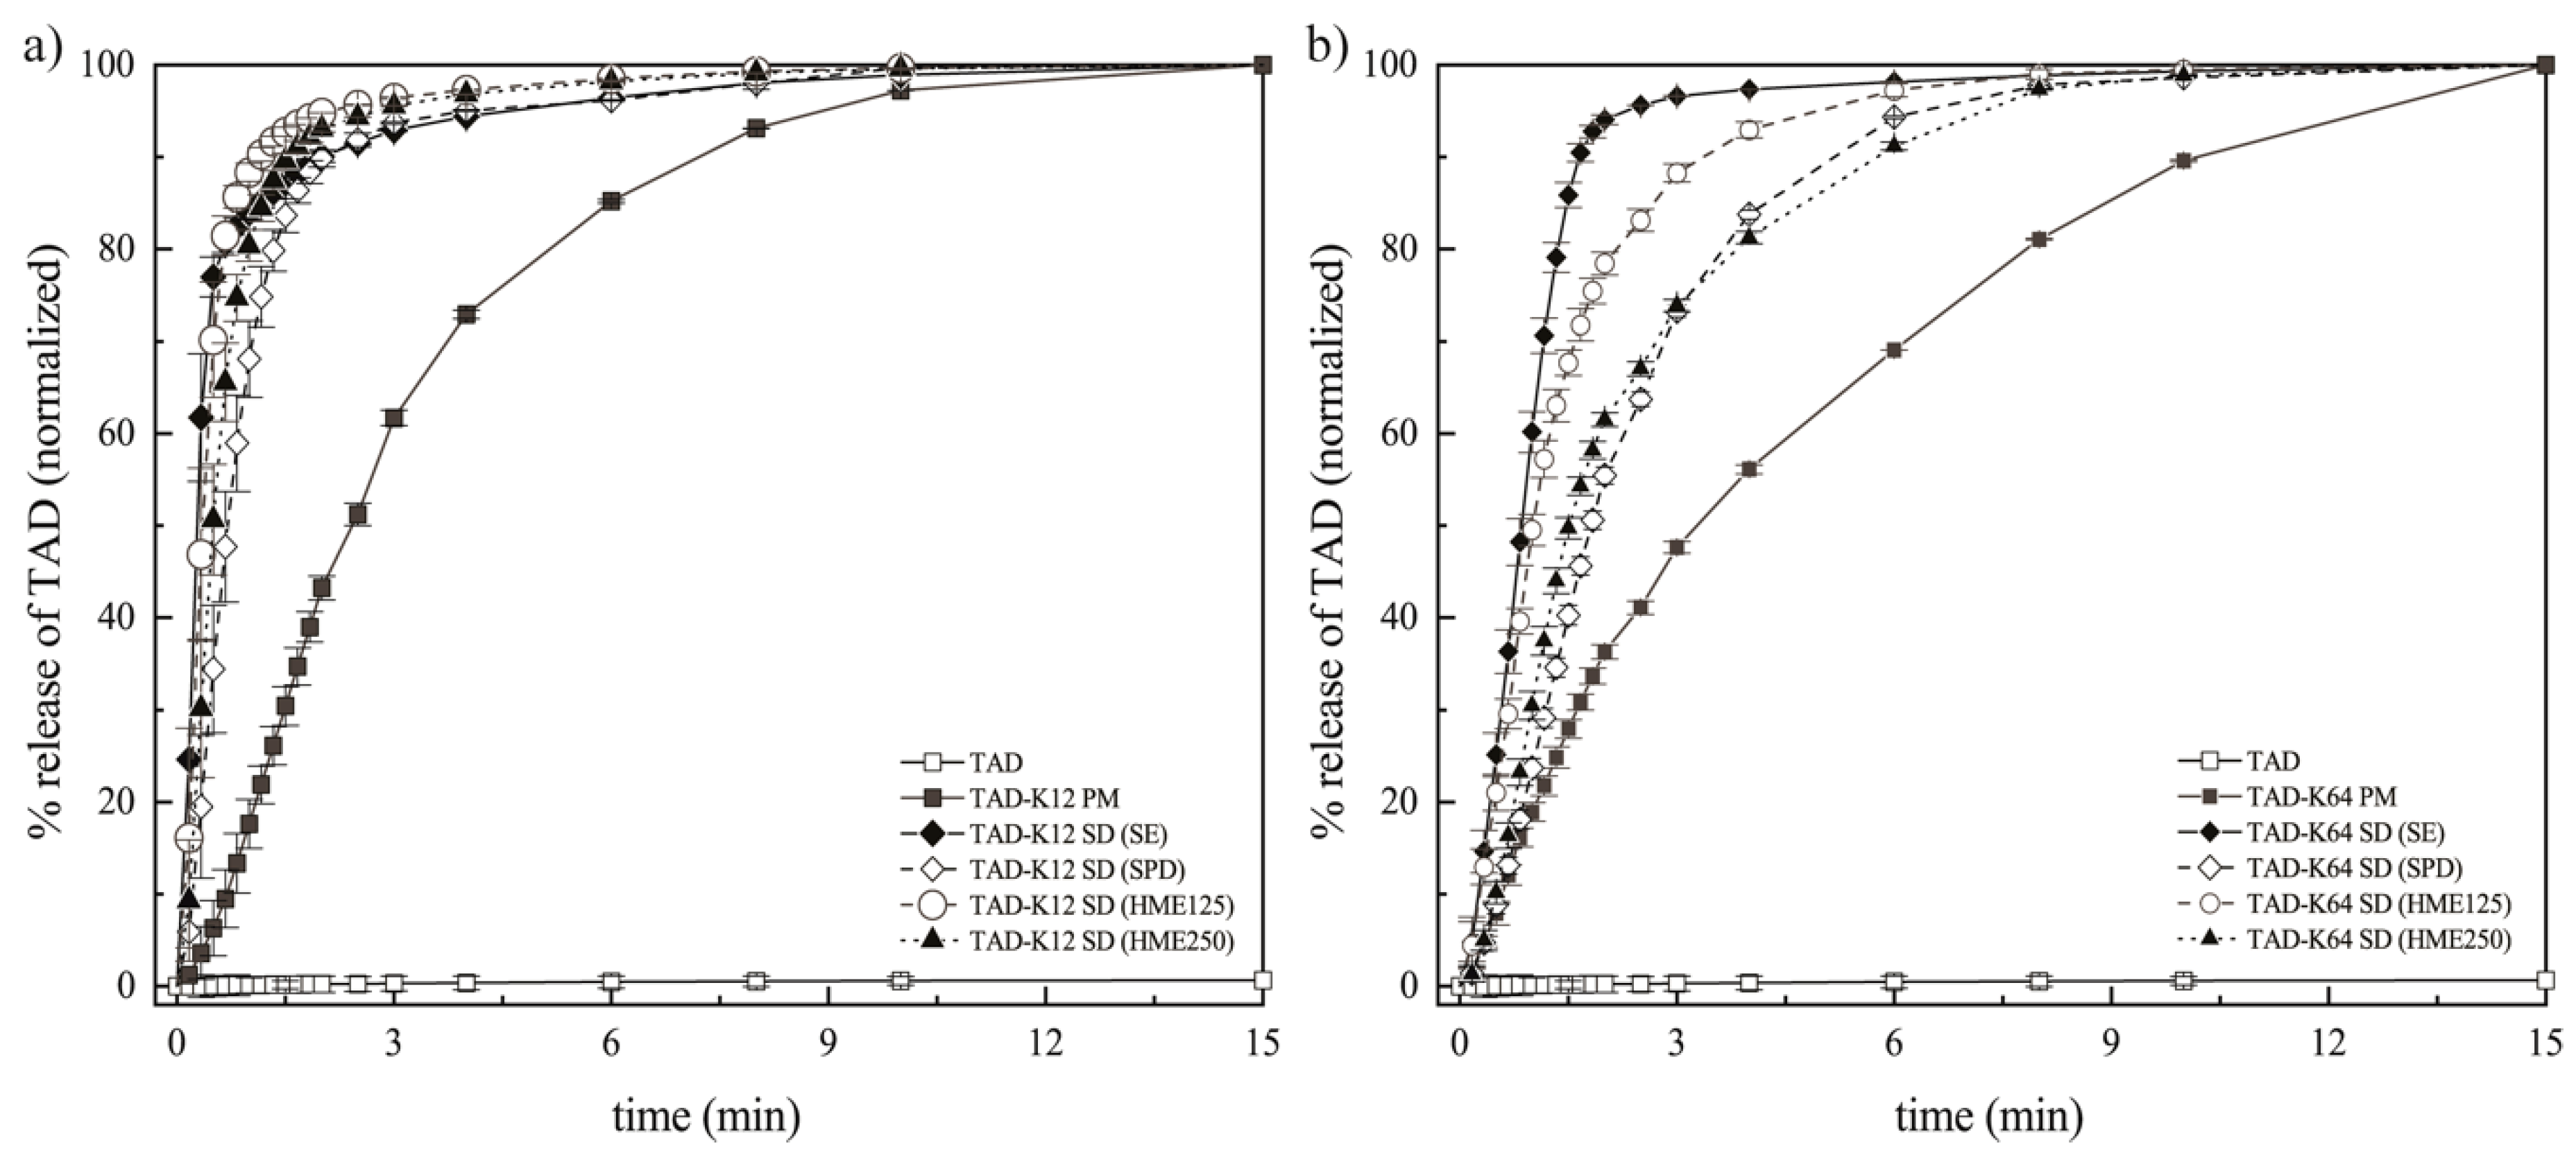
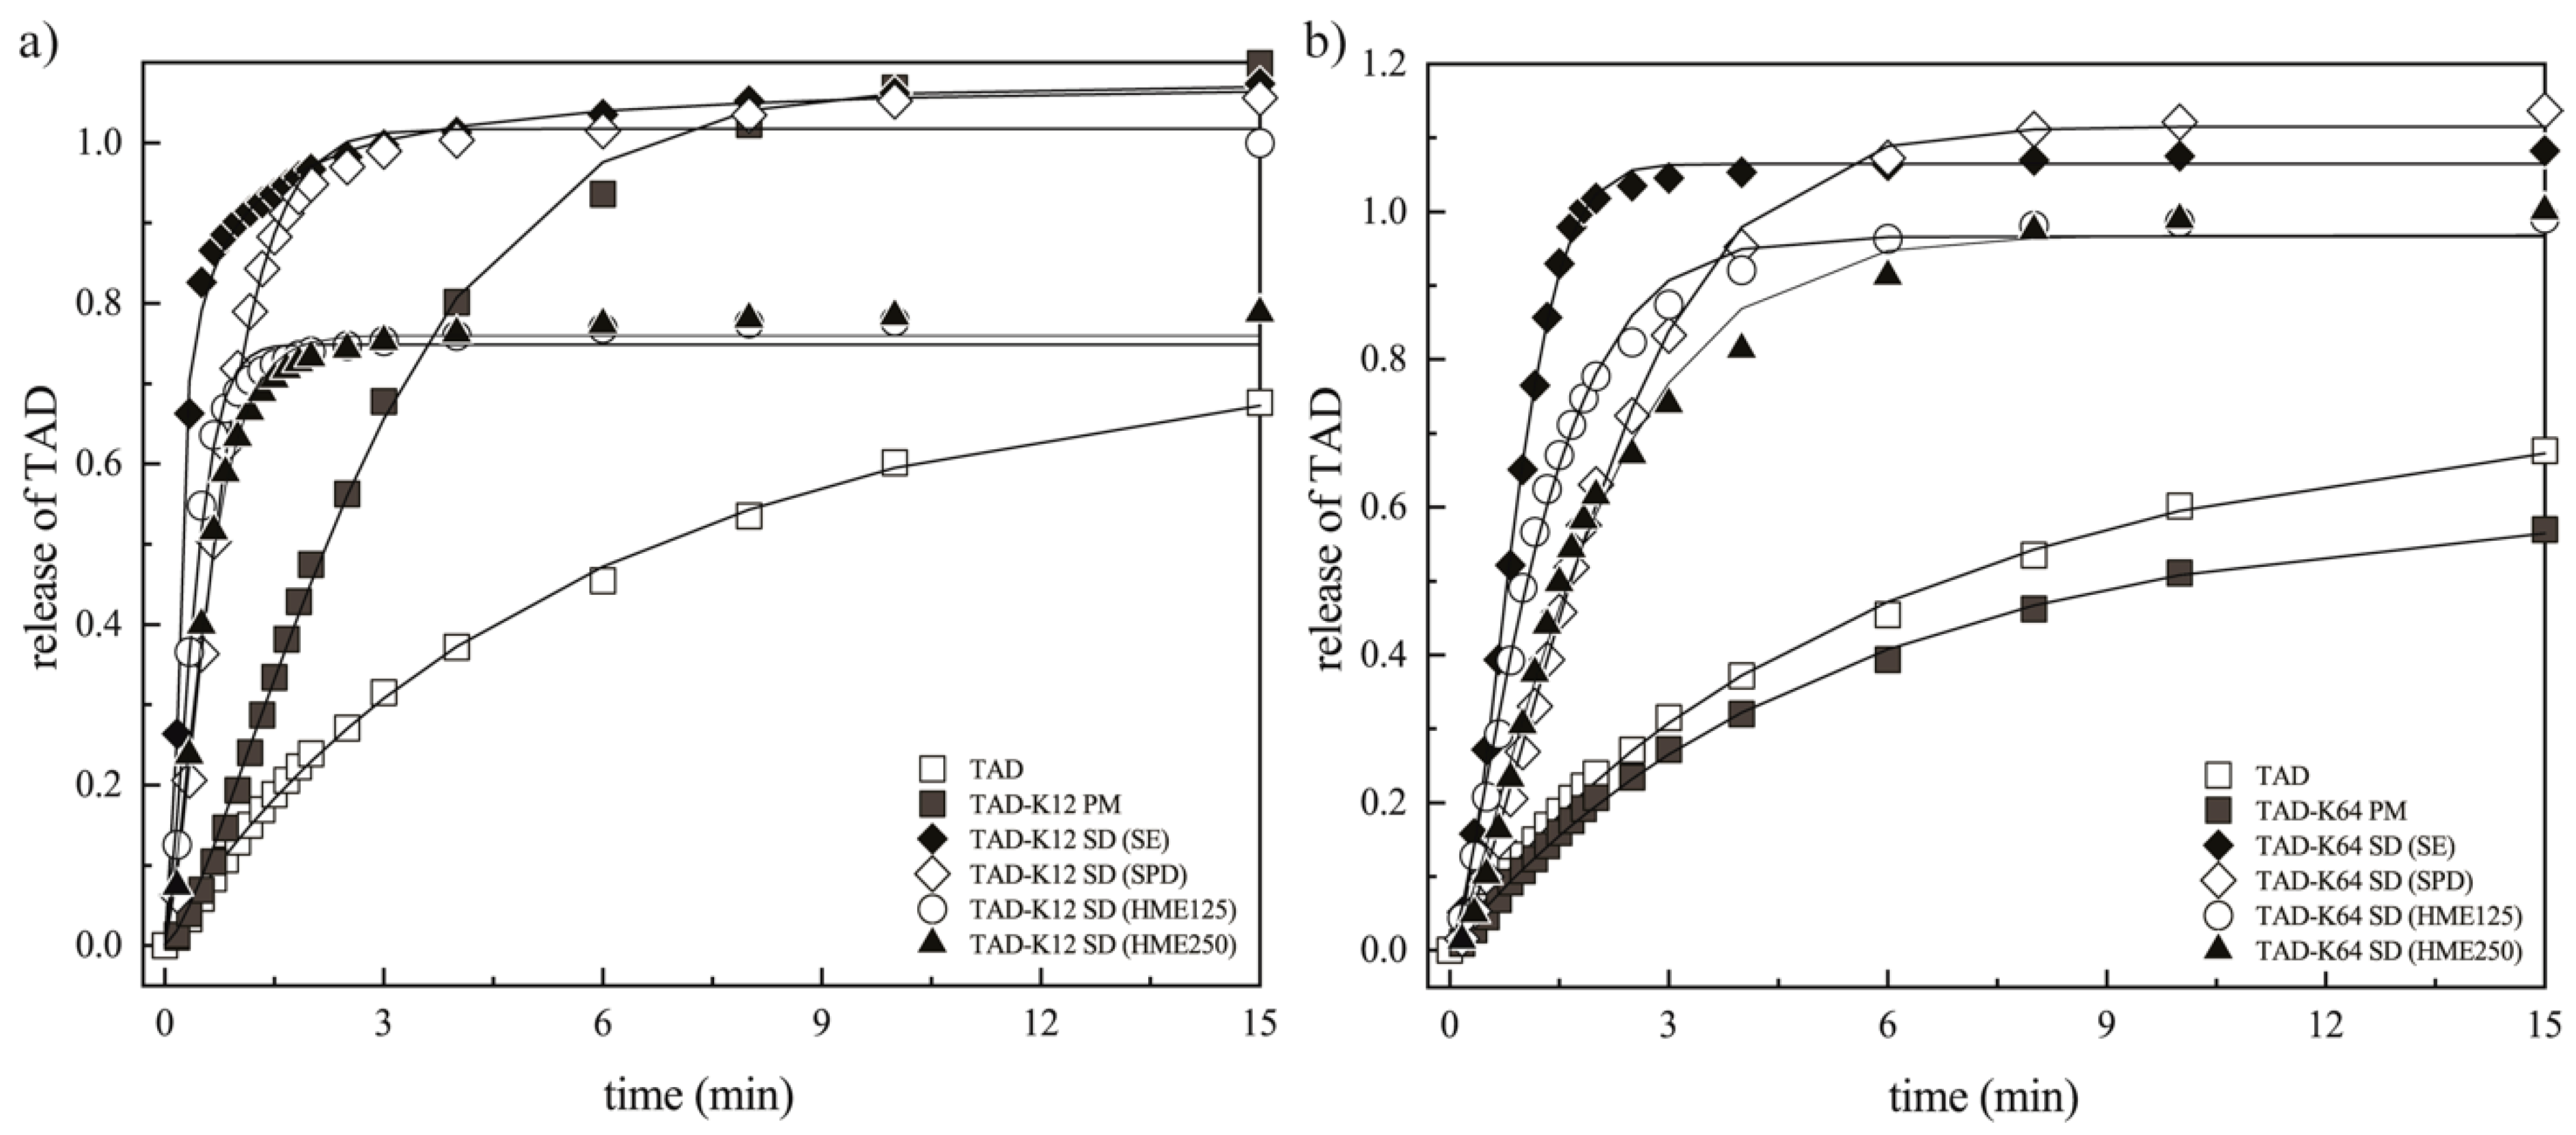
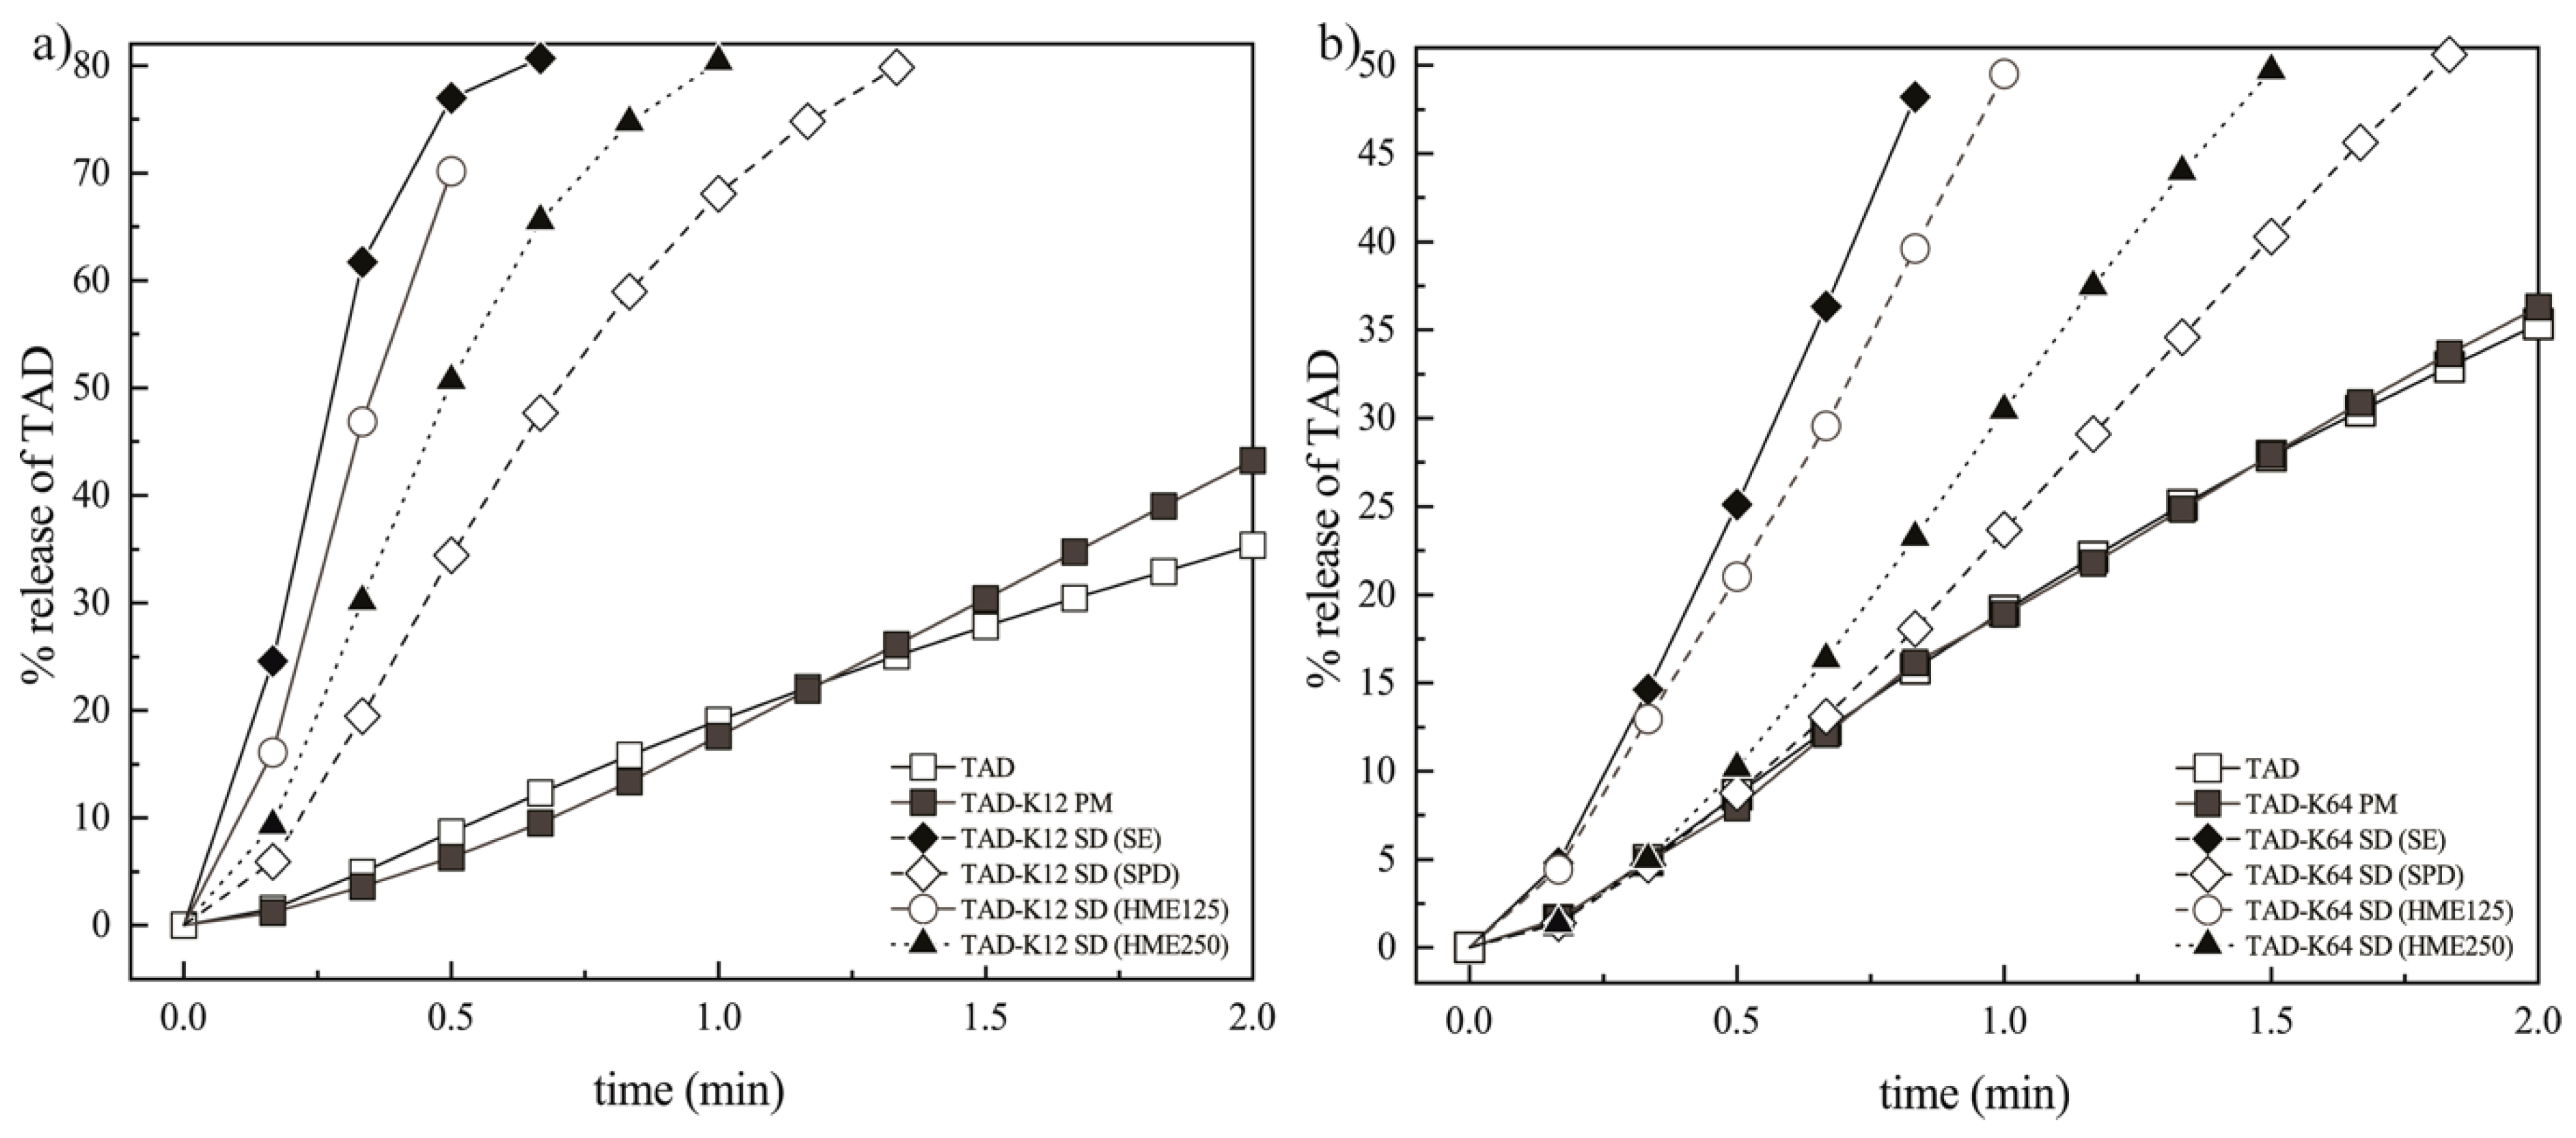
3.3.3. Effect of the Preparation Method on the Dissolution Behavior of TAD from Solid Dispersions
3.3.4. Weibull Dissolution Model
4. Conclusions
Author Contributions
Funding
Acknowledgments
Conflicts of Interest
Appendix A


References
- Tres, F.; Treacher, K.; Booth, J.; Hughes, L.P.; Wren, S.A.C.; Aylott, J.W.; Burley, J.C. Real time Raman imaging to understand dissolution performance of amorphous solid dispersions. J. Control. Release 2014, 188, 53–60. [Google Scholar] [CrossRef] [PubMed]
- Davis, M.; Walker, G. Recent strategies in spray drying for the enhanced bioavailability of poorly water-soluble drugs. J. Control. Release 2018, 269, 110–127. [Google Scholar] [CrossRef] [PubMed] [Green Version]
- Wlodarski, K.; Sawicki, W.; Haber, K.; Knapik, J.; Wojnarowska, Z.; Paluch, M.; Lepek, P.; Hawelek, L.; Tajber, L. Physicochemical properties of tadalafil solid dispersions—Impact of polymer on the apparent solubility and dissolution rate of tadalafil. Eur. J. Pharm. Biopharm. 2015, 94, 106–115. [Google Scholar] [CrossRef] [PubMed]
- Craig, D.Q.M. The mechanisms of drug release from solid dispersions in water-soluble polymers. Int. J. Pharm. 2002, 231, 131–144. [Google Scholar] [CrossRef]
- Vyas, V.; Sancheti, P.; Karekar, P.; Shah, M.; Pore, Y. Physicochemical characterization of solid dispersion systems of tadalafil with poloxamer 407. Acta Pharm. 2009, 59, 453–461. [Google Scholar] [CrossRef] [PubMed] [Green Version]
- Wlodarski, K.; Sawicki, W.; Kozyra, A.; Tajber, L. Physical stability of solid dispersions with respect to thermodynamic solubility of tadalafil in PVP-VA. Eur. J. Pharm. Biopharm. 2015, 96, 237–246. [Google Scholar] [CrossRef] [PubMed]
- Huang, Y.; Dai, W.-G. Fundamental aspects of solid dispersion technology for poorly soluble drugs. Acta Pharm. Sin. B 2014, 4, 18–25. [Google Scholar] [CrossRef] [PubMed]
- Prasanna, T.V.; Rani, B.N.; Rao, A.S.; Murthy, T.E.G.K. Design and evaluation of solid dispersed tadalafil tablets. Int. J. Pharm. Sci. Res. 2012, 3, 4738–4744. [Google Scholar] [CrossRef]
- Rane, Y.; Mashru, R.; Sankalia, M.; Sankalia, J. Effect of hydrophilic swellable polymers on dissolution enhancement of carbamazepine solid dispersions studied using response surface methodology. AAPS PharmSciTech 2007, 8, E1–E11. [Google Scholar] [CrossRef] [Green Version]
- Sharma, P.K.; Sharma, P.; Darwhekar, G.N.; Shrivastava, B. Formulation and evaluation of solid dispersion of tadalafil. Int. J. Drug Regul. Aff. 2018, 6, 26–34. [Google Scholar] [CrossRef]
- Mande, P.P.; Bachhav, S.S.; Devarajan, P.V. Bioenhanced advanced third generation solid dispersion of tadalafil: Repurposing with improved therapy in pyelonephritis. Asian J. Pharm. Sci. 2017, 12, 569–579. [Google Scholar] [CrossRef]
- Choi, J.S.; Kwon, S.H.; Lee, S.E.; Jang, W.S.; Byeon, J.C.; Jeong, H.M.; Park, J.S. Use of acidifier and solubilizer in tadalafil solid dispersion to enhance the in vitro dissolution and oral bioavailability in rats. Int. J. Pharm. 2017, 526, 77–87. [Google Scholar] [CrossRef]
- Obeidat, W.M.; Sallam, A.S. Evaluation of tadalafil nanosuspensions and their PEG solid dispersion matrices for enhancing its dissolution properties. AAPS PharmSciTech 2014, 15, 364–374. [Google Scholar] [CrossRef]
- Park, J.; Cho, W.; Kang, H.; Lee, B.B.J.; Kim, T.S.; Hwang, S.-J. Effect of operating parameters on PVP/tadalafil solid dispersions prepared using supercritical anti-solvent process. J. Supercrit. Fluids 2014, 90, 126–133. [Google Scholar] [CrossRef]
- Krupa, A.; Cantin, O.; Strach, B.; Wyska, E.; Tabor, Z.; Siepmann, J.; Wróbel, A.; Jachowicz, R. In vitro and in vivo behavior of ground tadalafil hot-melt extrudates: How the carrier material can effectively assure rapid or controlled drug release. Int. J. Pharm. 2017, 528, 498–510. [Google Scholar] [CrossRef]
- Wlodarski, K.; Sawicki, W.; Paluch, K.J.; Tajber, L.; Grembecka, M.; Hawelek, L.; Wojnarowska, Z.; Grzybowska, K.; Talik, E.; Paluch, M. The influence of amorphization methods on the apparent solubility and dissolution rate of tadalafil. Eur. J. Pharm. Sci. 2014, 62, 132–140. [Google Scholar] [CrossRef]
- Mehanna, M.M.; Motawaa, A.M.; Samaha, M.W. In sight into tadalafil-block copolymer binary solid dispersion: Mechanistic investigation of dissolution enhancement. Int. J. Pharm. 2010, 402, 78–88. [Google Scholar] [CrossRef]
- Refaat, A.; Sokar, M.; Ismail, F.; Boraei, N. Tadalafil oral disintegrating tablets: An approach to enhance tadalafil dissolution. J. Pharm. Investig. 2015, 45, 481–491. [Google Scholar] [CrossRef]
- Choi, J.S.; Park, J.S. Design of PVP/VA S-630 based tadalafil solid dispersion to enhance the dissolution rate. Eur. J. Pharm. Sci. 2017, 97, 269–276. [Google Scholar] [CrossRef]
- Choi, J.S.; Lee, S.E.; Jang, W.S.; Byeon, J.C.; Park, J.S. Tadalafil solid dispersion formulations based on PVP/VA S-630: Improving oral bioavailability in rats. Eur. J. Pharm. Sci. 2017, 106, 152–158. [Google Scholar] [CrossRef]
- El-Badry, M.; Hag, N.; Fetih, G.; Shakeel, F. Solubility and dissolution enhancement of tadalafil using self-nanoemulsifying drug delivery system. J. Oleo Sci. 2014, 63, 567–576. [Google Scholar] [CrossRef] [PubMed]
- Baek, J.S.; Pham, C.V.; Myung, C.S.; Cho, C.W. Tadalafil-loaded nanostructured lipid carriers using permeation enhancers. Int. J. Pharm. 2015, 495, 701–709. [Google Scholar] [CrossRef]
- Bhokare, P.L.; Kendre, P.N.; Pande, V.V. Design and characterization of nanocrystals of tadalafil for solubility and dissolution rate enhancement. Inventi Impact Pharm. Process Dev. 2015, 2015, 1–7. [Google Scholar]
- Badr-Eldin, S.M.; Elkheshen, S.A.; Ghorab, M.M. Inclusion complexes of tadalafil with natural and chemically modified β-cyclodextrins. I: Preparation and in-vitro evaluation. Eur. J. Pharm. Biopharm. 2008, 70, 819–827. [Google Scholar] [CrossRef] [PubMed]
- Mehanna, M.M.; Motawaa, A.M.; Samaha, M.W. Tadalafil inclusion in microporous silica as effective dissolution enhancer: Optimization of loading procedure and molecular state characterization. J. Pharm. Sci. 2010, 100, 1805–1818. [Google Scholar] [CrossRef] [PubMed]
- Wlodarski, K.; Tajber, L.; Sawicki, W. Physicochemical properties of direct compression tablets with spray dried and ball milled solid dispersions of tadalafil in PVP-VA. Eur. J. Pharm. Biopharm. 2016, 109, 14–23. [Google Scholar] [CrossRef] [PubMed]
- Krupa, A.; Descamps, M.; Willart, J.-F.; Jachowicz, R.; Danède, F. High energy ball milling and supercritical carbon dioxide impregnation as co-processing methods to improve dissolution of tadalafil. Eur. J. Pharm. Sci. 2016, 95, 130–137. [Google Scholar] [CrossRef] [PubMed]
- Nowak, P.; Krupa, A.; Kubat, K.; Węgrzyn, A.; Harańczyk, H.; Ciułkowska, A.; Jachowicz, R. Water vapour sorption in tadalafil-Soluplus co-milled amorphous solid dispersions. Powder Technol. 2019, 346, 373–384. [Google Scholar] [CrossRef]
- Reza, M.S.; Quadir, M.A.; Haider, S.S. Comparative evaluation of plastic, hydrophobic and hydrophilic polymers as matrices for controlled-release drug delivery. J. Pharm. Pharm. Sci. 2003, 6, 282–291. [Google Scholar]
- Caccavo, D.; Cascone, S.; Lamberti, G.; Barba, A.A.; Larsson, A. Swellable hydrogel-based systems for controlled drug delivery. In Smart Drug Delivery System; Sezer, A.D., Ed.; IntechOpen: London, UK, 2016; pp. 237–303. [Google Scholar] [CrossRef]
- Ozeki, T.; Yuasa, H.; Kanaya, Y. Controlled release from solid dispersion composed of poly (ethylene oxide) —Carbopol® interpolymer complex with various cross-linking degrees of Carbopol®. J. Control. Release 2000, 63, 287–295. [Google Scholar] [CrossRef]
- Grassi, M.; Colombo, I.; Lapasin, R. Drug release from an ensemble of swellable crosslinked polymer particles. J. Control. Release 2000, 68, 97–113. [Google Scholar] [CrossRef]
- Gajdošová, M.; Pěček, D.; Sarvašová, N.; Grof, Z.; Štěpánek, F. Effect of hydrophobic inclusions on polymer swelling kinetics studied by magnetic resonance imaging. Int. J. Pharm. 2016, 500, 136–143. [Google Scholar] [CrossRef] [PubMed]
- Vueba, M.L.; Batista de Carvalho, L.A.E.; Veiga, F.; Sousa, J.J.; Pina, M.E. In vitro release of ketoprofen from hydrophilic matrix tablets containing cellulose polymer mixtures. Drug Dev. Ind. Pharm. 2012, 39, 1651–1662. [Google Scholar] [CrossRef] [PubMed]
- Maderuelo, C.; Zarzuelo, A.; Lanao, J.M. Critical factors in the release of drugs from sustained release hydrophilic matrices. J. Control. Release 2011, 154, 2–19. [Google Scholar] [CrossRef] [PubMed]
- Wan, L.S.C.; Heng, P.W.S.; Wong, L.F. Relationship between swelling and drug release in a hydrophilic matrix. Drug. Dev. Ind. Pharm. 1993, 19, 1201–1210. [Google Scholar] [CrossRef]
- Lamoudi, L.; Chaumeil, J.C.; Daoud, K. Swelling, erosion and drug release characteristics of Sodium Diclofenac from heterogeneous matrix tablets. J. Drug Deliv. Sci. Technol. 2016, 31, 93–100. [Google Scholar] [CrossRef]
- Sujja-areevath, J.; Munday, D.L.; Cox, P.J.; Khan, K.A. Relationship between swelling, erosion and drug release in hydrophilic natural gum mini-matrix formulations. Eur. J. Pharm. Sci. 1998, 6, 207–217. [Google Scholar] [CrossRef]
- Colombo, P.; Bettini, R.; Santi, P.; De Ascentiis, A.; Peppas, N.A. Analysis of the swelling and release mechanisms from drug delivery systems with emphasis on drug solubility and water transport. J. Control. Release 1996, 39, 231–237. [Google Scholar] [CrossRef]
- Colombo, P.; Bettini, R.; Peppas, N.A. Observation of swelling process and diffusion front position during swelling in hydroxypropyl methyl cellulose (HPMC) matrices containing a soluble drug. J. Control. Release 1999, 61, 83–91. [Google Scholar] [CrossRef]
- Colombo, P.; Bettini, R.; Massimo, G.; Catellani, P.L.; Santi, P.; Peppas, N.A. Drug diffusion front movement is important in drug release control from swellable matrix tablets. J. Pharm. Sci. 1995, 84, 991–997. [Google Scholar] [CrossRef]
- Lamberti, G.; Galdi, I.; Barba, A.A. Controlled release from hydrogel-based solid matrices. A model accounting for water up-take, swelling and erosion. Int. J. Pharm. 2011, 407, 78–86. [Google Scholar] [CrossRef] [PubMed]
- Siepmann, J.; Peppas, N.A. Modeling of drug release from delivery systems based on hydroxypropyl methylcellulose (HPMC). Adv. Drug Deliv. Rev. 2001, 48, 139–157. [Google Scholar] [CrossRef]
- Wu, N.; Wang, L.-S.; Tan, D.C.-W.; Moochhala, S.M.; Yang, Y.-Y. Mathematical modeling and in vitro study of controlled drug release via a highly swellable and dissoluble polymer matrix: Polyethylene oxide with high molecular weights. J. Control. Release 2005, 102, 569–581. [Google Scholar] [CrossRef] [PubMed]
- Chavanpatil, M.D.; Jain, P.; Chaudhari, S.; Shear, R.; Vavia, P.R. Novel sustained release, swellable and bioadhesive gastroretentive drug delivery system for ofloxacin. Int. J. Pharm. 2006, 316, 86–92. [Google Scholar] [CrossRef] [PubMed]
- Colombo, P.; Bettini, R.; Santi, P.; Peppas, N.A. Swellable matrices for controlled drug delivery: Gel-layer behaviour, mechanisms and optimal performance. Pharm. Sci. Technol. Today 2000, 3, 198–204. [Google Scholar] [CrossRef]
- Punčochová, K.; Heng, J.Y.Y.; Beránek, J.; Štěpánek, F. Investigation of drug-polymer interaction in solid dispersions by vapour sorption methods. Int. J. Pharm. 2014, 469, 159–167. [Google Scholar] [CrossRef] [PubMed]
- Zámostný, P.; Petrů, J.; Majerová, D. Effect of maize starch excipient properties on drug release rate. Procedia Eng. 2012, 42, 482–488. [Google Scholar] [CrossRef]
- Ford, J.L. The current status of solid dispersions. Pharm. Acta Helv. 1986, 61, 69–88. [Google Scholar]
- Vo, C.L.-N.; Park, C.; Lee, B.J. Current trends and future perspectives of solid dispersions containing poorly water-soluble drugs. Eur. J. Pharm. Biopharm. 2013, 85, 799–813. [Google Scholar] [CrossRef]
- Thielmann, F.; Williams, D. Determination of the glass transition temperature of maltose and its dependence on relative humidity by inverse gas chromatography. Dtsch. Lebensm.-Rundsch. 2000, 96, 255–257. [Google Scholar]
- Hurley, D.; Potter, C.B.; Walker, G.M.; Higginbotham, C.L. Investigation of ethylene oxide-co-propylene oxide for dissolution enhancement of hot-melt extruded solid dispersions. J. Pharm. Sci. 2018, 107, 1372–1382. [Google Scholar] [CrossRef] [PubMed]
- Ghadge, O.; Samant, M.; Khale, A. Determination of solubility of tadalafil by shake flask method by employing validated HPLC analytical method. World J. Pharm. Res. 2015, 4, 1370–1382. [Google Scholar]
- Petru, J.; Zamostny, P. Analysis of drug release from different agglomerates using a mathematical model. Dissolut. Technol. 2014, 21, 40–47. [Google Scholar] [CrossRef]
- Petru, J.; Zamostny, P. Prediction of dissolution behavior of final dosage forms prepared by different granulation methods. Procedia Eng. 2012, 42, 1463–1473. [Google Scholar] [CrossRef]
- Li, N.; Taylor, L.S. Tailoring supersaturation from amorphous solid dispersions. J. Control. Release 2018, 279, 114–125. [Google Scholar] [CrossRef] [PubMed]
- Shoaib, M.H.; Tazeen, J.; Merchant, H.A.; Yousuf, R.I. Evaluation of drug release kinetics from ibuprofen matrix tablets using HPMC. Pak. J. Pharm. Sci. 2006, 19, 119–124. [Google Scholar] [PubMed]
- Khan, N.; Craig, D.Q.M. The influence of drug incorporation on the structure and release properties of solid dispersions in lipid matrices. J. Control. Release 2003, 93, 355–368. [Google Scholar] [CrossRef] [PubMed]
- Zuleger, S.; Lippold, B.C. Polymer particle erosion controlling drug release. I. Factors influencing drug release and characterization of the release mechanism. Int. J. Pharm. 2001, 217, 139–152. [Google Scholar] [CrossRef]
- Borgquist, P.; Körner, A.; Piculell, L.; Larsson, A.; Axelsson, A. A model for the drug release from a polymer matrix tablet-effects of swelling and dissolution. J. Control. Release 2006, 113, 216–225. [Google Scholar] [CrossRef]
- Katzhendler, I.; Hoffman, A.; Goldberger, A.; Friedman, M. Modeling of drug release from erodible tablets. J. Pharm. Sci. 1997, 86, 110–115. [Google Scholar] [CrossRef]
- Chirico, S.; Dalmoro, A.; Lamberti, G.; Russo, G.; Titomanlio, G. Analysis and modeling of swelling and erosion behavior for pure HPMC tablet. J. Control. Release 2007, 122, 181–188. [Google Scholar] [CrossRef]
- Costa, P.; Lobo, J.M.S. Modeling and comparison of dissolution profiles. Eur. J. Pharm. Sci. 2001, 13, 123–133. [Google Scholar] [CrossRef]
- Zamostny, P.; Belohlav, Z. A software for regression analysis of kinetic data. Comput. Chem. 1999, 23, 479–485. [Google Scholar] [CrossRef]


| Sample | AIDR (mg∙min−1·cm−2) |
|---|---|
| pure TAD | 0.002 |
| TAD-K12 PM | 0.380 |
| TAD-K12 SD (SE) | 0.662 |
| TAD-K12 SD (SPD) | 0.433 |
| TAD-K12 SD (HME125) | 0.245 |
| TAD-K12 SD (HME250) | 0.279 |
| Sample | AIDR (mg∙min−1·cm−2) |
|---|---|
| pure TAD | 0.002 |
| TAD-K64 PM | 0.081 |
| TAD-K64 SD (SE) | 0.247 |
| TAD-K64 SD (SPD) | 0.156 |
| TAD-K64 SD (HME125) | 0.245 |
| TAD-K64 SD (HME250) | 0.194 |
| Sample | (s−b) ± STD | (-) ± STD | (s) ± STD |
|---|---|---|---|
| pure TAD | 0.21 ± 0.04 | 0.99 ± 0.10 | 0.00 ± 0.19 |
| TAD-K12 PM | 0.29 ± 0.04 | 1.13 ± 0.08 | 0.26 ± 0.10 |
| TAD-K12 SD (SE) | 1.92 ± 0.06 | 0.33 ± 0.04 | 0.17 ± 0.00 |
| TAD-K12 SD (SPD) | 1.27 ± 0.87 | 1.02 ± 1.15 | 0.13 ± 0.46 |
| TAD-K12 SD (HME125) | 2.30 ± 0.36 | 0.66 ± 0.21 | 0.15 ± 0.03 |
| TAD-K12 SD (HME250) | 1.76 ± 1.15 | 0.86 ± 1.16 | 0.14 ± 0.31 |
| Sample | (s−b) ± STD | (-) ± STD | (s) ± STD |
|---|---|---|---|
| pure TAD | 0.21 ± 0.04 | 0.99 ± 0.10 | 0.00 ± 0.19 |
| TAD-K64 PM | 0.23 ± 0.03 | 0.96 ± 0.07 | 0.11 ± 0.12 |
| TAD-K64 SD (SE) | 0.93 ± 0.23 | 1.71 ± 0.29 | 0.00 ± 0.13 |
| TAD-K64 SD (SPD) | 0.38 ± 0.05 | 1.20 ± 0.10 | 0.21 ± 0.09 |
| TAD-K64 SD (HME125) | 0.77 ± 0.09 | 1.06 ± 0.14 | 0.13 ± 0.08 |
| TAD-K64 SD (HME250) | 0.61 ± 0.06 | 0.85 ± 0.10 | 0.41 ± 0.09 |
© 2019 by the authors. Licensee MDPI, Basel, Switzerland. This article is an open access article distributed under the terms and conditions of the Creative Commons Attribution (CC BY) license (http://creativecommons.org/licenses/by/4.0/).
Share and Cite
Školáková, T.; Slámová, M.; Školáková, A.; Kadeřábková, A.; Patera, J.; Zámostný, P. Investigation of Dissolution Mechanism and Release Kinetics of Poorly Water-Soluble Tadalafil from Amorphous Solid Dispersions Prepared by Various Methods. Pharmaceutics 2019, 11, 383. https://doi.org/10.3390/pharmaceutics11080383
Školáková T, Slámová M, Školáková A, Kadeřábková A, Patera J, Zámostný P. Investigation of Dissolution Mechanism and Release Kinetics of Poorly Water-Soluble Tadalafil from Amorphous Solid Dispersions Prepared by Various Methods. Pharmaceutics. 2019; 11(8):383. https://doi.org/10.3390/pharmaceutics11080383
Chicago/Turabian StyleŠkoláková, Tereza, Michaela Slámová, Andrea Školáková, Alena Kadeřábková, Jan Patera, and Petr Zámostný. 2019. "Investigation of Dissolution Mechanism and Release Kinetics of Poorly Water-Soluble Tadalafil from Amorphous Solid Dispersions Prepared by Various Methods" Pharmaceutics 11, no. 8: 383. https://doi.org/10.3390/pharmaceutics11080383