Impact of Breakfasts (with or without Eggs) on Body Weight Regulation and Blood Lipids in University Students over a 14-Week Semester


Abstract
:1. Introduction
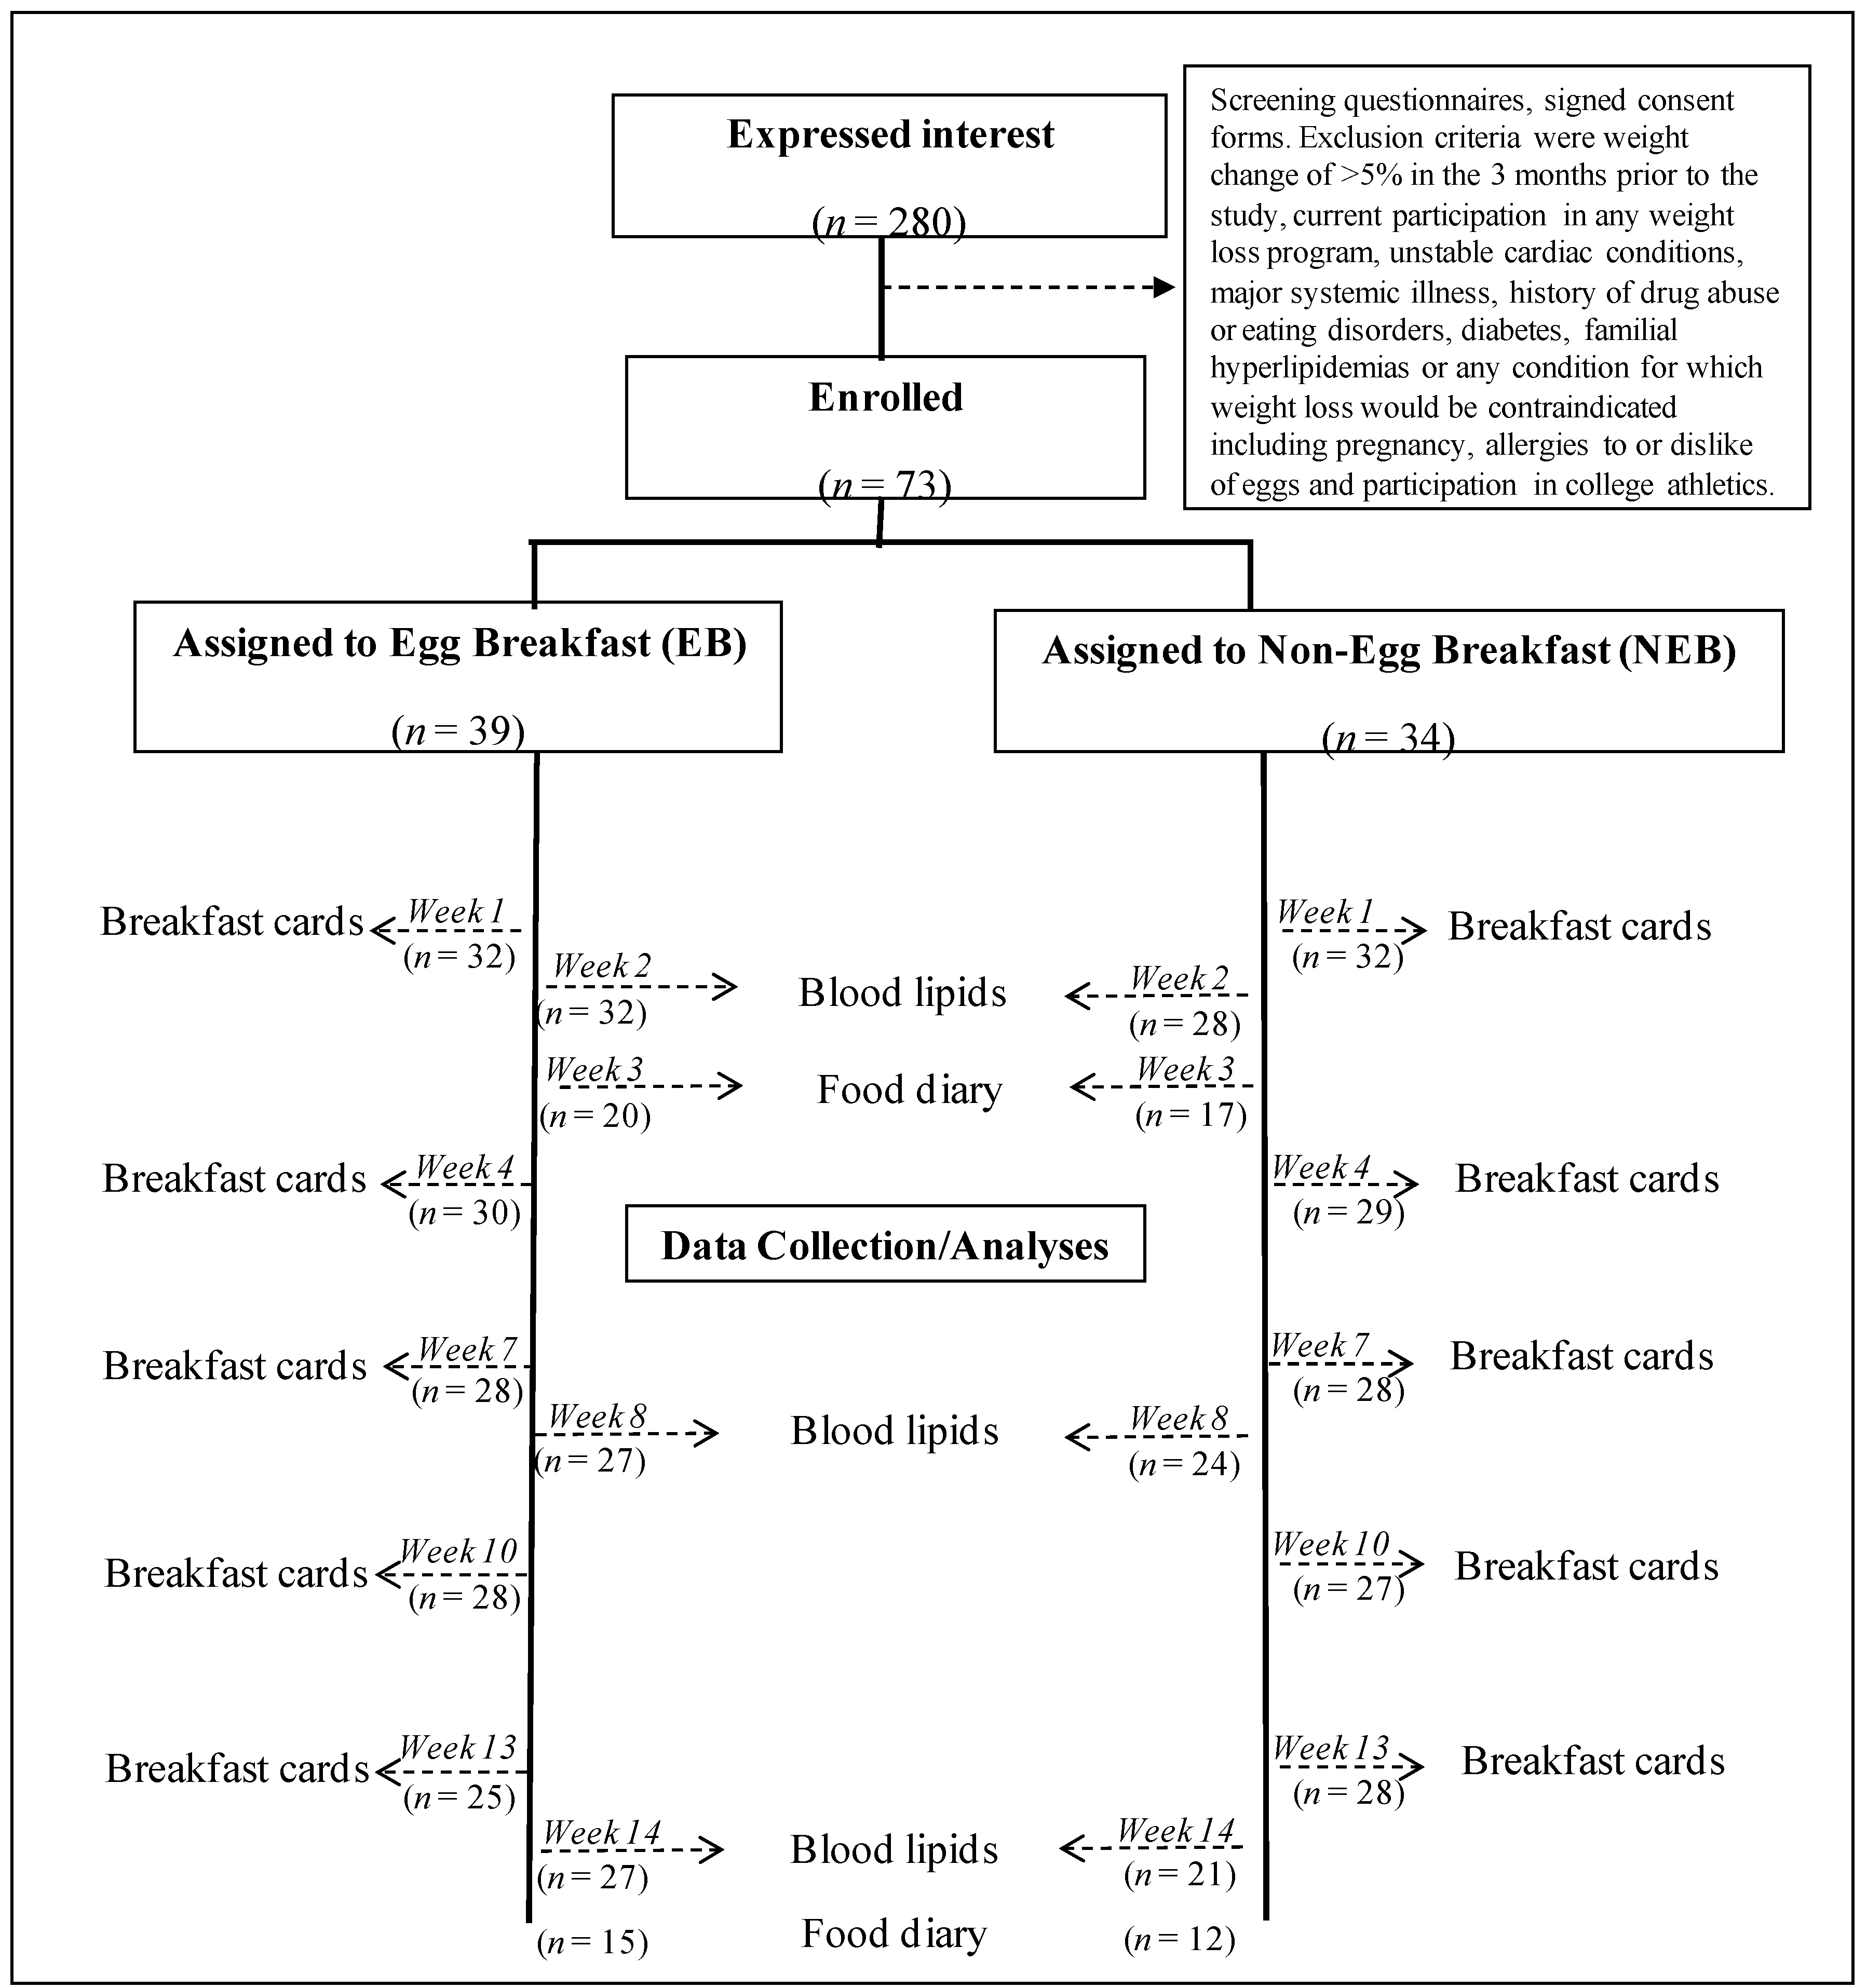
2. Experimental Section
3. Results

| Egg Group | Non-Egg Group | p | |
|---|---|---|---|
| (n = 39) | (n = 34) | ||
| Female | 23 (59%) | 23 (68%) | NS a |
| Male | 16 (41%) | 11 (32%) | NS |
| Mean Height (m) | 1.73 ± 0.02 | 1.71 ± 0.02 | 0.4 |
| Mean Weight (kg) | 83.9 ± 5.1 * | 70.6 ± 2.6 * | 0.029 |
| Mean BMI (kg/m2) | 27.8 ± 1.5 * | 24.1 ± 5.2 * | 0.046 |
| BMI < 25 kg/m2 | 18 (46%) | 24 (71%) | 0.031 b |
| BMI ≥ 25 kg/m2 | 21 (54%) | 10 (29%) | 0.031 |
| Underweight | 6 (15%) | 4 (12%) | NS c |
| Healthy Weight | 12 (31%) | 20 (59%) | NS |
| Overweight | 8 (21%) | 3 (9%) | NS |
| Obese | 13 (33%) | 7 (21%) | NS |
| Mean % Fat | 28.0 ± 15.4 | 23.7 ± 12.4 | NS |
| Total Cholesterol (mg/dL) | 145 ± 22 | 147 ± 27 | NS |
| Triglycerides (mg/dL) | 83 ± 36 | 92 ± 38 | NS |
| LDL Cholesterol (mg/dL) | 82 ± 19 | 83 ± 21 | NS |
| HDL Cholesterol (mg/dL) | 49 ± 12 | 49 ± 14 | NS |

| Egg Group | Non-Egg Group | p | |
|---|---|---|---|
| Total Calories | |||
| Week 1 | (n = 32) 615 ± 130 | (n = 30) 591 ± 197 | NS |
| Week 4 | (n = 30) 680 ± 212 | (n = 29) 633 ± 244 | NS |
| Week 7 | (n = 28) 686 ± 176 | (n = 28) 611 ± 197 | NS |
| Week 10 | (n = 28) 633 ± 189 | (n = 27) 679 ± 241 | NS |
| Week 13 | (n = 25) 601 ± 167 | (n = 28) 641 ± 180 | NS |
| Calories/kg Body Weight | |||
| Week 1 | 8.3 ± 2.9 | 8.9 ± 3.9 | NS |
| Week 4 | 9.3 ± 3.4 | 9.6 ± 4.9 | NS |
| Week 7 | 9.3 ± 3.2 | 9.2 ± 3.5 | NS |
| Week 10 | 8.4 ± 3.5 | 10.4 ± 4.7 | NS |
| Week 13 | 8.4 ± 3.7 | 9.7 ± 3.6 | NS |
| Calories from Carbohydrates | |||
| Week 1 | 301 ± 96 | 402 ± 139 | 0.002 |
| Week 4 | 325 ± 154 | 418 ± 144 | 0.002 |
| Week 7 | 335 ± 125 | 400 ± 134 | NS |
| Week 10 | 284 ± 113 | 440 ± 129 | <0.0001 |
| Week 13 | 265 ± 106 | 427 ± 129 | <0.0001 |
| Calories from Protein | |||
| Week 1 | 95 ± 28 | 69 ± 30 | 0.001 |
| Week 4 | 111 ± 37 | 75 ± 36 | <0.0001 |
| Week 7 | 106 ± 27 | 76 ± 34 | 0.001 |
| Week 10 | 102 ± 38 | 84 ± 34 | NS |
| Week 13 | 97 ± 30 | 77 ± 29 | 0.014 |
| Calories from Total Fat | |||
| Week 1 | 217 ± 59 | 127 ± 64 | <0.0001 |
| Week 4 | 241 ± 75 | 127 ± 64 | <0.0001 |
| Week 7 | 243 ± 63 | 142 ± 64 | <0.0001 |
| Week 10 | 243 ± 83 | 163 ± 91 | 0.001 |
| Week 13 | 235 ± 68 | 144 ± 59 | <0.0001 |
| Calories from Saturated Fat | |||
| Week 1 | 56 ± 17 | 32 ± 16 | <0.0001 |
| Week 4 | 60 ± 23 | 33 ± 16 | <0.0001 |
| Week 7 | 61 ± 17 | 36 ± 18 | <0.0001 |
| Week 10 | 60 ± 22 | 35 ± 18 | <0.0001 |
| Week 13 | 60 ± 16 | 33 ± 15 | <0.0001 |
| Cholesterol (mg) | |||
| Week 1 | 414 ± 41 | 63 ± 96 | <0.0001 |
| Week 4 | 422 ± 27 | 46 ± 81 | <0.0001 |
| Week 7 | 418 ± 14 | 76 ± 119 | <0.0001 |
| Week 10 | 417 ± 18 | 49 ± 79 | <0.0001 |
| Week 13 | 404 ± 52 | 68 ± 114 | <0.0001 |
| Egg Group | Non-Egg Group | p | |
|---|---|---|---|
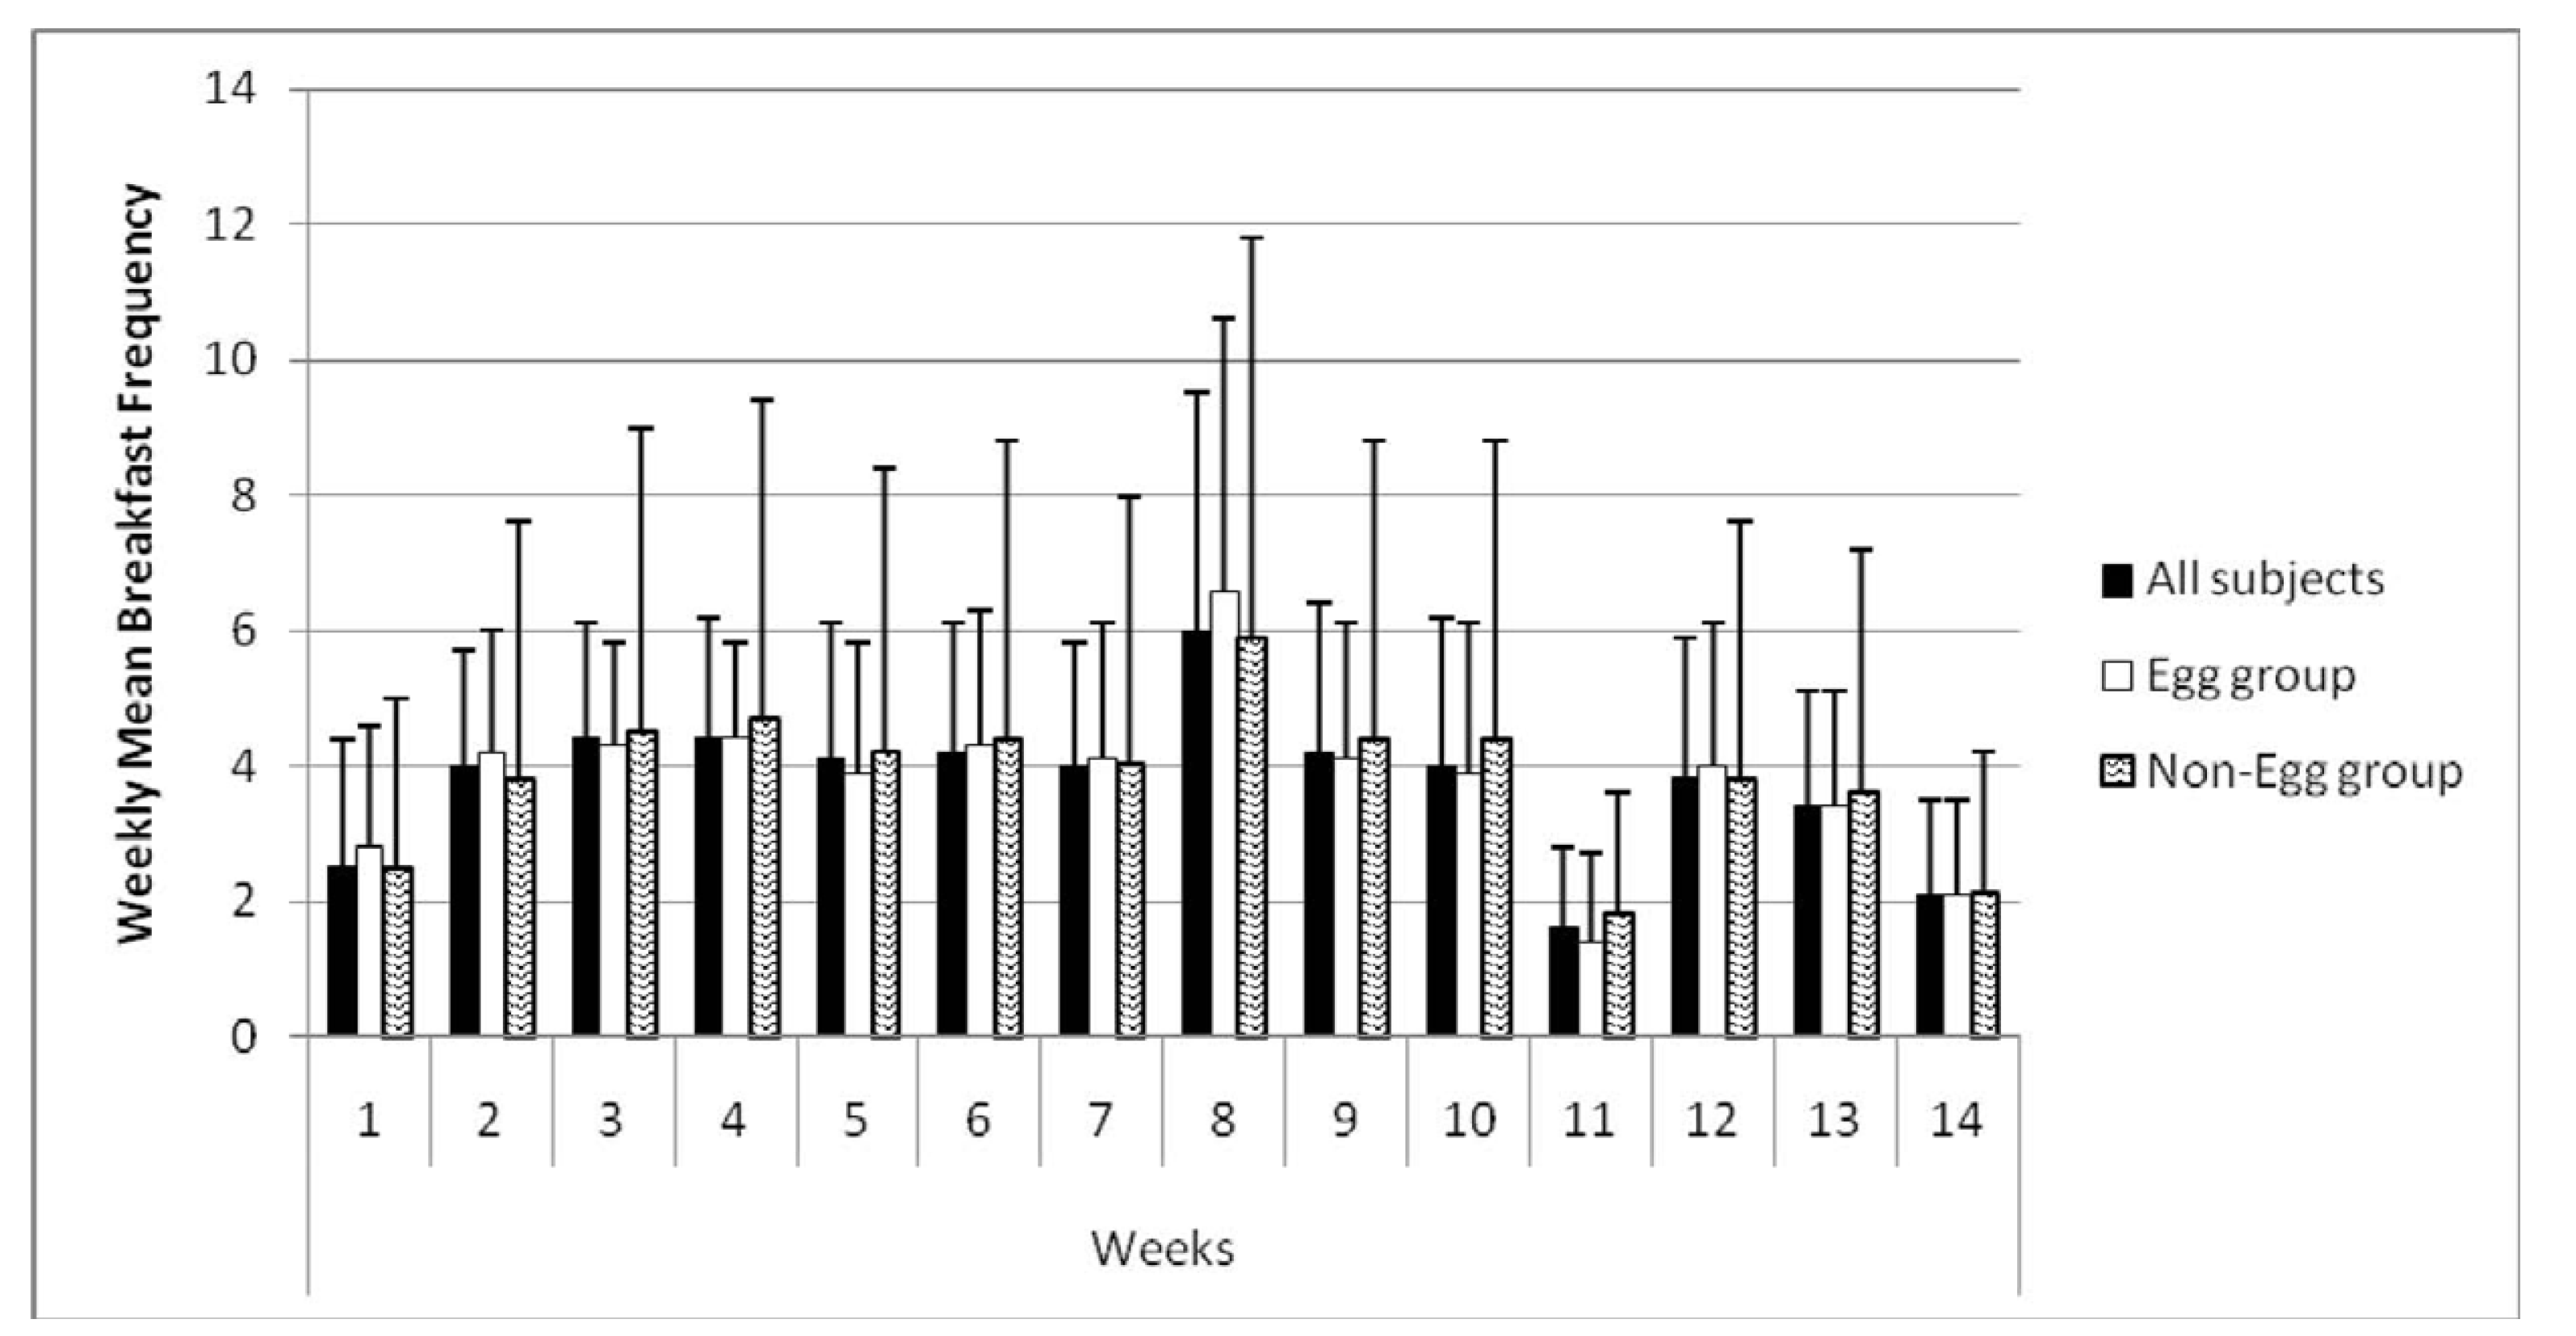
| Eggs | |||
| Week 1 | (n = 32) 0.98 ± 0.08 | (n = 30) 0.56 ± 0.21 | <0.0001 |
| Week 4 | (n = 30) 1.00 ± 0.06 | (n = 29) 0.03 ± 0.18 | <0.0001 |
| Week 7 | (n = 28) 1.00 ± 0.00 | (n = 28) 0.07 ± 0.26 | <0.0001 |
| Week 10 | (n = 28) 0.95 ± 0.20 | (n = 27) 0.04 ± 0.19 | <0.0001 |
| Week 13 | (n = 25) 0.97 ± 0.12 | (n = 28) 0.07 ± 0.26 | <0.0001 |
| Ready-to-Eat Cereal | |||
| Week 1 | 0.21 ± 0.33 | 0.24 ± 0.32 | NS |
| Week 4 | 0.23 ± 0.40 | 0.34 ± 0.42 | NS |
| Week 7 | 0.21 ± 0.36 | 0.26 ± 0.35 | NS |
| Week 10 | 0.09 ± 0.27 | 0.38 ± 0.41 | 0.004 |
| Week 13 | 0.15 ± 0.00 | 0.30 ± 0.38 | NS |
| Hot Cereal | |||
| Week 1 | 0.06 ± 0.21 | 0.13 ± 0.29 | NS |
| Week4 | 0.12 ± 0.31 | 0.14 ± 0.33 | NS |
| Week 7 | 0.10 ± 0.24 | 0.10 ± 0.24 | NS |
| Week 10 | 0.11 ± 0.29 | 0.07 ± 0.27 | NS |
| Week 13 | 0.06 ± 0.22 | 0.10 ± 0.28 | NS |
| Pancakes | |||
| Week 1 | 0.21 ± 0.34 | 0.38 ± 0.48 | NS |
| Week 4 | 0.38 ± 0.49 | 0.45 ± 0.45 | NS |
| Week 7 | 0.21 ± 0.33 | 0.40 ± 0.46 | NS |
| Week 10 | 0.30 ± 0.40 | 0.51 ± 0.43 | NS |
| Week 13 | 0.15 ± 0.31 | 0.48 ± 0.47 | 0.005 |
| Breakfast Meats | |||
| Week 1 | 0.41 ± 0.40 | 0.36 ± 0.44 | NS |
| Week 4 | 0.49 ± 0.54 | 0.36 ± 0.47 | NS |
| Week 7 | 0.51 ± 0.46 | 0.42 ± 0.41 | NS |
| Week 10 | 0.53 ± 0.50 | 0.40 ± 0.53 | NS |
| Week 13 | 0.50 ± 0.44 | 0.36 ± 0.41 | NS |
| Potatoes | |||
| Week 1 | 0.40 ± 0.43 | 0.38 ± 0.45 | NS |
| Week 4 | 0.37 ± 0.42 | 0.49 ± 0.48 | NS |
| Week 7 | 0.51 ± 0.45 | 0.41 ± 0.45 | NS |
| Week 10 | 0.54 ± 0.43 | 0.59 ± 0.49 | NS |
| Week 13 | 0.57 ± 0.47 | 0.45 ± 0.45 | NS |
| Toast | |||
| Week 1 | 0.14 ± 0.28 | 0.28 ± 0.38 | NS |
| Week 4 | 0.12 ± 0.24 | 0.21 ± 0.33 | NS |
| Week 7 | 0.19 ± 0.36 | 0.31 ± 0.38 | NS |
| Week 10 | 0.07 ± 0.21 | 0.26 ± 0.40 | 0.031 |
| Week 13 | 0.14 ± 0.31 | 0.27 ± 0.39 | NS |
| Pastries | |||
| Week 1 | 0.08 ± 0.17 | 0.18 ± 0.34 | NS |
| Week 4 | 0.13 ± 0.28 | 0.28 ± 0.64 | NS |
| Week 7 | 0.17 ± 0.29 | 0.16 ± 0.30 | NS |
| Week 10 | 0.15 ± 0.30 | 0.28 ± 0.48 | NS |
| Week 13 | 0.12 ± 0.26 | 0.20 ± 0.36 | NS |
| Juice | |||
| Week 1 | 0.61 ± 0.50 | 0.76 ± 0.55 | NS |
| Week 4 | 0.59 ± 0.57 | 0.92 ± 0.79 | NS |
| Week 7 | 0.72 ± 0.47 | 0.70 ± 0.48 | NS |
| Week 10 | 0.56 ± 0.48 | 0.85 ± 0.70 | NS |
| Week 13 | 0.52 ± 0.47 | 0.73 ± 0.43 | NS |
| Milk | |||
| Week 1 | 0.28 ± 0.41 | 0.31 ± 0.38 | NS |
| Week 4 | 0.32 ± 0.42 | 0.36 ± 0.42 | NS |
| Week 7 | 0.30 ± 0.47 | 0.36 ± 0.39 | NS |
| Week 10 | 0.21 ± 0.38 | 0.40 ± 0.43 | NS |
| Week 13 | 0.30 ± 0.46 | 0.33 ± 0.42 | NS |
| Fruit | |||
| Week 1 | 0.56 ± 0.58 | 0.70 ± 0.67 | NS |
| Week 4 | 0.23 ± 0.43 | 0.24 ± 0.47 | NS |
| Week 7 | 0.39 ± 0.42 | 0.60 ± 0.61 | NS |
| Week 10 | 0.14 ± 0.36 | 0.23 ± 0.37 | NS |
| Week 13 | 0.27 ± 0.33 | 0.60 ± 0.64 | 0.027 |
| Yogurt | |||
| Week 1 | 0.21 ± 0.36 | 0.25 ± 0.40 | NS |
| Week 4 | 0.21 ± 0.45 | 0.20 ± 0.34 | NS |
| Week 7 | 0.24 ± 0.41 | 0.25 ± 0.42 | NS |
| Week 10 | 0.22 ± 0.43 | 0.17 ± 0.34 | NS |
| Week 13 | 0.16 ± 0.29 | 0.27 ± 0.39 | NS |
| T = 3 weeks | T = 14 weeks | |||
|---|---|---|---|---|
| Egg Group | Non-Egg Group | Egg Group | Non-Egg Group | |
| n = 20 a | n = 17 | n = 15 | n = 12 | |
| Total Calories | 2041 ± 690 | 1943 ± 969 | 2347 ± 951 | 2026 ± 1072 |
| Calories from Carbohydrate | 1031 ± 437 | 1094 ± 545 | 1278 ± 697 | 1009 ± 634 |
| Calories from Protein | 333 ± 140 | 305 ± 261 | 333 ± 144 | 302 ± 103 |
| Calories from Fat | 683 ± 291 | 585 ± 253 | 755 ± 452 | 767 ± 425 |
| Calories from Saturated Fat | 285 ± 199 | 196 ± 114 | 285 ± 200 | 213 ± 112 |
| Fiber (g) | 15.8 ± 14.5 | 15.8 ± 10.4 | 16.2 ± 6.7 | 15.6 ± 10.9 |
| Cholesterol (mg) | 457 ± 187 * | 154 ± 116 * | 380 ± 157 ! | 254 ± 179 ! |
| %Cals from Carbohydrate | 49.8 ± 7.6 ** | 55.7 ± 11.8 ** | 55.1 ± 15.1 | 48.8 ± 9.0 |
| %Cals from Protein | 16.1 ± 3.1 | 14.7 ± 4.9 | 14.7 ± 3.6 | 16.1 ± 5.0 |
| %Cals from Fat | 33.9 ± 9.9 | 31.7 ± 10.4 | 31.6 ± 12.9 | 37.7 ± 8.5 |
| %Cals from Saturated Fat | 12.4 ± 3.0 | 10.4 ± 4.4 | 11.4 ± 5.5 | 10.9 ± 3.1 |

| Week 2 | Week 8 | Week 14 | ||||
|---|---|---|---|---|---|---|
| EB | NEB | EB | NEB | EB | NEB | |
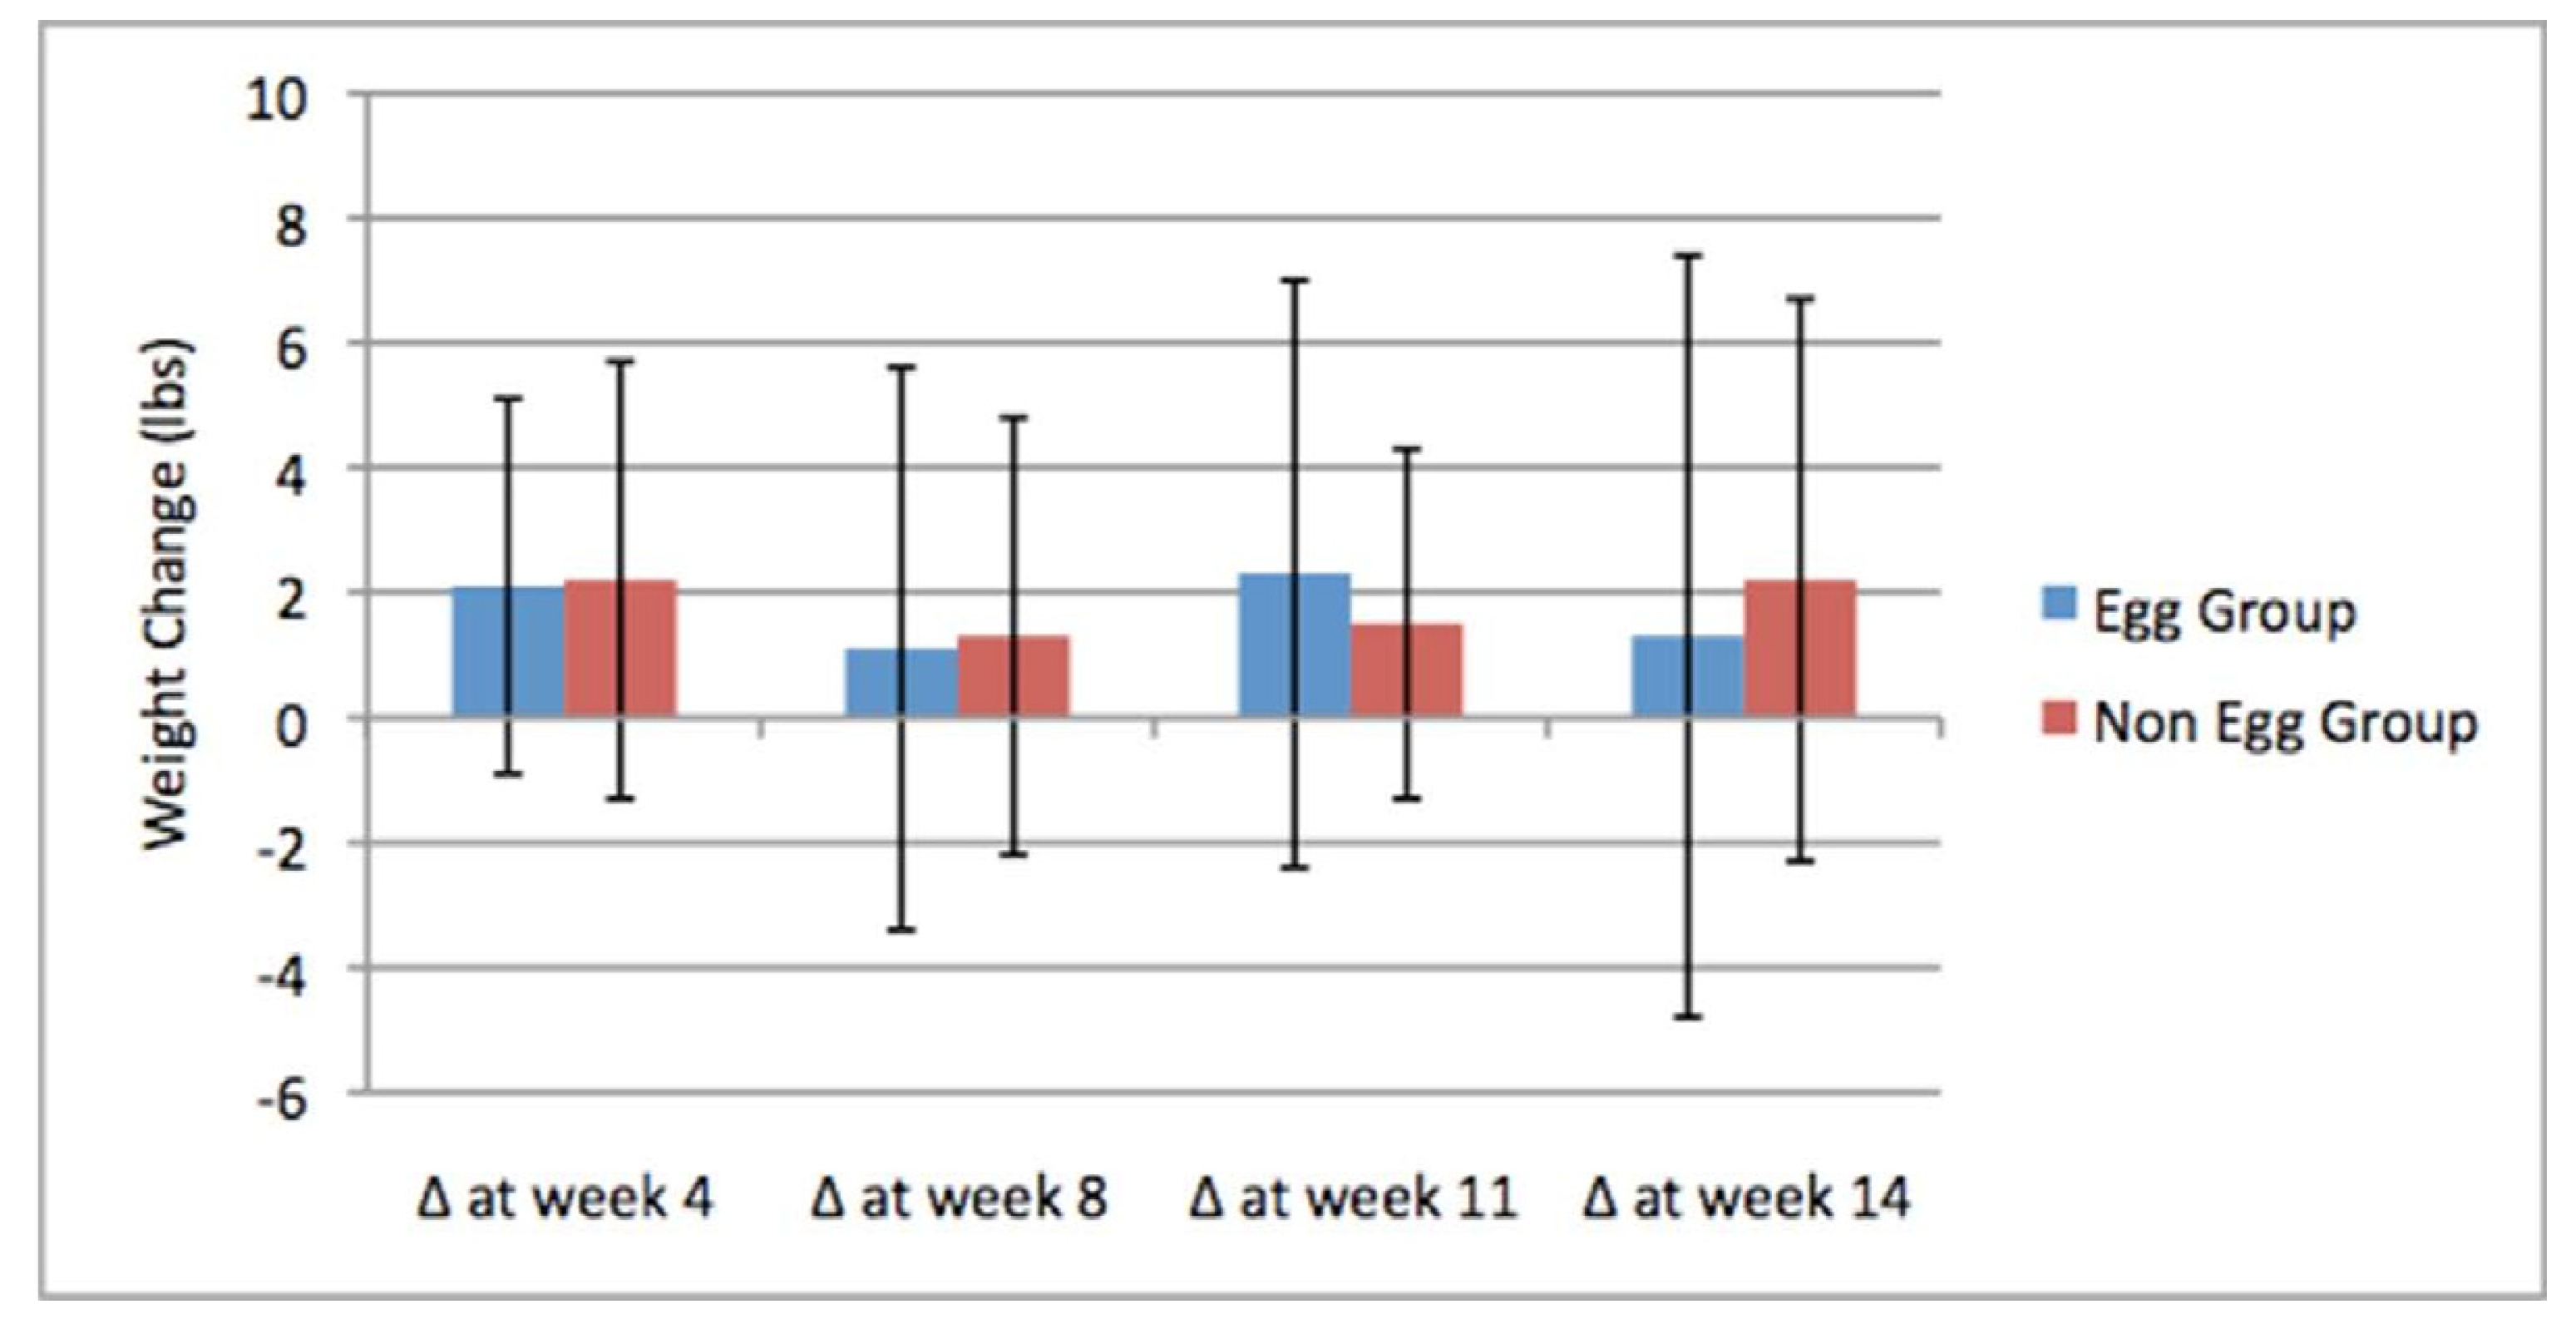
| Total Cholesterol (mg/dL) | 145 ± 22 (n = 34) | 146 ± 27 (n = 28) | 152 ± 26 (n = 27) | 147 ± 26 (n = 24) | 168 ± 28 (n = 27) | 164 ± 32 (n = 21) |
| Triglycerides (mg/dL) | 83 ± 36 (n = 32) | 92 ± 38 (n = 25) | 83 ± 27 (n = 23) | 91 ± 39 (n = 20) | 96 ± 41 (n = 22) | 108 ± 51 (n = 18) |
| LDL Cholesterol (mg/dL) | 82 ± 19 (n = 30) | 83 ± 21 (n = 23) | 86 ± 22 (n = 22) | 81 ± 18 (n = 20) | 97 ± 26 (n = 22) | 93 ± 23 (n = 18) |
| HDL Cholesterol (mg/dL) | 48 ± 12 (n = 35) | 49 ± 14 (n = 32) | 52 ± 13 (n = 28) | 51 ± 14 (n = 24) | 56 ± 13 (n = 28) | 54 ± 18 (n = 22) |
| TC/HDLC Ratio | 3.2 ± 1.0 (n = 33) | 3.1 ± 1.0 (n = 28) | 3.0 ± 0.7 (n = 27) | 3.1 ± 0.9 (n = 24) | 3.1 ± 0.8 (n = 27) | 3.3 ± 1.3 (n = 21) |
4. Discussion
5. Conclusions
Acknowledgements
Conflicts of Interest
References
- Lowry, R.; Galuska, D.A.; Fulton, J.E.; Wechsler, H.; Kann, H.; Collins, J.L. Physical activity, food choice, and weight management goals and practices among U.S. college students. Am. J. Prev. Med. 2000, 18, 18–27. [Google Scholar]
- Huang, T.T.; Kempf, A.M.; Strother, M.L.; Li, C.; Lee, R.E.; Harris, K.J.; Kaur, H. Overweight and components of the metabolic syndrome in college students. Diabetes Care 2004, 27, 3000–3001. [Google Scholar] [CrossRef]
- Nicklas, T.A.; Baranowski, T.; Cullen, K.W.; Berenson, G. Eating patterns, dietary quality and obesity. J. Am. Coll. Nutr. 2001, 20, 599–608. [Google Scholar] [CrossRef]
- Neumark-Sztainer, D.; Wall, M.; Haines, J.; Story, M.; Eisenberg, M.E. Why does dieting predict weight gain in adolescents? Findings from project EAT-II: A 5-year longitudinal study. J. Am. Diet. Assoc. 2007, 107, 448–455. [Google Scholar] [CrossRef]
- D’Addesa, D.; D’Addesa, L.; Martone, D.; Censi, L.; Scanu, A.; Cairella, G.; Spagnolo, A.; Menghetti, E. Dietary intake and physical activity of normal weight and overweight/obese adolescents. Int. J. Pediatr. 2010, 2010, 9. [Google Scholar]
- Ma, Y.; Bertone, E.R.; Stanek, E.J.; Reed, G.W.; Hebert, J.R.; Cohen, N.L.; Merriam, P.A.; Ockene, I.S. Association between eating patterns and obesity in a free-living US adult population. Am. J. Epidemiol. 2003, 158, 85–92. [Google Scholar] [CrossRef]
- Vågstrand, K.; Barkeling, B.; Forslund, H.B.; Elfhag, K.; Linné, Y.; Rössner, S.; Lindroos, A.K. Eating habits in relation to body fatness and gender in adolescents—Results from the “SWEDES” study. Eur. J. Clin. Nutr. 2007, 61, 517–525. [Google Scholar]
- Cho, S.; Dietrich, M.; Brown, C.J.P.; Clark, C.A.; Block, G. The effect of breakfast type on total daily energy intake and body mass index: Results from the Third National Health and Nutrition Examination Survey (NHANES III). J. Am. Coll. Nutr. 2003, 22, 296–302. [Google Scholar] [CrossRef]
- Farshchi, H.R.; Taylor, M.A.; Macdonald, I.A. Deleterious effects of omitting breakfast on insulin sensitivity and fasting lipid profiles in healthy lean women. Am. J. Clin. Nutr. 2005, 81, 388–396. [Google Scholar]
- Holt, S.H.; Brand-Miller, J.C.; Stitt, P.A. The effects of equal-energy portions of different breads on blood glucose levels, feelings of fullness and subsequent food intake. J. Am. Diet. Assoc. 2001, 101, 767–773. [Google Scholar] [CrossRef]
- Stubbs, R.J.; van Wyk, M.C.; Johnstone, A.M.; Harbron, C.G. Breakfasts high in protein, fat or carbohydrate: Effect on within-day appetite and energy balance. Eur. J. Clin. Nutr. 1996, 50, 409. [Google Scholar]
- Vander Wal, J.S.; Marth, J.M.; Khosla, P.; Jen, K.L.; Dhurandhar, N.V. Short-term effect of eggs on satiety in overweight and obese subjects. J. Am. Coll. Nutr. 2005, 24, 510–515. [Google Scholar] [CrossRef]
- Vander Wal, J.S.; Gupta, A.; Khosla, P.; Dhurandhar, N.V. Egg breakfast enhances weight loss. Int. J. Obes. (Lond.) 2008, 32, 1545–1551. [Google Scholar] [CrossRef]
- Delva, J.; O’Malley, P.M.; Johnston, L.D. Racial/ethnic and socioeconomic status differences in overweight and health-related behaviors among american students: National trends 1986–2003. J. Adolesc. Health 2006, 39, 536–545. [Google Scholar] [CrossRef]
- Hu, F.B.; Stampfer, M.J.; Rimm, E.B.; Manson, J.E.; Ascherio, A.; Colditz, G.A.; Rosner, B.A.; Spiegelman, D.; Speizer, F.E.; Sacks, F.M.; et al. A prospective study of egg consumption and risk of cardiovascular disease in men and women. JAMA 1999, 281, 1387–1394. [Google Scholar]
- Katz, D.L.; Evans, M.A.; Nawaz, H.; Njike, V.Y.; Chan, W.; Comerford, B.P.; Hoxley, M.L. Egg consumption and endothelial function: A randomized controlled crossover trial. Int. J. Cardiol. 2005, 99, 65–70. [Google Scholar] [CrossRef]
- Herron, K.L.; Lofgren, I.E.; Sharman, M.; Volek, J.S.; Fernandez, M.L. High intake of cholesterol results in less atherogenic low-density lipoprotein particles in men and women independent of response classification. Metabolism 2004, 53, 823–830. [Google Scholar] [CrossRef]
- NutriSOURCE. Available online: http://www.avinutrisource.com last accessed (accessed on 4 December 2013).
- NAT Tools for Good Health, version 2.0. Available online: http://www.myfoodrecord.com (accessed on 4 December 2013).
- USDA National Nutrient Database for Standard Reference. Available online: http://www.ars.usda.gov/Services/docs.htm?docid=8964 (accessed on 10 December 2013).
- Economos, C.D.; Hildebrandt, M.L.; Hyatt, R.R. College freshman stress and weight change: Differences by gender. Am. J. Health Behav. 2008, 32, 16–25. [Google Scholar]
- Anderson, D.A.; Shapiro, J.R.; Lundgren, J.D. The freshman year of college as a critical period for weight gain: An initial evaluation. Eat. Behav. 2003, 4, 363–367. [Google Scholar] [CrossRef]
- Lloyd-Jones, D.M.; Liu, K.; Colangelo, L.A.; Yan, L.L.; Klein, L.; Loria, C.M.; Lewis, C.E.; Savage, P. Consistently stable or decreased body mass index in young adulthood and longitudinal changes in metabolic syndrome components: The Coronary Artery Risk Development in Young Adults Study. Circulation 2007, 115, 1004–1011. [Google Scholar] [CrossRef]
- Rampersaud, G.C.; Periera, M.A.; Girard, B.L.; Adams, J.; Metzl, J.D. Breakfast Habits, Nutritional Status, Body Weight, and Academic Performance in Children and Adolescents. J. Am. Diet. Assoc. 2005, 105, 743–760. [Google Scholar] [CrossRef]
- Masheb, R.M.; Grilo, C.M. Eating patterns and breakfast consumption in obese patients with binge eating disorder. Behav. Res. Ther. 2006, 44, 1545–1553. [Google Scholar] [CrossRef]
- Jung, M.E.; Bray, S.R.; Ginis, K.A.M. Behavior change and the freshman 15: Tracking physical activity and dietary patterns in 1st-year university women. J. Am. Coll. Health 2008, 56, 523–528. [Google Scholar] [CrossRef]
- Okubo, H.; Sasaki, S.; Hirota, N.; Notsu, A.; Todoriki, H.; Miura, A.; Fukui, M.; Date, C. The influence of age and body mass index on relative accuracy of energy intake among Japanese adults. Pub. Health Nutr. 2006, 9, 651–657. [Google Scholar]
- Crombie, A.P.; Ilich, J.Z.; Dutton, G.R.; Panton, L.B.; Abood, D.A. The freshman weight gain phenomenon revisited. Nutr. Rev. 2009, 67, 83–94. [Google Scholar] [CrossRef]
- Hovell, M.F.; Randle, Y.; Mewborn, C.R.; Fowler-Johnson, S. Risk of excess weight gain in university women: A three-year community controlled analysis. Addict. Behav. 1985, 10, 15–28. [Google Scholar] [CrossRef]
- Levitsky, D.A.; Halbmaier, C.A.; Mrdjenovic, G. The freshman weight gain: A model for the study of the epidemic of obesity. Int. J. Obes. Relat. Metab. Disord. 2004, 28, 1435–1442. [Google Scholar] [CrossRef]
- Matvienko, O.; Lewis, D.S.; Schafer, E. A college nutrition science course as an intervention to prevent weight gain in female college freshmen. J. Nutr. Educ. 2001, 33, 99–101. [Google Scholar]
- Kasparek, D.G.; Corwin, S.J.; Valois, R.F.; Sargent, R.G.; Morris, R.L. Selected health behaviors that influence college freshman weight change. J. Am. Coll. Health 2008, 56, 437–444. [Google Scholar] [CrossRef]
- Mihalopoulos, N.L.; Auinger, P.; Klein, J.D. The freshmen 15: Is it real? J. Am. Coll. Health 2008, 56, 531–533. [Google Scholar] [CrossRef]
- Lowe, M.R.; Annunziato, R.A.; Markowitz, J.T.; Didie, E.; Bellace, D.L.; Riddell, L.; Maille, C.; McKinney, S.; Stice, E. Multiple types of dieting prospectively predict weight gain during the freshman year of college. Appetite 2006, 47, 83–90. [Google Scholar] [CrossRef]
- Hajhosseini, L.; Holmes, T.; Mohamadi, P.; Goudarzi, V.; McProud, L.; Hollenbeck, C.B. Changes in body weight, body composition and resting metabolic rate (RMR) in first-year university freshmen students. J. Am. Coll. Nutr. 2006, 25, 123–127. [Google Scholar] [CrossRef]
- Howell, W.H.; McNamara, D.J.; Tosca, M.A.; Smith, B.T.; Gaines, J.A. Plasma lipid and lipoprotein responses to dietary fat and cholesterol: A meta-analysis. Am. J. Clin. Nutr. 1997, 65, 1747–1764. [Google Scholar]
- Clarke, R.; Frost, C.; Collins, R.; Appleby, P.; Peto, R. Dietary lipids and blood cholesterol: Quantitative meta-analysis of metabolic ward studies. BMJ 1997, 314, 112. [Google Scholar] [CrossRef]
- Weggemans, R.M.; Zock, P.L.; Katan, M.B. Dietary cholesterol from eggs increases the ratio of total cholesterol to high-density lipoprotein cholesterol in humans: A meta-analysis. Am. J. Clin. Nutr. 2001, 73, 885–891. [Google Scholar]
- McNamara, D.J. Eggs and heart disease risk: Perpetuating the misperception. Am. J. Clin. Nutr. 2002, 75, 333–334. [Google Scholar]
- Herron, K.L.; Fernandez, M.L. Are the current dietary guidelines regarding egg consumption appropriate? J. Nutr. 2004, 134, 187–190. [Google Scholar]
- Knopp, R.H.; Retzlaff, B.; Fish, B.; Walden, C.; Wallick, S.; Anderson, M.; Kahn, S.E. Effects of insulin resistance and obesity on lipoproteins and sensitivity to egg feeding. Arterioscler. Thromb. Vasc. Biol. 2003, 23, 1437–1443. [Google Scholar] [CrossRef]
© 2013 by the authors; licensee MDPI, Basel, Switzerland. This article is an open access article distributed under the terms and conditions of the Creative Commons Attribution license (http://creativecommons.org/licenses/by/3.0/).
Share and Cite
Rueda, J.M.; Khosla, P. Impact of Breakfasts (with or without Eggs) on Body Weight Regulation and Blood Lipids in University Students over a 14-Week Semester. Nutrients 2013, 5, 5097-5113. https://doi.org/10.3390/nu5125097
Rueda JM, Khosla P. Impact of Breakfasts (with or without Eggs) on Body Weight Regulation and Blood Lipids in University Students over a 14-Week Semester. Nutrients. 2013; 5(12):5097-5113. https://doi.org/10.3390/nu5125097
Chicago/Turabian StyleRueda, Janice M., and Pramod Khosla. 2013. "Impact of Breakfasts (with or without Eggs) on Body Weight Regulation and Blood Lipids in University Students over a 14-Week Semester" Nutrients 5, no. 12: 5097-5113. https://doi.org/10.3390/nu5125097