The Effects of Dairy Intake on Insulin Resistance: A Systematic Review and Meta-Analysis of Randomized Clinical Trials

 , ,
, ,
Abstract
:1. Introduction
2. Materials and Methods
2.1. Search Strategy
2.2. Study Selection
2.3. Data Abstraction
2.4. Study Quality and Risk of Bias Assessment
2.5. Publication Bias Assessment
2.6. Statistical Analyses
2.7. Sensitivity Analyses
3. Results
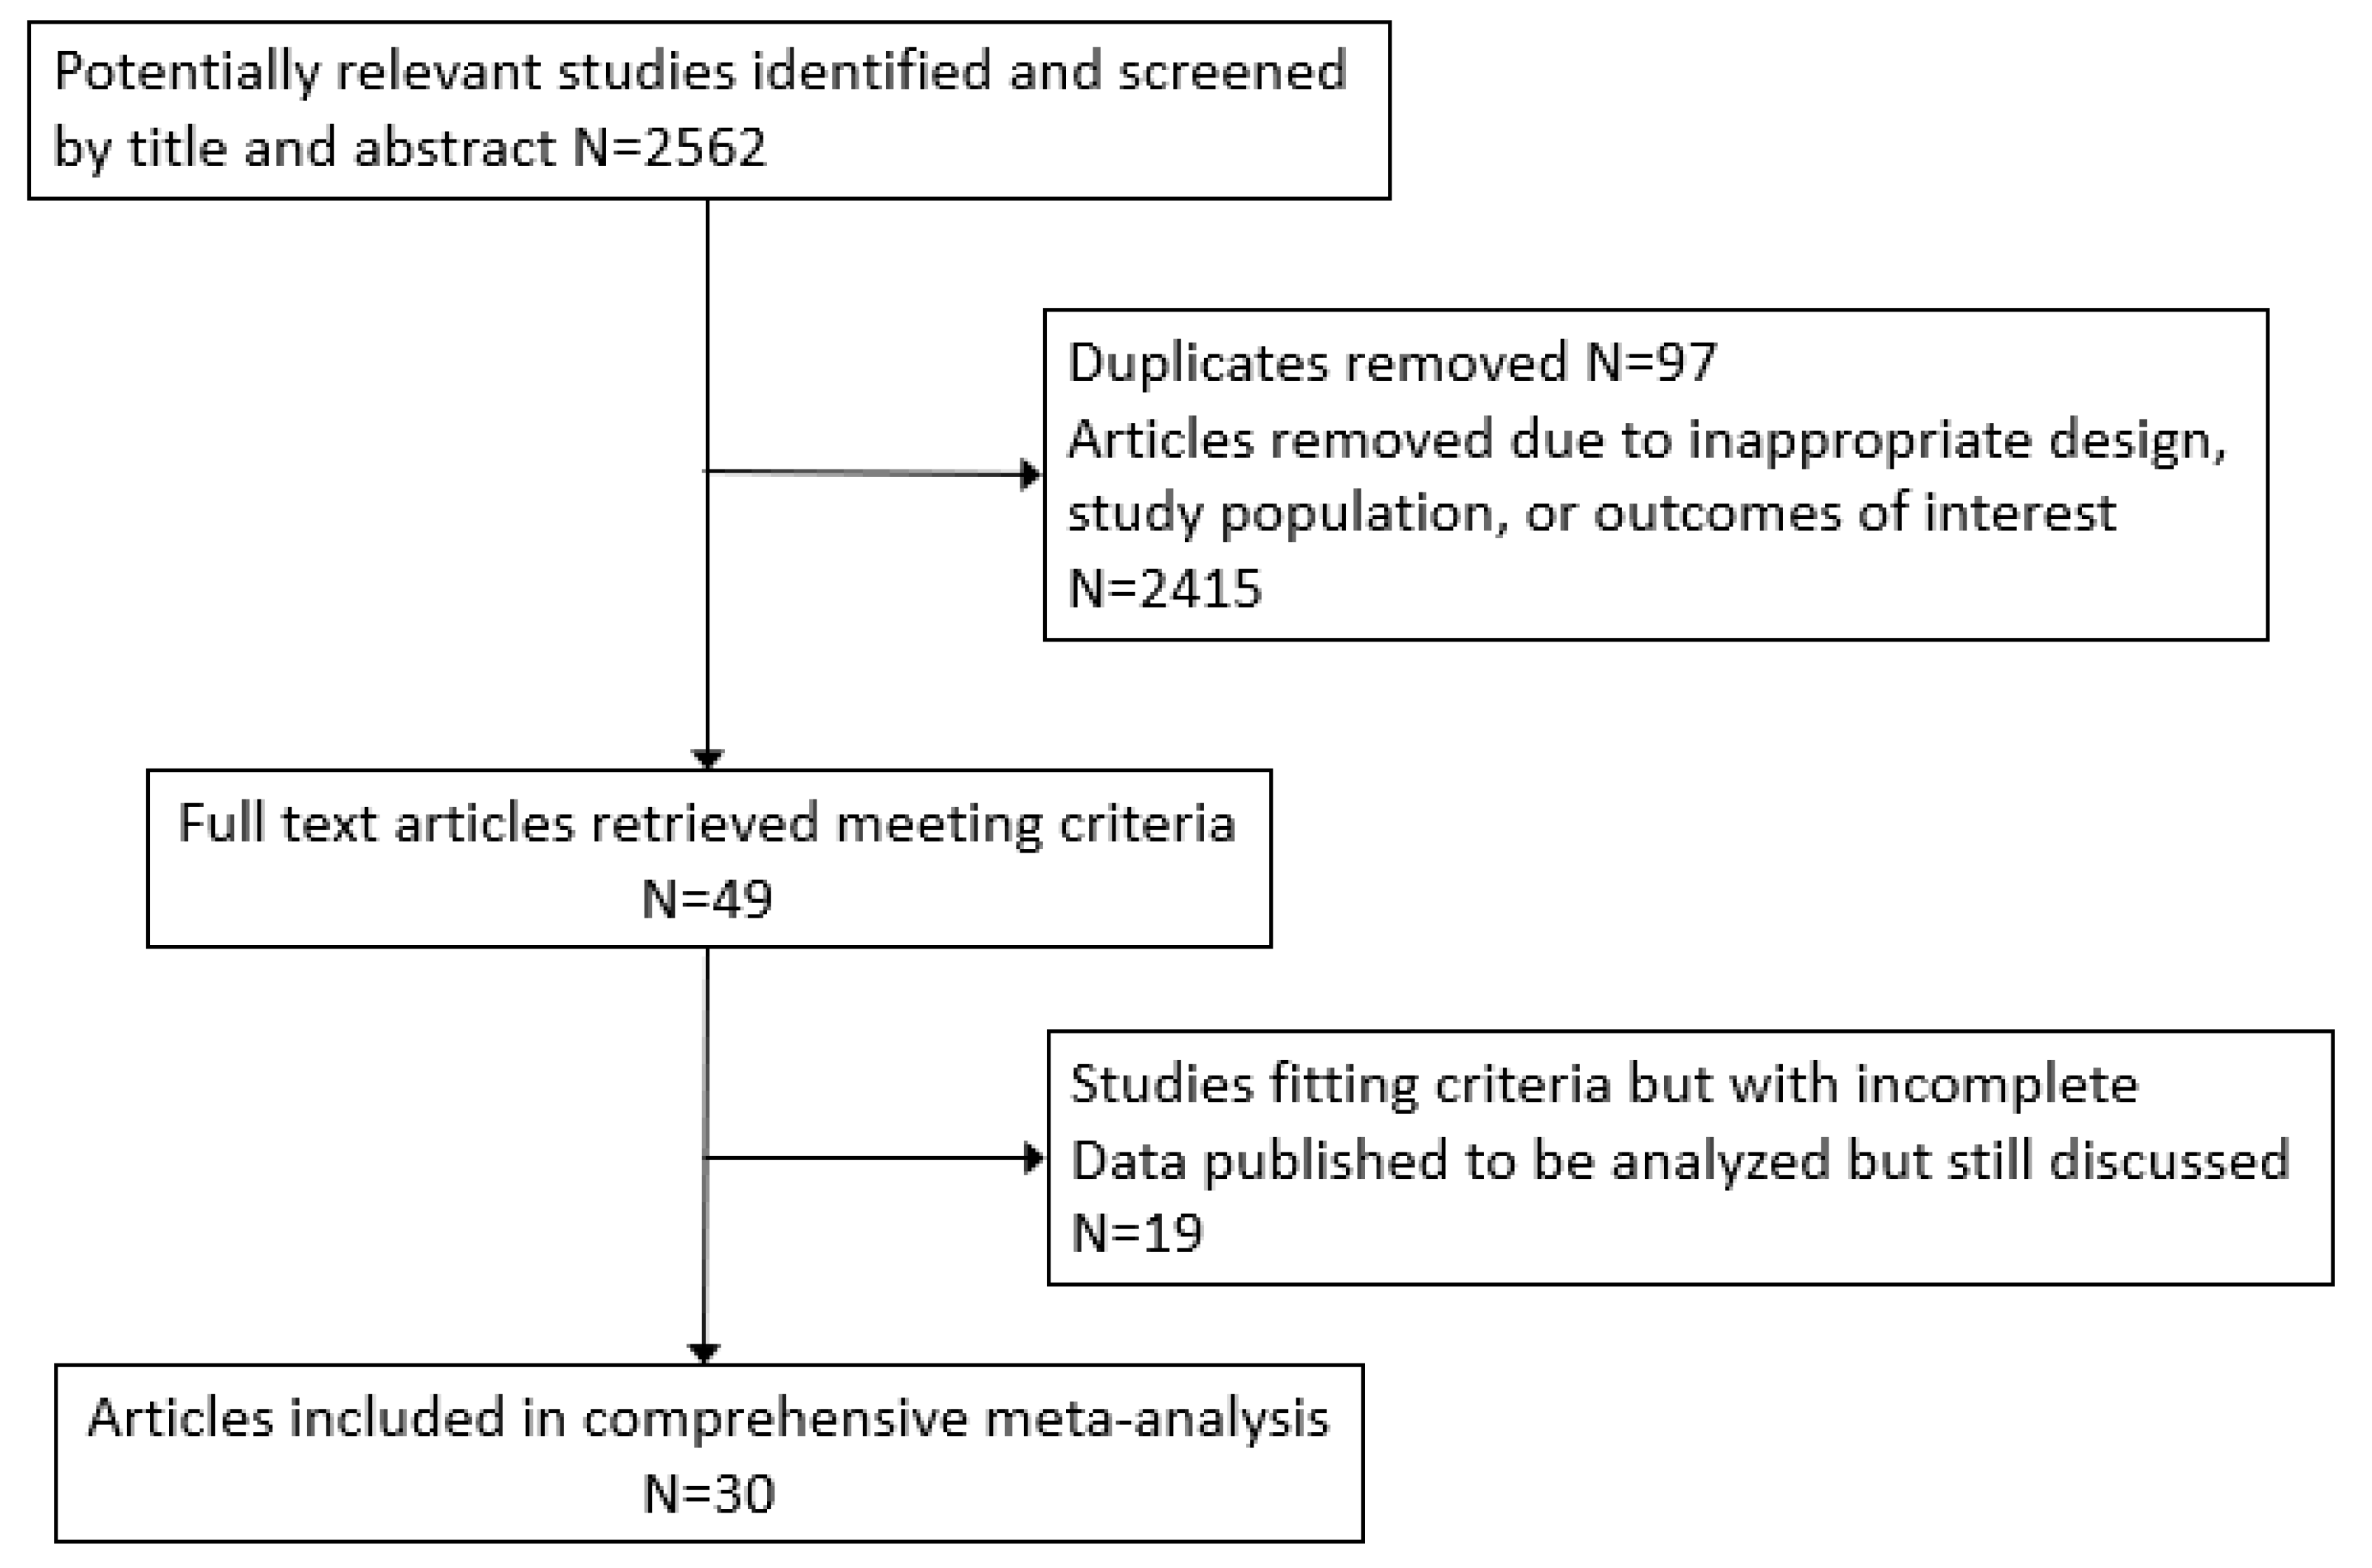
3.1. Study Selection
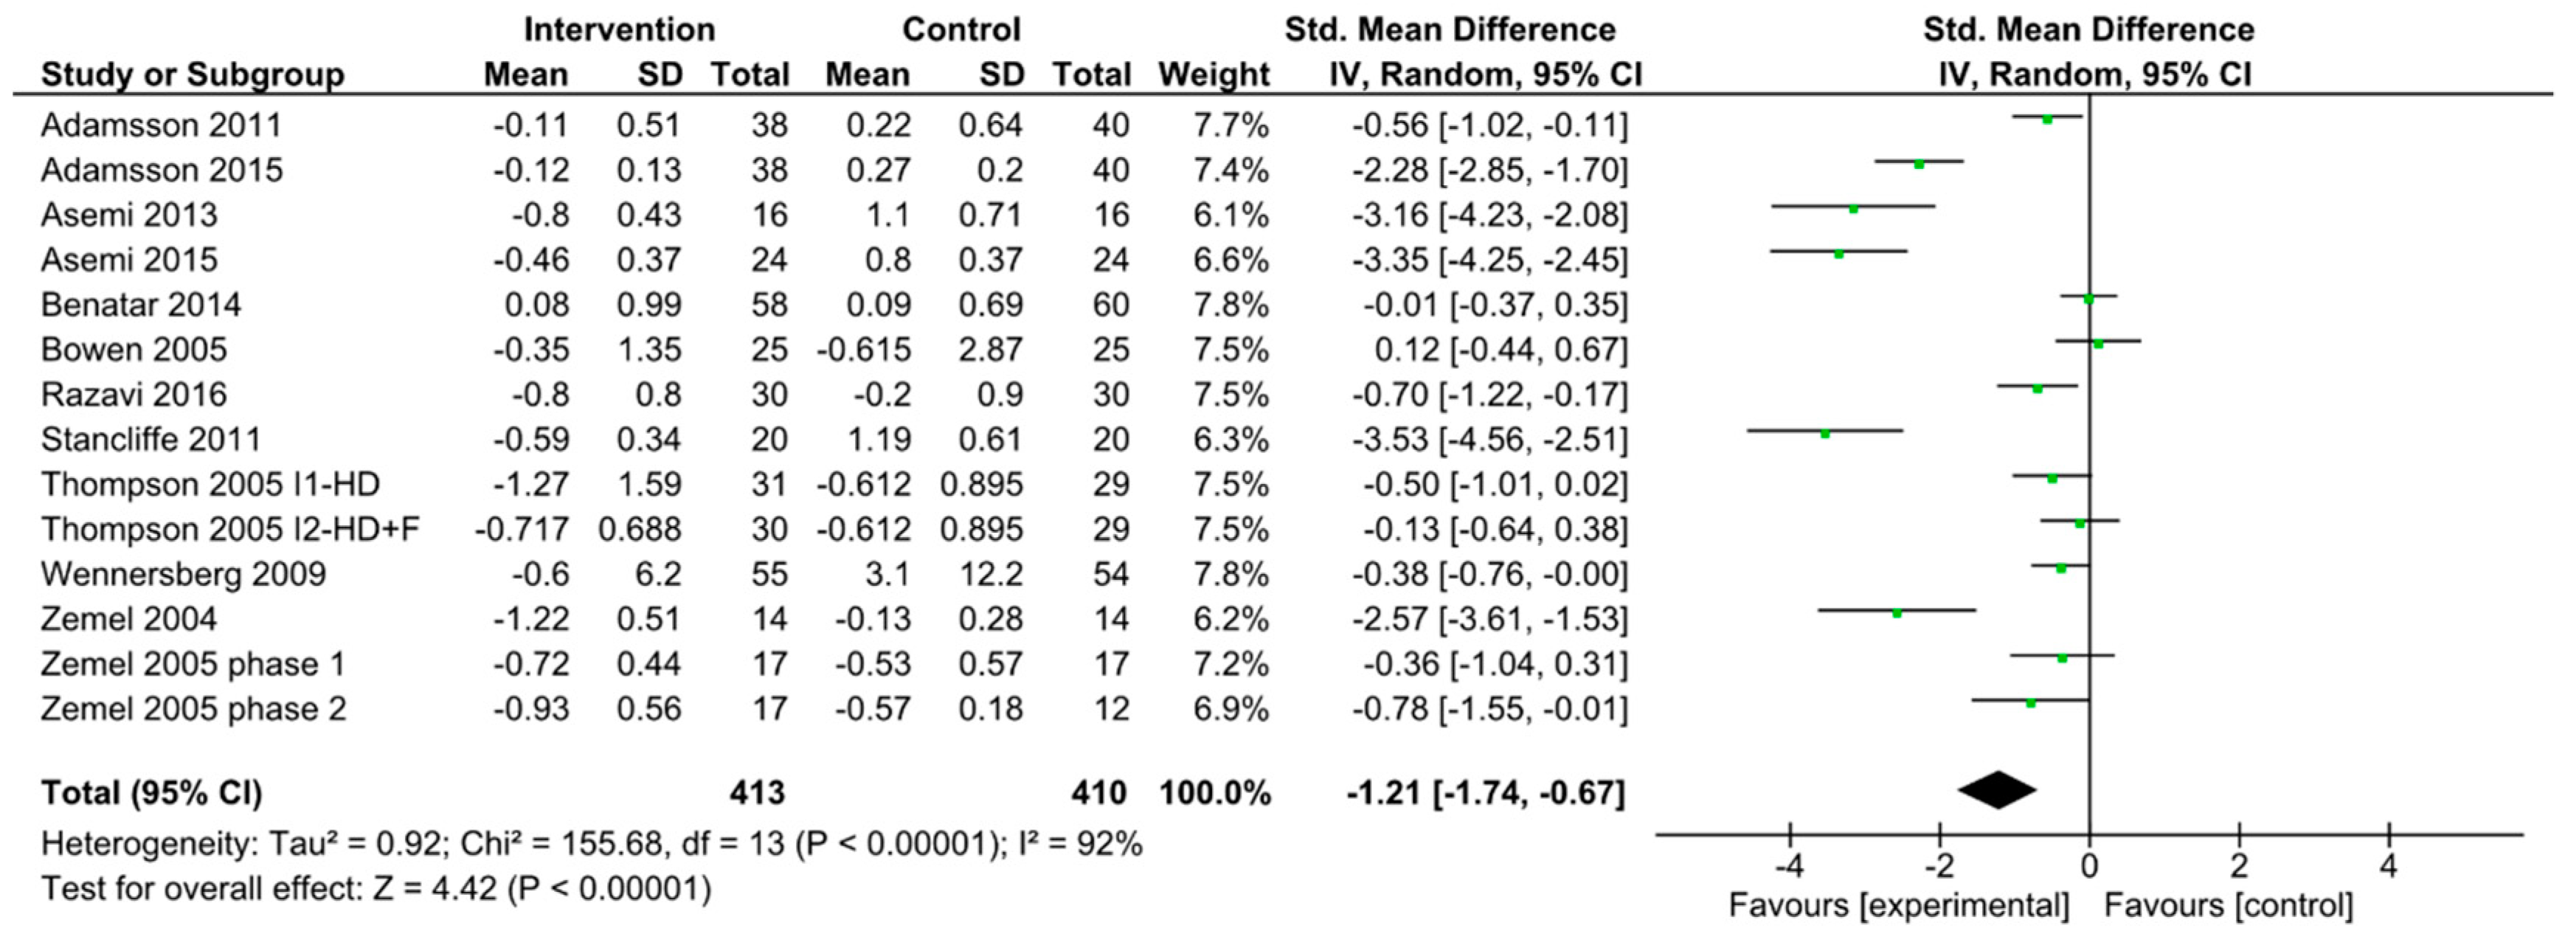
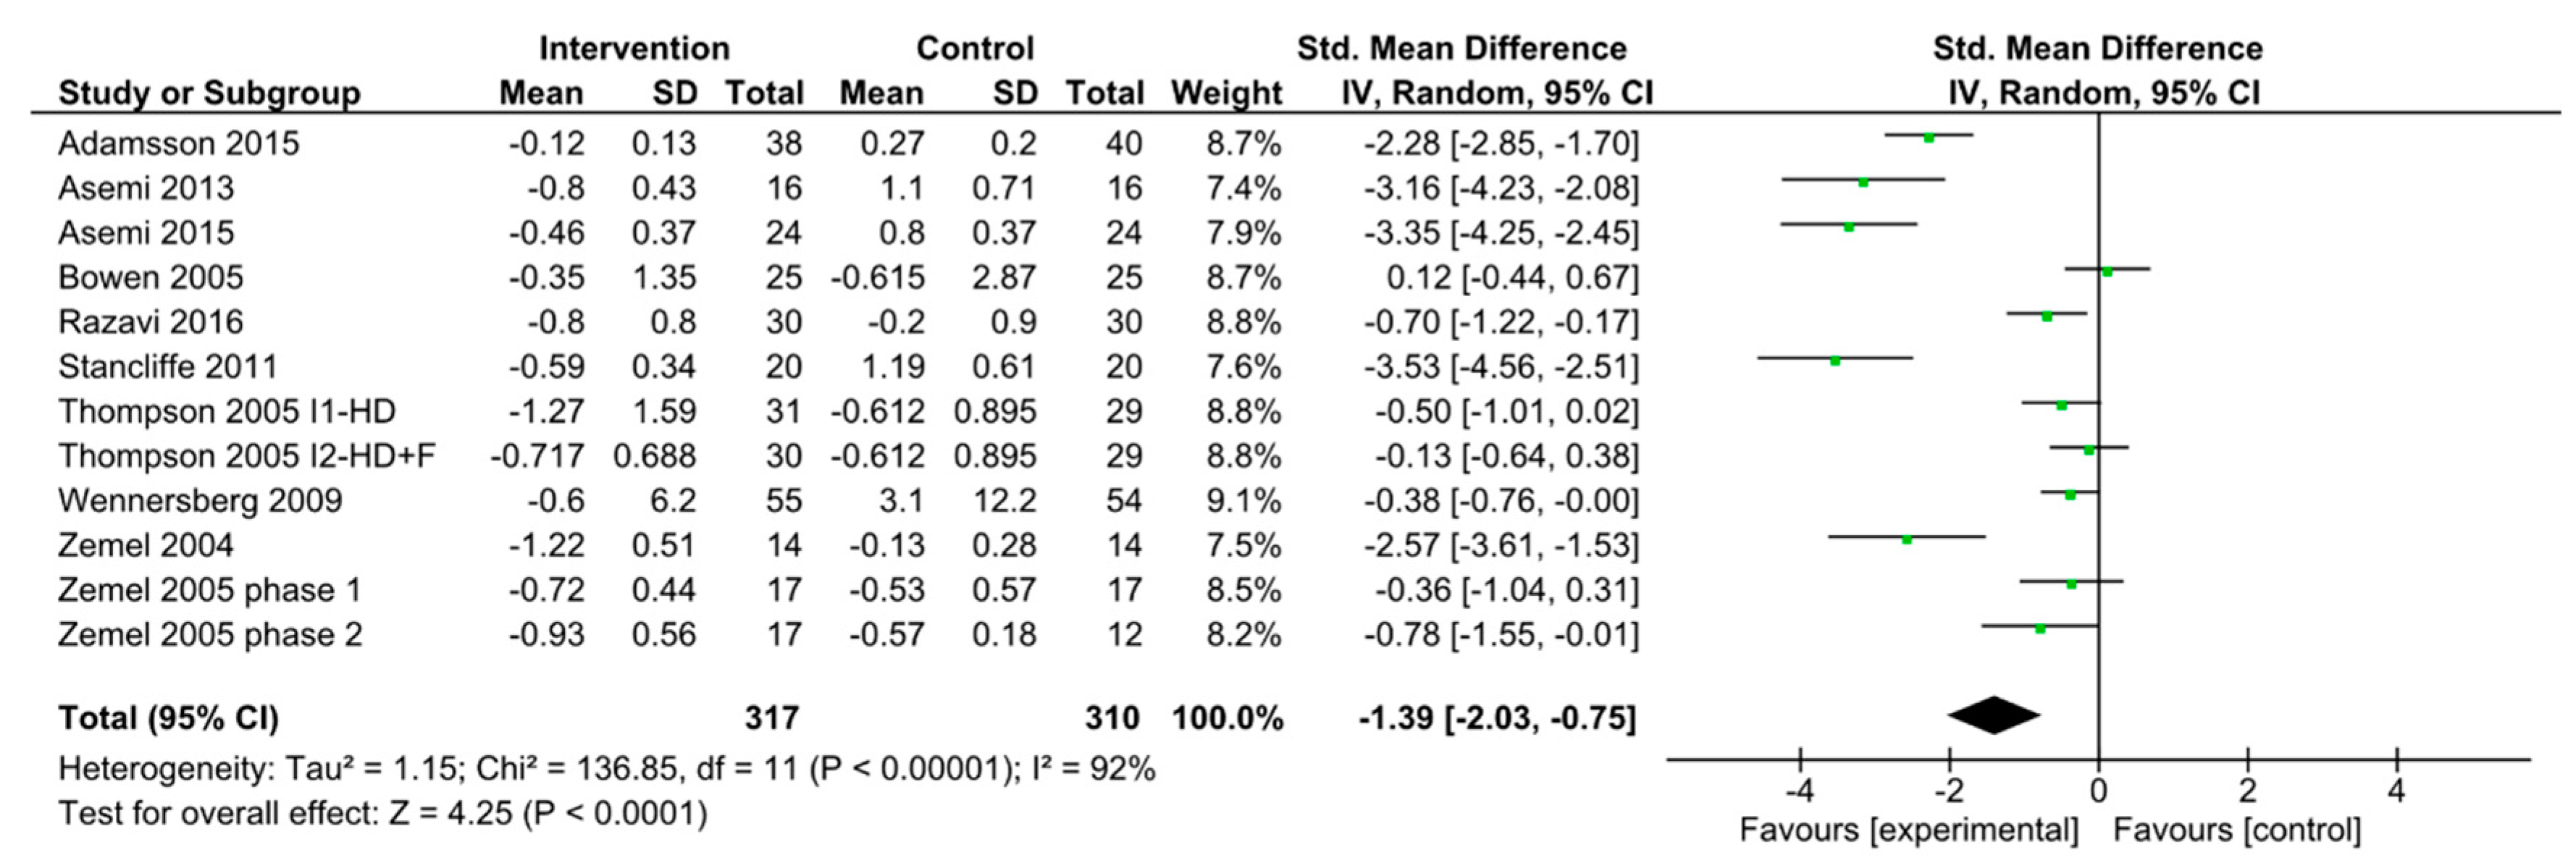
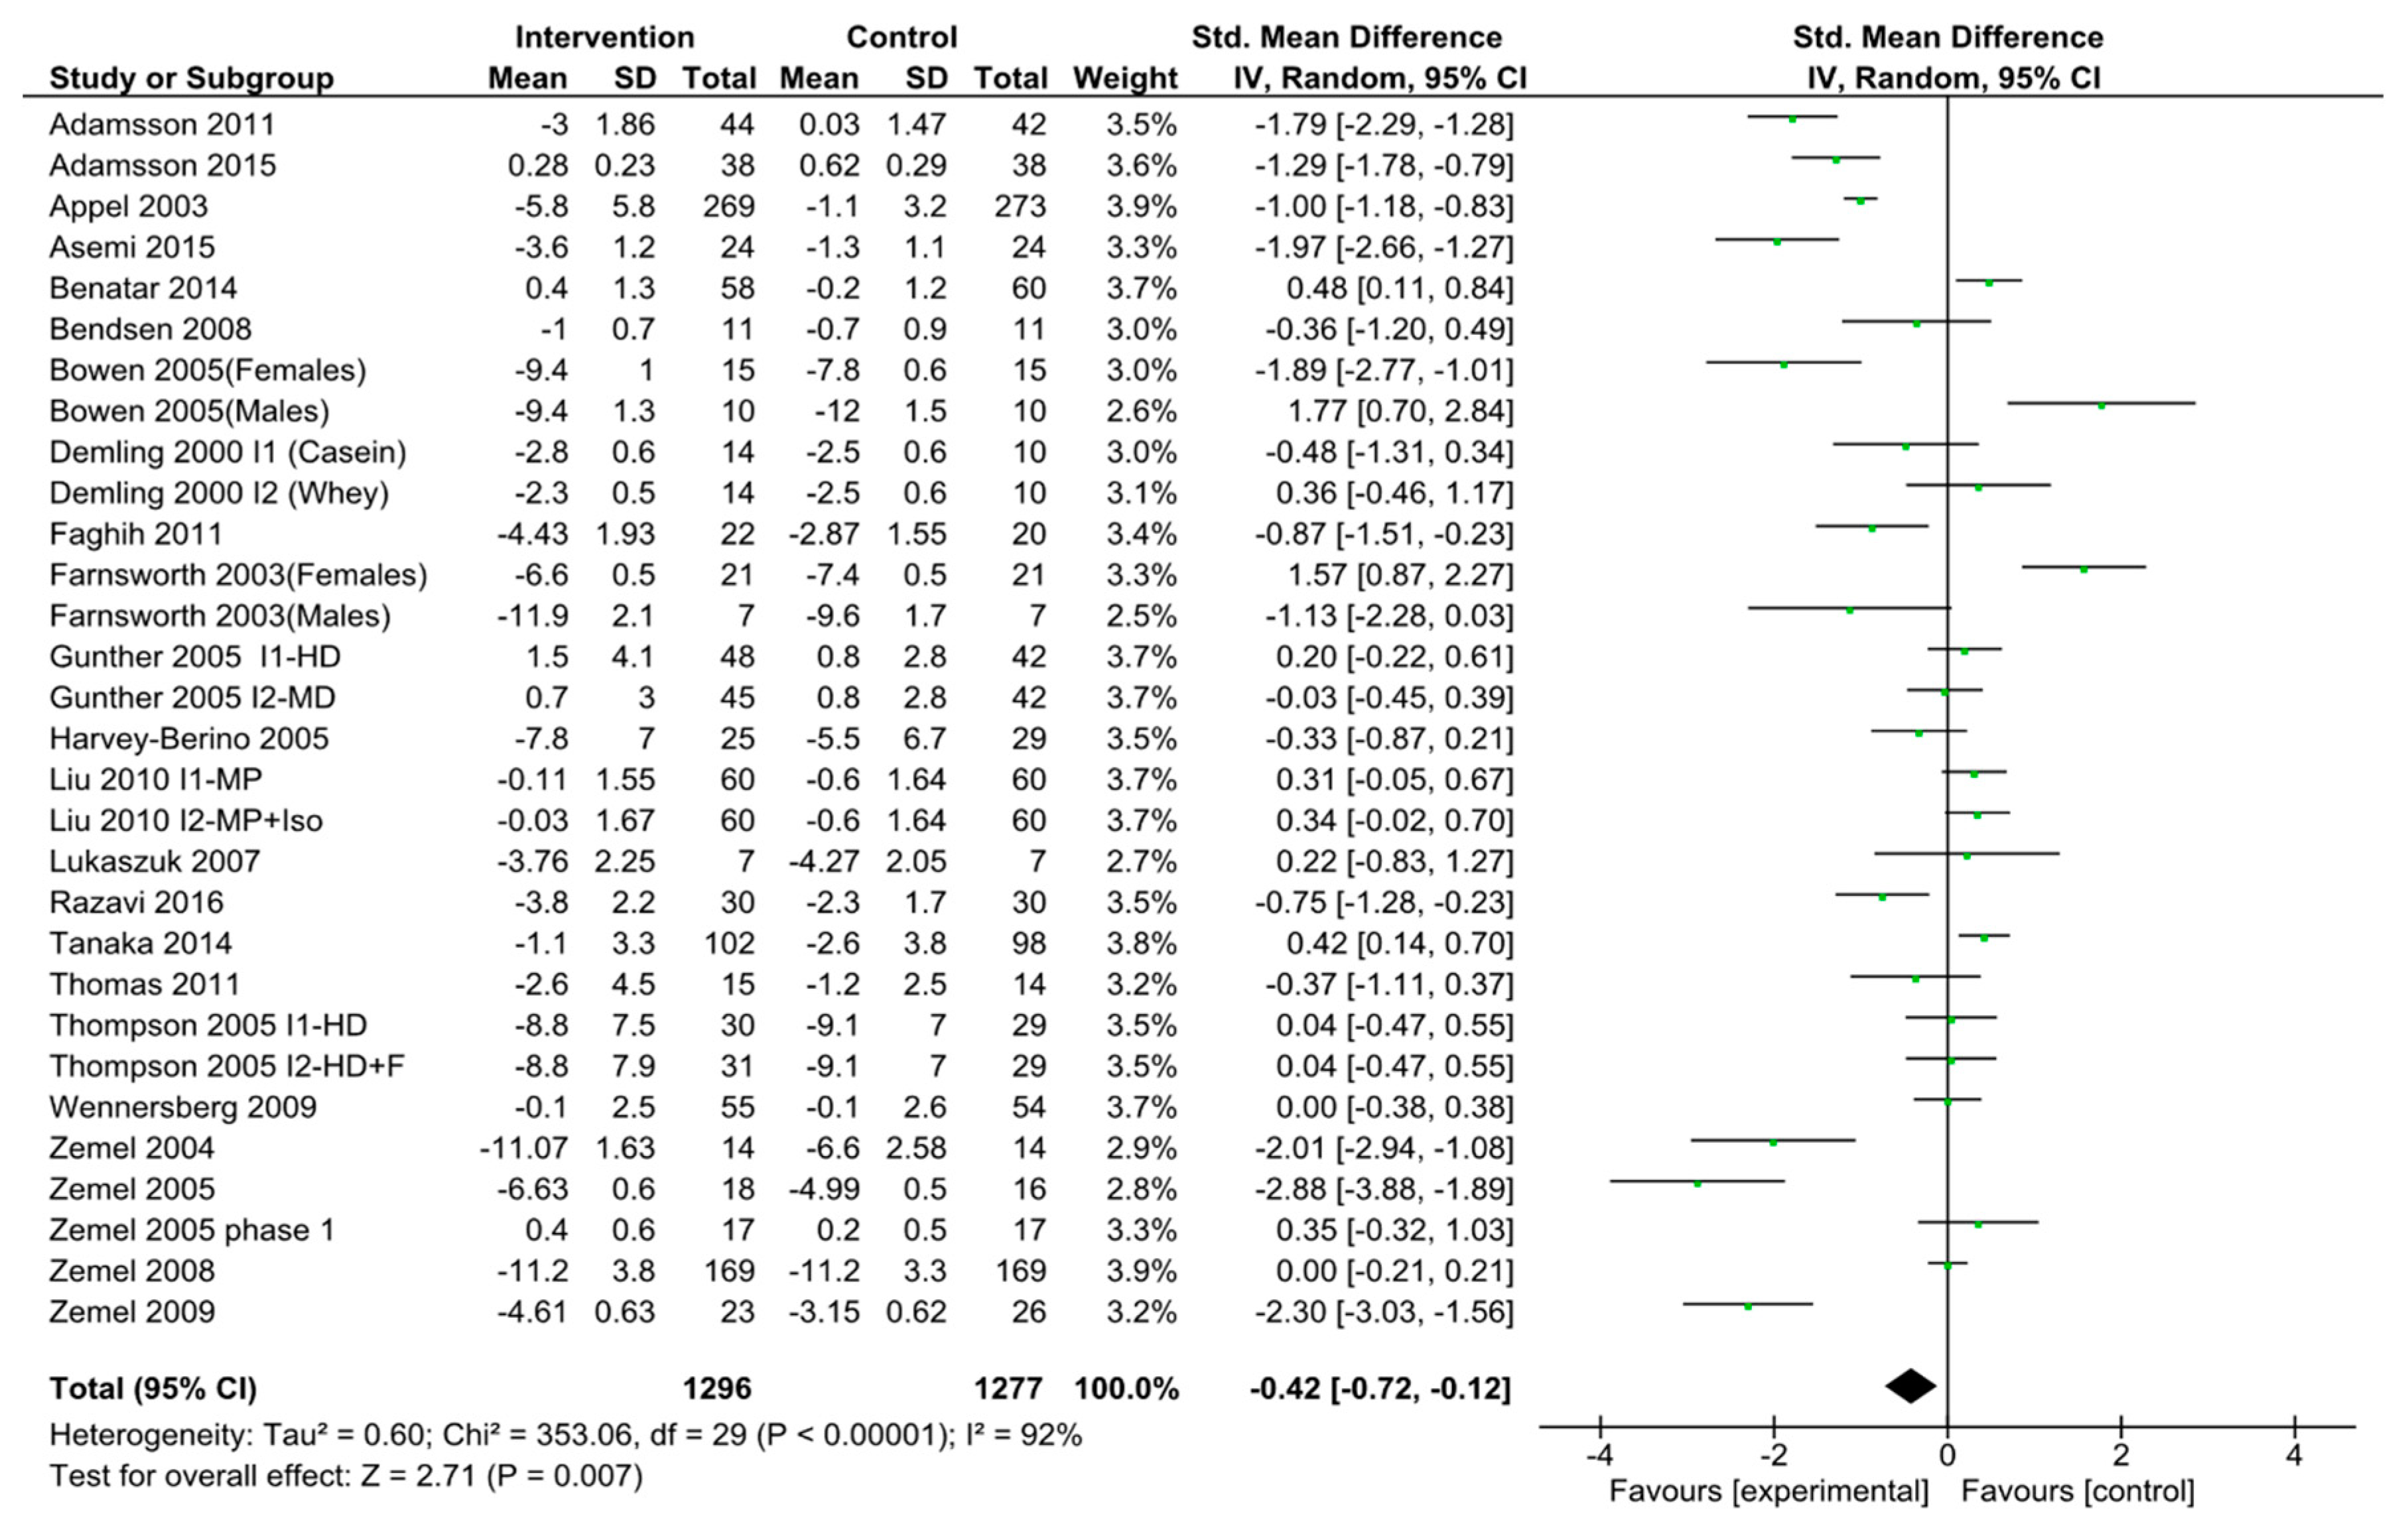
3.2. Dairy Intake and HOMA-IR
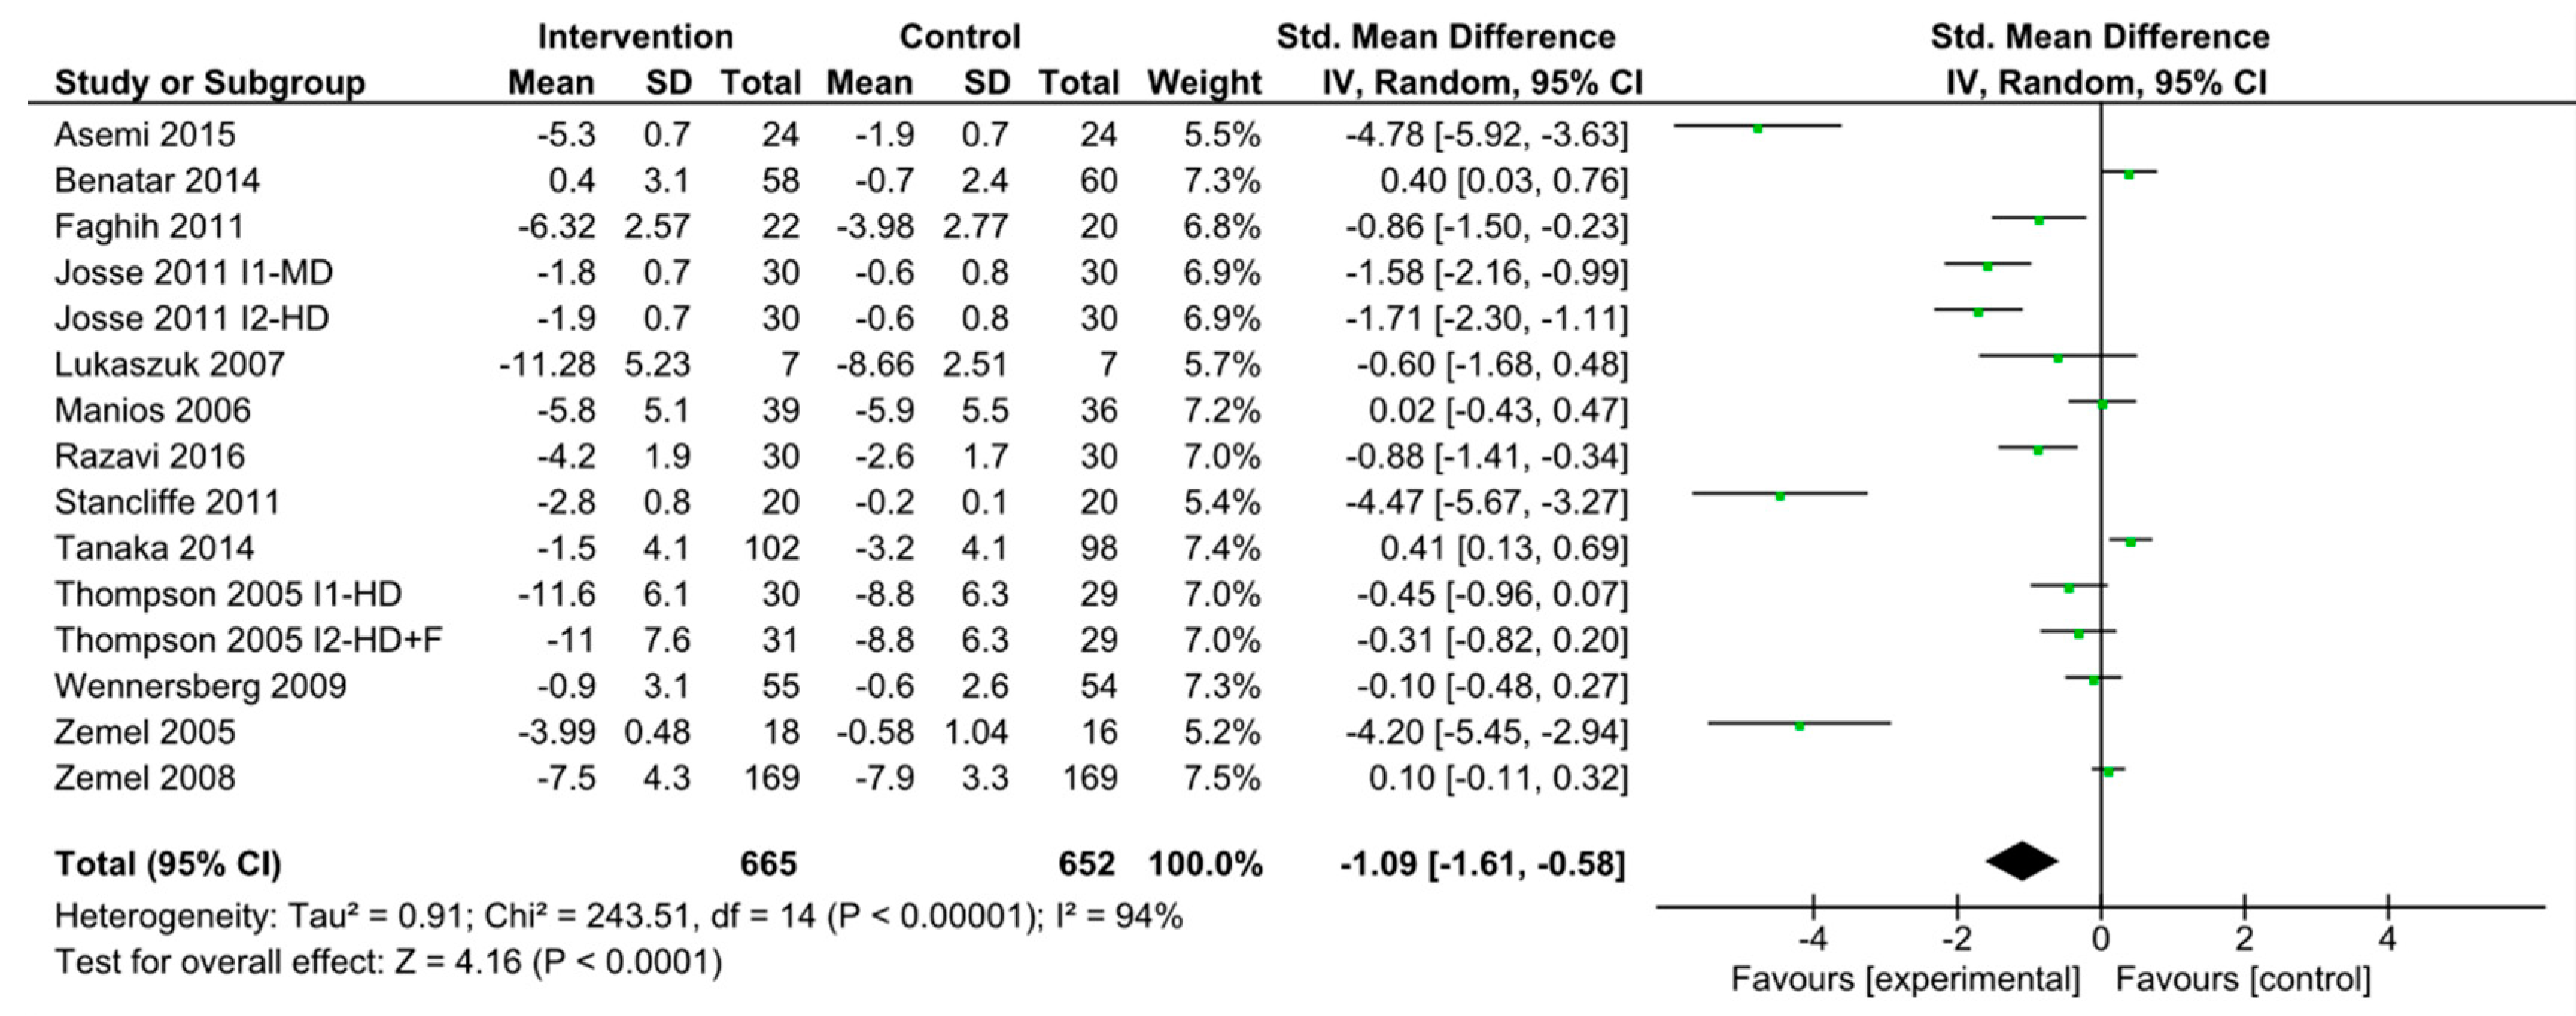
3.3. Dairy Intake and Waist Circumference
3.4. Dairy Intake and Body Weight
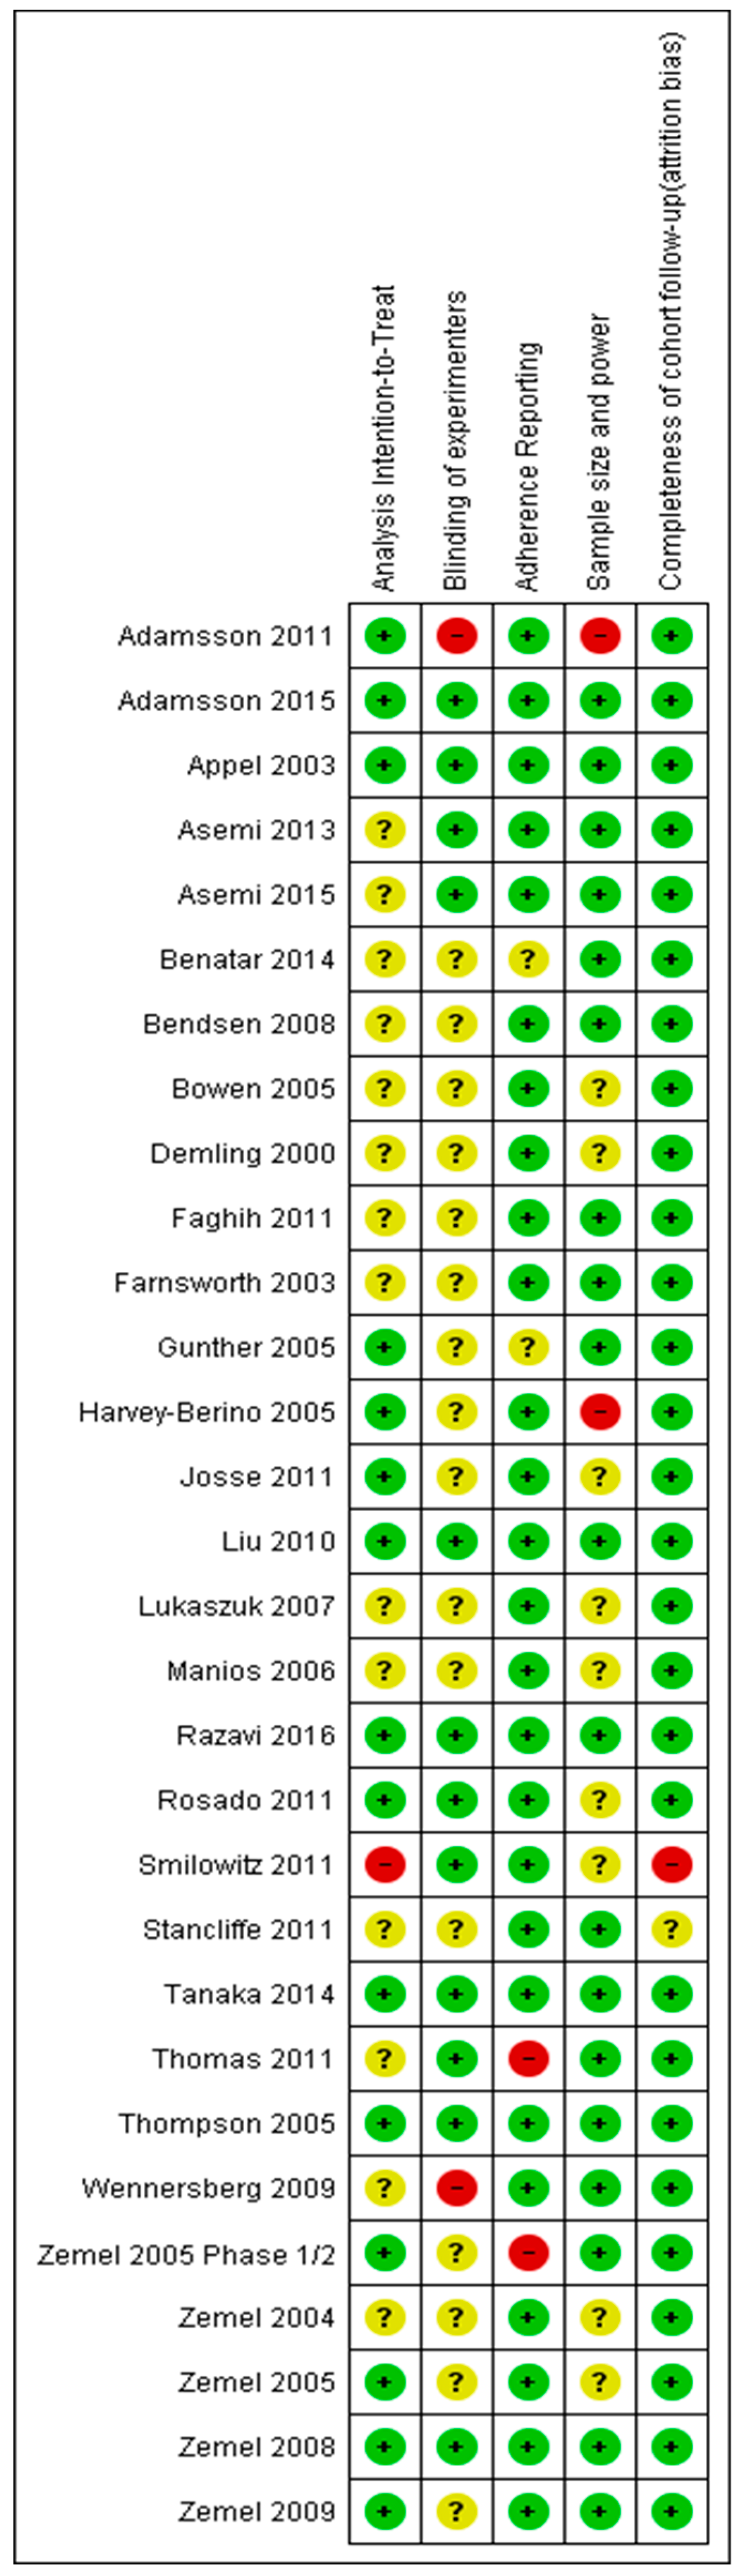
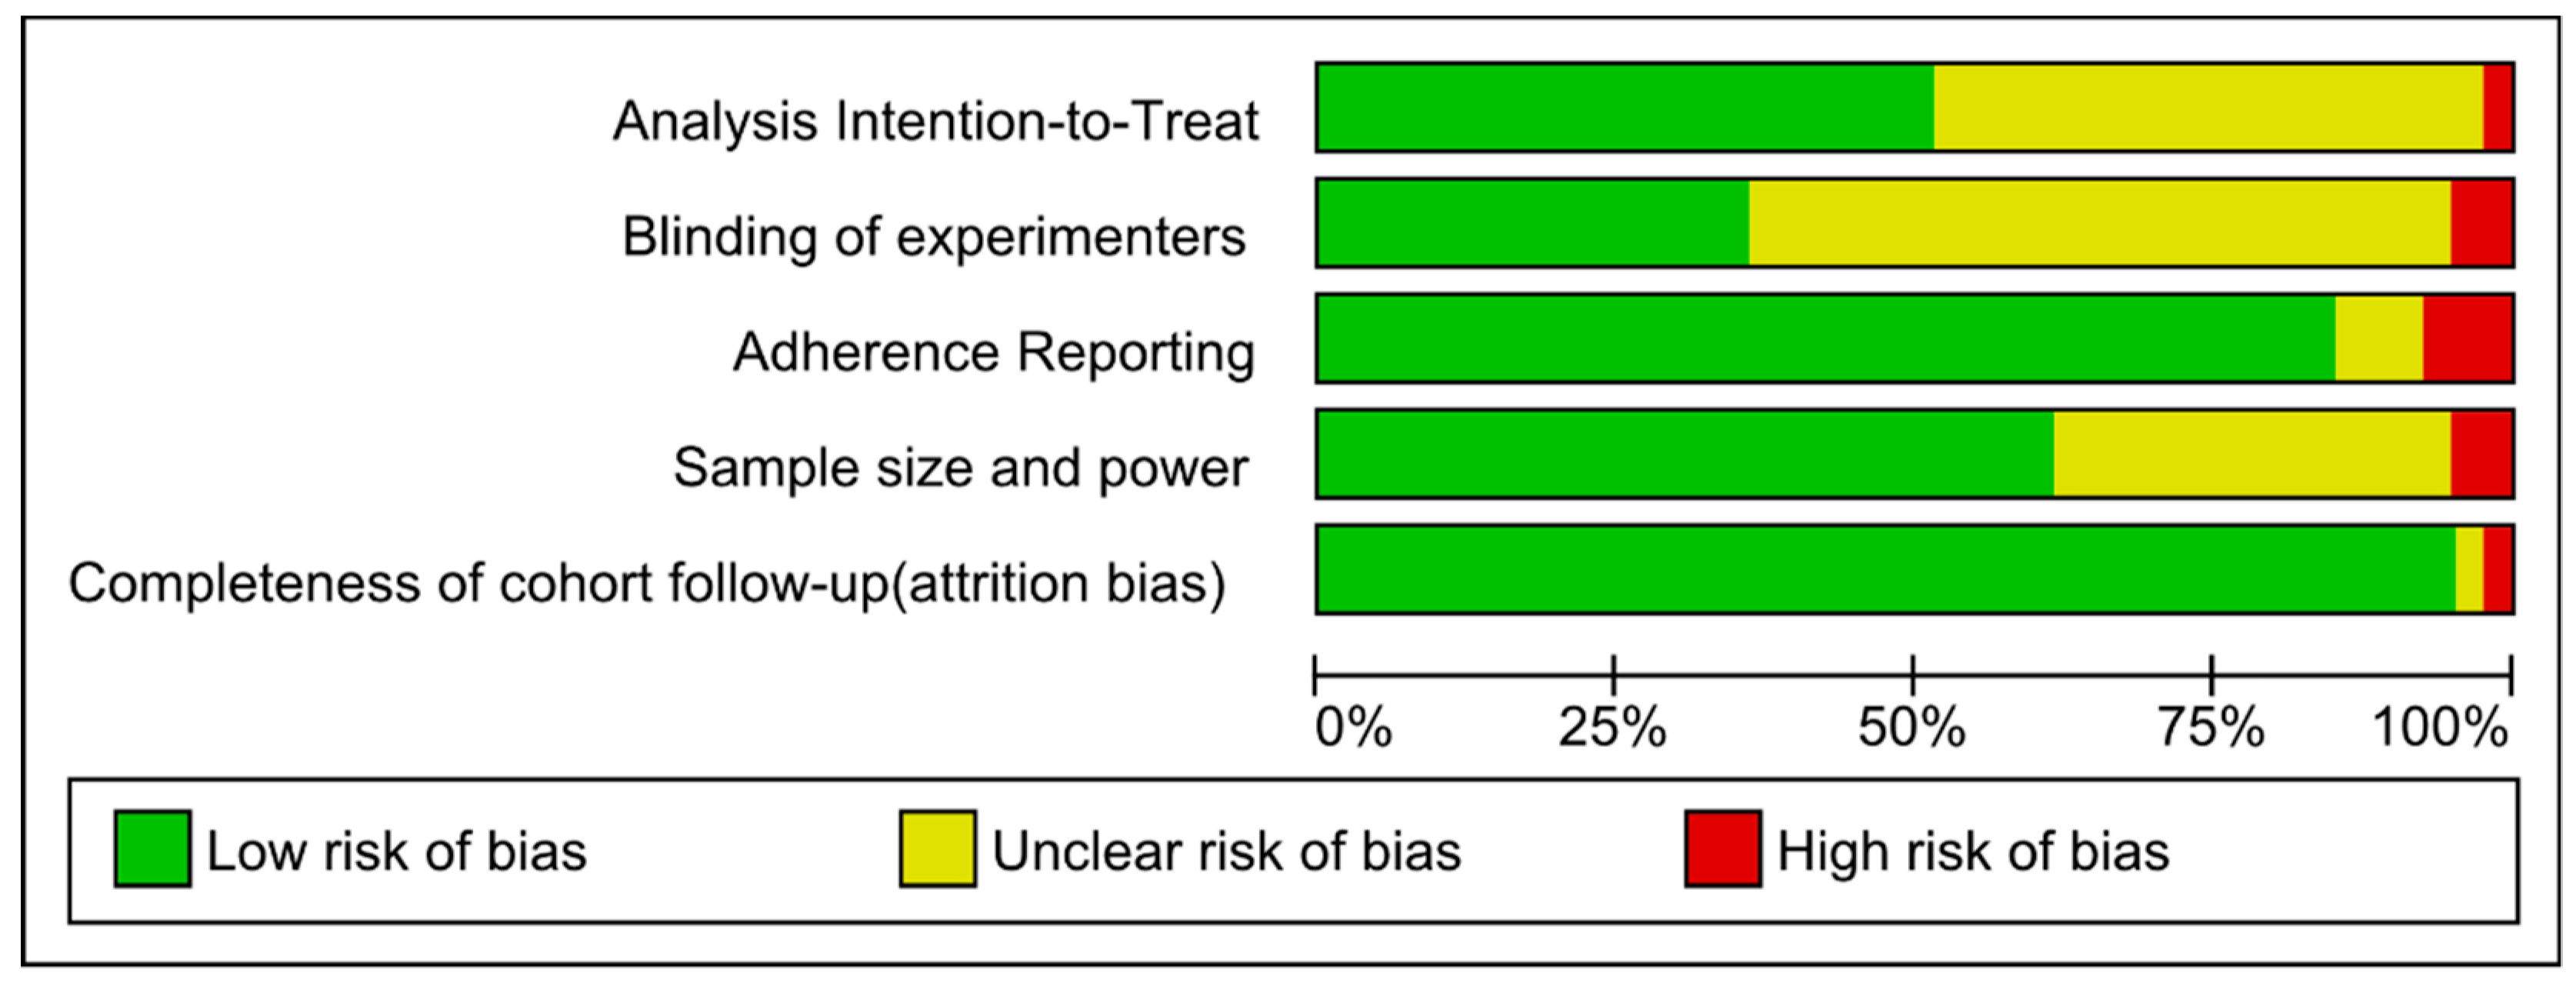
3.5. Risk of Bias
3.6. Publication Bias
3.7. Sensitivity Analyses
4. Discussion
5. Conclusions
Supplementary Materials
Author Contributions
Funding
Acknowledgments
Conflicts of Interest
References
- Chatterjee, S.; Khunti, K.; Davies, M.J. Type 2 diabetes. Lancet 2017, 389, 2239–2251. [Google Scholar] [CrossRef]
- Gojka, R. WHO Global report on diabetes: A summary. Int. J. Noncommun. Dis. 2016, 1, 3–8. [Google Scholar]
- Frayn, K.N.; Tan, G.D.; Karpe, F. Adipose tissue: A key target for diabetes pathophysiology and treatment? Horm. Metab. Res. 2007, 39, 739–742. [Google Scholar] [CrossRef]
- International Diabetes Federation. IDF Diabetes Atlas, 4th ed.; International Diabetes Federation: Brussels, Belgium, 2009. [Google Scholar]
- Benjamin, S.M.; Valdez, R.; Geiss, L.S.; Rolka, D.B.; Narayan, K.M. Estimated number of adults with prediabetes in the US in 2000: Opportunities for prevention. Diabetes Care 2003, 26, 645–649. [Google Scholar] [CrossRef] [PubMed]
- Papakonstantinou, E.; Flatt, W.P.; Huth, P.J.; Harris, B.R. High dietary calcium reduces body fat content, digestibility of fat, and serum vitamin D in rats. Obes. Res. 2003, 11, 387–394. [Google Scholar] [CrossRef] [PubMed]
- Shi, H.; Dirienzo, D.; Zemel, M.B. Effects of dietary calcium on adipocyte lipid metabolism and body weight regulation in energy-restricted aP2-agouti transgenic mice. FASEB J. 2001, 15, 291–293. [Google Scholar] [CrossRef] [PubMed]
- Zemel, M.B.; Shi, H.; Greer, B.; Dirienzo, D.; Zemel, P.C. Regulation of adiposity by dietary calcium. FASEB J. 2000, 14, 1132–1138. [Google Scholar] [CrossRef] [PubMed]
- Geng, T.; Qi, L.; Huang, T. Effects of Dairy Products Consumption on Body Weight and Body Composition Among Adults: An Updated Meta-Analysis of 37 Randomized Control Trials. Mol. Nutr. Food Res. 2018, 62. [Google Scholar] [CrossRef]
- Gijsbers, L.; Ding, E.L.; Malik, V.S.; de Goede, J.; Geleijnse, J.M.; Soedamah-Muthu, S.S. Consumption of dairy foods and diabetes incidence: A dose-response meta-analysis of observational studies. Am. J. Clin Nutr. 2016, 103, 1111–1124. [Google Scholar] [CrossRef]
- Schwingshackl, L.; Hoffmann, G.; Lampousi, A.M.; Knuppel, S.; Iqbal, K.; Schwedhelm, C.; Bechthold, A.; Schlesinger, S.; Boeing, H. Food groups and risk of type 2 diabetes mellitus: A systematic review and meta-analysis of prospective studies. Eur. J. Epidemiol. 2017, 32, 363–375. [Google Scholar] [CrossRef]
- Talaei, M.; Pan, A.; Yuan, J.M.; Koh, W.P. Dairy intake and risk of type 2 diabetes. Clin. Nutr. 2018, 37, 712–718. [Google Scholar] [CrossRef] [PubMed]
- Brouwer-Brolsma, E.M.; van Woudenbergh, G.J.; Elferink, S.J.O.; Singh-Povel, C.M.; Hofman, A.; Dehghan, A.; Franco, O.H.; Feskens, E.J. Intake of different types of dairy and its prospective association with risk of type 2 diabetes: The Rotterdam Study. Nutr. Metab. Cardiovasc. Dis. 2016, 26, 987–995. [Google Scholar] [CrossRef] [PubMed]
- Hruby, A.; Ma, J.; Rogers, G.; Meigs, J.B.; Jacques, P.F. Associations of Dairy Intake with Incident Prediabetes or Diabetes in Middle-Aged Adults Vary by Both Dairy Type and Glycemic Status. J. Nutr. 2017, 147, 1764–1775. [Google Scholar] [CrossRef] [PubMed]
- Mitri, J.; Muraru, M.D.; Pittas, A.G. Vitamin D and type 2 diabetes: A systematic review. Eur. J. Clin. Nutr. 2011, 65, 1005–1015. [Google Scholar] [CrossRef] [PubMed]
- Pittas, A.G.; Lau, J.; Hu, F.B.; Dawson-Hughes, B. The role of vitamin D and calcium in type 2 diabetes. A systematic review and meta-analysis. J. Clin. Endocrinol. Metab. 2007, 92, 2017–2029. [Google Scholar] [CrossRef]
- Seida, C.J.; Mitri, J.; Colmers, I.N.; Majumdar, S.R.; Davidson, M.B.; Edwards, A.L.; Hanley, D.A.; Pittas, A.G.; Tjosvold, L.; Johnson, J.A. Clinical review: Effect of vitamin D3 supplementation on improving glucose homeostasis and preventing diabetes: A systematic review and meta-analysis. J. Clin. Endocrinol. Metab. 2014, 99, 3551–3560. [Google Scholar] [CrossRef] [PubMed]
- Begg, B.C.; Mazumdar, M. Operating characteristics of a rank correlation test for publication bias. Biometrics 1994, 50, 1088–1101. [Google Scholar] [CrossRef]
- DerSimonian, R.; Laird, N. Meta-analysis in clinical trials. Control. Clin. Trials 1986, 7, 177–188. [Google Scholar] [CrossRef]
- Cochran, W.G.; Cox, G.M. Experimental Design, 2nd ed.; John Wiley and Sons: New York, NY, USA, 1957; p. 615. [Google Scholar]
- Anderson, J.W.; Hoie, L.H. Weight loss and lipid changes with low-energy diets: Comparator study of milk-based versus soy-based liquid meal replacement interventions. J. Am. College Nutri. 2005, 210–216. [Google Scholar] [CrossRef]
- Lau, E.M.; Woo, J.; Lam, V.; Hong, A. Milk supplementation of the diet of postmenopausal Chinese women on a low calcium intake retards bone loss. J. Bone Miner. Res. 2001, 16, 1704–1709. [Google Scholar] [CrossRef]
- Chee, W.S.; Suriah, A.R.; Chan, S.P.; Zaitun, Y.; Chan, Y.M. The effect of milk supplementation on bone mineral density in postmenopausal Chinese women in Malaysia. Osteoporos. Int. 2003, 14, 828–834. [Google Scholar] [CrossRef] [PubMed]
- Sirtori, C.R.; Pazzucconi, F.; Colombo, L.; Battistin, P.; Bondioli, A.; Descheemaeker, K. Double-blind study of the addition of high-protein soya milk v. cows’ milk to the diet of patients with severe hypercholesterolaemia and resistance to or intolerance of statins. Br. J. Nutr. 1999, 82, 91–96. [Google Scholar] [CrossRef] [PubMed]
- Wagner, G.; Kindrick, S.; Hertzler, S.; DiSilvestro, R.A. Effects of various forms of calcium on body weight and bone turnover markers in women participating in a weight loss program. J. Am. Coll. Nutr. 2007, 26, 456–461. [Google Scholar] [CrossRef] [PubMed]
- Azadbakht, L.; Mirmiran, P.; Esmaillzadeh, A.; Azizi, T.; Azizi, F. Beneficial effects of a Dietary Approaches to Stop Hypertension eating plan on features of the metabolic syndrome. Diabetes Care 2005, 28, 2823–2831. [Google Scholar] [CrossRef] [PubMed]
- Barr, S.I.; McCarron, D.A.; Heaney, R.P.; Dawson-Hughes, B.; Berga, S.L.; Stern, J.S.; Oparil, S. Effects of increased consumption of fluid milk on energy and nutrient intake, body weight, and cardiovascular risk factors in healthy older adults. J. Am. Diet. Assoc. 2000, 100, 810–817. [Google Scholar] [CrossRef]
- Agrawal, R.P.; Jain, S.; Shah, S.; Chopra, A.; Agarwal, V. Effect of camel milk on glycemic control and insulin requirement in patients with type 1 diabetes: 2-years randomized controlled trial. Eur. J. Clin. Nutr. 2011, 65, 1048–1052. [Google Scholar] [CrossRef] [PubMed] [Green Version]
- Buchowski, M.S.; Aslam, M.; Dossett, C.; Dorminy, C.; Choi, L.; Acra, S. Effect of dairy and non-dairy calcium on fecal fat excretion in lactose digester and maldigester obese adults. Int J. Obes. (Lond) 2010, 34, 127–135. [Google Scholar] [CrossRef] [PubMed]
- Dugan, C.E.; Barona, J.; Fernandez, M.L. Increased dairy consumption differentially improves metabolic syndrome markers in male and female adults. Metab. Syndr. Relat. Disord. 2014, 12, 62–69. [Google Scholar] [CrossRef]
- Liu, Z.; Qiu, L.; Chen, Y.M.; Su, Y.X. Effect of milk and calcium supplementation on bone density and bone turnover in pregnant Chinese women: A randomized controlled trail. Arch. Gynecol. Obstet. 2011, 283, 205–211. [Google Scholar] [CrossRef]
- Maki, K.C.; Nieman, K.M.; Schild, A.L.; Kaden, V.N.; Lawless, A.L.; Kelley, K.M.; Rains, T.M. Sugar-sweetened product consumption alters glucose homeostasis compared with dairy product consumption in men and women at risk of type 2 diabetes mellitus. J. Nutr. 2015, 145, 459–466. [Google Scholar] [CrossRef]
- Palacios, C.; Bertran, J.J.; Rios, R.E.; Soltero, S. No effects of low and high consumption of dairy products and calcium supplements on body composition and serum lipids in Puerto Rican obese adults. Nutrition 2011, 27, 520–525. [Google Scholar] [CrossRef] [PubMed] [Green Version]
- Rideout, T.C.; Marinangeli, C.P.; Martin, H.; Browne, R.W.; Rempel, C.B. Consumption of low-fat dairy foods for 6 months improves insulin resistance without adversely affecting lipids or bodyweight in healthy adults: A randomized free-living cross-over study. Nutr. J. 2013, 12, 56. [Google Scholar] [CrossRef] [PubMed]
- Van Meijl, L.E.; Mensink, R.P. Effects of low-fat dairy consumption on markers of low-grade systemic inflammation and endothelial function in overweight and obese subjects: An intervention study. Br. J. Nutr. 2010, 104, 1523–1527. [Google Scholar] [CrossRef] [PubMed]
- Al-Naggar, R.A.; O, M.T.; Abdulghani, M. Low Fat Yogurt Reduce Weight: Randomized Clinical Trial from Malaysia. Res. J. Pharm. Biol. Chem. Sci. 2014, 5, 593. [Google Scholar]
- Eagan, M.S.; Lyle, R.M.; Gunther, C.W.; Peacock, M.; Teegarden, D. Effect of 1-year dairy product intervention on fat mass in young women: 6-month follow-up. Obes. Obes. (Silver Spring) 2006, 14, 2242. [Google Scholar] [CrossRef]
- Alonso, A.; Zozaya, C.; Vazquez, Z.; Martinez, J.A.; Martinez-Gonzalez, M.A. The effect of low-fat versus whole-fat dairy product intake on blood pressure and weight in young normotensive adults. J. Hum. Nutr. Diet 2009, 22, 336–342. [Google Scholar] [CrossRef]
- Zemel, M.B.; X, S.; T, S.; B, W. Effects of dairy compared with soy on oxidative and inflammatory stress in overweight and obese subjects. Am. J. Clin. Nutr. 2010, 91, 16–22. [Google Scholar] [CrossRef] [PubMed]
- Adamsson, V.; Reumark, A.; Fredriksson, I.B.; Hammarstrom, E.; Vessby, B.; Johansson, G.; Riserus, U. Effects of a healthy Nordic diet on cardiovascular risk factors in hypercholesterolaemic subjects: A randomized controlled trial (NORDIET). J. Intern. Med. 2011, 269, 150–159. [Google Scholar] [CrossRef]
- Adamsson, V.; Reumark, A.; Marklund, M.; Larsson, A.; Riserus, U. Role of a prudent breakfast in improving cardiometabolic risk factors in subjects with hypercholesterolemia: A randomized controlled trial. Clin. Nutr. 2015, 34, 20–26. [Google Scholar] [CrossRef]
- Appel, L.J.; Champagne, C.M.; Harsha, D.W.; Cooper, L.S.; Obarzanek, E.; Elmer, P.J.; Stevens, V.J.; Vollmer, W.M.; Lin, P.H.; Svetkey, L.P. Effects comprehensive lifestyle modification blood pressure control: Main results the PREMIER clinical trial. JAMA 2003, 289, 2083–2093. [Google Scholar]
- Asemi, Z.; Samimi, M.; Tabassi, Z.; Sabihi, S.S.; Esmaillzadeh, A. A randomized controlled clinical trial investigating the effect of DASH diet on insulin resistance, inflammation, and oxidative stress in gestational diabetes. Nutrition 2013, 29, 619–624. [Google Scholar] [CrossRef] [PubMed]
- Asemi, Z.; Esmaillzadeh, A. DASH diet, insulin resistance, and serum hs-CRP in polycystic ovary syndrome: A randomized controlled clinical trial. Horm. Metab. Res. 2015, 47, 232–238. [Google Scholar] [CrossRef] [PubMed]
- Benatar, J.R.; Jones, E.; White, H.; Stewart, R.A. A randomized trial evaluating the effects of change in dairy food consumption on cardio-metabolic risk factors. Eur. J. Prev. Cardiol. 2014, 21, 1376–1386. [Google Scholar] [CrossRef] [PubMed]
- Bendsen, N.T.; Hother, A.L.; Jensen, S.K.; Lorenzen, J.K.; Astrup, A. Effect of dairy calcium on fecal fat excretion: A randomized crossover trial. Int. J. Obes. (Lond) 2008, 32, 1816–1824. [Google Scholar] [CrossRef] [PubMed]
- Bowen, J.; Noakes, M.; Clifton, P.M. Effect of calcium and dairy foods in high protein, energy-restricted diets on weight loss and metabolic parameters in overweight adults. Int J. Obes. (Lond) 2005, 29, 957–965. [Google Scholar] [CrossRef] [PubMed] [Green Version]
- Demling, R.H.; DeSanti, L. Effect of a hypocaloric diet, increased protein intake and resistance training on lean mass gains and fat mass loss in overweight police officers. Anna. Nutr. Metab. 2000, 44, 21–29. [Google Scholar] [CrossRef] [PubMed]
- Faghih, S.; Abadi, A.R.; Hedayati, M.; Kimiagar, S.M. Comparison of the effects of cows’ milk, fortified soy milk, and calcium supplement on weight and fat loss in premenopausal overweight and obese women. Nutr. Metab. Cardiovasc. Dis. 2011, 21, 499–503. [Google Scholar] [CrossRef]
- Farnsworth, E.; Luscombe, N.D.; Luscombe, N.D.; Noakes, M.; Wittert, G.; Argyiou, E.; Clifton, P.M. Effect of a high-protein, energy-restricted diet on body composition, glycemic control, and lipid concentrations in overweight and obese hyperinsulinemic men and women. Am. J. Clin. Nutr. 2003, 78, 31–39. [Google Scholar] [CrossRef] [Green Version]
- Gunther, C.W.; Legowski, P.A.; Lyle, R.M.; McCabe, G.P.; Eagan, M.S.; Peacock, M.; Teegarden, D. Dairy products do not lead to alterations in body weight or fat mass in young women in a 1-y intervention. Am. J. Clin. Nutr. 2005, 81, 751–756. [Google Scholar] [CrossRef]
- Harvey-Berino, J.; Gold, B.C.; Lauber, R.; Starinski, A. The impact of calcium and dairy product consumption on weight loss. Obes. Res. 2005, 13, 1720–1726. [Google Scholar] [CrossRef]
- Josse, A.R.; Atkinson, S.A.; Tarnopolsky, M.A.; Phillips, S.M. Increased consumption of dairy foods and protein during diet- and exercise-induced weight loss promotes fat mass loss and lean mass gain in overweight and obese premenopausal women. J. Nutr. 2011, 141, 1626–1634. [Google Scholar] [CrossRef] [PubMed]
- Liu, Z.M.; Chen, Y.M.; Ho, S.C.; Ho, Y.P.; Woo, J. Effects of soy protein and isoflavones on glycemic control and insulin sensitivity: A 6-mo double-blind, randomized, placebo-controlled trial in postmenopausal Chinese women with prediabetes or untreated early diabetes. Am. J. Clin. Nutr. 2010, 91, 1394–1401. [Google Scholar] [CrossRef] [PubMed]
- Lukaszuk, J.M.; Luebbers, P.; Gordon, B.A. Preliminary study: Soy milk as effective as skim milk in promoting weight loss. J. Am. Diet. Assoc. 2007, 107, 1811–1814. [Google Scholar] [CrossRef] [PubMed]
- Manios, Y.; Moschonis, G.; Grammatikaki, E.; Katsaroli, I.; Kanelou, P.; Tanagra, S. Nutrition education in postmenopausal women: Changes in dietary and cardiovascular indices. Maturitas 2006, 55, 338–347. [Google Scholar] [CrossRef] [PubMed]
- Razavi Zade, M.; Telkabadi, M.H.; Bahmani, F.; Salehi, B.; Farshbaf, S.; Asemi, Z. The effects of DASH diet on weight loss and metabolic status in adults with non-alcoholic fatty liver disease: A randomized clinical trial. Liver Int. 2016, 36, 563–571. [Google Scholar] [CrossRef]
- Rosado, J.L.; Garcia, O.P.; Ronquillo, D.; Hervert-Hernandez, D.; Mdel, C.C.; Martinez, G.; Gutierrez, J.; Garcia, S. Intake of milk with added micronutrients increases the effectiveness of an energy-restricted diet to reduce body weight: A randomized controlled clinical trial in Mexican women. J. Am. Diet. Assoc. 2011, 111, 1507–1516. [Google Scholar] [CrossRef]
- Smilowitz, J.T.; Wiest, M.M.; Teegarden, D.; Zemel, M.B.; German, J.B.; van Loan, M.D. Dietary fat and not calcium supplementation or dairy product consumption is associated with changes in anthropometrics during a randomized, placebo-controlled energy-restriction trial. Nutr. Metab. (Lond) 2011, 8, 67. [Google Scholar] [CrossRef]
- Stancliffe, R.A.; Thorpe, T.; Zemel, M.B. Dairy attentuates oxidative and inflammatory stress in metabolic syndrome. Am. J. Clin. Nutr. 2011, 94, 422–430. [Google Scholar] [CrossRef] [Green Version]
- Tanaka, S.; Uenishi, K.; Ishida, H.; Takami, Y.; Hosoi, T.; Kadowaki, T.; Orimo, H.; Ohashi, Y. A randomized intervention trial of 24-wk dairy consumption on waist circumference, blood pressure, and fasting blood sugar and lipids in Japanese men with metabolic syndrome. J. Nutr. Sci. Vitam. (Tokyo) 2014, 60, 305–312. [Google Scholar] [CrossRef]
- Thomas, D.T.; Wideman, L.; Lovelady, C.A. Effects of a dairy supplement and resistance training on lean mass and insulin-like growth factor in women. Int. J. Sport Nutr. Exerc. Metab. 2011, 21, 181–188. [Google Scholar] [CrossRef]
- Thompson, W.G.; Holdman, N.R.; Janzow, D.J.; Slezak, J.M.; Morris, K.L.; Zemel, M.B. Effect of energy-reduced diets high in dairy products and fiber on weight loss in obese adults. Obes. Res. 2005, 13, 1344–1353. [Google Scholar] [CrossRef] [PubMed]
- Wennersberg, M.H.; Smedman, A.; Turpeinen, A.M.; Retterstøl, K.; Tengblad, S.; Lipre, E.; Aro, A.; Mutanen, P.; Seljeflot, I.; Basu, S.; et al. Dairy products and metabolic effects in overweight men and women: Results from a 6-mo intervention study. Am. J. Clin. Nutr. 2009, 90, 960–968. [Google Scholar] [CrossRef] [PubMed]
- Zemel, M.B.; Thompson, W.; Milstead, A.; Morris, K.; Campbell, P. Calcium and dairy acceleration of weight and fat loss during energy restriction in obese adults. Obes. Res. 2004, 12, 582–590. [Google Scholar] [CrossRef] [PubMed]
- Zemel, M.B.; Richards, J.; Milstead, A.; Campbell, P. Effects of calcium and dairy on body composition and weight loss in African-American adults. Obes. Res. 2005, 13, 1218–1225. [Google Scholar] [CrossRef] [PubMed]
- Zemel, M.B.; Richards, J.; Mathis, S.; Milstead, A.; Gebhardt, L.; Silva, E. Dairy augmentation of total and central fat loss in obese subjects. Int. J. Obes. 2005, 29, 391–397. [Google Scholar] [CrossRef] [Green Version]
- Zemel, M.B.; Donnelly, J.E.; Smith, B.K.; Sullivan, D.K.; Richards, J.; Morgan-Hanusa, D.; Mayo, M.S.; Sun, X.; Cook-Wiens, G.; Bailey, B.W.; et al. Effects of dairy intake on weight maintenance. Nutr. Metab. (Lond) 2008, 5. [Google Scholar] [CrossRef]
- Zemel, M.B.; Teegarden, D.; Loan, M.V.; Schoeller, D.A.; Matkovic, V.; Lyle, R.M.; Craig, B.A. Dairy-rich diets augment fat loss on an energy-restricted diet: A multicenter trial. Nutrients 2009, 1, 83–100. [Google Scholar] [CrossRef]
- Wahrenberg, H.; Hertel, K.; Leijonhufvud, B.M.; Persson, L.G.; Toft, E.; Arner, P. Use of waist circumference to predict insulin resistance: Retrospective study. BMJ 2005, 330, 1363–1364. [Google Scholar] [CrossRef]
- Racette, S.B.; Evans, E.M.; Weiss, E.P.; Hagberg, J.M.; Holloszy, J.O. Abdominal adiposity is a stronger predictor of insulin resistance than fitness among 50–95 year olds. Diabetes Care 2006, 29, 673–678. [Google Scholar] [CrossRef]
- Asemi, Z.; Samimi, M.; Tabassi, Z.; Shakeri, H.; Sabihi, S.S.; Esmaillzadeh, A. Effects of DASH diet on lipid profiles and biomarkers of oxidative stress in overweight and obese women with polycystic ovary syndrome: A randomized clinical trial. Nutrition 2014, 30, 1287–1293. [Google Scholar] [CrossRef]
- Jones, B.H.; Kim, J.H.; Zemel, M.B.; Woychik, R.P.; Michaud, E.J.; Wilkison, W.O.; Moustaid, N. Upregulation of adipocyte metabo- lism by agouti protein: Possible paracrine actions in yellow mouse obesity. Am. J. Physiol. 1996, 270, E192–E196. [Google Scholar] [PubMed]
- Bonora, E.; Targher, G.; Alberiche, M.; Bonadonna, R.C.; Saggiani, F.; Zenere, M.B.; Monauni, T.; Muggeo, M. Homeostasis model assessment closely mirrors the glucose clamp technique in the assessment of insulin sensitivity: Studies in subjects with various degrees of glucose tolerance and insulin sensitivity. Diabetes Care 2000, 23, 57–63. [Google Scholar] [CrossRef] [PubMed]
- Bonora, E.; Kiechl, S.; Willeit, J.; Oberhollenzer, F.; Egger, G.; Meigs, J.B.; Bonadonna, R.C.; Muggeo, M. Insulin resistance as estimated by homeostasis model assessment predicts incident symptomatic cardiovascular disease in caucasian subjects from the general population: The Bruneck study. Diabetes Care 2007, 30, 318–324. [Google Scholar] [CrossRef] [PubMed]
- Després, J.P.; Lemieux, I. Abdominal obesity and metabolic syndrome. Nature 2006, 444, 881–887. [Google Scholar]
- Claycombe, K.J.; Wang, Y.; Jones, B.H.; Kim, S.; Wilkison, W.O.; Zemel, M.B.; Chun, J.; Moustaid-Moussa, N. Transcriptional regulation of the adipocyte fatty acid synthase gene by agouti: Interaction with insulin. Physiol. Geniomics. 2000, 3, 157–162. [Google Scholar] [CrossRef] [PubMed]
- Zemel, M. Nutritional and endocrine modulation of intracellular calcium. Implications in obesity, insulin resistance and hypertension. Mol. Cell Biochem. 1998, 188, 129–136. [Google Scholar] [CrossRef] [PubMed]
- Xue, B.; Greenberg, A.G.; Kraemer, F.B.; Zemel, M.B. Mechanism of intracellular calcium ([Ca2+]i) inhibition of lipolysis in human adipocytes. FASEB J. 2001, 15, 2527–2529. [Google Scholar] [CrossRef]
- Sun, X.Z.M. Role of uncoupling protein 2 (UCP2) expression and 1alpha, 25-dihydroxyvitamin D3 in modulating adipocyte apoptosis. FASEB J. 2004, 18, 1430–1432. [Google Scholar] [CrossRef]
- Bland, R.; Markovic, D.; Hills, C.E.; Hughes, S.V.; Chan, S.L.; Squires, P.E.; Hewison, M. Expression of 25-hydroxyvitamin D3–1alpha-hydroxylase in pancreatic islets. J. Steroid Biochem. Mol. Biol. 2004, 89–90, 121–125. [Google Scholar] [CrossRef]
- Jacobsen, R.; Lorenzen, J.K.; Toubro, S.; Krog-Mikkelsen, I.; Astrup, A. Effect of short-term high dietary calcium intake on 24-h energy expenditure, fat oxidation, and fecal fat excretion. Int J. Obes. (Lond) 2005, 29, 292–301. [Google Scholar] [CrossRef] [Green Version]
- Billaudel, B.J.; Faure, A.G.; Sutter, B.C. Effect of 1,25 dihydroxyvitamin D3 on isolated islets from vitamin D3-deprived rats. Am. J. Physiol. 1990, 258, E643–648. [Google Scholar] [CrossRef] [PubMed]
- Zehnder, D.; Bland, R.; Williams, M.C.; McNinch, R.W.; Howie, A.J.; Stewart, P.M.; Hewison, M. Extrarenal expression of 25-hydroxyvitamin d(3)-1 alpha-hydroxylase. J. Clin. Endocrinol. Metab. 2001, 86, 888–894. [Google Scholar] [PubMed]
- Welberg, J.W.; Monkelbaan, J.F.; de Vries, E.G.; Muskiet, F.A.; Cats, A.; Oremus, E.T.; Boersma-van Ek, W.; van Rijsbergen, H.; van der Meer, R.; Mulder, N.H.; et al. Effects of supplemental dietary calcium on quantitative and qualitative fecal fat excretion in man. Ann. Nutr. Metab. 1994, 38, 185–191. [Google Scholar] [CrossRef] [PubMed]
- Maestro, B.; Campión, J.; Dávila, N.; Calle, C. Stimulation by 1,25-dihydroxyvitamin D3 of insulin receptor expression and insulin responsiveness for glucose transport in U-937 human promonocytic cells. Endocr. J. 2000, 47, 383–391. [Google Scholar] [CrossRef] [PubMed]
- Zeitz, U.; Weber, K.; Soegiarto, D.W.; Wolf, E.; Balling, R.; Erben, R.G. Impaired insulin secretory capacity in mice lacking a functional vitamin D receptor. FASEB J. 2003, 17, 509–511. [Google Scholar] [CrossRef] [PubMed]
- Bourlon, P.M.; Billaudel, B.; Faure-Dussert, A. Influence of vitamin D3 deficiency and 1,25 dihydroxyvitamin D3 on de novo insulin biosynthesis in the islets of the rat endocrine pancreas. J. Endocrinol. 1999, 160, 87–95. [Google Scholar] [CrossRef] [PubMed] [Green Version]
- Sarathy, H.; Pramanik, V.; Kahn, J.; Abramowitz, M.K.; Meier, K.; Kishore, P.; Melamed, M.L. The effects of short-term vitamin D supplementation on glucose metabolism in dialysis patients: A systematic review and meta-analysis. Int. Urol. Nephrol. 2015, 47, 537–549. [Google Scholar] [CrossRef]
- Timms, P.M.; Mannan, N.; Hitman, G.A.; Noonan, K.; Mills, P.G.; Syndercombe-Court, D.; Aganna, E.; Price, C.P.; Boucher, B.J. Circulating MMP9, vitamin D and variation in the TIMP-1 response with VDR genotype: Mechanisms for inflammatory damage in chronic disorders? QJM 2002, 95, 787–796. [Google Scholar] [CrossRef]
- Pittas, A.G.; Mannan, N.; Hitman, G.A.; Noonan, K.; Mills, P.G.; Syndercombe-Court, D.; Aganna, E.; Price, C.P.; Boucher, B.J. The effects of calcium and vitamin D supplementation on blood glucose and markers of inflammation in nondiabetic adults. Diabetes Care 2007, 30, 980–986. [Google Scholar] [CrossRef]
- Pradhan, A.D.; Manson, J.E.; Rifai, N.; Buring, J.E.; Ridker, P.M. C-reactive protein, interleukin 6, and risk of developing type 2 diabetes mellitus. JAMA 2001, 286, 327–334. [Google Scholar] [CrossRef]
- Giulietti, A.; van Etten, E.; Overbergh, L.; Stoffels, K.; Bouillon, R.; Mathieu, C. Monocytes from type 2 diabetic patients have a pro-inflammatory profile. 1,25-Dihydroxyvitamin D(3) works as anti-inflammatory. Diabetes Res. Clin. Pract. 2007, 77, 47–57. [Google Scholar] [CrossRef] [PubMed]
- Xiao, R.; Carter, J.A.; Linz, A.L.; Ferguson, M.; Badger, T.M.; Simmen, F.A. Dietary whey protein lowers serum C-peptide concentration and duodenal SREBP-1c mRNA abundance, and reduces occurrence of duodenal tumors and colon aberrant crypt foci in azoxymethane-treated male rats. J. Nutr. Biochem. 2006, 17, 626–634. [Google Scholar] [CrossRef] [PubMed]
- Krissansen, G. Emerging health properties of whey proteins and their clinical implications. J. Am. Coll. Nutr. 2007, 26, 713S–723S. [Google Scholar] [CrossRef] [PubMed]
- Prabhakar, V.R.; Venkatesan, N. Milk casein and its benefits on cardiovascular risk. Eur. Heart J. 2007, 28, 139. [Google Scholar] [CrossRef] [PubMed]
- Tessari, P.; Kiwanuka, E.; Cristini, M.; Zaramella, M.; Enslen, M.; Zurlo, C.; Garcia-Rodenas, C. Slow versus fast proteins in the stimulation of beta-cell response and the activation of the entero-insular axis in type 2 diabetes. Diabetes Metab. Res. Rev. 2007, 23, 378–385. [Google Scholar] [CrossRef] [PubMed]
- Wilkinson, S.B.; Tarnopolsky, M.A.; Macdonald, M.J.; Macdonald, J.R.; Armstrong, D.; Phillips, S.M. Consumption of fluid skim milk promotes greater muscle protein accretion after resistance exercise than does consumption of an isonitrogenous and isoenergetic soy-protein beverage. Am. J. Clin. Nutr. 2007, 85, 1031–1040. [Google Scholar] [CrossRef] [PubMed]
- Phillips, S.M.; Tang, J.E.; Moore, D.R. The role of milk- and soy-based protein in support of muscle protein synthesis and muscle protein accretion in young and elderly persons. J. Am. Coll. Nutr. 2009, 28, 343–354. [Google Scholar] [CrossRef] [PubMed]
- Onvani, S.; Haghighatdoost, F.; Surkan, P.J.; Azadbakht, L. Dairy products, satiety and food intake: A meta-analysis of clinical trials. Clin. Nutr. 2017, 36, 389–398. [Google Scholar] [CrossRef] [PubMed]
- Walls, H.L.; Stevenson, C.E.; Mannan, H.R.; Abdullah, A.; Reid, C.M.; McNeil, J.J.; Peeters, A. Comparing Trends in BMI and Waist Circumference. Obesity Silver Spring. Obes. Res. 2010, 19, 216–219. [Google Scholar] [CrossRef] [PubMed]


| Study Author, Year | Sample Size | Sex | Age Mean ± SD or Range (Years) | BMI Mean ± SD or Range (kg/m2) | Country of Origin | Study Duration (Weeks) | Findings Intervention vs. Control |
|---|---|---|---|---|---|---|---|
| Adamsson, 2011 [40] | I = 44 C = 42 | 37% M 63% F | I = 52.6 ± 7.8 C = 53.4 ± 8.1 | I = 26.3±3.3 C = 26.5 ± 3.3 | Sweden | 6 | ↓ Body weight ↓ BMI ↓ HOMA-IR |
| Adamsson, 2015 [41] | I = 38 C = 40 | 40% M 60% F | I = 54.9 ± 7.8 C = 54.4 ± 9 | I = 28.2 ± 2.5 C = 28.5 ± 2.4 | Sweden | 12 | ↔ HOMA -IR ↔ Body weight |
| Appel, 2003 [42] | I = 269 C = 273 | 38% M 62% F | 50 ± 8.9 | 18.5–45 | United States | 26 | ↓Body weight |
| Asemi, 2013 [43] | I = 16 C = 16 | 100% F | I = 27.7 ± 5.4 C = 29.7 ± 5.6 | I = 30.2 ± 4.6 C = 29.7 ± 3.3 | Iran | 4 | ↓ Insulin ↓ FPG ↓ HOMA-IR ↔ BMI ↔ Body weight |
| Asemi, 2015 [44] | I = 24 C = 24 | 100% F | I = 29.4 ± 6.2 C = 30.7 ± 6.7 | I = 31.5 ± 5.7 C = 29.1 ± 3.2 | Iran | 8 | ↓ HOMA-IR ↓ WC ↓ Body weight ↓ BMI |
| Benatar, 2014 [45] | I = 60 C = 60 | 36% M 64% F | I = 46.3 ± 10.5 C = 48.6 ± 12 | I = 24.6 ± 4.1 C = 24.3 ± 4.0 | New Zealand | 4 | ↔ WC ↔ Body weight ↔ Insulin ↔ HOMA-IR |
| Bendsen*, 2008 [46] | I = 11 C = 11 | 45% M 55% F | 18–50 | 25–31 | Denmark | 3 | ↔ Body weight |
| Bowen, 2005 [47] | I = 25 C = 25 | 60% M 40% F | 25–64 | 25–35 | Australia | 16 | ↔ Body weight ↔ HOMA-IR |
| Demling, 2000 [48] | I1 = 14 I2 = 14 C = 10 | 100% M | 28–40 | 29 ± 4.1 | United States | 12 | ↔ Body Weight ↓ %Body fat ↑ %Lean body mass |
| Faghih, 2011 [49] | I = 22 C = 20 | 100% F | 20–50 | 25–40 | Iran | 8 | ↓ Body weight ↓ BMI ↓ WC |
| Farnsworth, 2003 [50] | I = 28 C = 29 | 25% M 75% F | I = 51.2 ± 3.1 C = 49.6 ± 2.7 | I = 34.1 ± 1.0 C = 34.0 ± 1.1 | Australia | 16 | ↔ HOMA-IR ↔ Abdominal fat ↔ Body weight ↔ Fat mass ↑ Lean mass |
| Gunther, 2005 [51] | I1 = 48 I2 = 45 C = 42 | 100% F | I1 = 20.1 ± 2.5 I2 = 20.2 ± 2.4 C = 20.1 ± 2.4 | I1 = 22.4 ± 2.6 I2 = 23.3 ± 3.9 C = 22.1 ± 3.1 | United States | 52 | ↔ Body weight ↔ BMI ↔ Body fat mass |
| Harvey-Berino, 2005 [52] | I = 25 C = 29 | 8% M 92% F | I = 45.2 ± 7.0 C = 45.1 ± 6.5 | 25–34.9 | United States | 52 | ↔ Body weight ↔ %Body fat ↔ Body fat |
| Josse, 2011 [53] | I1 = 30 I2 = 30 C = 30 | 100% F | I1 = 30 ± 1.0 I2 = 26 ± 1.0 C = 28 ± 1.0 | I1 = 31.4 ± 0.6 I2 =31.8 ± 0.6 C = 31.5 ± 0.6 | Canada | 16 | ↓ Body fat ↓ Body weight |
| Liu, 2010 [54] | I1 = 60 I2 = 60 C = 60 | 100% F | I1 = 55.9 ± 3.8 I2 = 56 ± 4.4 C = 56.4 ± 4.7 | I1 = 24.6 ± 3.4 I2 = 24.8 ± 3.8 C = 24.1 ± 3.8 | China | 26 | ↔ HOMA-IR ↔ Body weight |
| Lukaszuk, 2007 [55] | I = 7 C = 7 | 100% F | 18-45 | I = 33.9 ± 10.5 C = 38.4 ± 10.0 | United States | 8 | ↔ Body weight ↔ WC |
| Manios, 2006 [56] | I = 39 C = 36 | 100% F | I = 60.5 ± 0.7 C = 61.4 ± 0.8 | I = 28.3 ± 0.6 C = 29.8 ± 0.9 | Greece | 22 | ↓ BMI |
| Razavi Zade, 2016 [57] | I = 30 C = 30 | 50% M 50% F | C = 42.8 ± 10.6 I = 39.7 ± 7.3 | C = 28.3 ± 3.3 I = 28.5 ± 3.2 | Iran | 8 | ↓ Body weight ↓ BMI ↓ HOMA-IR |
| Rosado, 2011 [58] | I = 43 C = 41 | 100% F | I = 34.9 ± 5.6 C = 34.1 ± 5.9 | I = 34.8 ± 3.4 C = 24.8 ± 3.8 | Mexico | 16 | ↔ WC ↔ Body weight ↔ BMI ↔ %Body fat ↔ Body mass |
| Smilowitz, 2011 [59] | I = 22 C = 23 | 20% M 80% F | I = 25.1 ± 5.3 C = 24.2 ± 4.7 | I = 28.3 ± 3.0 C = 28.8 ± 2.7 | United States | 12 | ↔ Body weight ↔ % Body fat ↔ % Lean mass ↔ WC |
| Stancliffe, 2011 [60] | I = 20 C = 20 | 50% M 50% F | I = 34.4 ± 9.4 C = 39.5 ± 10.2 | I = 30.1 ± 4.4 C = 31.2 ± 5.4 | United States | 12 | ↔ Body weight ↓ %Body fat ↓ WC ↓ HOMA-IR ↓ Insulin level |
| Tanaka, 2014 [61] | I = 102 C = 98 | 100% M | I = 41.7 ± 7.5 C = 41.7 ± 7.1 | I = 27.2 ± 3.9 C = 26.8 ± 2.9 | Japan | 24 | ↔ Body weight ↔ %Body fat ↔ WC |
| Thomas, 2011 [62] | I = 15 C=14 | 100% F | 29–45 | I = 29.4 ± 2.0 C = 28.7 ± 2.2 | United States | 16 | ↔ Body weight ↔ WC ↔ %Body fat |
| Thompson, 2005 [63] | I1 = 30 I2 = 31 C = 29 | 14% M 86% F | 25–70 | 30-40 | United States | 48 | ↔ Body weight ↔ Body fat ↔ WC ↓ HOMA-IR |
| Wennersberg, 2009 [64] | I = 55 C = 54 | 33% M 67% F | M = 51.2 ± 8.1 F = 56 ± 7.4 | I = 30.1 ± 3.6 C = 30.0 ± 3.3 | Norway | 26 | ↔ Body weight ↔ BMI ↔ % Body fat ↔ WC ↓ HOMA-IR |
| Zemel, 2004 [65] | I = 14 C = 14 | 17% M 83% F | 46 ± 8 | 30–39.9 | United States | 24 | ↓ Body weight ↓ Body fat ↓ Insulin |
| Zemel, 2005 [66] (Phase 1) | I = 17 C = 17 | 32% M 68% F | I = 42.5 ± 2.6 C = 41.3 ± 2.7 | I = 34.1 ± 0.7 C = 34.9 ± 0.8 | United States | 24 | ↔ Body weight ↓ Body fat ↑ Lean mass ↓ WC ↓ Insulin |
| Zemel, 2005 [66] (Phase 2) | I = 17 C = 12 | 14% M 86% F | I = 41.7 ± 2.9 C = 41.7 ± 2.7 | I = 35.6 ± 0.7 C = 35.4 ± 0.9 | United States | 24 | ↓ Body weight ↓ Body fat ↑ Lean mass ↓ WC ↓ Insulin |
| Zemel, 2005 [67] | I = 18 C = 16 | 29% M 71% F | I = 39 ± 10 C = 42 ± 6 | I = 32.1 ± 0.4 C = 33.2 ± 0.9 | United States | 12 | ↓ Body fat ↓ WC |
| Zemel, 2008 [68] | I = 169 C = 169 | ** | I = 39.9 ± 7.2 C = 40.7 ± 6.8 | I = 34.4 ± 3.2 C = 34.6 ± 3.1 | United States | 39 | ↔ Body weight ↔ BMI ↔ WC |
| Zemel, 2009 [69] | I = 32 C = 38 | 23% M 77% F | I = 25.5 ± 5.0 C = 25.3 ± 4.9 | I = 28.8 ± 2.8 C = 29.3 ± 2.8 | United States | 12 | ↔ Body weight ↔ Lean mass ↓ WC |
| Study Author, Date | Dietary Intervention | Physical Activity Component |
|---|---|---|
| Adamsson, 2011 [40] | I = Nordic diet (low-fat dairy, fruit, berries, legumes, LDL-C lowering foods) C = Habitual diet with usual physical activity | No |
| Adamsson, 2015 [41] | I = Breakfast consisting of oat bran, LFM, low-fat yogurt, jam, raisins, fruits and berries, whole grain bread, low-fat spread, turkey meat, pickled herring, or mackerel C = Habitual diet with recommendation for Nordic foods. | No |
| Appel, 2003 [42] | I = Diet rich in low-fat dairy, fruit, vegetables, whole grains ((2–3 servings/day of low-fat dairy), DASH diet: calcium ~1250 mg/day C = Habitual diet. Advised once about effect of lifestyle (exercise, and DASH diet) on blood pressure | Yes |
| Asemi, 2013 [43] | I = Diet rich in low-fat dairy, fruit, vegetables, whole grains (DASH diet) in proportions similar to control diet: calcium ~1752 mg/day C = Recommended proportions of fat, protein, and carbs ~ 1082 mg calcium/day | No |
| Asemi, 2015 [44] | I = Diet high in low-fat dairy (3 servings/day), fruits, lean meat, and vegetables. (DASH diet: carb 52%, protein18%, total fat 30% with BMI based calories restriction in both groups, calcium ~1714 mg/day C = Diet high in grains, simple sugars, dairy (2 servings daily), calcium ~1037 mg/day | No |
| Benatar, 2014 [45] | I= High fat milk and dairy (extra 2–3 servings of dairy; ~ 1300 mg calcium) C = Dairy/day replaced with rice milk or soya | No |
| Bendsen, 2008 [46] | I = High dairy diet from low-fat dairy products (calcium 2300 mg/day) C = Low dairy diet (calcium 700 mg/day) | No |
| Bowen, 2005 [47] | I = High dairy intake from low-fat dairy products (calcium 2400 mg/day) C = Low dairy intake (calcium 500 mg/day) | No |
| Demling, 2000 [48] | I1 = 75 gm casein hydrolysate plus control diet I2 = 75 gm whey hydrolysate plus control diet C = non lipogenic, hypocaloric diet alone (80% of predicted needs). | Yes |
| Faghih, 2011 [49] | I = High dairy intake with 3 services of low-fat milk daily (3 servings per day; calcium) with 1300 mg/day of calcium; 500 calorie energy deficit C = Low dairy intake with 500–600 mg/day calcium; 500 calorie energy deficit | No |
| Farnsworth, 2003 [50] | I = High dairy protein intake from yogurt (200 gm), LFM (30 gm), or low-fat cheese (60 gm): ~2000–2400 mg calcium/day C= Low protein with no milk or limited milk products: 500 mg calcium/day | No |
| Gunther, 2005 [51] | I1 = Substitute with dairy as source for 1000–1100 mg calcium/day I2 = Substitute with dairy as source for 1300–1400 mg calcium/day C= Maintain current dietary consumption of calcium (~700 mg/day) (isocaloric diet for all groups) | No |
| Harvey-Berino, 2005 [52] | I = 3–4 servings dairy/day (equivalent to 1200–1400 mg calcium) C = 1 serving dairy/day (equivalent to 500 mg calcium) Dairy sources were milk cheese and yogurt | Yes |
| Josse, 2011 [53] | I1 = 3–4 servings of dairy/day (~950 mg calcium/day) I2 = 6–7 serving of dairy/day (~1650 mg calcium/day)) C = 0–1 serving dairy/day | Yes |
| Liu, 2010 [54] | I1 = 15 g milk protein on a daily basis in addition to usual diet I2 = 15 g milk protein and 100 mg isoflavones in addition to usual diet C = 15 g soy protein and 100 mg isoflavones in addition to usual diet | No |
| Lukaszuk, 2007 [55] | I = 720 mL skimmed milk/day (~900 mg calcium/day) C = 720 mL soy milk/day (~1350 mg calcium/day) | No |
| Manios, 2006 [56] | I = Low-fat dairy products (milk and yogurt) fortified with calcium and vitamin D (~1250 mg calcium/day) C = Regular diet (~730 mg calcium/day) | Yes |
| Razavi Zade, 2016 [57] | I = Energy restricted DASH diet consisted of 52–55% carbohydrates, 16–18% proteins and 30% total fats (~1800 mg calcium/day). The DASH diet was rich in fruits, vegetables, whole grains, and low-fat dairy products; and low in saturated fats, cholesterol, refined grains, and sweets C = Energy restricted regular diet with 52–55% carbohydrates, 16–18% protein and 30% total fats (~1064 mg calcium/day). | No |
| Rosado, 2011 [58] | I = 750 mL of low-fat milk/ day in addition to an energy-restricted diet of –500 kcal/day (~1000 calcium/day) C = Energy-restricted diet of −500 kcal/day with no intake of milk | No |
| Smilowitz, 2011 [59] | I = High dairy diet (placebo-supplemented) providing a 2093 kJ/day deficit (500 kcal/day) and containing 3 daily servings dairy products (milk, cheese, and/or yogurt) to bring the total calcium intake to 1400 mg/day C = 0–1 serving of dairy products/day, 500 mg calcium/day, and a daily placebo supplement. Control diet providing a deficit (500 kcal/day) | No |
| Stancliffe, 2011 [60] | I = Adequate dairy diet (3.5 servings dairy daily (~1200 mg calcium/day) C = low-dairy diet (<0.5 serving/day ~ less than 600 mg calcium/day) | No |
| Tanaka, 2014 [61] | I = Milk and dairy products (400 g/day). C = Regular diet | No |
| Thomas, 2011 [62] | I = 6-oz serving of fat-free yogurt (Yoplait Light Thick and Creamy ~200 mg calcium) containing 418 kJ 20 min before and immediately after each exercise session C = 6-oz serving of an isoenergetic placebo beverage containing 25 g of carbohydrate, 0 g of fat, and 0 g of protein | Yes |
| Thompson, 2005 [63] | I1 = 4 servings/day dairy (~1387 mg calcium/day) I2 = 4 servings/day dairy (~1439 mg calcium/day) with an increased amount of fiber (through additional whole grains, fruits, and vegetables) and with a reduction in glycemic index (foods with a glycemic index >100 were strongly discouraged). C = 2 servings/day dairy (~800 mg calcium/day) with 30% fat, 20% protein, and 50% carbohydrate. The diet was designed to provide an average level of calcium and fiber. Energy deficit of 500 calories | Yes |
| Wennersberg, 2009 [36] | I = 3 to 5 serving of dairy products in their diet daily including milk containing 0.5–3% fat (one portion defined as 200 g milk), yogurt or sour milk (1.0–5.4% fat, 200–250 g), cream or creme fraiche (12–40% fat, = 75 g), cheese (15–30%, 15–40 g), butter or butter containing spreads (40–80% fat, 3–10 g), cottage cheese (2–8%, 0.5 dL), and ice cream occasionally (~1150 mg calcium/day) C = habitual diet without changing the intake of dairy products (~625 mg calcium/day) | No |
| Zemel, 2004 [65] | I = High dairy diet (1200 to 1300 mg of dietary calcium/day supplemented with placebo). C = Standard dairy diet (400 to 500 mg of dietary calcium/day supplemented with placebo). | No |
| Zemel, 2005 [66] (Phase 1) | I = High dairy diet (1200 mg calcium/day including 3 servings/day of dairy with at least one in the form of fluid milk). C = Low dairy diet (500 mg/day calcium with <1 serving/day). | No |
| Zemel, 2005 [66] (Phase 2) | I = High dairy diet (1200 mg calcium/day including 3 servings/day of dairy with at least one in the form of fluid milk) with 500-kcal/d deficit. C = 0 to 1 servings of low-fat dairy products per day, and containing a total of <500 mg calcium per day with 500-kcal/day deficit. | No |
| Zemel, 2005 [67] | I = Yogurt diet providing a 500 kcal/day deficit and containing three daily six-ounce servings of a commercial fat-free yogurt (Yoplait Light), to bring the total calcium intake from 500–1100 mg/day. C = 0 to 1 servings of dairy products/day and 400–500 mg calcium per day. The control diet incorporated as a placebo three daily servings of a sugar-free, calcium-free, prepackaged flavored gelatin dessert containing 10 kcal/serving with 500 kcal/day deficit. | No |
| Zemel, 2008 [68] | I = Recommended dairy diet (>3 servings/day of milk, cheese or yogurt). C = Low dairy diet (<1 dairy serving/day). | Yes |
| Zemel, 2009 [69] | I = High dairy diet (placebo supplemented) containing three daily servings dairy products (milk, cheese, and/or yogurt) substituted for other protein sources in the diet, to bring the total calcium intake to 1400 mg/day with a 500 calories/day deficit. C = 0 to 1 servings of dairy products/day, 500 mg calcium/day, and a daily placebo (methyl-cellulose) supplement with a 500 calories/day deficit. | No |
© 2019 by the authors. Licensee MDPI, Basel, Switzerland. This article is an open access article distributed under the terms and conditions of the Creative Commons Attribution (CC BY) license (http://creativecommons.org/licenses/by/4.0/).
Share and Cite
Sochol, K.M.; Johns, T.S.; Buttar, R.S.; Randhawa, L.; Sanchez, E.; Gal, M.; Lestrade, K.; Merzkani, M.; Abramowitz, M.K.; Mossavar-Rahmani, Y.; et al. The Effects of Dairy Intake on Insulin Resistance: A Systematic Review and Meta-Analysis of Randomized Clinical Trials. Nutrients 2019, 11, 2237. https://doi.org/10.3390/nu11092237
Sochol KM, Johns TS, Buttar RS, Randhawa L, Sanchez E, Gal M, Lestrade K, Merzkani M, Abramowitz MK, Mossavar-Rahmani Y, et al. The Effects of Dairy Intake on Insulin Resistance: A Systematic Review and Meta-Analysis of Randomized Clinical Trials. Nutrients. 2019; 11(9):2237. https://doi.org/10.3390/nu11092237
Chicago/Turabian StyleSochol, Kristen M., Tanya S. Johns, Rupinder S. Buttar, Lovepreet Randhawa, Edeline Sanchez, Maya Gal, Katherine Lestrade, Massini Merzkani, Matthew K. Abramowitz, Yasmin Mossavar-Rahmani, and et al. 2019. "The Effects of Dairy Intake on Insulin Resistance: A Systematic Review and Meta-Analysis of Randomized Clinical Trials" Nutrients 11, no. 9: 2237. https://doi.org/10.3390/nu11092237