Identification of the Secreted Proteins Originated from Primary Human Hepatocytes and HepG2 Cells

 , , , ,
Abstract
:
1. Introduction
2. Materials and Methods
2.1. Materials
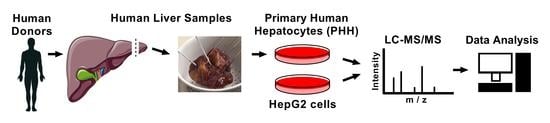
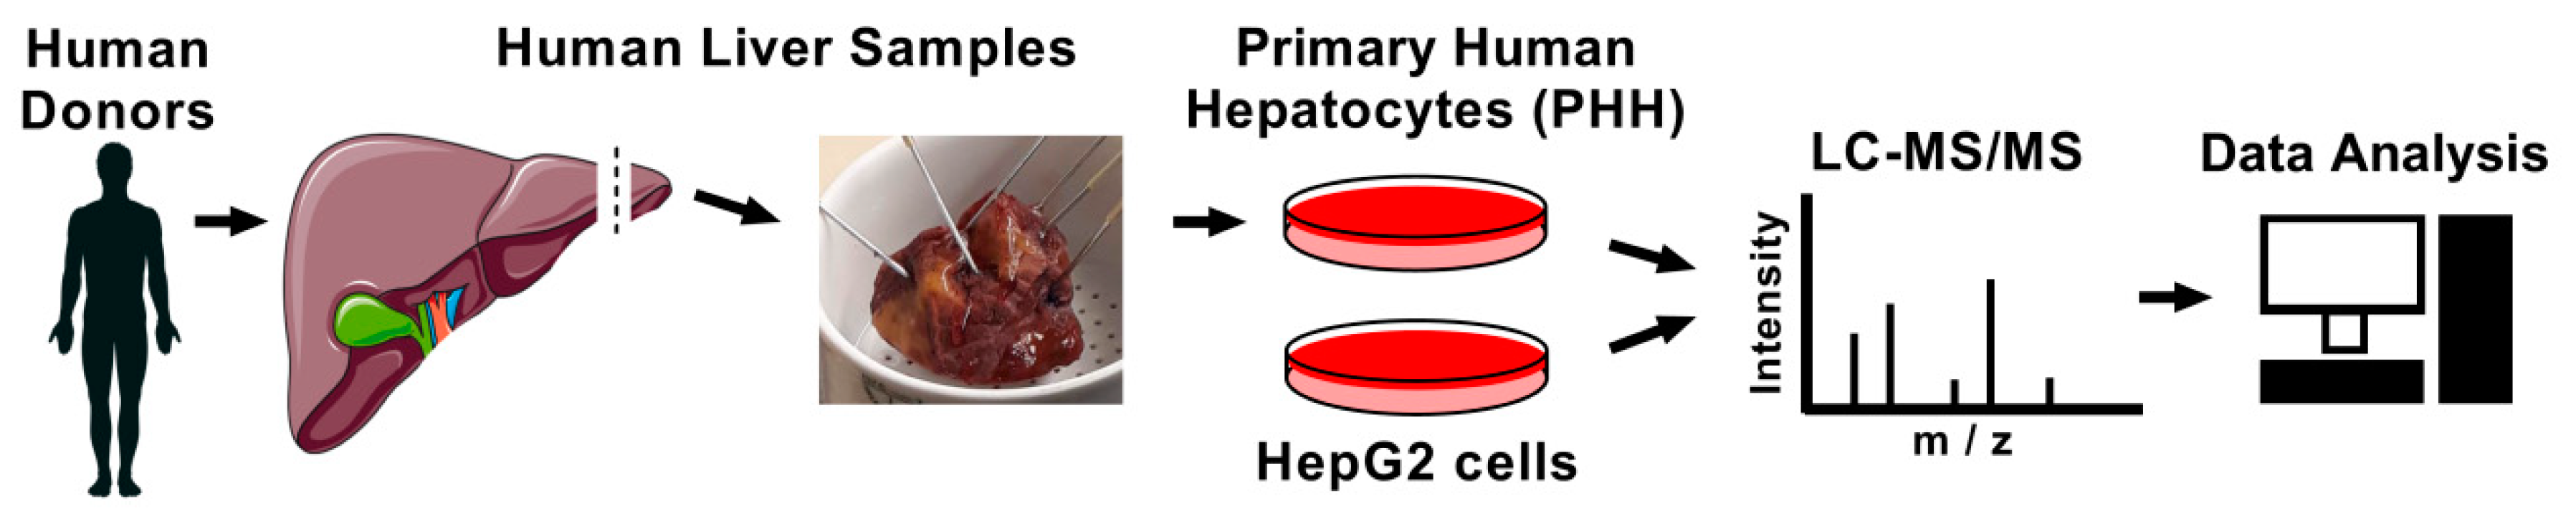
2.2. Human Liver Samples
2.3. Cell Culture
2.4. Liquid Chromatography Coupled to Tandem Mass Spectrometry (LC-MS/MS)
2.5. Analysis of LC-MS/MS Data
3. Results
4. Discussion
Supplementary Materials
Author Contributions
Funding
Acknowledgments
Conflicts of Interest
References
- Trefts, E.; Gannon, M.; Wasserman, D.H. The liver. Curr Biol 2017, 27, R1147–R1151. [Google Scholar] [CrossRef] [PubMed]
- Azzout-Marniche, D.; Gaudichon, C.; Tome, D. Dietary protein and blood glucose control. Curr. Opin. Clin. Nutr. Metab. Care 2014, 17, 349–354. [Google Scholar] [CrossRef] [PubMed] [Green Version]
- Aden, D.P.; Fogel, A.; Plotkin, S.; Damjanov, I.; Knowles, B.B. Controlled synthesis of HBsAg in a differentiated human liver carcinoma-derived cell line. Nature 1979, 282, 615–616. [Google Scholar] [CrossRef] [PubMed]
- Knowles, B.B.; Howe, C.C.; Aden, D.P. Human hepatocellular carcinoma cell lines secrete the major plasma proteins and hepatitis B surface antigen. Science 1980, 209, 497–499. [Google Scholar] [CrossRef] [PubMed]
- Sefried, S.; Häring, H.U.; Weigert, C.; Eckstein, S.S. Suitability of hepatocyte cell lines HepG2, AML12 and THLE-2 for investigation of insulin signalling and hepatokine gene expression. Open Biol. 2018, 8. [Google Scholar] [CrossRef] [Green Version]
- Guillouzo, A.; Corlu, A.; Aninat, C.; Glaise, D.; Morel, F.; Guguen-Guillouzo, C. The human hepatoma HepaRG cells: A highly differentiated model for studies of liver metabolism and toxicity of xenobiotics. Chem. Biol. Interact. 2007, 168, 66–73. [Google Scholar] [CrossRef]
- Green, C.J.; Johnson, D.; Amin, H.D.; Sivathondan, P.; Silva, M.A.; Wang, L.M.; Stevanato, L.; McNeil, C.A.; Miljan, E.A.; Sinden, J.D.; et al. Characterization of lipid metabolism in a novel immortalized human hepatocyte cell line. Am. J. Physiol. Endocrinol. Metab. 2015, 309, E511–E522. [Google Scholar] [CrossRef] [Green Version]
- Franko, A.; Merkel, D.; Kovarova, M.; Hoene, M.; Jaghutriz, B.A.; Heni, M.; Königsrainer, A.; Papan, C.; Lehr, S.; Häring, H.U.; et al. Dissociation of Fatty Liver and Insulin Resistance in I148M PNPLA3 Carriers: Differences in Diacylglycerol (DAG) FA18:1 Lipid Species as a Possible Explanation. Nutrients 2018, 10, 1314. [Google Scholar] [CrossRef]
- Dorko, K.; Freeswick, P.D.; Bartoli, F.; Cicalese, L.; Bardsley, B.A.; Tzakis, A.; Nussler, A.K. A new technique for isolating and culturing human hepatocytes from whole or split livers not used for transplantation. Cell Transplant 1994, 3, 387–395. [Google Scholar] [CrossRef]
- Rowe, C.; Gerrard, D.T.; Jenkins, R.; Berry, A.; Durkin, K.; Sundstrom, L.; Goldring, C.E.; Park, B.K.; Kitteringham, N.R.; Hanley, K.P.; et al. Proteome-wide analyses of human hepatocytes during differentiation and dedifferentiation. Hepatology 2013, 58, 799–809. [Google Scholar] [CrossRef]
- Schyschka, L.; Sanchez, J.J.; Wang, Z.; Burkhardt, B.; Muller-Vieira, U.; Zeilinger, K.; Bachmann, A.; Nadalin, S.; Damm, G.; Nussler, A.K. Hepatic 3D cultures but not 2D cultures preserve specific transporter activity for acetaminophen-induced hepatotoxicity. Arch. Toxicol. 2013, 87, 1581–1593. [Google Scholar] [CrossRef]
- Godoy, P.; Hewitt, N.J.; Albrecht, U.; Andersen, M.E.; Ansari, N.; Bhattacharya, S.; Bode, J.G.; Bolleyn, J.; Borner, C.; Bottger, J.; et al. Recent advances in 2D and 3D in vitro systems using primary hepatocytes, alternative hepatocyte sources and non-parenchymal liver cells and their use in investigating mechanisms of hepatotoxicity, cell signaling and ADME. Arch. Toxicol. 2013, 87, 1315–1530. [Google Scholar] [CrossRef] [Green Version]
- Heslop, J.A.; Rowe, C.; Walsh, J.; Sison-Young, R.; Jenkins, R.; Kamalian, L.; Kia, R.; Hay, D.; Jones, R.P.; Malik, H.Z.; et al. Mechanistic evaluation of primary human hepatocyte culture using global proteomic analysis reveals a selective dedifferentiation profile. Arch. Toxicol. 2017, 91, 439–452. [Google Scholar] [CrossRef]
- Stefan, N.; Häring, H.U. The role of hepatokines in metabolism. Nat. Rev. Endocrinol. 2013, 9, 144–152. [Google Scholar] [CrossRef]
- Weigert, C.; Hoene, M.; Plomgaard, P. Hepatokines-a novel group of exercise factors. Pflugers Arch. 2018, 471, 383–396. [Google Scholar] [CrossRef]
- Hartwig, S.; De Filippo, E.; Goddeke, S.; Knebel, B.; Kotzka, J.; Al-Hasani, H.; Roden, M.; Lehr, S.; Sell, H. Exosomal proteins constitute an essential part of the human adipose tissue secretome. Biochim. Biophys. Acta Proteins Proteom. 2018. [Google Scholar] [CrossRef]
- Hartwig, S.; Raschke, S.; Knebel, B.; Scheler, M.; Irmler, M.; Passlack, W.; Muller, S.; Hanisch, F.G.; Franz, T.; Li, X.; et al. Secretome profiling of primary human skeletal muscle cells. Biochim. Biophys. Acta 2014, 1844, 1011–1017. [Google Scholar] [CrossRef] [Green Version]
- Iroz, A.; Couty, J.P.; Postic, C. Hepatokines: Unlocking the multi-organ network in metabolic diseases. Diabetologia 2015, 58, 1699–1703. [Google Scholar] [CrossRef]
- Wisniewski, J.R.; Vildhede, A.; Noren, A.; Artursson, P. In-depth quantitative analysis and comparison of the human hepatocyte and hepatoma cell line HepG2 proteomes. J. Proteom. 2016, 136, 234–247. [Google Scholar] [CrossRef]
- Lehr, S.; Hartwig, S.; Lamers, D.; Famulla, S.; Muller, S.; Hanisch, F.G.; Cuvelier, C.; Ruige, J.; Eckardt, K.; Ouwens, D.M.; et al. Identification and validation of novel adipokines released from primary human adipocytes. Mol. Cell. Proteom. 2012, 11, M111.010504. [Google Scholar] [CrossRef]
- Knobeloch, D.; Ehnert, S.; Schyschka, L.; Buchler, P.; Schoenberg, M.; Kleeff, J.; Thasler, W.E.; Nussler, N.C.; Godoy, P.; Hengstler, J.; et al. Human hepatocytes: Isolation, culture, and quality procedures. Methods Mol. Biol. 2012, 806, 99–120. [Google Scholar]
- Franko, A.; Kovarova, M.; Feil, S.; Feil, R.; Wagner, R.; Heni, M.; Königsrainer, A.; Ruoss, M.; Nüssler, A.K.; Weigert, C.; et al. cGMP-dependent protein kinase I (cGKI) modulates human hepatic stellate cell activation. Metabolism 2018, 88, 22–30. [Google Scholar] [CrossRef] [Green Version]
- Kotzka, J.; Knebel, B.; Haas, J.; Kremer, L.; Jacob, S.; Hartwig, S.; Nitzgen, U.; Muller-Wieland, D. Preventing phosphorylation of sterol regulatory element-binding protein 1a by MAP-kinases protects mice from fatty liver and visceral obesity. PLoS ONE 2012, 7, e32609. [Google Scholar] [CrossRef]
- Schmidt, C.; Hesse, D.; Raabe, M.; Urlaub, H.; Jahn, O. An automated in-gel digestion/iTRAQ-labeling workflow for robust quantification of gel-separated proteins. Proteomics 2013, 13, 1417–1422. [Google Scholar] [CrossRef]
- Tyanova, S.; Temu, T.; Cox, J. The MaxQuant computational platform for mass spectrometry-based shotgun proteomics. Nat. Protoc. 2016, 11, 2301–2319. [Google Scholar] [CrossRef]
- Lenz, C.; Dihazi, H. Introduction to Proteomics Technologies. Methods Mol. Biol. 2016, 1362, 3–27. [Google Scholar]
- Bendtsen, J.D.; Jensen, L.J.; Blom, N.; Von Heijne, G.; Brunak, S. Feature-based prediction of non-classical and leaderless protein secretion. Protein Eng. Des. Sel. 2004, 17, 349–356. [Google Scholar] [CrossRef] [Green Version]
- Petersen, T.N.; Brunak, S.; von Heijne, G.; Nielsen, H. SignalP 4.0: Discriminating signal peptides from transmembrane regions. Nat. Methods 2011, 8, 785–786. [Google Scholar] [CrossRef]
- Franko, A.; Huypens, P.; Neschen, S.; Irmler, M.; Rozman, J.; Rathkolb, B.; Neff, F.; Prehn, C.; Dubois, G.; Baumann, M.; et al. Bezafibrate Improves Insulin Sensitivity and Metabolic Flexibility in STZ-Induced Diabetic Mice. Diabetes 2016, 65, 2540–2552. [Google Scholar] [CrossRef] [Green Version]
- Meex, R.C.R.; Watt, M.J. Hepatokines: Linking nonalcoholic fatty liver disease and insulin resistance. Nat. Rev. Endocrinol. 2017, 13, 509–520. [Google Scholar] [CrossRef]
- Eichelbaum, K.; Winter, M.; Berriel Diaz, M.; Herzig, S.; Krijgsveld, J. Selective enrichment of newly synthesized proteins for quantitative secretome analysis. Nat. Biotechnol. 2012, 30, 984–990. [Google Scholar] [CrossRef]
- Weigert, C.; Lehmann, R.; Hartwig, S.; Lehr, S. The secretome of the working human skeletal muscle-a promising opportunity to combat the metabolic disaster? Proteom. Clin. Appl. 2014, 8, 5–18. [Google Scholar] [CrossRef]
- Le Bihan, M.C.; Bigot, A.; Jensen, S.S.; Dennis, J.L.; Rogowska-Wrzesinska, A.; Laine, J.; Gache, V.; Furling, D.; Jensen, O.N.; Voit, T.; et al. In-depth analysis of the secretome identifies three major independent secretory pathways in differentiating human myoblasts. J. Proteom. 2012, 77, 344–356. [Google Scholar] [CrossRef]
- Huang-Doran, I.; Zhang, C.Y.; Vidal-Puig, A. Extracellular Vesicles: Novel Mediators of Cell Communication in Metabolic Disease. Trends Endocrinol. Metab. 2017, 28, 3–18. [Google Scholar] [CrossRef]
- Slany, A.; Haudek, V.J.; Zwickl, H.; Gundacker, N.C.; Grusch, M.; Weiss, T.S.; Seir, K.; Rodgarkia-Dara, C.; Hellerbrand, C.; Gerner, C. Cell characterization by proteome profiling applied to primary hepatocytes and hepatocyte cell lines Hep-G2 and Hep-3B. J. Proteome Res. 2010, 9, 6–21. [Google Scholar] [CrossRef]
- Tascher, G.; Burban, A.; Camus, S.; Plumel, M.; Chanon, S.; Le Guevel, R.; Shevchenko, V.; Van Dorsselaer, A.; Lefai, E.; Guguen-Guillouzo, C.; et al. In-Depth Proteome Analysis Highlights HepaRG Cells as a Versatile Cell System Surrogate for Primary Human Hepatocytes. Cells 2019, 8, 192. [Google Scholar] [CrossRef]
- Kanebratt, K.P.; Andersson, T.B. HepaRG cells as an in vitro model for evaluation of cytochrome P450 induction in humans. Drug. Metab. Dispos. 2008, 36, 137–145. [Google Scholar] [CrossRef]
- Hofer, N.; Zacharias, E.; Muller, W.; Resch, B. An update on the use of C-reactive protein in early-onset neonatal sepsis: Current insights and new tasks. Neonatology 2012, 102, 25–36. [Google Scholar] [CrossRef]
- Chen, H.; Zhu, H.R.; Yu, X.N.; Shi, X.; Bilegsaikhan, E.; Guo, H.Y.; Huang, R.Z.; Liu, T.T.; Shen, X.Z.; Zhu, J.M. Overexpressed pepsinogen C is associated with poor prognosis in human hepatocellular carcinoma: A tissue microarray study. Cancer Manag. Res. 2019, 11, 2927–2934. [Google Scholar] [CrossRef]
- Mato, J.M.; Elortza, F.; Lu, S.C.; Brun, V.; Paradela, A.; Corrales, F.J. Liver cancer-associated changes to the proteome: What deserves clinical focus? Expert. Rev. Proteom. 2018, 15, 749–756. [Google Scholar] [CrossRef]
- Jennemann, R.; Federico, G.; Mathow, D.; Rabionet, M.; Rampoldi, F.; Popovic, Z.V.; Volz, M.; Hielscher, T.; Sandhoff, R.; Grone, H.J. Inhibition of hepatocellular carcinoma growth by blockade of glycosphingolipid synthesis. Oncotarget 2017, 8, 109201–109216. [Google Scholar] [CrossRef] [Green Version]

| Term ID | Term Name | adj. p-Value |
|---|---|---|
| GO:0006956 | complement activation | <0.0001 |
| GO:0006958 | complement activation, classical pathway | <0.0001 |
| GO:0006957 | complement activation, alternative pathway | <0.0001 |
| GO:0007596 | blood coagulation | <0.0001 |
| GO:0007597 | blood coagulation, intrinsic pathway | <0.0001 |
| GO:0072378 | blood coagulation, fibrin clot formation | <0.0001 |
| GO:0042730 | fibrinolysis | <0.0001 |
| GO:0006953 | acute-phase response | <0.0001 |
| GO:0002526 | acute inflammatory response | <0.0001 |
| GO:0019538 | protein metabolic process | <0.0001 |
| GO:0051246 | regulation of protein metabolic process | <0.0001 |
| GO:1901605 | alpha-amino acid metabolic process | <0.0001 |
| GO:1901135 | carbohydrate derivative metabolic process | <0.0001 |
| GO:0006629 | lipid metabolic process | <0.0001 |
| GO:0097006 | regulation of plasma lipoprotein particle levels | <0.0001 |
| GO:0034369 | plasma lipoprotein particle remodeling | <0.0001 |
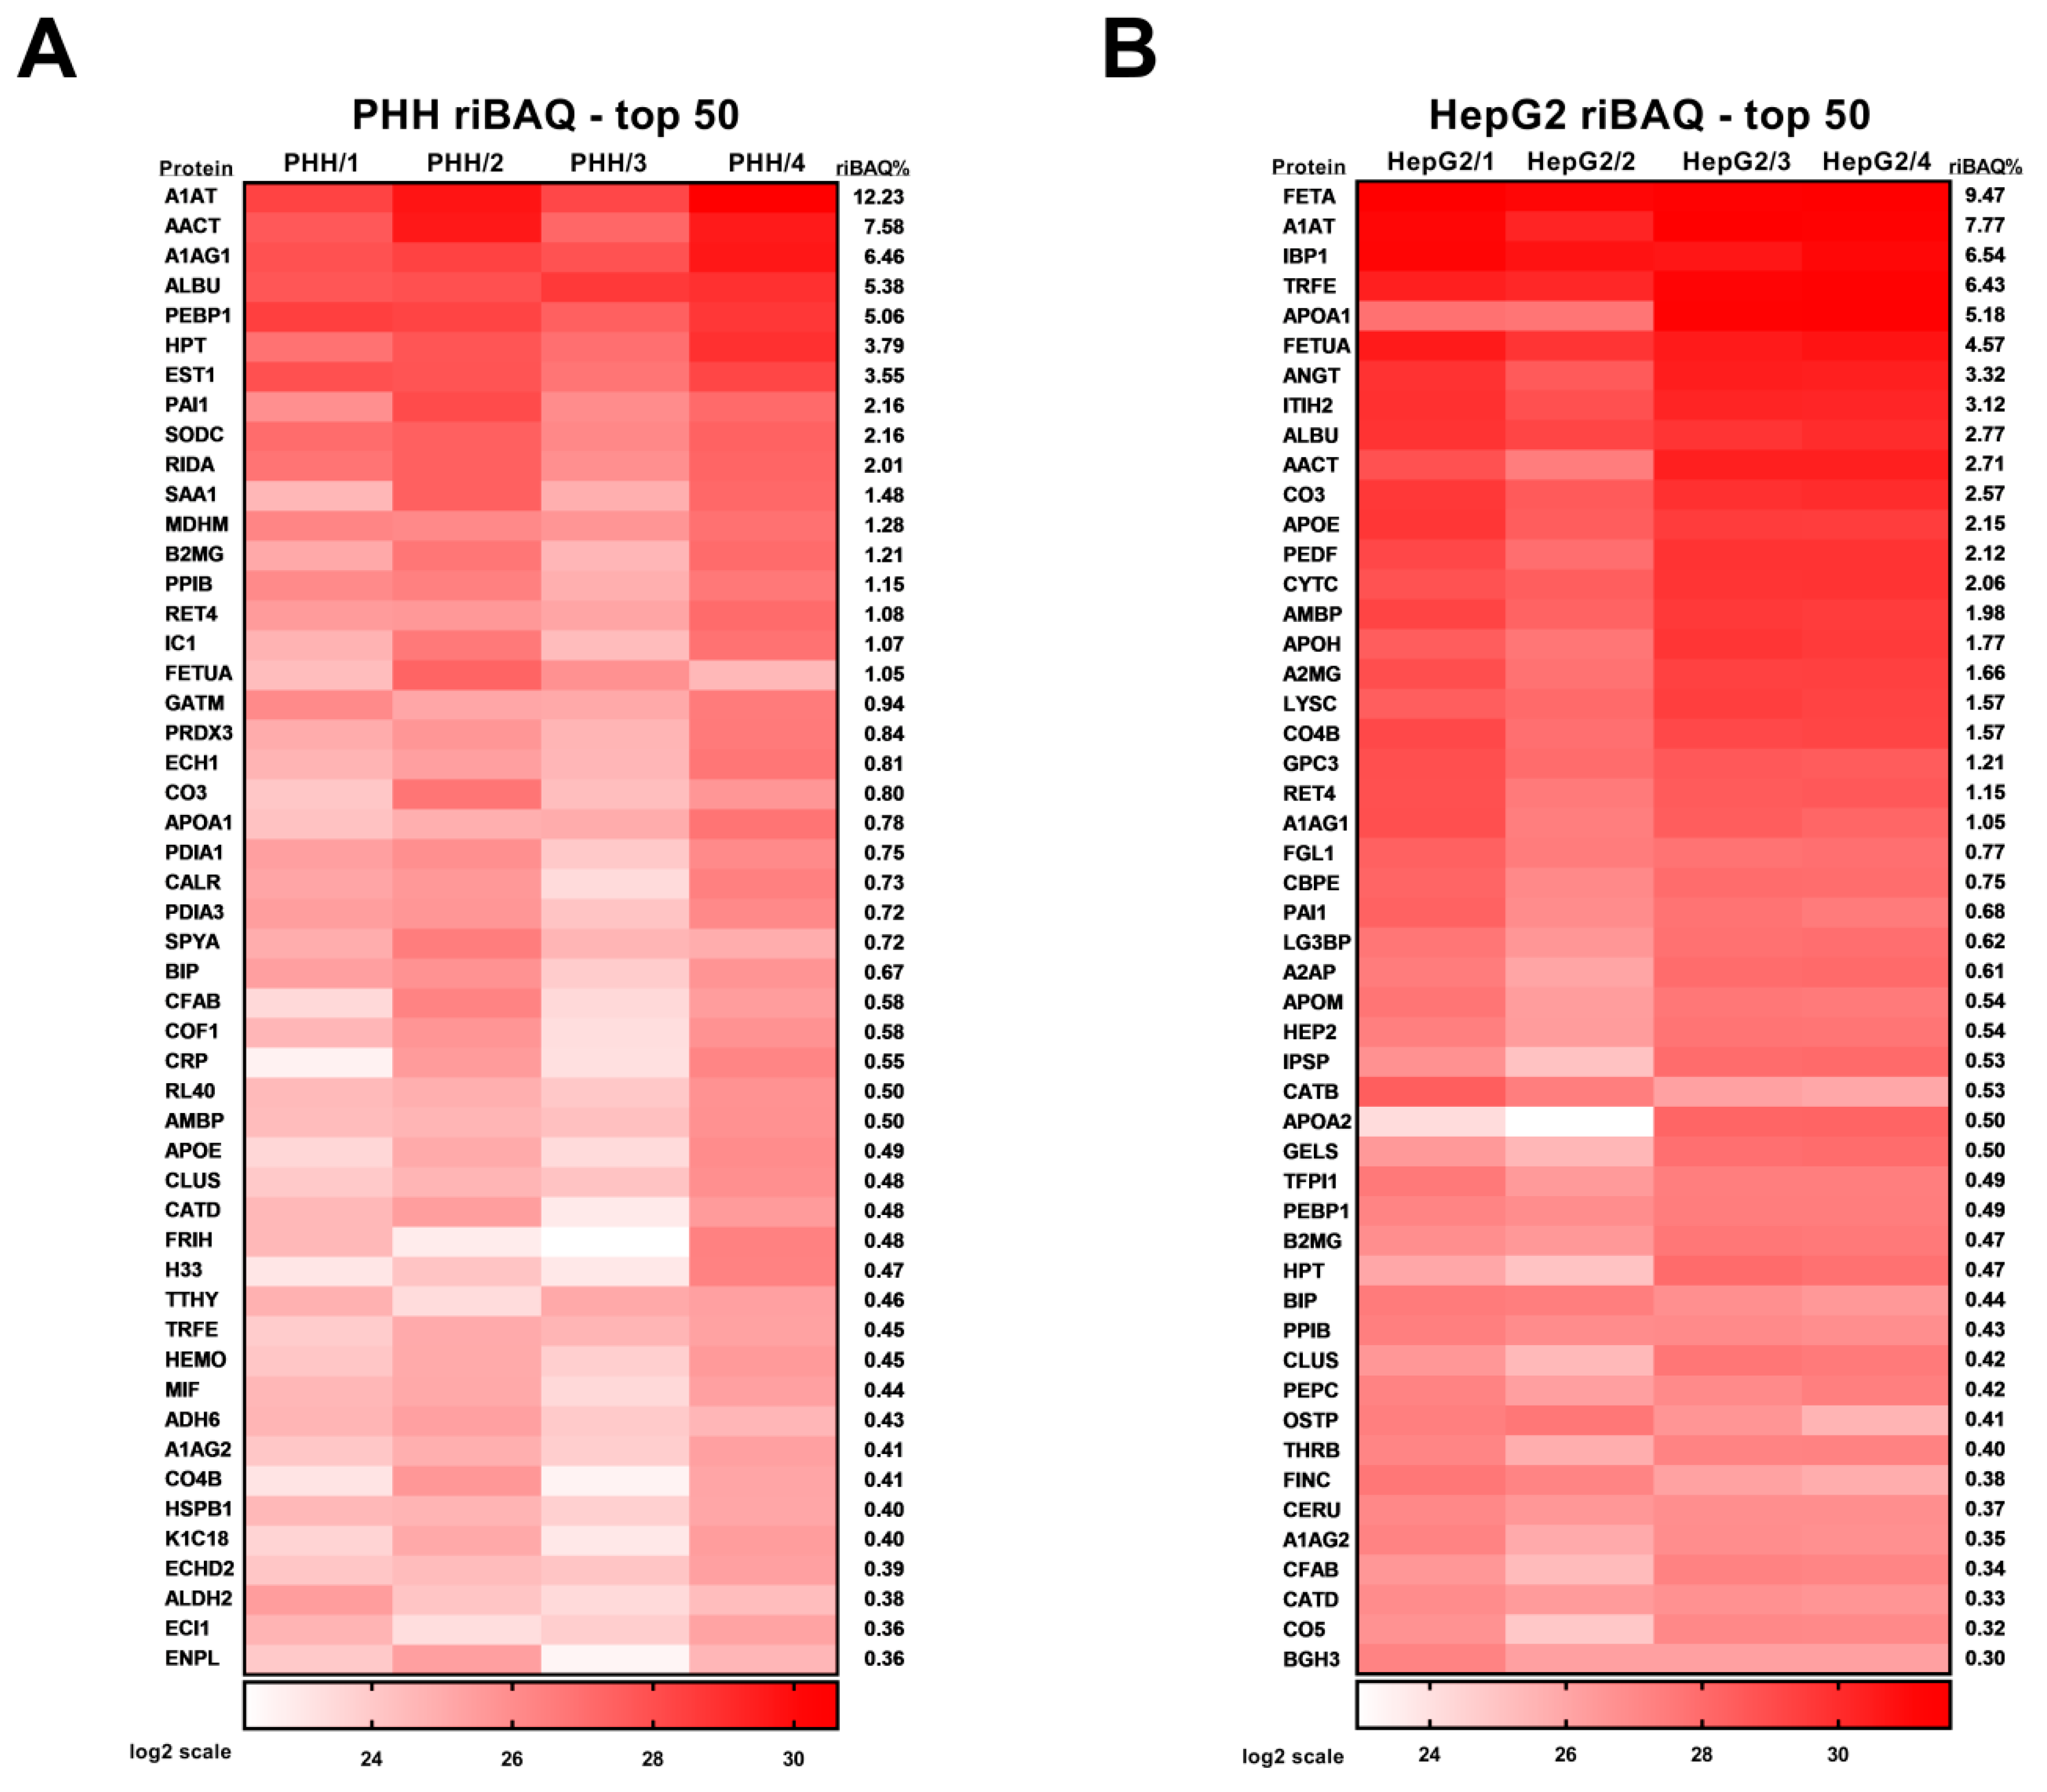
| Prot. ID | Prot. Name | Prot. Symb. | Possib. Contam. 1 | av iBAQ 2 | riBAQ (%) 3 |
|---|---|---|---|---|---|
| P01009 | Alpha-1-antitrypsin | A1AT | 789277500 | 12.23 | |
| P01011 | Alpha-1-antichymotrypsin | AACT | 489095000 | 7.58 | |
| P02763 | Alpha-1-acid glycoprotein 1 | A1AG1 | 417130000 | 6.46 | |
| P02768 | Serum albumin | ALBU | 346990000 | 5.38 | |
| P30086 | Phosphatidylethanolamine-binding protein 1 | PEBP1 | 326665000 | 5.06 | |
| P00738 | Haptoglobin | HPT | 244395000 | 3.79 | |
| P23141 | Liver carboxylesterase 1 | EST1 | 229112500 | 3.55 | |
| P05121 | Plasminogen activator inhibitor 1 | PAI1 | 139604500 | 2.16 | |
| P00441 | Superoxide dismutase [Cu-Zn] | SODC | 139590750 | 2.16 | |
| P52758 | 2-iminobutanoate/2-iminopropanoate deaminase | RIDA | 129657750 | 2.01 | |
| P0DJI8 | Serum amyloid A-1 protein | SAA1 | 95757500 | 1.48 | |
| P40926 | Malate dehydrogenase, mito. | MDHM | x | 82348750 | 1.28 |
| P61769 | Beta-2-microglobulin | B2MG | 78243000 | 1.21 | |
| P23284 | Peptidyl-prolyl cis-trans isomerase B | PPIB | 73998500 | 1.15 | |
| P02753 | Retinol-binding protein 4 | RET4 | 69459500 | 1.08 | |
| P05155 | Plasma protease C1 inhibitor | IC1 | 68893500 | 1.07 | |
| P02765 | Fetuin-A | FETUA | 67909500 | 1.05 | |
| P50440 | Glycine amidinotransferase, mito. | GATM | 60424000 | 0.94 | |
| P30048 | Thioredoxin-dependent peroxide reductase, mito. | PRDX3 | 53912250 | 0.84 | |
| Q13011 | Delta(3,5)-Delta(2,4)-dienoyl-CoA isomerase, mito. | ECH1 | 52252250 | 0.81 | |
| P01024 | Complement C3 | CO3 | 51702000 | 0.80 | |
| P02647 | Apolipoprotein A-I | APOA1 | 50100750 | 0.78 | |
| P07237 | Protein disulfide-isomerase | PDIA1 | x | 48349000 | 0.75 |
| P27797 | Calreticulin | CALR | 47263000 | 0.73 | |
| P30101 | Protein disulfide-isomerase A3 | PDIA3 | 46786500 | 0.72 | |
| P21549 | Serine-pyruvate aminotransferase | SPYA | 46203500 | 0.72 | |
| P11021 | Endoplasmic reticulum chaperone BiP | BIP | x | 43119250 | 0.67 |
| P00751 | Complement factor B | CFAB | 37699500 | 0.58 | |
| P23528 | Cofilin-1 | COF1 | x | 37466000 | 0.58 |
| P02741 | C-reactive protein | CRP | 35494325 | 0.55 | |
| P62987 | Ubiquitin-60S ribosomal protein L40 | RL40 | x | 32257250 | 0.50 |
| P02760 | Protein AMBP | AMBP | 32188750 | 0.50 | |
| P02649 | Apolipoprotein E | APOE | 31445250 | 0.49 | |
| P10909 | Clusterin | CLUS | 31080000 | 0.48 | |
| P07339 | Cathepsin D | CATD | 30845450 | 0.48 | |
| P02794 | Ferritin heavy chain | FRIH | 30716925 | 0.48 | |
| P84243 | Histone H3.3 | H33 | x | 30172300 | 0.47 |
| P02766 | Transthyretin | TTHY | 29464250 | 0.46 | |
| P02787 | Serotransferrin | TRFE | 28945750 | 0.45 | |
| P02790 | Hemopexin | HEMO | 28893000 | 0.45 | |
| P14174 | Macrophage migration inhibitory factor | MIF | 28618500 | 0.44 | |
| P28332 | Alcohol dehydrogenase 6 | ADH6 | 27676000 | 0.43 | |
| P19652 | Alpha-1-acid glycoprotein 2 | A1AG2 | 26294000 | 0.41 | |
| P0C0L5 | Complement C4-B | CO4B | 26207125 | 0.41 | |
| P04792 | Heat shock protein beta-1 | HSPB1 | 25729750 | 0.40 | |
| P05783 | Keratin, type I cytoskeletal 18 | K1C18 | 25491850 | 0.40 | |
| Q86YB7 | Enoyl-CoA hydratase domain-containing protein 2, mito. | ECHD2 | x | 25239750 | 0.39 |
| P05091 | Aldehyde dehydrogenase, mito. | ALDH2 | 24239250 | 0.38 | |
| P42126 | Enoyl-CoA delta isomerase 1, mito. | ECI1 | 23068000 | 0.36 | |
| P14625 | Endoplasmin | ENPL | x | 23033875 | 0.36 |
| Prot. ID | Prot. Name | Prot. Symb. | Possib. Contam. 1 | av iBAQ 2 | riBAQ (%) 3 |
|---|---|---|---|---|---|
| P02771 | Alpha-fetoprotein | FETA | 2998500000 | 9.47 | |
| P01009 | Alpha-1-antitrypsin | A1AT | 2460775000 | 7.77 | |
| P08833 | Insulin-like growth factor-binding protein 1 | IBP1 | 2070400000 | 6.54 | |
| P02787 | Serotransferrin | TRFE | 2035550000 | 6.43 | |
| P02647 | Apolipoprotein A-I | APOA1 | 1639730000 | 5.18 | |
| P02765 | Fetuin-A | FETUA | 1446420000 | 4.57 | |
| P01019 | Angiotensinogen | ANGT | 1050527500 | 3.32 | |
| P19823 | Inter-alpha-trypsin inhibitor heavy chain H2 | ITIH2 | 986895000 | 3.12 | |
| P02768 | Serum albumin | ALBU | 876332500 | 2.77 | |
| P01011 | Alpha-1-antichymotrypsin | AACT | 859190000 | 2.71 | |
| P01024 | Complement C3 | CO3 | 813957500 | 2.57 | |
| P02649 | Apolipoprotein E | APOE | 679975000 | 2.15 | |
| P36955 | Pigment epithelium-derived factor | PEDF | 672652500 | 2.12 | |
| P01034 | Cystatin-C | CYTC | 653532500 | 2.06 | |
| P02760 | Protein AMBP | AMBP | 627792500 | 1.98 | |
| P02749 | Beta-2-glycoprotein 1 | APOH | 560445000 | 1.77 | |
| P01023 | Alpha-2-macroglobulin | A2MG | 526075000 | 1.66 | |
| P61626 | Lysozyme C | LYSC | 498212500 | 1.57 | |
| P0C0L5 | Complement C4-B | CO4B | 496745000 | 1.57 | |
| P51654 | Glypican-3 | GPC3 | 382685000 | 1.21 | |
| P02753 | Retinol-binding protein 4 | RET4 | 363022500 | 1.15 | |
| P02763 | Alpha-1-acid glycoprotein 1 | A1AG1 | 331710000 | 1.05 | |
| Q08830 | Fibrinogen-like protein 1 | FGL1 | 243105000 | 0.77 | |
| P16870 | Carboxypeptidase E | CBPE | 236250000 | 0.75 | |
| P05121 | Plasminogen activator inhibitor 1 | PAI1 | 214605000 | 0.68 | |
| Q08380 | Galectin-3-binding protein | LG3BP | 195722250 | 0.62 | |
| P08697 | Alpha-2-antiplasmin | A2AP | 193182750 | 0.61 | |
| O95445 | Apolipoprotein M | APOM | 170078750 | 0.54 | |
| P05546 | Heparin cofactor 2 | HEP2 | 169633750 | 0.54 | |
| P05154 | Plasma serine protease inhibitor | IPSP | 167712250 | 0.53 | |
| P07858 | Cathepsin B | CATB | 167710250 | 0.53 | |
| P02652 | Apolipoprotein A-II | APOA2 | 159891350 | 0.50 | |
| P06396 | Gelsolin | GELS | 157569250 | 0.50 | |
| P10646 | Tissue factor pathway inhibitor | TFPI1 | 156584750 | 0.49 | |
| P30086 | Phosphatidylethanolamine-binding protein 1 | PEBP1 | 153822500 | 0.49 | |
| P61769 | Beta-2-microglobulin | B2MG | 150395750 | 0.47 | |
| P00738 | Haptoglobin | HPT | 147916750 | 0.47 | |
| P11021 | Endoplasmic reticulum chaperone BiP | BIP | x | 139597250 | 0.44 |
| P23284 | Peptidyl-prolyl cis-trans isomerase B | PPIB | 134877500 | 0.43 | |
| P10909 | Clusterin | CLUS | 134223250 | 0.42 | |
| P20142 | Gastricsin | PEPC | 131868250 | 0.42 | |
| P10451 | Osteopontin | OSTP | 129970500 | 0.41 | |
| P00734 | Prothrombin | THRB | 127123250 | 0.40 | |
| P02751 | Fibronectin | FINC | 120668000 | 0.38 | |
| P00450 | Ceruloplasmin | CERU | 117001250 | 0.37 | |
| P19652 | Alpha-1-acid glycoprotein 2 | A1AG2 | 111402750 | 0.35 | |
| P00751 | Complement factor B | CFAB | 108606250 | 0.34 | |
| P07339 | Cathepsin D | CATD | 104733250 | 0.33 | |
| P01031 | Complement C5 | CO5 | 100732500 | 0.32 | |
| Q15582 | Transforming growth factor-beta-induced protein ig-h3 | BGH3 | 95466000 | 0.30 |
| PHH 691 prot. | HepG2 745 prot. | ||
| Term ID | Term Name | adj. p-value | adj. p-value |
| KEGG:04979 | Cholesterol metabolism | <0.0001 | <0.0001 |
| KEGG:04610 | Complement and coagulation cascades | <0.0001 | <0.0001 |
| KEGG:04141 | Protein processing in endoplasmic reticulum | <0.0001 | <0.0001 |
| KEGG:00280 | Valine, leucine and isoleucine degradation | <0.0001 | 0.0020 |
| KEGG:00603 | Glycosphingolipid biosynthesis-globo and isoglobo series | - | 0.0216 |
| KEGG:00520 | Amino sugar and nucleotide sugar metabolism | 0.0176 | - |
| KEGG:00330 | Arginine and proline metabolism | 0.0185 | - |
| KEGG:00410 | Beta-alanine metabolism | 0.0183 | - |
| KEGG:00071 | Fatty acid degradation | 0.0107 | - |
| PHH 64 prot. | HepG2 101 prot. | ||
| Term ID | Term Name | adj. p-value | adj. p-value |
| KEGG:00472 | D-Arginine and D-ornithine metabolism | 0.0489 | - |
| KEGG:00340 | Histidine metabolism | 0.0489 | - |
| KEGG:00072 | Synthesis and degradation of ketone bodies | 0.0202 | - |
| KEGG:00601 | Glycosphingolipid biosynthesis-lacto and neolacto series | - | 0.0010 |
© 2019 by the authors. Licensee MDPI, Basel, Switzerland. This article is an open access article distributed under the terms and conditions of the Creative Commons Attribution (CC BY) license (http://creativecommons.org/licenses/by/4.0/).
Share and Cite
Franko, A.; Hartwig, S.; Kotzka, J.; Ruoß, M.; Nüssler, A.K.; Königsrainer, A.; Häring, H.-U.; Lehr, S.; Peter, A. Identification of the Secreted Proteins Originated from Primary Human Hepatocytes and HepG2 Cells. Nutrients 2019, 11, 1795. https://doi.org/10.3390/nu11081795
Franko A, Hartwig S, Kotzka J, Ruoß M, Nüssler AK, Königsrainer A, Häring H-U, Lehr S, Peter A. Identification of the Secreted Proteins Originated from Primary Human Hepatocytes and HepG2 Cells. Nutrients. 2019; 11(8):1795. https://doi.org/10.3390/nu11081795
Chicago/Turabian StyleFranko, Andras, Sonja Hartwig, Jörg Kotzka, Marc Ruoß, Andreas K. Nüssler, Alfred Königsrainer, Hans-Ulrich Häring, Stefan Lehr, and Andreas Peter. 2019. "Identification of the Secreted Proteins Originated from Primary Human Hepatocytes and HepG2 Cells" Nutrients 11, no. 8: 1795. https://doi.org/10.3390/nu11081795