Dietary Patterns and Quality of Life in Older Adults: A Systematic Review
by
 ,
,
Thara Govindaraju
1, 
Berhe W. Sahle
1,
Tracy A. McCaffrey
2,
John J. McNeil
1 and
Alice J. Owen
1,* 
1
Department of Epidemiology and Preventive Medicine, Monash University, Melbourne 3004, Australia
2
Department of Nutrition, Dietetics and Food, Monash University, Clayton 3168, Australia
*
Author to whom correspondence should be addressed.
Nutrients 2018, 10(8), 971; https://doi.org/10.3390/nu10080971
Submission received: 21 June 2018
/
Revised: 19 July 2018
/
Accepted: 23 July 2018
/
Published: 26 July 2018
Abstract
:Dietary patterns may be related to quality of life (QoL) of older adults, although evidence from literature is conflicting. The demographic shifts toward ageing populations in many countries increases the importance of understanding the relationship between diet and QoL in older adults. This review was designed to investigate associations between dietary patterns and QoL in older adults. The systematic review followed the Preferred Reporting Items for Systematic Reviews and Meta-Analyses (PRISMA) guidelines. Eight electronic databases were searched to identify articles published in English from January 1975 to March 2018 that investigated associations between dietary patterns and QoL in older adults. Relevant studies were identified based on set inclusion and exclusion criteria, data were extracted and analysed to examine the relationships and possible implications for public health recommendations. The systematic review included 15 articles (One randomized control trial, six prospective cohorts and eight cross sectional). The studies looked at correlations between different dietary patterns and/or adherence to particular dietary patterns and self-reported QoL or self-rated health status. Excluding two studies which showed no significant association, healthy dietary patterns were associated with better self-rated health and QoL in one or more domains, and adherence to healthy dietary patterns like the Mediterranean diet were significantly associated with improvement in at least one of the QoL domains.
1. Introduction
The world population is ageing, and with this, interest in understanding what constitutes healthy ageing is growing. Globally, the population of people aged 60 years and above is expected to double by 2050 reaching 2.1 billion from its current number of 1.4 billion in 2015 [1]. While advances in health care and medicine have increased lifespan, the focus now is on ensuring life years gained are productive and healthy both for older adults and the society in which they live.
Finding ways to improve quality of life as life span increases continues to be a challenge for ageing research. The World Health Organization (WHO) defines quality of life (QoL) as “the individual’s perception of his/her position in life, within the context of culture and value systems in which he/she lives and in relation to his/her objectives, expectations, standards and concerns” [2]. QoL is both subjective and objective in nature, and is often categorized into the five dimensions of physical wellbeing, material wellbeing, social wellbeing, emotional wellbeing, and development and activity [3] and is typical of the living situations of the subjects in question [4]. QoL measures subjective perception of health against the objective assessments of functioning and/or health status, making it unique in a way that two individuals with identical health status can have different QoL, based on their expectation, and resilience towards health or illness, socio economic status, age and social support [5,6,7]. QoL is measured through either generic or idiopathic questionnaires which mainly differ in domains covered, focus on objective as against subjective, self or proxy report and finally the population in question. With use of detailed questionnaires like Short form-12 (SF12) [8] and Short form-36 (SF36) [9], QoL provides a measure of general wellbeing, including both positive and negative features of life, and is an important measure of successful or healthy ageing. Studies have also looked at QoL in the aged population as a means to evaluate health care options especially for subjects with chronic or disabling diseases [10,11]. With increased reliance on patient-reported measures to validate clinical endpoints, QoL serves as an important marker in assessing health status.
QoL in older adults is also likely to be influenced by social aspects including living situations [12], economic dependence [13], age-related physical limitations [14,15] and lifestyle factors including physical activity [16], diet and nutrition [17,18]. Studies have found an Okinawan-based Nordic diet to be associated with better QoL [19]; Red meat, pastries and fast food-based “Western” dietary pattern to have a negative association [20]; and diets like the Mediterranean diet, which have been well researched, to have mixed results [21,22].
Nutrition is an important and readily modifiable risk factor for disease prevention, and studies have consistently shown a relationship between diet and health including in older adults [23,24]. However, diet is a complex construct, and recent research has focused upon dietary patterns as a means to examine the impact of diet on health outcomes at population level [25,26]. Dietary patterns are defined as “the quantities, proportions, variety or combinations of different foods and beverages in diets, and the frequency with which they are habitually consumed” [27], and present the opportunity to account for the complex interactions between foods while measuring the total usual intake of food combinations in individuals and groups [28,29]. With the ongoing development of methods used to assess dietary patterns, including empirical approaches, dietary patterns are now being considered as a basis for dietary guidelines and United States Department of Agriculture recently commissioned a review to understand the evidence for dietary patterns and the associated health outcomes [30]. Traditionally, a priori methods have been used to evaluate dietary patterns. These are indices assessing adherence to established diets based on national guidelines (e.g., Healthy Eating Index) or scientific relevance (e.g., Mediterranean diet). An empirical approach focusing on deriving dietary patterns based on statistical methods like principal component analysis or cluster analysis is another alternative [25]. Both aforementioned approaches have been employed to examine dietary patterns in relation to health outcomes across a range of age groups. Studies have shown adherence to Mediterranean diets to be associated with reduced risk of cardiovascular events [31] and the Dietary Approaches to Stop Hypertension (DASH) diet to influence hypertension and chronic kidney diseases [32,33]. Although dietary patterns identified in each study may be different, some key characteristics of the healthy dietary pattern—high consumption of vegetables, fruits and whole grains, legumes, seafood and low consumption of sweetened foods, refined grains and processed meat—have been proposed to be associated with positive health benefits [34,35]. The role of dietary patterns such as the “Western” diet, characterised by increased consumption of refined foods and saturated fat along with fewer foods from the fruits and vegetable group have also been examined, for healthy factors such as immunity [36], asthma [37] and chronic diseases [38,39,40]. The INTERHEART study examining the relationship between dietary patterns and acute myocardial infarction (AMI) in 52 countries throughout Africa, Asia, Australia, Europe, the Middle East, and North and South America, similarly found “Prudent” diet rich in fruits and vegetables had a protective effect, whereas the highest quartile of “Western” diet characteristics of high fat, salt and meat intake had an adverse effect on AMI across different country settings [41].
Diet intake, and subsequently nutritional status, have been reported to be poor in some older cohorts [42,43,44,45,46,47,48] with migration, living arrangements, loss of loved ones, being unemployed and a lack of social network all leading to changes in diet quality [44,49,50]. Bereavement and a resulting loss of appetite may become more apparent during meal times most likely shared with the lost companion, [51,52] and widowed subjects have been shown to have a lowered quality of diet [52,53]. Dietary adequacy among older adults has been shown to be associated with social network status [54] and financial independence [47,48]. In addition, older adults have been reported to consume less than the recommended intake of fruits and vegetables [55], making them predisposed to the onset of chronic diseases as age advances. It is important to note that dietary patterns in older adults evolve depending on health, psycho-somatic and social conditions, and hence, consideration of these is important to determining the impact of dietary intake on QoL in older adults.
While some studies have examined the association of dietary patterns with hard health outcomes including cardiovascular events, stroke, dementia and mortality, studies examining the associations between dietary patterns and QoL are limited. QoL has mostly been measured in people with diagnosed health conditions [56,57,58,59]; however, examination of this among healthy subjects is increasing. Studying QoL in healthy older adult populations may be especially important as it might have implications on our understanding of healthy ageing, and inform strategies for maintaining health in older years. The limited number of studies that have attempted to measure dietary patterns in relation to QoL have shown that adherence to healthy patterns may have beneficial effects on QoL in women [60] and in older adults [20]. The aim of this review was to evaluate evidence of the association between dietary patterns and QoL in older adults, with the intention of providing a better understanding of the potential for dietary patterns to improve QoL.
2. Methods
2.1. Search Strategy
Articles were retrieved from eight electronic databases—Medline, Embase, Psychinfo through on the Ovid platform (Ovid technologies Inc., Wolter’s Kluwer, New York, NY, USA) Cochrane through Wiley, Cinhal plus and Ageline through Ebscohost, Web of Sciences and Scopus. Manual searching was done using the “related citations” and bibliography searches of the chosen articles.
The search used three groups of keywords—“older adults”, dietary patterns” and “quality of life” and their respective synonyms. The search string was developed for Medline through Ovid platform, and this was adapted for the other remaining six databases. Search strategy employed with Medline is attached as Supplement 1. Peer-reviewed journals were searched for articles from January 1975 to March 2018 restricting the search to those published in English, conducted in adults with a mean age of 60 exploring associations between dietary patterns and QoL through validated methods.
Author T.G. retrieved articles, removed duplicates and screened the articles based on title and abstract and shortlisted articles for full text review with the help of reference management software Endnote (version 8, Clarivate Analytics, Philadelphia, PA, USA). Both Reviewers T.G. and B.W.S. then screened the full text based on eligibility criteria. Both the reviewers extracted data individually and all inconsistencies were verified and resolved by discussion.
2.2. Inclusion and Exclusion Criteria
All studies which had subjects with the mean age of 60 years, in any setting, were included. Studies done across age groups were considered if stratified results were available for ages 60 and above. Considering that the target population of the review was older adults, “being healthy” and “absence of disease” was difficult to define and hence studies done in both healthy and diseased subjects were included in the review. QoL as measured by any validated measure including but not limited to SF-12, SF-36, World Health Organization Quality of Life (WHOQOL), European Quality of Life scale (EUROQOL)were considered. Dietary intake data collected through food frequency questionnaires and diet history, including 24 h recall methods, both paper-based and online-based were included in the study. Studies that were reviews, case reports or not peer reviewed were excluded from the review.
2.3. Data Extraction
Data were extracted in a standard form by both the reviewers independently. The extracts were compared and any difference was verified and resolved through consensus. The extract comprised information regarding general details (title, authors, reference/source, country, and year of publication), study details (name, design, setting, eligibility criteria, sample size and duration) participants (age, gender, ethnicity and health status), and results (type of analysis, outcome measures, time points of data collection, primary results, author conclusions).
2.4. Overall Quality of Studies
Quality assessment of the studies included in the review was performed using Effective Public Health Practice project (EPHPP) developed “Quality Assessment Tool for Quantitative Studies”. The tool has been validated [61] and compared to other instruments and has been found to be reliable and consistent [62]. The tool assesses the studies based on six components—selection bias, study design, confounder, blinding, data collection methods and withdrawals and dropouts. The individual components were rated as strong, moderate or weak based on the quality assessment tool for quantitative studies dictionary and a final global rating for the paper is given based on the individual component ratings. The paper was rated strong if there were no weak ratings, rated moderate if there was one weak rating and rated weak if there was more than one weak rating. Both reviewers rated the study independently and discussed the ratings. All differences were discussed and an agreement was reached.
3. Results
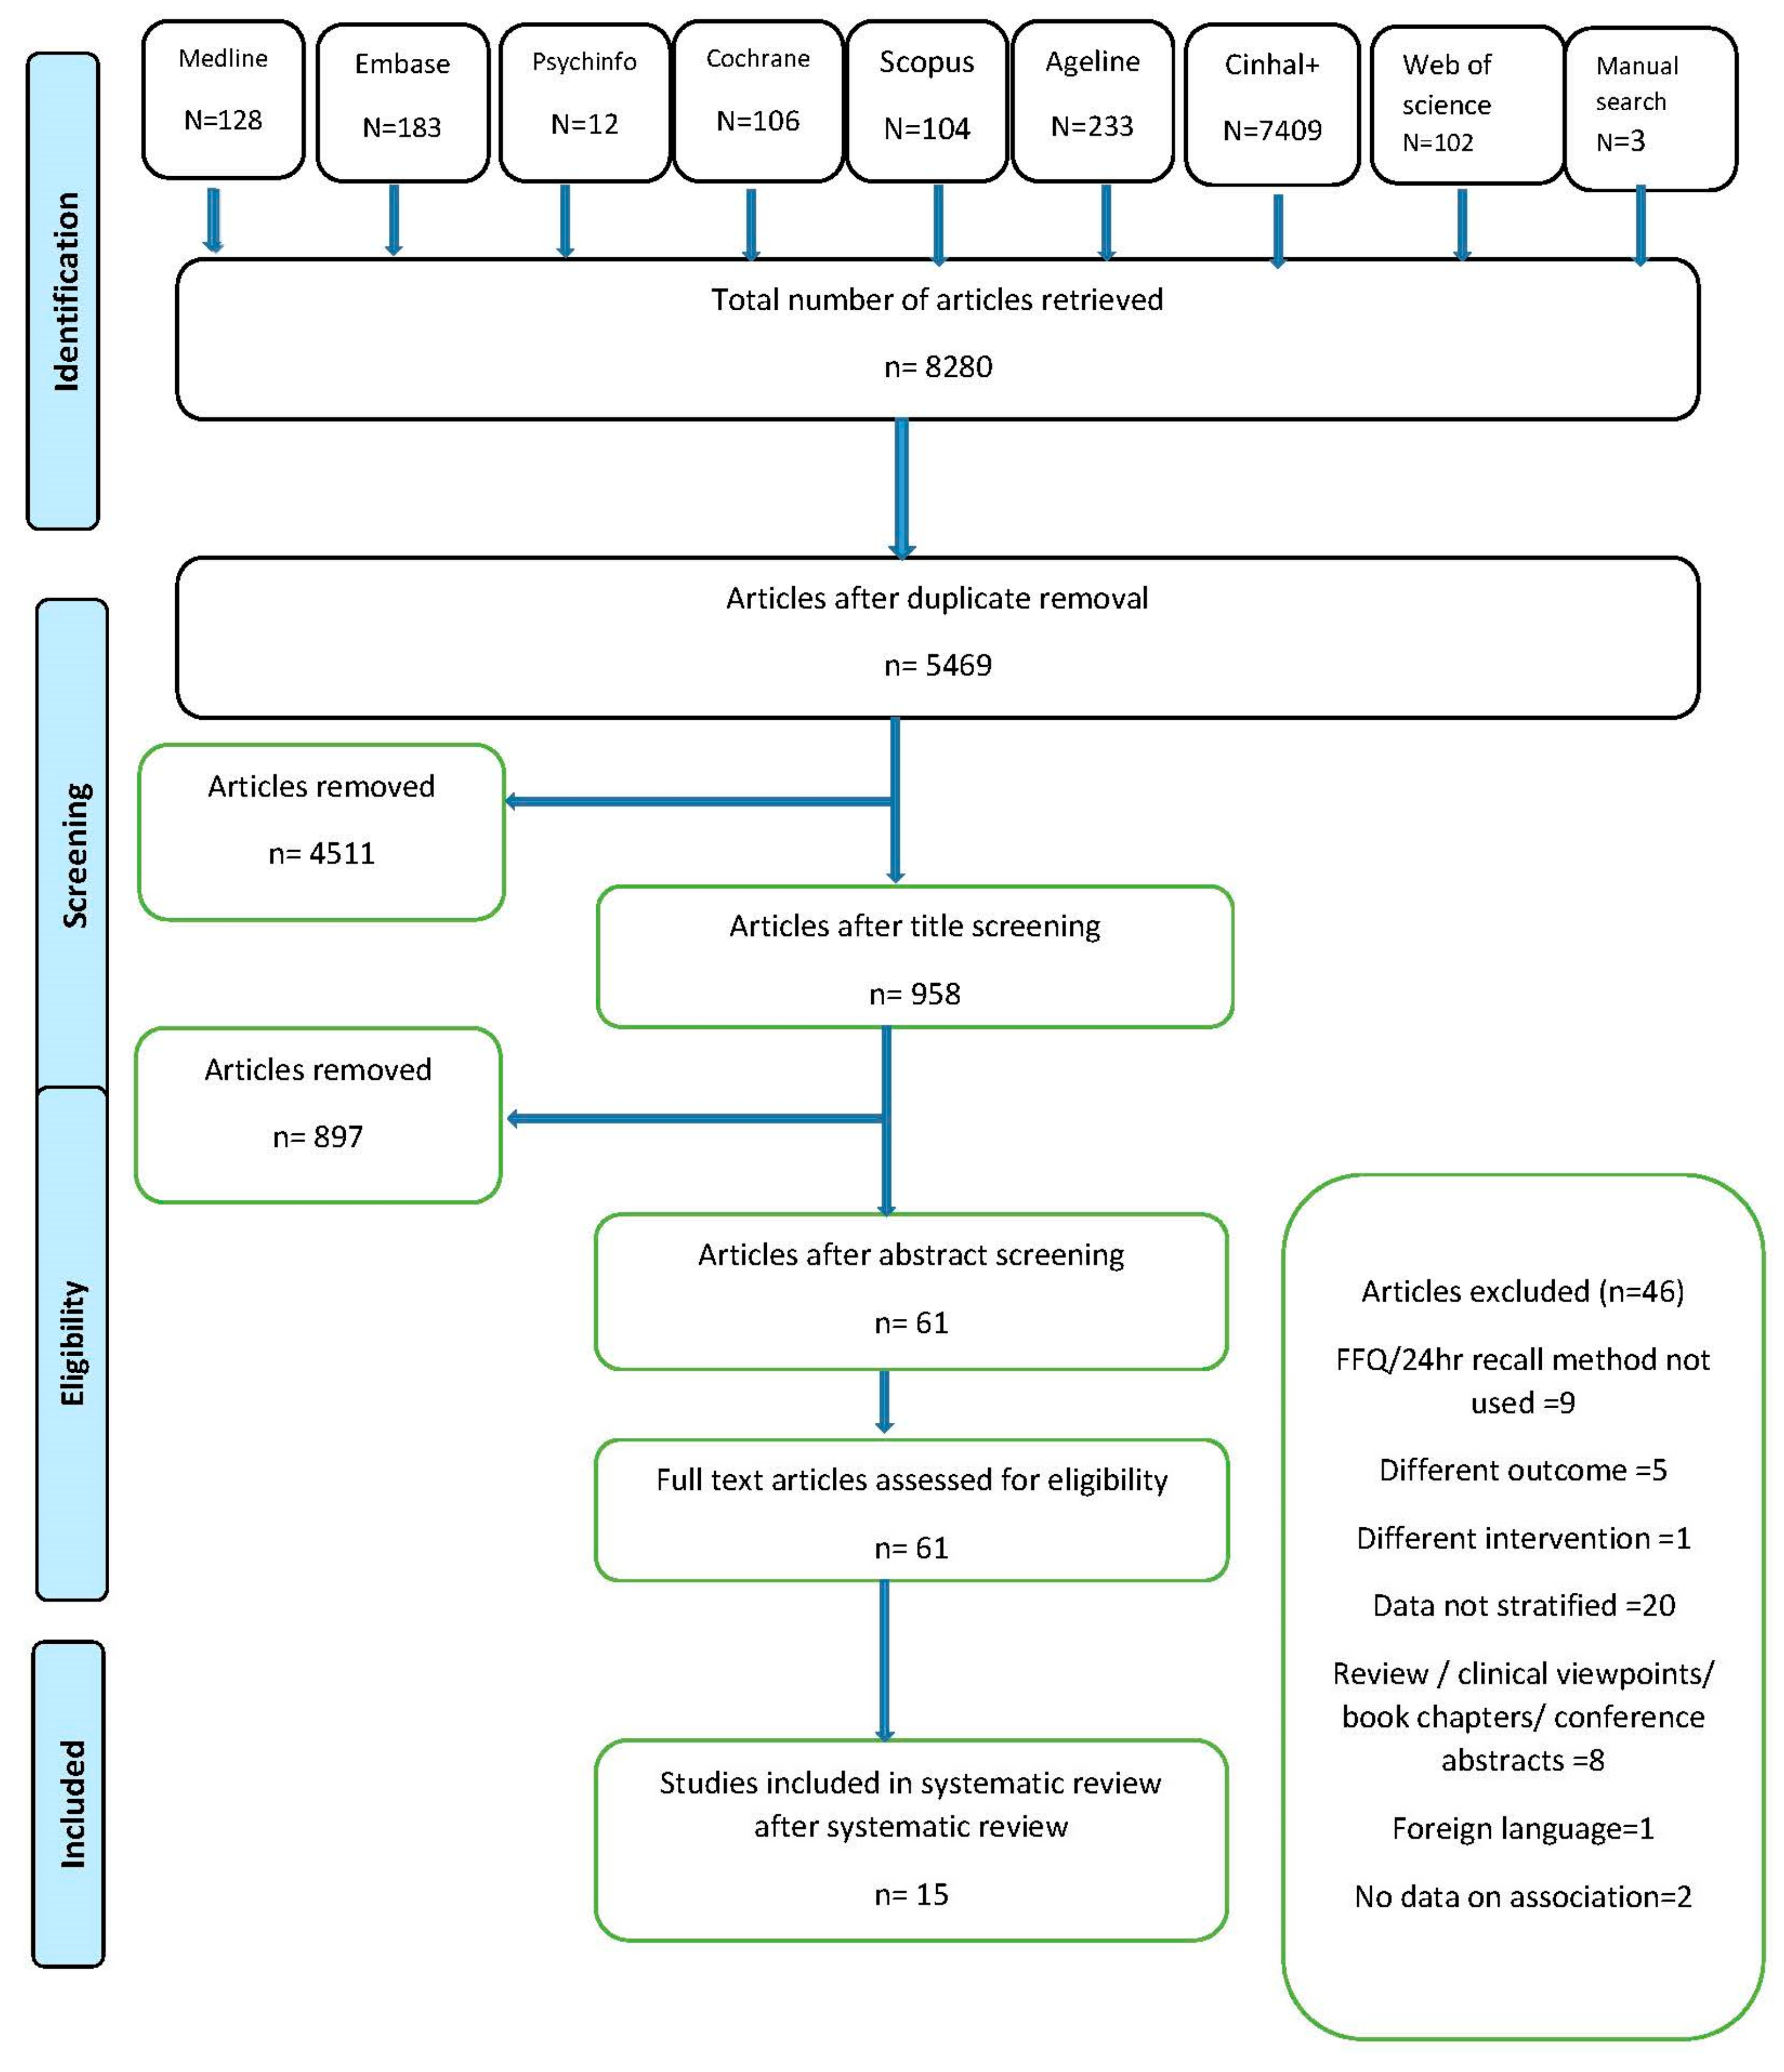
The review followed PRISMA guidelines for systematic review reporting [63] and was registered with PROSPERO, international prospective register of systematic reviews (CRD42017068407). Figure 1 depicts the PRISMA flowchart [64] for the study. A total of 8280 articles from eight electronic databases and a further three from manual searching were retrieved. About 2811 duplicates were removed and the remaining articles were screened based on the title. A total of 958 articles were found to be eligible for abstract screening and 61 articles qualified for the full text review. Forty-six articles had to be excluded from the review for not meeting the inclusion—exclusion criteria of which 20 had results that were not and could not be age stratified, nine did not use dietary measures defined in inclusion criteria, five recorded different outcomes, one used dietary pattern as a component of larger intervention, one did not investigate association with outcome, one was published in foreign language and the rest were in the form of clinical views, conference papers and reviews and were thus excluded. Efforts were made to contact authors of eligible studies without stratified results, but were unsuccessful in procuring data for the target age group. A total of 15 articles were included in the final review.
There were a total of six prospective cohort studies, eight cross-sectional studies and one randomised controlled trial (RCT) identified. Table 1 describes the characteristics of the studies included in the review. Papers where cross-sectional data were derived from longitudinal studies were considered cross sectional. Seven of the studies were conducted in European countries; four in USA; one multicentre study with participants in USA, UK and Canada; one in Hong Kong; and two in Australia. The RCT [65] with 48 participants had the lowest sample size, six studies had a sample size of <1000, four studies had sample size between 1000 and 3000 and the rest had a sample size of >3000 subjects.
The studies measured the association of dietary patterns derived from a priori dietary indexing methods or empirical approaches or both with QoL in older adults. While nine studies [21,66,68,71,73,74,75,76,77] measured baseline association between dietary patterns and QoL, four studies measured diet at baseline and QoL at both baseline and/or follow up [22,67,70,72], one study measured both diet and QoL at multiple points in the study [69] and one study measured the association of change in dietary patterns made in relation to a chronic disease diagnosis and its impact on QoL [72]
Most studies measured QoL using standard questionnaire-based measures of SF-12 or the longer version SF-36, with two studies [67,77] using the self-rated health status. Studies using SF-12 or SF-36, also reported physical composite scores (PCS) and mental composite scores (MCS) along with mean scores for eight identified domains. Two studies used validated Spanish versions of the SF-12 and SF-36 [22,74], one used Health and Activity Limitation Index (HALEX) [76], and one used RAND 36. Some studies used disease-specific QoL questionnaires including the European Organisation for Research and Treatment of Cancer—Quality of Life questionnaire (EORTC-QLQ-C30) [68], Audit of Diabetes Dependent Quality of Life (ADDQOL-19) [73] and Minnesota Living with Heart Failure Questionnaire [65]. One study used SF-36 alongside Functional Assessment of Cancer Therapy-Colorectal (FACT-C) [69].
Dietary assessment methodology also varied between studies with 10 studies using food frequency questionnaires (FFQs) of varying versions, two studies measuring modified versions of diet history [67,72], one measuring 24 h recall [75], one a dietary screening tool (DST) [76], and one assessing multiple measures of diet including a computerised diet history and a FFQ [22].
Almost all studies used dietary indices to derive dietary patterns with only one study deriving patterns using statistical approaches [77]. Indices used varied from those developed to measure adherence to Mediterranean diet, national or international guidelines, food variety and diversity and compliance to specific diets such as DASH with three studies using multiple indices [22,70,74]. The indices used included Diet Quality Index (DQI) [74] and DQI-International [66], Healthy Eating Index (HEI05) [75,76], DASH diet index score [65], with some studies [22,68] developing their own unique indices
Of the studies that measured adherence to Mediterranean diet, four [22,67,70,71] used Mediterranean diet score (MDS) by Trichopoulou et al. [78] or modified versions thereof one [22] used PREDIMED score [79], one [21] used adherence to Mediterranean diet (aMED) [80] and one [73] used relative Mediterranean diet score (rMED) [81].Of the studies that measured adherence to dietary guidelines, two [69,70] were based on Australian national guidelines [82] and one [65] on the DASH diet index score [83]
Most studies included in the review were rated as moderate quality studies with one study rated as weak and four studies rated as high quality studies, mostly based on study design and drop outs. All cross-sectional studies scored lower for study design, based on the tool guideline. Studies included validated measures of diet and QoL and this information was available for most studies in the article, or in the cited literature. Almost all studies reported a number of withdrawal and dropout rates. The reviewer ratings for each of the studies is attached as supplement 2.
In summary, 13 out of the 15 studies included in the review found dietary patterns are associated with QoL in older adults. The two studies that did not find any association with QoL were both longitudinal studies conducted in older Europeans with existing comorbidities and measured health status in relation to a high quality diet like the Mediterranean diet, and were not dissimilar to the studies with significant association [22,67]. All the studies specifically involving subjects with chronic diseases or at risk of chronic diseases found higher QoL scores with better diet quality [65,68,72,73,75]. The heterogeneity in assessment methods used and study designs did not allow the data to be synthesised by meta-analysis.
4. Discussion
This review supports the existence of an association between dietary patterns influence and QoL in older adults. The majority of the studies (87%) included in this review found that subjects with higher diet quality had higher mean scores on QoL scale, with the exception of two studies (13%) reporting no association. Most of the studies have been conducted in developed countries and in older adults with existing co-morbidities. Although the results have been consistent across studies using a variety of validated instruments to assess diet and QoL, the lack of randomised trials in a healthy older adult population mandates exercising caution in generalising these results, as reverse causation cannot be excluded.
Of the studies reporting positive association, higher quality diets were shown to be associated with better QoL in five studies [65,66,70,71,74] and greater adherence to Mediterranean diet in three [21,73,76]. Gopinath et al. [69] found that among older adults with higher baseline diet scores, greater QoL was seen across three domains prospectively over 5 years. Another study [71] prospectively examining the relationship between dietary patterns through multiple indices found positive associations between diet quality and five domains of QoL and PCS when using dietary guideline index (DGI), and four domains of QoL with Recommended Food Score (RFS). Apart from this, associations were also found between adherence measured through MDS and general health and vitality domains.
With increasing interest in a ’whole diet’ approach to understanding the relationship between diet and health, reviews have investigated associations between dietary patterns and depression [84], colorectal cancer [85], breast cancer risk [86] and other outcomes including nutrient adequacy, biological outcomes, morbidity and mortality [87]. There is a paucity of studies examining the association between dietary patterns and QoL in older adults. One other detailed review [88], although not entirely focused on QoL and including studies with slightly younger cohorts (>45 years), has looked at the impact of dietary patterns on QoL as a component of ‘successful aging’. That review found the majority of studies reported an association between a healthier dietary pattern and better health outcomes, but the review herein has been the first to our knowledge to examine the relationships between dietary patterns on QoL in older adults.
Subjects with intermediate cardiovascular risk (defined as 5–15% 10-year risk of developing cardiovascular disease) showed mental health scores positively associated with diet quality and higher scores on Mental Composite Scores (MCS), social functioning and vitality with greater adherence to Mediterranean diet [74]. A study by Lewis et al. [72] measuring the impact of dietary changes post-cancer diagnosis, found that subjects who made healthful dietary changes had significant improvements in PCS and functional wellbeing. In older adults with heart failure, adherence to the DASH diet was found to be associated with improved QoL scores at 3 months [65]. Samieri et al. [77] derived sex-specific dietary patterns using statistical approaches and reported that men in the “pasta eaters” cluster and women in “ biscuits and snacking “ cluster were more likely to report poor perceived health. In that study, five different dietary patterns were derived for men and women each using hybrid clustering methods, the clusters being based on average weekly servings. Two studies examined diet as a component of lifestyle score, and one [75] found that a lifestyle score including BMI < 30 kg/m2, healthy diet, moderate recreational activities and non-smoking status was related to gHRQoL among colorectal cancer survivors. This finding was supported by a study which found that health status was associated with both physical activity and non-smoking status, even when diet was not [67].These results might indicate a role for overall lifestyle modification in improving the QoL, as opposed to the focus on diet alone. While studies have investigated the role of lifestyle factors including diet, physical activity, and smoking among others, such studies were excluded owing to heterogeneity and complexity of the assessments involved in those studies. The authors acknowledge that the combined effect of lifestyle factors is an interesting area worthy of further research.
Among the 13% of studies contributing to the present review that found no association between diet and QoL, Perez-Tasigchana et al. [22] used multiple indices to measure adherence and found that while PREDIMED scores were linked to a slightly better PCS, there was no relationship between Mediterranean Diet Score and any of the QoL domains. The studies were conducted 10 years apart and both the cohorts used different instruments to measure diet and QoL, and obtained consistent results. Haveman-Nies et al. [67] in their longitudinal study, used a modified Mediterranean score and measured self-rated health and noted that having a high quality diet did not delay the deterioration in self-rated health status as measured through baseline, mid-point and end of follow up.
Despite growing interest in dietary patterns and their measurement through empirical approaches, only one study used cluster analysis to derive dietary patterns making dietary indices still the popular measure to derive diet quality. The scoring methodology and the data used to generate the score differ from study to study, for the lack of standardised procedures. Guideline-based indices like DQIs are mostly country-specific and are not valid for all countries. The components vary across indices with HEI [89] comprising of nine adequacy components and three moderation components, DQI [90] and DQI-I [91], both comprising of four components—adequacy, variety, moderation and overall balance, with scores based on grams/day, frequency or number of servings or daily allowances. Further research, especially from longitudinal studies with older adults on diet and QoL, is needed. Studies with dietary patterns derived from statistical approaches, might help address issues related to guideline-based dietary indices. Empirical approaches, though they have their limitations, might be better in identifying relatable food groups or similar populations. Mediterranean diets were still the most commonly studied diet pattern in our review, followed by diets based on national guidelines with one study assessing disease-based diet compliance with the DASH diet.
Strengths and Limitations of This Study
This review is a broad analysis of association between dietary patterns and QoL in older adults, and included studies from 1975, covering even the initial publications concerning “dietary patterns”. The protocol of this review was registered in PROSPERO and followed the Preferred Reporting Items for Systematic Reviews and Meta-Analyses guidelines. The methodological quality of studies was assessed by Effective Public Health Practice Project (EPHPP) tool and we anticipate that the results of the review can inform public health practice and policies regarding diet in older adults for a better QoL.
The review combines both healthy and diseased populations for the lack of data in healthy older adults. This may limit extrapolation to the entire older adult population, although we believe that results will not be too dissimilar, considering co-morbidities are common in this age group. The study included articles published in English only and hence could have lost research of consequence published in other languages. The studies included in the review are largely observational studies, with more than half the studies being cross sectional and cannot be used to imply causality. Lastly, the review might be liable to the inherent bias that is associated with self-reported measures of diet and QoL, in addition to well described random and systemic errors in epidemiological-scale dietary assessment [92].
5. Recommendations
Studies looking at the relationship between QoL and dietary patterns in older adults are few and lacking in quality. Results from large, well conducted longitudinal studies are required to better understand the relationship between dietary patterns and QoL among older adults. Also lacking are the sensitive tools to measure diet and QoL, and their respective validations in older adult populations. Very few studies use FFQs and diet diaries specifically validated in elderly populations [93], mostly relying upon validations done in general populations [94]. When dietary assessment tools are validated among older adults, they are thought to produce relatively accurate results [95,96] although they may underestimate intake [97]; however, questions remain regarding the participant burden from these tools in populations which may be experiencing diminishing cognitive and physical abilities. The most popular tools that measure QoL make no effort to capture the dietary behaviours, and this needs to be considered for future research [98,99]. Considering the growing proportion of older people in many countries around the globe, and the imperative to maintain QoL in older age, developing and validating tools that can accurately measure QoL and its determinants, including diet, are of great public health relevance.
Supplementary Materials
The following are available online at https://www.mdpi.com/2072-6643/10/8/971/s1, Table S1: Search Strategy, Table S2: Quality of Studies.
Author Contributions
T.G., A.J.O., T.A.M., J.J.M. contributed to the conceptualization and methodology of the study. T.G. performed the literature search and T.G. and B.W.S. screened the studies based on eligibility criteria. T.G. wrote the draft manuscript with inputs from A.J.O., T.A.M. and J.J.M. All the authors reviewed and approved the final manuscript.
Funding
This research received no external funding.
Acknowledgments
This research has been conducted with the support of the Australian Government Research Training Program Scholarship.
Conflicts of Interest
The authors declare no conflict of interest.
References
- United Nations, Department of Economic and Social Affairs, Population Division. World Population Ageing 2015; (ST/ESA/SER.A/390); United Nations: New York, NY, USA, 2015. [Google Scholar]
- World Health Organization. Whoqol-Bref: Introduction, Administration, Scoring and Generic Version of the Assessment; Programme on Mental Health, World Health Organization: Geneva, Switzerland, 1996. [Google Scholar]
- Felce, D.; Perry, J. Quality of life: Its definition and measurement. Res. Dev. Disabil. 1995, 16, 51–74. [Google Scholar] [CrossRef]
- Dimenas, E.S.; Dahlof, C.G.; Jern, S.C.; Wiklund, I.K. Defining quality of life in medicine. Scand. J. Prim. Health Care 1990, 1 (Suppl.), 7–10. [Google Scholar]
- Rubin, R.R.; Peyrot, M. Quality of life and diabetes. Diabetes Metab. Res. Rev. 1999, 15, 205–218. [Google Scholar] [CrossRef] [Green Version]
- Campos, A.C.; Ferreira, E.F.; Vargas, A.M.; Albala, C. Aging, Gender and Quality of Life (AGEQOL) study: Factors associated with good quality of life in older Brazilian community-dwelling adults. Health Qual. Life Outcomes 2014, 12, 166. [Google Scholar] [CrossRef] [PubMed]
- Kim, H.K.; Hisata, M.; Kai, I.; Lee, S.K. Social support exchange and quality of life among the Korean elderly. J. Cross Cult. Gerontol. 2000, 15, 331–347. [Google Scholar] [CrossRef] [PubMed]
- Gandek, B.; Ware, J.E.; Aaronson, N.K.; Apolone, G.; Bjorner, J.B.; Brazier, J.E.; Bullinger, M.; Kaasa, S.; Leplege, A.; Prieto, L.; et al. Cross-validation of item selection and scoring for the sf-12 health survey in nine countries: Results from the IQOLA project. International quality of life assessment. J. Clin. Epidemiol. 1998, 51, 1171–1178. [Google Scholar] [CrossRef]
- Ware, J.E., Jr.; Sherbourne, C.D. The mos 36-item short-form health survey (SF-36). I. Conceptual framework and item selection. Med. Care 1992, 30, 473–483. [Google Scholar] [CrossRef] [PubMed]
- Alexandre, T.D.S.; Cordeiro, R.C.; Ramos, L.R. Factors associated to quality of life in active elderly. Revista de Saúde Pública 2009, 43, 613–621. [Google Scholar] [CrossRef] [Green Version]
- Pearlman, R.A.; Uhlmann, R.F. Quality of life in chronic diseases: Perceptions of elderly patients. J. Gerontol. 1988, 43, M25–M30. [Google Scholar] [CrossRef] [PubMed]
- Addington-Hall, J.; Kalra, L. Who should measure quality of life? BMJ 2001, 322, 1417–1420. [Google Scholar] [CrossRef] [PubMed]
- Tajvar, M.; Arab, M.; Montazeri, A. Determinants of health-related quality of life in elderly in Tehran, Iran. BMC Public Health 2008, 8, 323. [Google Scholar] [CrossRef] [PubMed]
- Dalton, D.S.; Cruickshanks, K.J.; Klein, B.E.K.; Klein, R.; Wiley, T.L.; Nondahl, D.M. The impact of hearing loss on quality of life in older adults. Gerontologist 2003, 43, 661–668. [Google Scholar] [CrossRef] [PubMed]
- Locker, D.; Matear, D.; Stephens, M.; Jokovic, A. Oral health-related quality of life of a population of medically compromised elderly people. Community Dent. Health 2002, 19, 90–97. [Google Scholar] [PubMed]
- Bize, R.; Johnson, J.A.; Plotnikoff, R.C. Physical activity level and health-related quality of life in the general adult population: A systematic review. Prev. Med. 2007, 45, 401–415. [Google Scholar] [CrossRef] [PubMed]
- Amarantos, E.; Martinez, A.; Dwyer, J. Nutrition and quality of life in older adults. J. Gerontol. A Biol. Sci. Med. Sci. 2001, 56, 54–64. [Google Scholar] [CrossRef] [PubMed]
- Keller, H.H.; Østbye, T.; Goy, R. Nutritional risk predicts quality of life in elderly community-living Canadians. J. Gerontol. A Biol. Sci. Med. Sci. 2004, 59, M68–M74. [Google Scholar] [CrossRef]
- Darwiche, G.; Höglund, P.; Roth, B.; Larsson, E.; Sjöberg, T.; Wohlfart, B.; Steen, S.; Ohlsson, B. An Okinawan-based Nordic diet improves anthropometry, metabolic control, and health-related quality of life in Scandinavian patients with type 2 diabetes: A pilot trial. Food Nutr. Res. 2016, 60. [Google Scholar] [CrossRef] [PubMed]
- Ruano, C.; Henriquez, P.; Martínez-González, M.Á.; Bes-Rastrollo, M.; Ruiz-Canela, M.; Sánchez-Villegas, A. Empirically derived dietary patterns and health-related quality of life in the sun project. PLoS ONE 2013, 8, e61490. [Google Scholar] [CrossRef] [PubMed]
- Veronese, N.; Stubbs, B.; Noale, M.; Solmi, M.; Luchini, C.; Maggi, S. Adherence to the Mediterranean diet is associated with better quality of life: Data from the osteoarthritis initiative Am. J. Clin. Nutr. 2016, 104, 1403–1409. [Google Scholar] [CrossRef] [PubMed]
- Perez-Tasigchana, R.F.; Leon-Munoz, L.M.; Lopez-Garcia, E.; Banegas, J.R.; Rodriguez-Artalejo, F.; Guallar-Castillon, P. Mediterranean diet and health-related quality of life in two cohorts of community-dwelling older adults. PLoS ONE 2016, 11, e0151596. [Google Scholar]
- Kiefte-De Jong, J.C.; Mathers, J.C.; Franco, O.H. Nutrition and healthy ageing: The key ingredients. Proc. Nutr. Soc. 2014, 73, 249–259. [Google Scholar] [CrossRef] [PubMed]
- Mathers, J.C. Food, nutrition and healthy ageing. Food Sci. Technol. 2013, 27, 34–36. [Google Scholar]
- Hu, F.B. Dietary pattern analysis: A new direction in nutritional epidemiology. Curr. Opin. Lipidol. 2002, 13, 3–9. [Google Scholar] [CrossRef] [PubMed]
- Fung, T.T.; Rimm, E.B.; Spiegelman, D.; Rifai, N.; Tofler, G.H.; Willett, W.C.; Hu, F.B. Association between dietary patterns and plasma biomarkers of obesity and cardiovascular disease risk. Am. J. Clin. Nutr. 2001, 73, 61–67. [Google Scholar] [CrossRef] [PubMed] [Green Version]
- Dietary Guidelines Advisory Committee. Scientific Report of the 2015 Dietary Guidelines Advisory Committee; Departments of Health and Human Services, Ed.; United States Department of Agriculture (USDA): Washington, DC, USA, 2015. [Google Scholar]
- Tucker, K.L. Dietary patterns, approaches, and multicultural perspective, Can we identify culture-specific healthful dietary patterns among diverse populations undergoing nutrition transition? Appl. Physiol. Nutr. Metab. 2010, 35, 211–218. [Google Scholar] [CrossRef] [PubMed]
- McNaughton, S.A. Dietary patterns and diet quality: Approaches to assessing complex exposures in nutrition. Australas Epidemiol. 2010, 17, 35–37. [Google Scholar]
- Evidence Analysis Library Division, Centre for Nutrition Policy and Promotion. A Series of Systematic Reviews on the Relationship between Dietary Patterns and Health Outcomes; 2014. Available online: https://www.cnpp.usda.gov/nutrition-evidence-library-dietary-patterns-systematic-review-project (accessed on 3 March 2018).
- Mohammadifard, N.; Talaei, M.; Sadeghi, M.; Oveisegharan, S.; Golshahi, J.; Esmaillzadeh, A.; Sarrafzadegan, N. Dietary patterns and mortality from cardiovascular disease: Isfahan cohort study. Eur. J. Clin. Nutr. 2017, 71, 252–258. [Google Scholar] [CrossRef] [PubMed]
- Livingstone, K.M.; McNaughton, S.A. Dietary patterns by reduced rank regression are associated with obesity and hypertension in Australian adults. Br. J. Nutr. 2017, 117, 248–259. [Google Scholar] [CrossRef] [PubMed]
- Lee, H.S.; Lee, K.B.; Hyun, Y.Y.; Chang, Y.; Ryu, S.; Choi, Y. Dash dietary pattern and chronic kidney disease in elderly Korean adults. Eur. J. Clin. Nutr. 2017, 71, 755–761. [Google Scholar] [CrossRef] [PubMed]
- Asghari, G.; Yuzbashian, E.; Mirmiran, P.; Hooshmand, F.; Najafi, R.; Azizi, F. Dietary approaches to stop hypertension (dash) dietary pattern is associated with reduced incidence of metabolic syndrome in children and adolescents. J. Pediatr. 2016, 174, 178–184.e171. [Google Scholar] [CrossRef] [PubMed]
- Adriano, L.S.; Sampaio, H.A.; Arruda, S.P.; Portela, C.L.; Melo, M.L.; Carioca, A.A.; Soares, N.T. Healthy dietary pattern is inversely associated with non-alcoholic fatty liver disease in elderly. Br. J. Nutr. 2016, 115, 2189–2195. [Google Scholar] [CrossRef] [PubMed]
- Myles, I.A. Fast food fever: Reviewing the impacts of the Western diet on immunity. Nutr. J. 2014, 13, 61. [Google Scholar] [CrossRef] [PubMed]
- Brigham, E.P.; Kolahdooz, F.; Hansel, N.; Breysse, P.N.; Davis, M.; Sharma, S.; Matsui, E.C.; Diette, G.; McCormack, M.C. Association between Western diet pattern and adult asthma: A focused review. Ann. Allergy Asthma Immunol. 2015, 114, 273–280. [Google Scholar] [CrossRef] [PubMed]
- Danaei, G.; Singh, G.M.; Paciorek, C.J.; Lin, J.K.; Cowan, M.J.; Finucane, M.M.; Farzadfar, F.; Stevens, G.A.; Riley, L.M.; Lu, Y.; et al. The global cardiovascular risk transition: Associations of four metabolic risk factors with national income, urbanization, and western diet in 1980 and 2008. Circulation 2013, 127, 1493–1502. [Google Scholar] [CrossRef] [PubMed]
- O’Dea, K. Diabetes in Australian Aborigines: Impact of the western diet and life style. J. Intern. Med. 1992, 232, 103–117. [Google Scholar] [CrossRef] [PubMed]
- Slattery, M.L.; Potter, J.D.; Ma, K.N.; Caan, B.J.; Leppert, M.; Samowitz, W. Western diet, family history of colorectal cancer, nat2, gstm-1 and risk of colon cancer. Cancer Causes Control 2000, 11, 1–8. [Google Scholar] [CrossRef] [PubMed]
- Iqbal, R.; Anand, S.; Ounpuu, S.; Islam, S.; Zhang, X.; Rangarajan, S.; Chifamba, J.; Al-Hinai, A.; Keltai, M.; Yusuf, S. Dietary patterns and the risk of acute myocardial infarction in 52 countries. Results of the INTERHEART Study. Circulation 2008, 118, 1929–1937. [Google Scholar] [CrossRef] [PubMed]
- Marshall, T.A.; Stumbo, P.J.; Warren, J.J.; Xie, X.-J. Inadequate nutrient intakes are common and are associated with low diet variety in rural, community-dwelling elderly. J. Nutr. 2001, 131, 2192–2196. [Google Scholar] [CrossRef] [PubMed]
- Sharkey, J.R.; Branch, L.G.; Zohoori, N.; Giuliani, C.; Busby-Whitehead, J.; Haines, P.S. Inadequate nutrient intakes among homebound elderly and their correlation with individual characteristics and health-related factors. Am. J. Clin. Nutr. 2002, 76, 1435–1445. [Google Scholar] [CrossRef] [PubMed] [Green Version]
- Ryan, A.S.; Craig, L.D.; Finn, S.C. Nutrient intakes and dietary patterns of older Americans: A national study. J. Gerontol. 1992, 47, M145–M150. [Google Scholar] [CrossRef] [PubMed]
- Ho, S.C.; Donnan, S.; Sham, A. Dietary intake among elderly Chinese in Hong Kong. J. Hum. Nutr. Diet. 1988, 1, 205–215. [Google Scholar] [CrossRef]
- Agarwalla, R.; Saikia, A.M.; Baruah, R. Assessment of the nutritional status of the elderly and its correlates. J. Fam. Community Med. 2015, 22, 39–43. [Google Scholar] [CrossRef] [PubMed]
- Han, Y.; Li, S.; Zheng, Y. Predictors of nutritional status among community-dwelling older adults in Wuhan, China. Public Health Nutr. 2009, 12, 1189–1196. [Google Scholar] [CrossRef] [PubMed]
- Mokhber, N.; Majdi, M.R.; Ali-Abadi, M.; Shakeri, M.T.; Kimiagar, M.; Salek, R.; Moghaddam, P.A.; Sakhdari, A.; Azimi-Nezhad, M.; Ghayour-Mobarhan, M.; et al. Association between malnutrition and depression in elderly people in Razavi Khorasan: A population based-study in Iran. Iran. J. Public Health 2011, 40, 67–74. [Google Scholar] [PubMed]
- Watanabe, R.; Hanamori, K.; Kadoya, H.; Nishimuta, M.; Miyazaki, H. Nutritional intakes in community-dwelling older japanese adults: High intakes of energy and protein based on high consumption of fish, vegetables and fruits provide sufficient micronutrients. J. Nutr. Sci. Vitaminol. 2004, 50, 184–195. [Google Scholar] [CrossRef] [PubMed]
- Nnakwe, N.E. Nutrient intakes of healthy independent living elderly persons consuming self-selected diets. FASEB J. 1997, 11, 1095. [Google Scholar]
- Elsner, R.J. Changes in eating behavior during the aging process. Eat Behav. 2002, 3, 15–43. [Google Scholar] [CrossRef]
- Shahar, D.R.; Schultz, R.; Shahar, A.; Wing, R.R. The effect of widowhood on weight change, dietary intake, and eating behavior in the elderly population. J. Aging Health 2001, 13, 186–199. [Google Scholar] [CrossRef]
- Rosenbloom, C.A.; Whittington, F.J. The effects of bereavement on eating behaviors and nutrient intakes in elderly widowed persons. J. Gerontol. 1993, 48, S223–S229. [Google Scholar] [CrossRef] [PubMed]
- McIntosh, W.A.; Shifflett, P.A.; Picou, J.S. Social support, stressful events, strain, dietary intake, and the elderly. Med. Care 1989, 27, 140–153. [Google Scholar] [CrossRef] [PubMed]
- Nicklett, E.J.; Kadell, A.R. Fruit and vegetable intake among older adults: A scoping review. Maturitas 2013, 75, 305–312. [Google Scholar] [CrossRef] [PubMed] [Green Version]
- Oros, R.I.; Popescu, C.A.; Iova, S.O.; Mihancea, P.; Iova, C.A. Depression, activities of daily living and quality of life in elderly stroke patients. Hum. Vet. Med. 2016, 8, 24–28. [Google Scholar]
- Neto, J.A.F.; Reis, L.M.C.B.; Veras, M.R.; Queiroz, L.L.C.; Nunes, K.P.L.N.; Miranda, P.O.; Santos, A.F.D.; Nunes, J.K.V.R.S. Impact of cardiovascular interventions on the quality of life in the elderly. Braz. J. Cardiovasc. Surg. 2015, 30, 626–630. [Google Scholar]
- Liu, M.H.; Wang, C.H.; Huang, Y.Y.; Cherng, W.J.; Wang, K.W.K. A correlational study of illness knowledge, self-care behaviors, and quality of life in elderly patients with heart failure. J. Nurs. Res. 2014, 22, 136–145. [Google Scholar] [CrossRef] [PubMed]
- Tarride, J.E.; Burke, N.; Leslie, W.D.; Morin, S.N.; Adachi, J.D.; Papaioannou, A.; Bessette, L.; Brown, J.P.; Pericleous, L.; Muratov, S.; et al. Loss of health related quality of life following low-trauma fractures in the elderly. BMC Geriatr. 2016, 16, 84. [Google Scholar] [CrossRef] [PubMed]
- Assaf, A.R.; Beresford, S.A.; Risica, P.M.; Aragaki, A.; Brunner, R.L.; Bowen, D.J.; Naughton, M.; Rosal, M.C.; Snetselaar, L.; Wenger, N. Low-fat dietary pattern intervention and health-related quality of life: The Women’s Health Initiative randomized controlled dietary modification trial. J. Acad. Nutr. Diet. 2016, 116, 259–271. [Google Scholar] [CrossRef] [PubMed]
- Thomas, B.H.; Ciliska, D.; Dobbins, M.; Micucci, S. A process for systematically reviewing the literature: Providing the research evidence for public health nursing interventions. Worldviews Evid. Based Nurs. 2004, 1, 176–184. [Google Scholar] [CrossRef] [PubMed]
- Armijo-Olivo, S.; Stiles, C.R.; Hagen, N.A.; Biondo, P.D.; Cummings, G.G. Assessment of study quality for systematic reviews: A comparison of the Cochrane Collaboration risk of bias tool and the effective public health practice project quality assessment tool: Methodological research. J. Eval. Clin. Pract. 2012, 18, 12–18. [Google Scholar] [CrossRef] [PubMed]
- Shamseer, L.; Moher, D.; Clarke, M.; Ghersi, D.; Liberati, A.; Petticrew, M.; Shekelle, P.; Stewart, L.A. Preferred reporting items for systematic review and meta-analysis protocols (prisma-p) 2015: Elaboration and explanation. BMJ 2015, 349. [Google Scholar] [CrossRef] [PubMed] [Green Version]
- Moher, D.; Liberati, A.; Tetzlaff, J.; Altman, D.G. Preferred reporting items for systematic reviews and meta-analyses: The prisma statement. PLoS Med. 2009, 6, e1000097. [Google Scholar] [CrossRef] [PubMed]
- Rifai, L.; Pisano, C.; Hayden, J.; Sulo, S.; Silver, M.A. Impact of the dash diet on endothelial function, exercise capacity, and quality of life in patients with heart failure. Bayl. Univ. Med. Center Proc. 2015, 28, 151–156. [Google Scholar] [CrossRef]
- Woo, J.; Chan, R.; Leung, J.; Wong, M. Relative contributions of geographic, socioeconomic, and lifestyle factors to quality of life, frailty, and mortality in elderly. PLoS ONE 2010, 5. [Google Scholar] [CrossRef] [PubMed]
- Haveman-Nies, A.; de Groot, L.C.P.; van Staveren, W.A. Relation of dietary quality, physical activity, and smoking habits to 10-year changes in health status in older Europeans in the Seneca study. Am. J. Public Health 2003, 93, 318–323. [Google Scholar] [CrossRef] [PubMed]
- Schlesinger, S.; Walter, J.; Hampe, J.; von Schonfels, W.; Hinz, S.; Kuchler, T.; Jacobs, G.; Schafmayer, C.; Nothlings, U. Lifestyle factors and health-related quality of life in colorectal cancer survivors. Cancer Causes Control 2014, 25, 99–110. [Google Scholar] [CrossRef] [PubMed]
- Gopinath, B.; Russell, J.; Flood, V.M.; Burlutsky, G.; Mitchell, P. Adherence to dietary guidelines positively affects quality of life and functional status of older adults. J. Acad. Nutr. Diet. 2014, 114, 220–229. [Google Scholar] [CrossRef] [PubMed]
- Milte, C.M.; Thorpe, M.G.; Crawford, D.; Ball, K.; McNaughton, S.A. Associations of diet quality with health-related quality of life in older Australian men and women. Exp. Gerontol. 2015, 64, 8–16. [Google Scholar] [CrossRef] [PubMed] [Green Version]
- Zaragoza-Martí, A.; Ferrer-Cascales, R.; Hurtado-Sánchez, J.A.; Laguna-Pérez, A.; Cabañero-Martínez, M.J. Relationship between adherence to the Mediterranean diet and health-related quality of life and life satisfaction among older adults. J. Nutr. Health Aging 2018, 22, 89–96. [Google Scholar] [CrossRef] [PubMed]
- Lewis, C.M.; Wolf, W.A.; Xun, P.; Sandler, R.S.; He, K. Racial differences in dietary changes and quality of life after a colorectal cancer diagnosis: A follow-up of the study of outcomes in colorectal cancer survivors cohort. Am. J. Clin. Nutr. 2016, 103, 1523–1530. [Google Scholar] [CrossRef] [PubMed]
- Alcubierre, N.; Martinez-Alonso, M.; Valls, J.; Rubinat, E.; Traveset, A.; Hernández, M.; Martínez-González, M.D.; Granado-Casas, M.; Jurjo, C.; Vioque, J.; et al. Relationship of the adherence to the Mediterranean diet with health-related quality of life and treatment satisfaction in patients with type 2 diabetes mellitus: A post-hoc analysis of a cross-sectional study. Health Qual. Life Outcomes 2016, 14, 1–6. [Google Scholar] [CrossRef] [PubMed]
- Sanchez-Aguadero, N.; Alonso-Dominguez, R.; Garcia-Ortiz, L.; Agudo-Conde, C.; Rodriguez-Martin, C.; de Cabo-Laso, A.; Sanchez-Salgado, B.; Ramos, R.; Maderuelo-Fernandez, J.A.; Gomez-Marcos, M.A.; et al. Diet and physical activity in people with intermediate cardiovascular risk and their relationship with the health-related quality of life: Results from the mark study. Health Qual. Life Outcomes 2016, 14, 169. [Google Scholar] [CrossRef] [PubMed]
- Mosher, C.E.; Sloane, R.; Morey, M.C.; Snyder, D.C.; Cohen, H.J.; Miller, P.E.; Demark-Wahnefried, W. Associations between lifestyle factors and quality of life among older long-term breast, prostate, and colorectal cancer survivors. Cancer 2009, 115, 4001–4009. [Google Scholar] [CrossRef] [PubMed] [Green Version]
- Ford, D.W.; Jensen, G.L.; Still, C.; Wood, C.; Mitchell, D.C.; Erickson, P.; Bailey, R.; Smiciklas-Wright, H.; Coffman, D.L.; Hartman, T.J. The associations between diet quality, body mass index (BMI) and health and activity limitation index (halex) in the Geisinger Rural Aging Study (GRAS). J. Nutr. Health Aging 2014, 18, 167–170. [Google Scholar] [CrossRef] [PubMed]
- Samieri, C.; Jutand, M.-A.; Féart, C.; Capuron, L.; Letenneur, L.; Barberger-Gateau, P. Dietary patterns derived by hybrid clustering method in older people: Association with cognition, mood, and self-rated health. J. Am. Diet. Assoc. 2008, 108, 1461–1471. [Google Scholar] [CrossRef] [PubMed]
- Trichopoulou, A.; Orfanos, P.; Norat, T.; Bueno-de-Mesquita, B.; Ocké, M.C.; Peeters, P.H.M.; van der Schouw, Y.T.; Boeing, H.; Hoffmann, K.; Boffetta, P.; et al. Modified mediterranean diet and survival: Epic-elderly prospective cohort study. BMJ 2005, 330, 991. [Google Scholar] [CrossRef] [PubMed]
- Schroder, H.; Fito, M.; Estruch, R.; Martinez-Gonzalez, M.A.; Corella, D.; Salas-Salvado, J.; Lamuela-Raventos, R.; Ros, E.; Salaverria, I.; Fiol, M.; et al. A short screener is valid for assessing mediterranean diet adherence among older Spanish men and women. J. Nutr. 2011, 141, 1140–1145. [Google Scholar] [CrossRef] [PubMed]
- Panagiotakos, D.B.; Pitsavos, C.; Stefanadis, C. Dietary patterns: A mediterranean diet score and its relation to clinical and biological markers of cardiovascular disease risk. Nutr. Metab. Cardiovasc. Dis. 2006, 16, 559–568. [Google Scholar] [CrossRef] [PubMed]
- Buckland, G.; González, C.A.; Agudo, A.; Vilardell, M.; Berenguer, A.; Amiano, P.; Ardanaz, E.; Arriola, L.; Barricarte, A.; Basterretxea, M.; et al. Adherence to the Mediterranean diet and risk of coronary heart disease in the Spanish EPIC cohort study. Am. J. Epidemiol. 2009, 170, 1518–1529. [Google Scholar] [CrossRef] [PubMed]
- National Health and Medical Research Council. Dietary Guidelines for Australian Adults; National Health and Medical Research Council: Canberra, Australia, 2003. [Google Scholar]
- Folsom, A.R.; Parker, E.D.; Harnack, L.J. Degree of concordance with DASH diet guidelines and incidence of hypertension and fatal cardiovascular disease. Am. J. Hypertens. 2007, 20, 225–232. [Google Scholar] [CrossRef] [PubMed]
- Lai, J.S.; Hiles, S.; Bisquera, A.; Hure, A.J.; McEvoy, M.; Attia, J. A systematic review and meta-analysis of dietary patterns and depression in community-dwelling adults. Am. J. Clin. Nutr. 2013, 99, 181–197. [Google Scholar] [CrossRef] [PubMed] [Green Version]
- Magalhães, B.; Peleteiro, B.; Lunet, N. Dietary patterns and colorectal cancer: Systematic review and meta-analysis. Eur. J. Cancer Prev. 2012, 21, 15–23. [Google Scholar] [CrossRef] [PubMed]
- Brennan, S.F.; Cantwell, M.M.; Cardwell, C.R.; Velentzis, L.S.; Woodside, J.V. Dietary patterns and breast cancer risk: A systematic review and meta-analysis. Am. J. Clin. Nutr. 2010, 91, 1294–1302. [Google Scholar] [CrossRef] [PubMed]
- Kant, A.K. Dietary patterns and health outcomes. J. Am. Diet. Assoc. 2004, 104, 615–635. [Google Scholar] [CrossRef] [PubMed]
- Milte, C.M.; McNaughton, S.A. Dietary patterns and successful ageing: A systematic review. Eur. J. Nutr. 2016, 55, 423–450. [Google Scholar] [CrossRef] [PubMed]
- Guenther, P.M.; Kirkpatrick, S.I.; Reedy, J.; Krebs-Smith, S.M.; Buckman, D.W.; Dodd, K.W.; Casavale, K.O.; Carroll, R.J. The healthy eating index-2010 is a valid and reliable measure of diet quality according to the 2010 dietary guidelines for Americans. J. Nutr. 2014, 144, 399–407. [Google Scholar] [CrossRef] [PubMed]
- Patterson, R.E.; Haines, P.S.; Popkin, B.M. Diet quality index: Capturing a multidimensional behavior. J. Am. Diet. Assoc. 1994, 94, 57–64. [Google Scholar] [CrossRef]
- Kim, S.; Haines, P.S.; Siega-Riz, A.M.; Popkin, B.M. The diet quality index-international (dqi-i) provides an effective tool for cross-national comparison of diet quality as illustrated by China and the United States. J. Nutr. 2003, 133, 3476–3484. [Google Scholar] [CrossRef] [PubMed]
- Willett, W.C. Overview and perspective in human nutrition. Asia Pac. J. Clin. Nutr. 2008, 17, 1–4. [Google Scholar] [PubMed]
- Klipstein-Grobusch, K.; den Breeijen, J.H.; Goldbohm, R.A.; Geleijnse, J.M.; Hofman, A.; Grobbee, D.E.; Witteman, J.C. Dietary assessment in the elderly: Validation of a semiquantitative food frequency questionnaire. Eur. J. Clin. Nutr. 1998, 52, 588–596. [Google Scholar] [CrossRef] [PubMed]
- Bauer, J.M.; Kaiser, M.J.; Sieber, C.C. Evaluation of nutritional status in older persons: Nutritional screening and assessment. Curr. Opin. Clin. Nutr. Metab. Care 2010, 13, 8–13. [Google Scholar] [CrossRef] [PubMed]
- Van Staveren, W.A.; de Groot, L.C.; Blauw, Y.H.; van der Wielen, R.P. Assessing diets of elderly people: Problems and approaches. Am J. Clin. Nutr. 1994, 59, 221s–223s. [Google Scholar] [CrossRef] [PubMed]
- Ortiz-Andrellucchi, A.; Sanchez-Villegas, A.; Doreste-Alonso, J.; de Vries, J.; de Groot, L.; Serra-Majem, L. Dietary assessment methods for micronutrient intake in elderly people: A systematic review. BJN 2009, 102 (Suppl. 1), S118–S149. [Google Scholar] [CrossRef] [PubMed]
- De Vries, J.H.; de Groot, L.C.; van Staveren, W.A. Dietary assessment in elderly people: Experiences gained from studies in the Netherlands. Eur. J. Clin. Nutr. 2009, 63 (Suppl. 1), S69–S74. [Google Scholar] [CrossRef] [PubMed]
- Honda, M.; Wakita, T.; Onishi, Y.; Nunobe, S.; Miura, A.; Nishigori, T.; Kusanagi, H.; Yamamoto, T.; Boddy, A.; Fukuhara, S. Development and validation of a disease-specific instrument to measure diet-targeted quality of life for postoperative patients with esophagogastric cancer. Ann. Surg. Oncol. 2015, 22, 848–854. [Google Scholar] [CrossRef] [PubMed]
- Grunert, K.G.; Dean, M.; Raats, M.M.; Nielsen, N.A.; Lumbers, M. A measure of satisfaction with food-related life. Appetite 2007, 49, 486–493. [Google Scholar] [CrossRef] [PubMed]
Figure 1.
Preferred Reporting Items for Systematic Reviews and Meta-Analyses (PRISMA) flow diagram of identification, screening and selection process for included articles.
Figure 1.
Preferred Reporting Items for Systematic Reviews and Meta-Analyses (PRISMA) flow diagram of identification, screening and selection process for included articles.

Table 1.
Characteristics of the studies included in the systematic review.
| Study and Setting | Study Design | Sample Size | Mean Age 1 | (A)Dietary Intake Assessment (B) Pattern Analysis Method (C) Adjustment Variables | QoL Measure | Results | Study Quality 2 |
|---|---|---|---|---|---|---|---|
| Woo, J. et al. [66] Hong Kong | Cross sectional | 3378 | 72.5 ± 5.2 | (A):FFQ (B): DQI-I with 4 aspects—variety, adequacy, moderation and overall balance: Range 0–94, high scores better quality (C): Age, sex, socioeconomic status and districts | SF-12 | Better dietary quality is associated with better self-rated physical and mental health. PCS: β = 0.0689 (p < 0.0001) MCS: β = 0.0693 (p < 0.0001) | moderate |
| Haveman-Nies et al., SENECA [67] Europe (Belgium, Denmark, Italy, The Netherlands, Portugal, Spain and Switzerland) | Longitudinal | 480 | 72.6 ± 1.6 | (A) Diet history (B) Modified Mediterranean score: Range 0–7, high scores indicate better quality. (C): Age, country | Self-rated health status | No association observed between diet quality and risk of deterioration of health status. Risk of deterioration in health status resulting from low dietary quality: OR (95% CI): Men 1.1 (0.5, 2.3); women 1.4 (0.7, 2.7) | weak |
| Schlesinger et al. [68] Northern Germany | Cross sectional | 1389 | 69 (64–73) | (A): 112 item web-based FFQ/ (B): Dietary Index: Two indices namely ’favorable‘ and ’unfavorable‘ were generated (C): Age sex and SES | EORTC QLQ-C30 | Those with a favorable’ diet had a reduced odds of having a low gHRQoL; OR (95% CI): 0.79 (0.63–0.99) | moderate |
| Perez-Tasigchana et al., UAM-cohort, & Seniors-ENRICA [22] Spain | Longitudinal | 2376 | ≥60 | (A):14 item paper-based FFQ (B): Mediterranean dietary pattern index (UAM-MDP): Range −2 to 6, low score indicates less healthy diet. (C): Age, sex, level of education, smoking, BMI, physical activity, comorbidities | SF-36 (Spanish version) | No significant association between UAM-MDP and PCS and MCS. | strong |
| 1911 | ≥60 | (A): Dietary history-Enrica (B): PREDIMED score: Range 0–14 high scores better adherence MDS :Range 0–9 high scores better adherence (C): Age, sex, level of education, smoking, BMI, physical activity, comorbidities | SF-12 | Higher PREDIMED score was associated with slightly better PCS score. Compared to those in the lowest tertile, PCS: b = 0.55 (−0.48 to 1.59) for tertile 2, 1.34 (0.21 to 2.47) for tertile 3PREDIMED score not significantly associated with a better MCS score. [/MCS: tertile 2, b = −0.25 (−1.31 to 0.80) and tertile 3, b = 0.56 (−0.58 to 1.71)] | |||
| MDS not associated with PCS or MCS | |||||||
| Gopinath et al., BMES [69] Australia | Longitudinal | 895 | 67.1 ± 7.4 | (A): 145 item FFQ (B): Total Diet Score to assess adherence to dietary guidelines for Australian adults: Range 0–20, higher scores better adherence (C): Age, sex, receipt of pension payment, home ownership, admission to hospitals, walking disability, living alone, 5 or more co morbidities, cognitive and visual impairment | SF-36 and FACT-C | Adherence to dietary guidelines at baseline was associated with significantly better QoL in four domains after 5 years. Participants in the highest vs. lowest quartile of baseline total diet scores had adjusted mean scores 5.6, 4.0, 5.3, and 2.6 units higher in these SF36 domains 5 years later | moderate |
| Milte et al., WELL [70] Australia | Longitudinal | 2457 | 59.9 (65–55) | (A): 111 item FFQ (B): DGI: Range 0–130 higher scores reflect greater compliance with dietary guidelines RFS: Range 0–49, with higher scores associated with greater diet quality MDS: Range 0–8, higher scores reflecting greater adherence to Mediterranean diet. (C): Model 1: adjusted for age, sex, education and urban/rural location. Model 2: additionally adjusted for smoking and total physical activity. Model 3: additionally adjusted for BMI | RAND 36 | Older adults with better quality diets report better health-related QoL, with additional associations with emotional wellbeing observed in women. Better diet quality by DGI was associated with better self-reported HRQoL on the physical function (OR = 1.56, 95% confidence intervals (CI): 1.22–1.99), bodily pain (OR = 1.29, CI: 1.01, 1.63), general health (OR = 1.72, CI: 1.36, 2.19), energy (OR = 1.51, CI: 1.19, 1.92), emotional wellbeing (OR = 1.36, CI: 1.08, 1.72) and PCS (OR = 1.46, CI: 1.15, 1.86). | strong |
| A higher RFS was associated with better HRQoL on the physical function (OR = 1.43, CI: 1.13–1.82), general health (OR = 1.41, CI: 1.12, 1.78), energy (OR = 1.55, CI: 1.22, 1.96) and emotional wellbeing (OR = 1.41, CI: 1.12, 1.77) | |||||||
| MDS score in the top quartile was associated with a better score on the energy scale (OR = 1.53, CI: 1.11, 2.10). An association between MDS and general health was also observed after adjustment for smoking and physical activity (OR = 1.52, CI: 1.11, 2.08) | |||||||
| Zaragoza-marti et al. [71] Spain | Cross sectional | 351 | 71.06 | (A): MEDIS-FFQ (B): MDS: Range 0–9, higher the score higher the adherence (C): Age, hours of physical activity, educational level, BMI, blood cholesterol, blood glucose levels and blood pressure | SF 12 | Adherence to MD is positively related to both PCS and MCS of SF12 for both sexes. Regression coefficients for the relationship between Mediterranean diet score with women (MCS (0.07, CI:(−0.96–0.23, p < 0.001) and PCS (0.19, CI (0.04–0.34, p = 0.020)) and men (MCS (0.01, CI: −0.12–0.29, p = 0.004 and PCS (0.05, CI: 0.17–0.20, p = 0.060)) | moderate |
| Veronese et al., Osteoarthritis Initiative [21] United States | Cross sectional (sub study of a large longitudinal study) | 4470 | 61.3 ± 9.2 | (A): 77 item Block brief 2000 FFQ (B): Modified MDS: Range: 0–55 high scores better adherence (C): Age, sex, race, BMI, education, smoking status, total energy intake, Charlson co morbidity index, use of analgesic drugs, annual income | SF-12 | Higher adherence to med diet is associated with better QOL. Those with higher aMED showed significantly higher PCS (quintile 5: 50 ± 8.5 compared to quintile 1: 47.2 ± 9.8; p < 0.0001) and MCS (quintile 5: 54.5 ± 7.6 compared to quintile 1: 53.2 ± 8.8; p < 0.0001) | moderate |
| Lewis et al. [72] United States | Longitudinal | 265 | 64.5 ± 10.3 (Caucasians)/60.7 ± 10.2 (African American) | (A): 44 item Diet history questionnaire (B): Dietary index scored from −30 to 30 Higher scores better adherence. (C): Age, sex, follow up time, education, Socio economic factors, BMI, alcohol consumption, smoking and physical activity | SF-12 | Subjects who improved dietary quality exhibited positive changes in QOL-significant changes observed in functional wellbeing (0.14, CI: 0.05–0.07, p ≤ 0.01), functional assessment of cancer therapy-general total score (0.19, CI: 0.01, 0.37, p = 0.04) and Physical composite score of SF12 (0.23,CI: 0.05–0.41, p = 0.01) | strong |
| Alcubierre et al. [73] Spain | Cross sectional | 294 (146 DR and 148 NDR) | No Diabetic retinopathy: 57.9 ± 10.3 | (A) Semi quantitative FFQ 101 items (B): rMED: Range, 0–18 Adherence was rated as low (0–6), medium (7–10) and high (11–18) (C):Adjustments varied for different components of the QoL domain and included age, ethnicity, insulin treatment, retinopathy, diabetes duration another diabetes related factors | ADDQOL-19 | rMED was significantly associated with HRQOL dimensions of travels, self-confidence, freedom to eat and freedom to drink. rMED > 8, positively associated with self confidence (p = 0.015), freedom to eat 0.839 (p = 0.037) and freedom to drink 1.150 (p = 0.015) | moderate |
| Diabetic retinopathy: 60.5 ± 8.8 | |||||||
| Rifai et al. [65] United States | Randomised controlled trial | 48 | DASH group (60) and comparison group (64) | (A): FFQ/food diaries (B): DASH diet index: Range 0 to 11, with higher scores indicating higher levels of concordance. (C): N/A | MLHF | Adhering to the DASH diet improved QoL scores at 3 months; improved MLHFQ scores at 3-month follow-up (21 vs. 39; p = 0.006) | strong |
| Sanchez-Aguadero et al. MARK study [74] Spain | Longitudinal | 314 | 61.1 ± 8.4 (35–74) | (A): FFQ with 18 food groups divided into three categories (B): DQI: Range 18–54, with higher scores associated with better diet quality. aMED: Score ≥ 5 meaning good compliance (C): Age, sex, hypertension, dyslipidaemia and Charlson Comorbidity Index | Spanish version of the SF-12 v.2 | In those at intermediate cardiovascular risk, DQI was directly related to the mental component score (r = 0.127, p < 0.05) and mental health (r = 0.121, p < 0.05), in bivariate analyses | moderate |
| Greater adherence to the Mediterranean diet was associated with higher scores on the SF-12 mental component, social functioning and vitality and DQI showed an association with the mental component score. Bivariate correlation: The Mediterranean Diet (total score) was related to the mental component (r = 0.164, p < 0.01) as well as social functioning (r = 0.172, p < 0.01) and vitality (r = 0.122, p < 0.05). Multiple linear regression: 1.177 point increase in the mental component for each increase of 1 point in the Mediterranean diet adherence score (p < 0.01), Vitality (β = 0.958 and 0.990) and Social Functioning (p < 0.05 and p < 0.01) domains maintained association post adjustments. | |||||||
| Mosher et al., RENEW [75] United States, UK and Canada | Cross sectional | 641 | 73 ± 5 | (A): 24 h dietary recalls (B): HEI05: Range 0–100 with scores above 80 indicating good diet quality. (C): age, race, level of education, and number of comorbidities | SF-36 | Diet quality was positively associated with physical functioning (β = 0.10, Ps < 0.005) and vitality (β = 0.095, Ps = 0.01) | moderate |
| Ford et al., GRAS [76] United States | Cross sectional | 4009 | Males: 81.3 ± 4.2, Females: 81.5 ± 4.5 | (A): DST (B): HEI 05: Range :0–100 (<60 considered “unhealthy”, 60–75 “borderline”, and >75 “healthy”) (C): BMI, disease burden, sex, education, age, smoking status, living situation and self-vs. proxy report | HALex | Poor diet quality, as assessed by the DST, is associated with lower HRQoL. HALex scores were significantly lower for participants with dietary intakes categorized as unhealthy (<60) (0.70, 95% CI 0.69, 0.72, p < 0.05) or borderline (60–75) (0.71, 95% CI 0.70, 0.73, p < 0.05) compared to those scoring in the healthy range (>75) (0.75, 95% CI 0.73, 0.77). | moderate |
| Sameiri et al., Three City Study [77] France | Cross-sectional | 1724 | 76.0 ± 4.9 | (A): 148 item FFQ (B): Mixed method combining hybrid clusters to derive sex-specific dietary patterns. Five dietary patterns were identified in men and women each. (C): Sociodemographic variables, and comorbidities | Self-rated health status | Men in the “pasta eaters” cluster had greater risk of reporting poor health (odds ratio [OR] 1.91; 95% CI, 1.21–3.01) than the “healthy” cluster. Women in the “biscuits and snacking” cluster (n = 162; 15%) had greater risk of poor perceived health (OR 1.69; 95% CI, 1.15–2.48) compared to “healthy” eaters. | moderate |
1 Age given as Mean ± SD or mean (range) or minimum age (≥) in years; 2 Quality of studies as assessed by Effective Public health Practice Project (EPHPP) quality assessment tool. SENECA Survey in Europe on Nutrition and the Elderly; a Concerted Action; Seniors—ENRICA Study on Nutrition and Cardiovascular Risk in Spain; UAM Universidad Autonoma de Madrid; BMES Blue Mountain Eye Study; MARK Improving interMediAte Risk management; WELL Wellbeing, Eating and exercise for a Long Life; RENEW Reach—out to Enhance Wellness trial; GRAS Geisinger Rural Aging Study. HRQol Health related quality of life; EORTC QLQ-C30 European Organisation for Research and Treatment of Cancer, quality of life core questionnaire; FACT-C Functional assessment of cancer therapy-colorectal; gHRQol Global Health related quality of life; SF12 Short form survey 12; SF36 Short form survey 36; Rand-36 Rand 36 item health survey; ADDQOL-Audit of Diabetes dependent quality of life; MLHF Minnesota Living with Heart Failure Questionnaire; HALeX Health and activities limitation index. FFQ Food Frequency Questionnaire; DASH Dietary Approaches to Stop Hypertension; rMED Relative Mediterranean diet score; MDS Mediterranean diet score; MD Mediterranean diet; PREDIMED Prevención con Dieta Mediterránea; RFS Recommended Food score; DGI dietary guideline Index; DST Dietary Screening Tool; DQI Diet quality index ; aMED Adherence to Mediterranean diet ; PCS Physical component score; MCS Mental component score.
© 2018 by the authors. Licensee MDPI, Basel, Switzerland. This article is an open access article distributed under the terms and conditions of the Creative Commons Attribution (CC BY) license (http://creativecommons.org/licenses/by/4.0/).
Share and Cite
MDPI and ACS Style
Govindaraju, T.; Sahle, B.W.; McCaffrey, T.A.; McNeil, J.J.; Owen, A.J. Dietary Patterns and Quality of Life in Older Adults: A Systematic Review. Nutrients 2018, 10, 971. https://doi.org/10.3390/nu10080971
AMA Style
Govindaraju T, Sahle BW, McCaffrey TA, McNeil JJ, Owen AJ. Dietary Patterns and Quality of Life in Older Adults: A Systematic Review. Nutrients. 2018; 10(8):971. https://doi.org/10.3390/nu10080971
Chicago/Turabian StyleGovindaraju, Thara, Berhe W. Sahle, Tracy A. McCaffrey, John J. McNeil, and Alice J. Owen. 2018. "Dietary Patterns and Quality of Life in Older Adults: A Systematic Review" Nutrients 10, no. 8: 971. https://doi.org/10.3390/nu10080971
Note that from the first issue of 2016, this journal uses article numbers instead of page numbers. See further details here.