The
particles could not be accessed by reference methods and only by few laboratory methods. The
as well as
particles showed very strong sedimentation and therefore it was decided to take into account only
,
and
particles. Despite the inability of some methods to measure all chosen samples, all samples were measured by at least five different techniques. With the SAXS setup used in this work the number concentration the large particles could not be determined due to the measurement times being longer than concentration changes due to sedimentation. For spICPMS, a deconvolution algorithm was proposed, which can help to access Au10 particles [
29]. However, as such approach is likely to introduce an additional uncertainty, it was considered unsuitable in the context of this work.
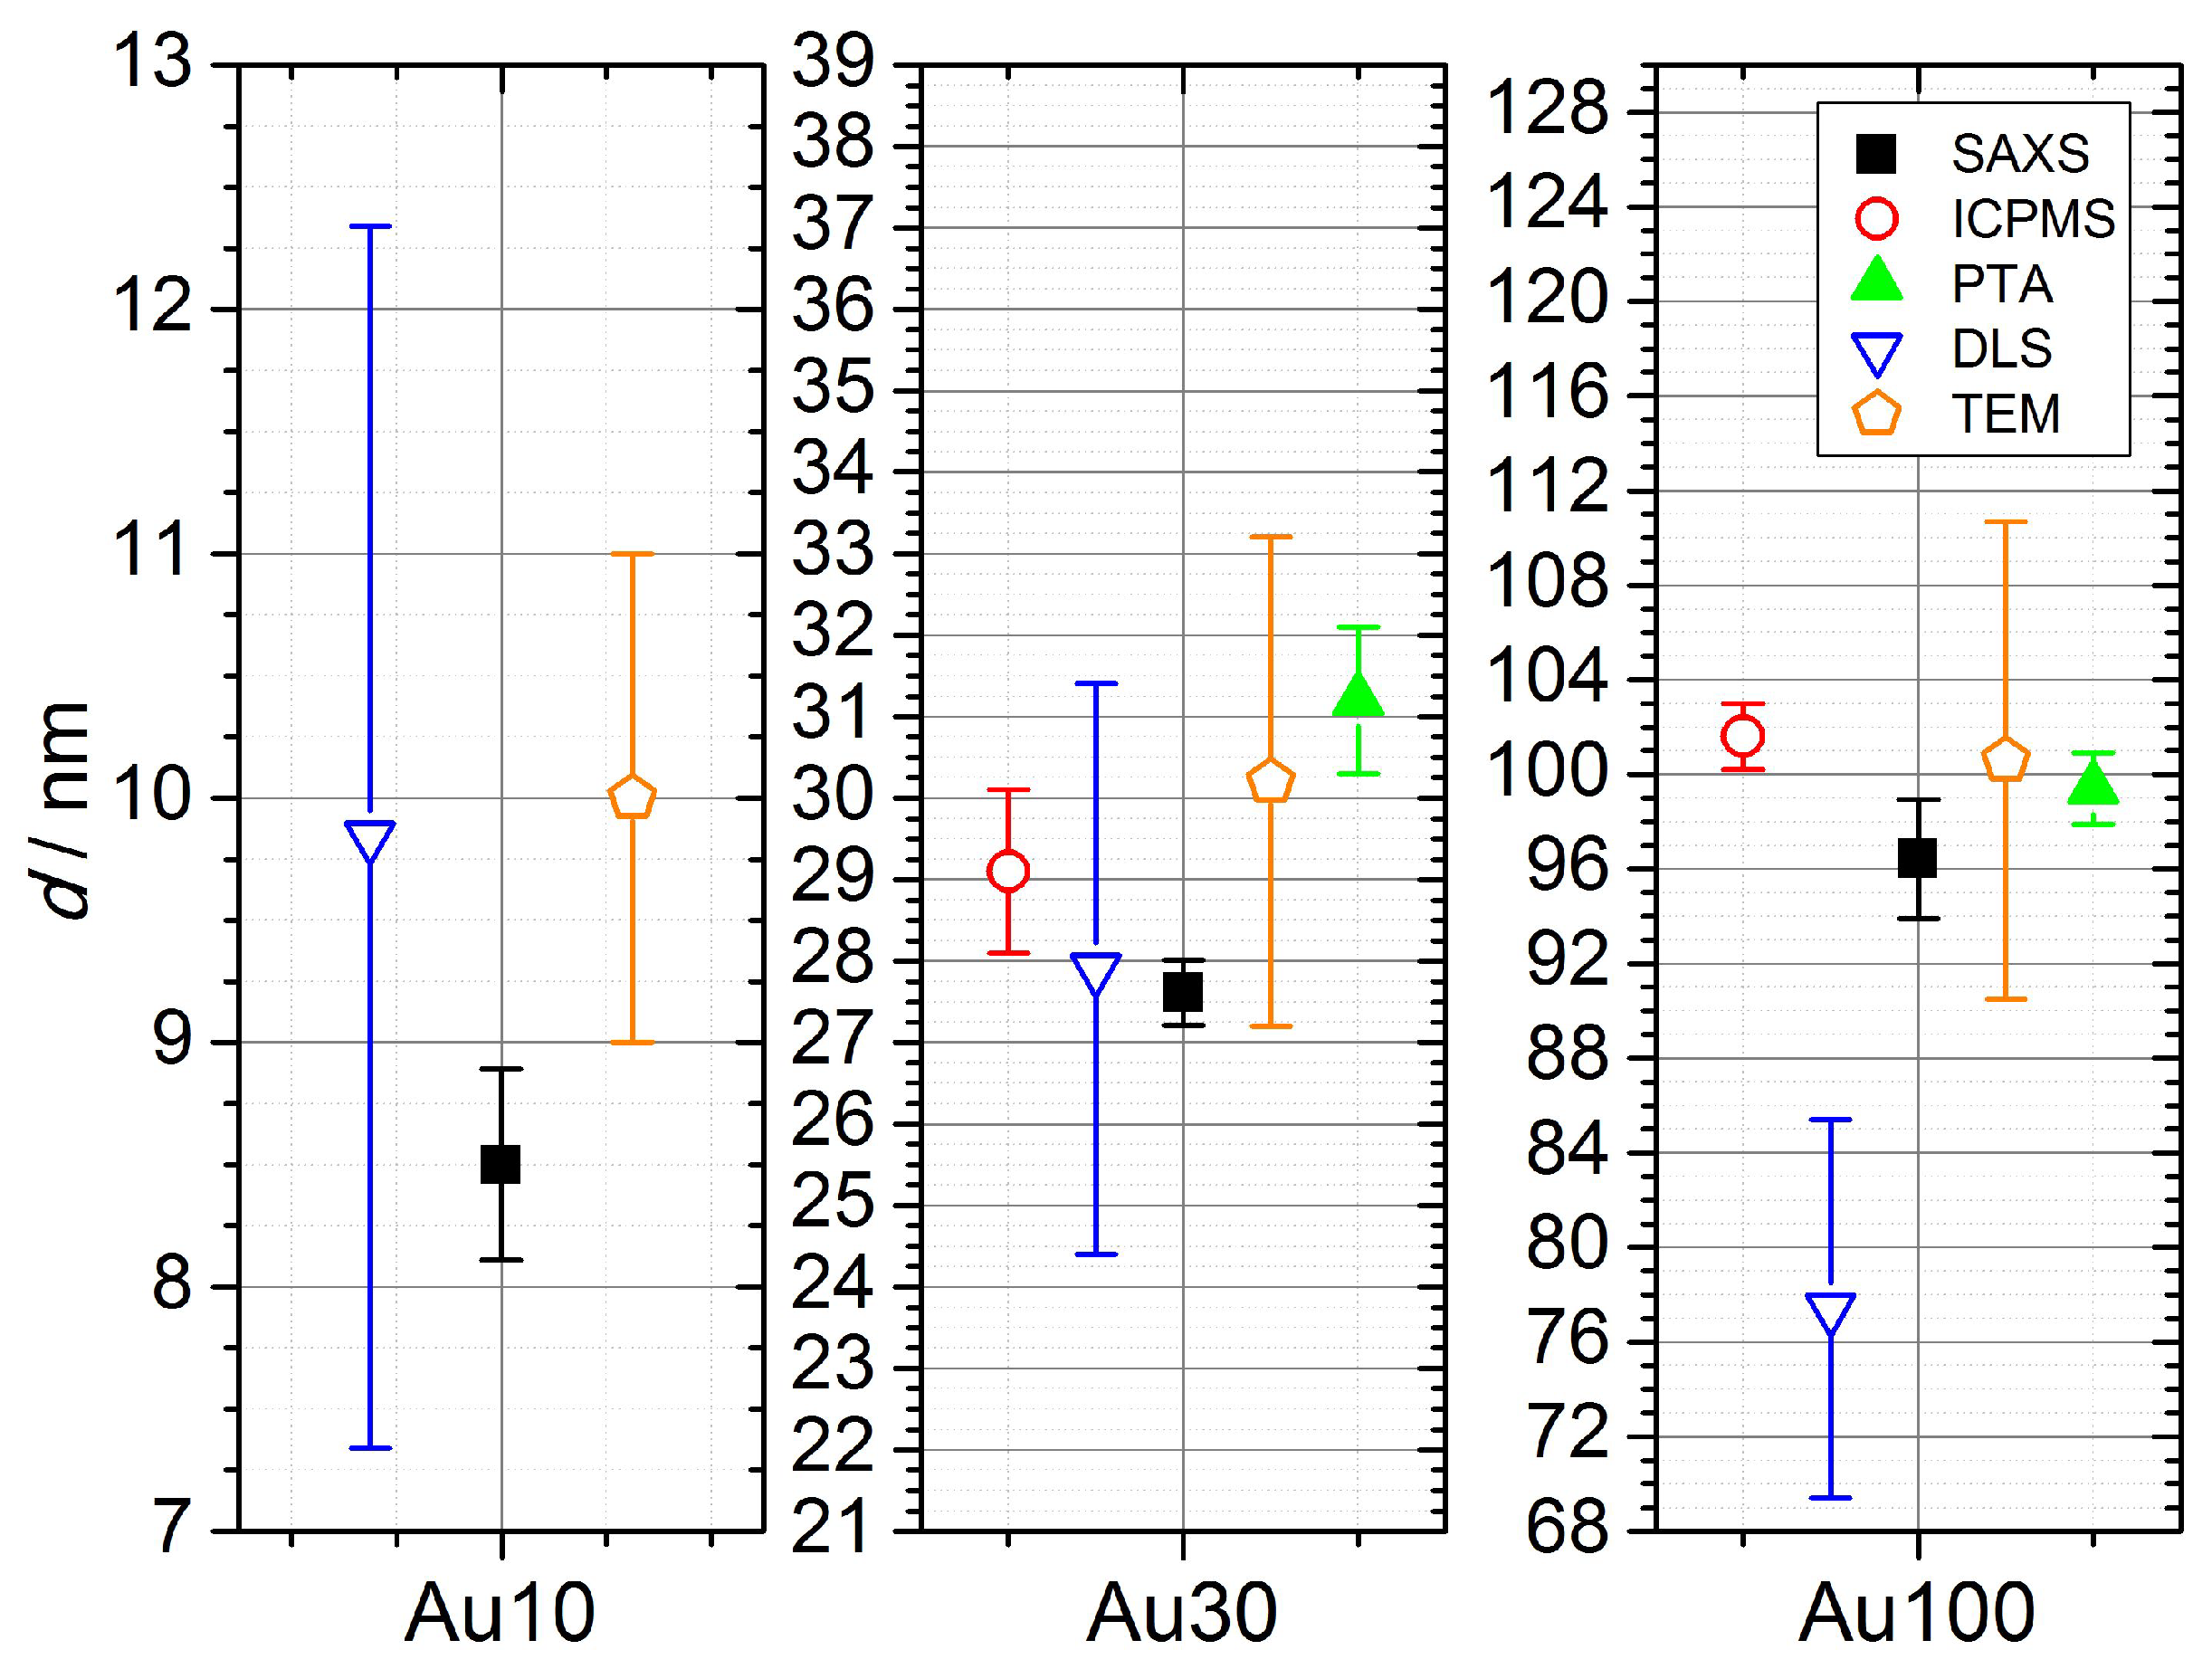
PTA and DLS measure the hydrodynamic radius of the particles, which includes the particle itself, the ligand layer and the associated hydration layer. Therefore they can not be directly compared to other three methods. Nevertheless, they provide useful information about performance of the methods. The PTA method agreed within uncertainties with DLS for the Au30 sample. For the Au100 sample the PTA deviated by a factor of ≈1.27 from the DLS. It has to be mentioned that despite different measurands, DLS agreed within uncertainties with all other methods for the Au10 and Au30 samples, which is a consequence of large uncertainties of the method. However PTA, which provides much lower uncertainties than DLS, agreed within uncertainties with all other methods for the Au100 sample. For DLS, the use of intensity size distribution delivers values for diameters up to 28% larger compared to the results obtained by use of the number size distribution. A comparison of the number-based size distribution measured by SAXS showed that the DLS size distribution measurement broadening is due to instrumental broadening. Because of this, the number-based size distributions measured by SAXS were used to estimate the number concentration by DLS in the next step.
Number Concentration
The number concentrations with corresponding standard uncertainty
acquired with reference and laboratory methods are shown in
Table 2 and
Figure 2. SAXS and spICPMS measurements were used as reference measurements for colloidal number concentration, which the laboratory methods presented were compared with. Their properties qualified SAXS and spICPMS as reference methods which have the potential to provide internationally recognized standardization of number concentration measurements due to their traceability to the SI-units.
The comparison highlighted the strengths and limitations of the two reference methods. SAXS is highly accurate, but its accuracy is highly reliant on the exact knowledge of the difference of the electron density of the nanoparticles and the solvent. The second limitation was the time needed for a measurement—suspensions of gold particles with a diameter 100 nm showed tremendous sedimentation after short time and therefore no reliable number concentrations could be provided by the SAXS setup used in this work.
The spICPMS method could not access the number concentration of the Au10 sample, as part of the particle population was difficult to resolve from the background signal. The Au10 sample could only be measured with SAXS as a reference method, but with the relative standard uncertainty of
. This is due to the upper limit of the accessible
q-range in the setup. For the Au30 sample, SAXS provided accurate values with a relative standard uncertainty of
. An example of uncertainty budget for the Au30 sample is provided in
Table 3.
The number-based concentration of gold nanoparticles was measured with spICPMS following the dynamic mass flow method, which achieved the standard measurement uncertainty (
) of less than
. A full uncertainty budget associated with the measurement was provided for gold samples in the size range from
to
. The obtained values agreed well (within their uncertainty) with the nominal values, as well as with the values provided by SAXS. The uncertainty contributions (% of total) for spICPMS were estimated in accordance with ISO 17025 and Eurachem/CITAC and are shown exemplary for the Au30 sample in
Table 4. The spICPMS method was the only reference method, which could measure the number concentration of Au100 sample. The relative uncertainty of the measurement on this sample was
.
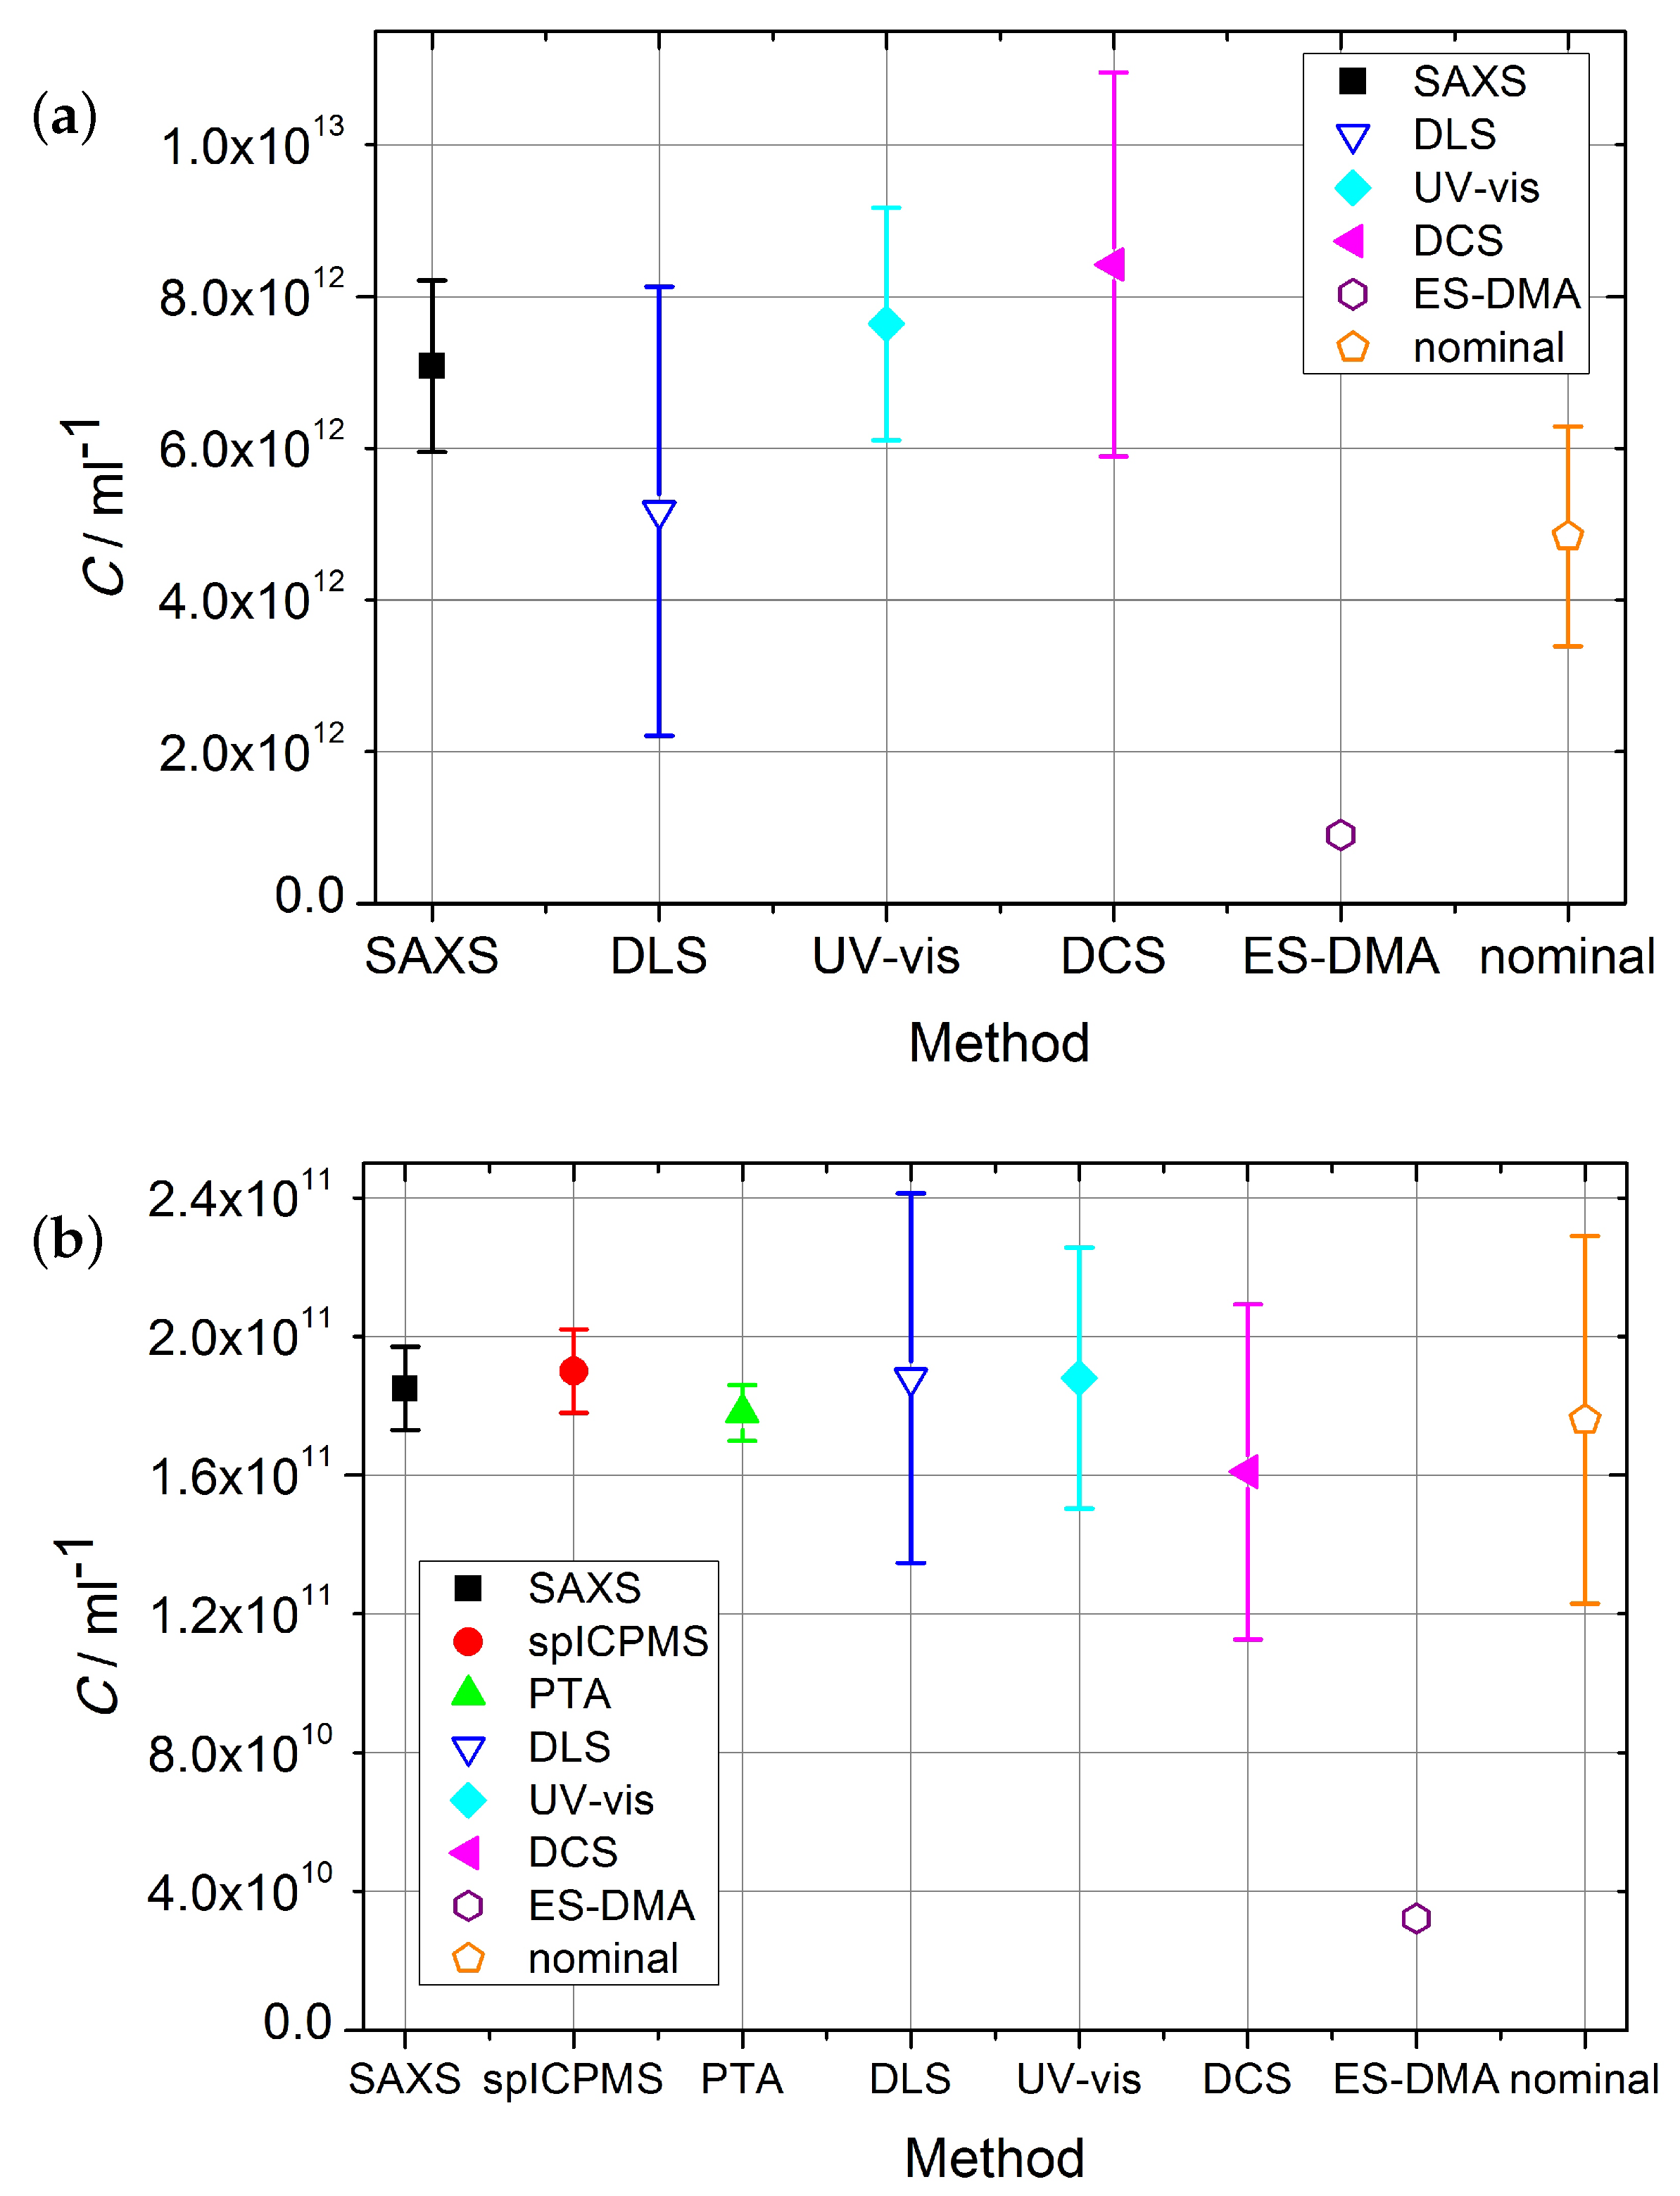
From
Table 2 as well as
Figure 2a,b it is visible that, for Au10 and Au30 samples, with the exception of the ES-DMA-CPC method, all the methods are in close agreement. All laboratory methods agree with the result provided by SAXS for the Au10 sample. Only ES-DMA-CPC deviates for this sample by a factor of eight. The sample measured by all available methods was the Au30 sample. With the exception of the ES-DMA-CPC method, which differed by a factor of six, all other methods provided results which agreed within their uncertainties. The DCS/DLS measurement yielded a value ≈ 11% lower than SAXS, spICPMS, PTA and DLS, but still within the range of the uncertainties.
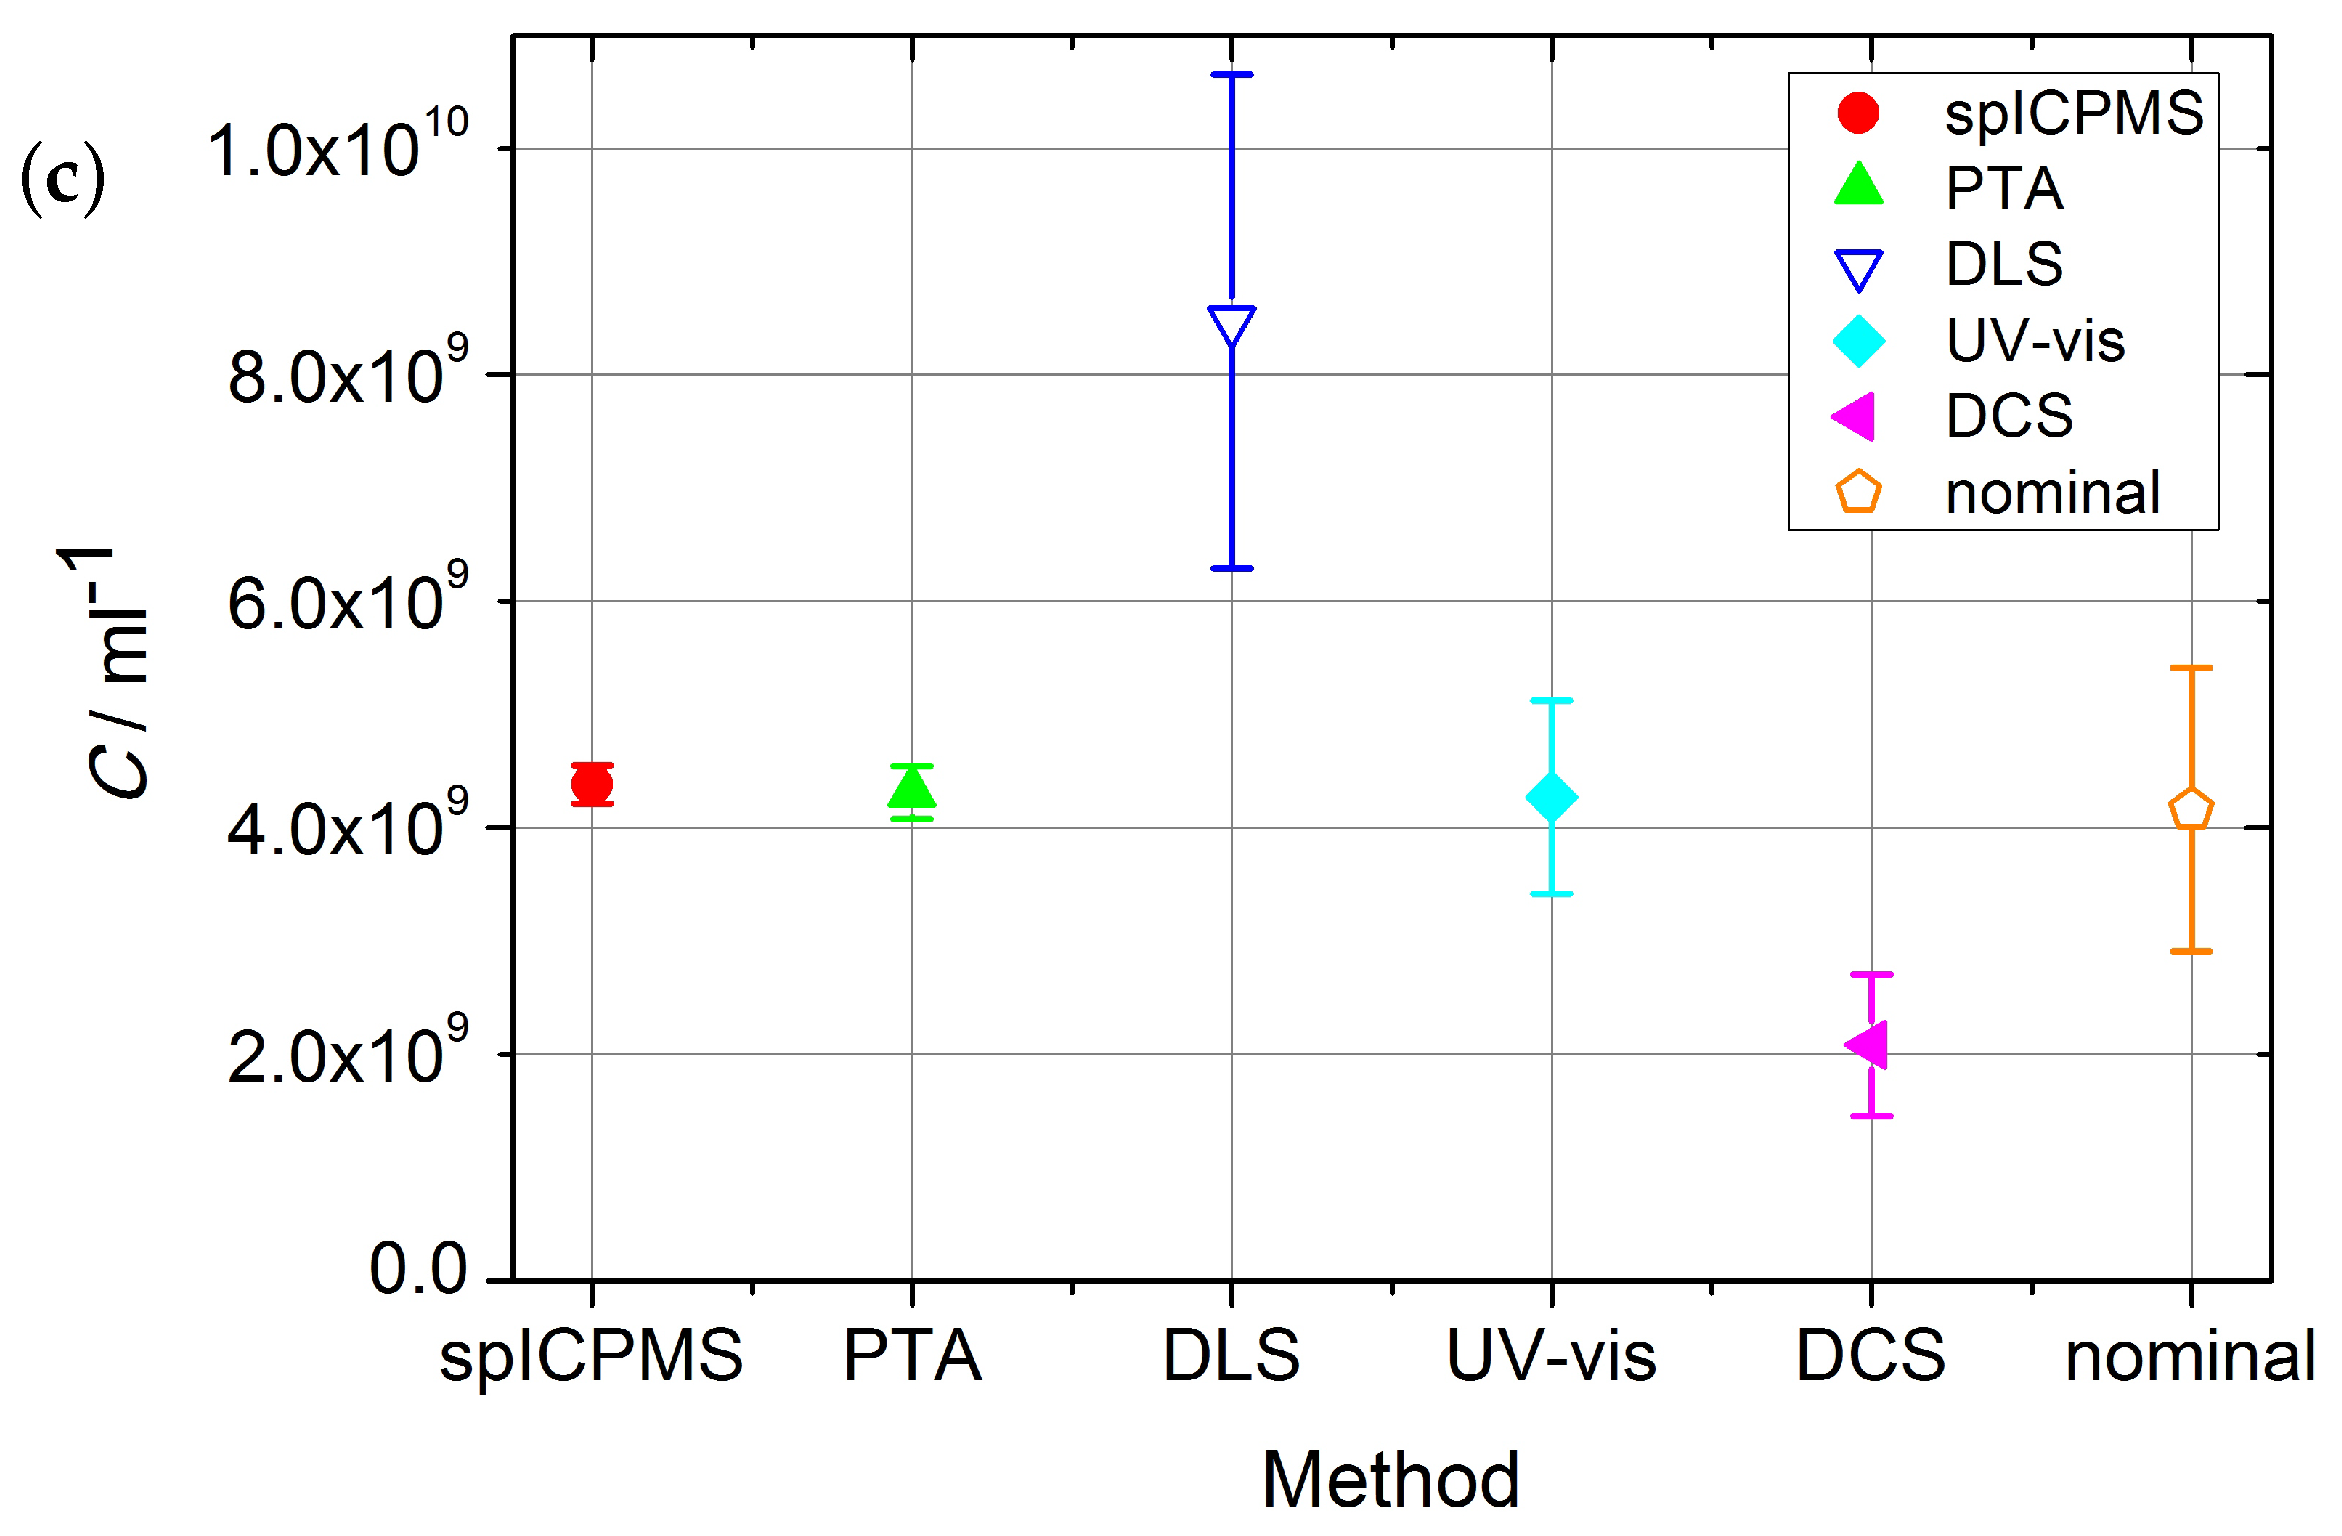
Whereas ES-DMA-CPC and SAXS could not provide any results on Au100 samples, the results from spICPMS, PTA and UV-vis as well as the nominal values agree within their uncertainties as shown in
Figure 2. The DLS value is higher and the DCS value is lower with the maximal deviation by a factor of two.
With PTA being a light-scattering-based technique, the size limit of detection was found, as expected, to be dependent on the type and density of the material the analyte is composed of. It was possible to detect gold particles as small as
, but not to measure their concentration reliably. Particles of around
and
were suitable for the technique. Compared to the reference methods, PTA delivered values within uncertainties for both accessible samples. An example of the uncertainty budget for PTA and the Au30 sample is shown in the
Appendix A.2.
The estimation of volume or number concentration from the DLS is very dependent on the refractive index
n and the absorption coefficient
A of the nanoparticles inserted into the software. For the calculations, the refractive index
and the absorption coefficient
were used [
24]. The uncertainties for volume concentration measurements are much lower than for number concentration estimation. However, even if the conditions for the measurement of the scattering intensity were optimized by diluting the samples, another large uncertainty was identified: the size distribution. The distributions measured by DLS, are much broader than those from the reference method (SAXS). This fact results in shifts in the estimated volume and number size distributions compared to the “intensity” size distribution, which is what the DLS measures (scattering intensity).
The DCS method could provide number concentration for all samples, even though the size had to be measured with DLS. If the diameter of the particles measured with the reference method SAXS was used, the obtained results were in better agreement with the values of the reference methods. As for DLS, DCS relies on the exact knowledge of the refractive index
n of the nanoparticles for the estimation of the concentration. Thus, for the DCS (DCS/DLS) method, precise knowledge of the particle size and size distribution as well as the density of the material is essential for use in laboratory conditions. The major contribution to DCS uncertainty is composed of the uncertainties on the size and density of the calibrants [
30]. Method trueness for the measurement of nanoparticle concentration was found to be around
. The total uncertainty is therefore
.
The UV-vis method could provide reliable number concentration values as only high-density particles were used in the experiments presented, however this methods needs additional size measurements e.g., by TEM, in order to calculate the extinction cross-section. The estimation of the uncertainty for the UV-vis method relies on a comparison to gravimetric methods and theory [
31,
32,
33]. This provides an estimated relative uncertainty for UV-vis of
.
The electrospray transmission efficiency in ES-DMA-CPC experiments depends on the suspension flow rate through the capillary and the suspension matrix. Compared to the primary methods, the deviation of the ES-DMA-CPC values was up to a factor of eight. Additionally, ES-DMA-CPC could only provide number concentrations for particles with a diameter of
[
28]. However, the results presented are based on the assumption of
transport efficiency. The results from this comparison can be used to determine realistic efficiencies for ES-DMA-CPC.

 ,
, 


