Article

Micromechanical Properties of Nanostructured Clay-Oxide Multilayers Synthesized by Layer-by-Layer Self-Assembly

1
State Key Laboratory of Ocean Engineering and Collaborative Innovation Center for Advanced Ship and Deep-Sea Exploration (CISSE), Department of Civil Engineering, School of Naval Architecture, Ocean, and Civil Engineering, Shanghai Jiao Tong University, Shanghai 200240, China
2
Department of Civil & Environmental Engineering, University of Massachusetts Amherst, Amherst, MA 01003, USA
3
Department of Civil and Environmental Engineering, Louisiana State University, Baton Rouge, LA 70803, USA
*
Authors to whom correspondence should be addressed.
Nanomaterials 2016, 6(11), 204; https://doi.org/10.3390/nano6110204
Submission received: 5 September 2016 / Revised: 1 November 2016 / Accepted: 3 November 2016 / Published: 8 November 2016

Abstract

:
Clay-based nanostructured multilayers, such as clay-polymer multilayers and clay-oxide multilayers, have attracted growing attention owing to their remarkable mechanical properties and promising application in various fields. In this paper, synthesis of a new kind of nanostructured clay-oxide multilayers by layer-by-layer self-assembly was explored. Nano-mechanical characterization of 18 clay-based multilayer samples, prepared under as-deposited (i.e., air-dried) and annealing conditions at 400 °C/600 °C with different precursor cations and multilayer structure, were carried out using nanoindentation testing, atomic force microscopy (AFM), and X-ray diffraction (XRD). The influencing factors, including as-deposited and annealing conditions and clay concentrations on the mechanical properties were analyzed. Results show that all of the multilayers exhibit high bonding strength between interlayers. Higher modulus and hardness of clay-based multilayers were obtained with lower clay concentrations than that with higher clay concentrations. Different relationships between the modulus and hardness and the annealing temperature exist for a specific type of clay-oxide multilayer. This work offers the basic and essential knowledge on design of clay-based nanostructured multilayers by layer-by-layer self-assembly.

1. Introduction

Clay-based nanostructured multilayers (e.g., clay-polymer multilayers and clay-oxide multilayers [1,2,3,4]) have attracted growing attentions owing to their remarkable mechanical properties and promising application in various fields, such as protective coatings, micro/nanodevices, electronic memory structures and advanced optical and electro-optical devices, etc. [5,6,7]. The most advanced method for making clay-based multilayers is the layer-by-layer (LbL) self-assembly method [8,9,10,11,12,13,14], which is a bottom-up approach by sequential adsorption of nanometer-thick monolayers of oppositely-charged constituents (e.g., polyelectrolytes, charged nanoparticles, and biological macromolecules) to form a multilayered structure with nanometer-level control over the architecture [10,11]. The LbL self-assembly method, regarded as a surface precipitation process, is simple, versatile, low-cost, and low-temperature fabrication to produce nanostructured ultra-thin films with desirable properties.
Nanostructured clay-oxide multilayers prepared by the LbL self-assembly technique has been reported by Chen and Zhang et al. [15,16,17]. In these studies, the exfoliated clay platelet (montmorillonite, MMT) having a high aspect ratio with thickness in nanometer scale and bearing negative surface charges is used as an anionic component. The clay-zirconia multilayers were fabricated by sequentially dipping a Si/SiO2 substrate in the exfoliated nano-clay suspension and a zirconia cationic precursor solution followed by annealing at elevated temperatures. It was found that nanoscale LbL growth is achievable, and the annealed films remain uniform and crack-free. This indicates that a variety of nanostructured clay-oxide multilayers with graded functionalities can be conveniently manufactured via changing the composition or concentration of oxide cationic precursor solutions periodically or continuously.
The structural integrity and order of the nanostructured clay-oxide multilayers have been found to be of paramount importance for practical application. For example, a linearly increasing relationship generally exists between film thickness and number of adsorption cycles, which is reported by Chen and Zhang [15] and Fendler [18]. The degree of order in produced film varies widely, or even lack, any order at all in the self-assembled nanostructured materials [19]. Meanwhile, the thickness, morphology, and periodicity of the nanostructured film in different processing conditions has been characterized using a variety of techniques (both in situ and post-deposition), such as elipsometric measurements, light interference, adsorption isotherms, atomic force microscopy (AFM), scanning electron microscope (SEM), X-ray diffraction (XRD), X-ray reflectivity (XRR), transmission electron microscopy (TEM), and surface plasmon spectroscopic measurements, etc. [15,18,19,20,21,22,23].
To facilitate moving this promising research forward, the micromechanical properties, one of the most important aspects for a new material, of the clay-based nanostructured multilayers prepared under as-deposited (i.e., air-dried) and annealing conditions are investigated in this paper. Nanoindentation testing, assisted with atomic force microscopy (AFM) and X-ray diffraction (XRD), was employed to study the mechanical properties of these clay-oxide thin films. The influential factors, including the post-deposition condition and clay concentration, on the mechanical properties were analyzed, and issues with respect to design of desirable nanostructured clay-oxide multilayers are discussed. This work will offer the basic and essential knowledge on the design of clay-based nanostructured multilayers by LbL self-assembly.

2. Materials and Method

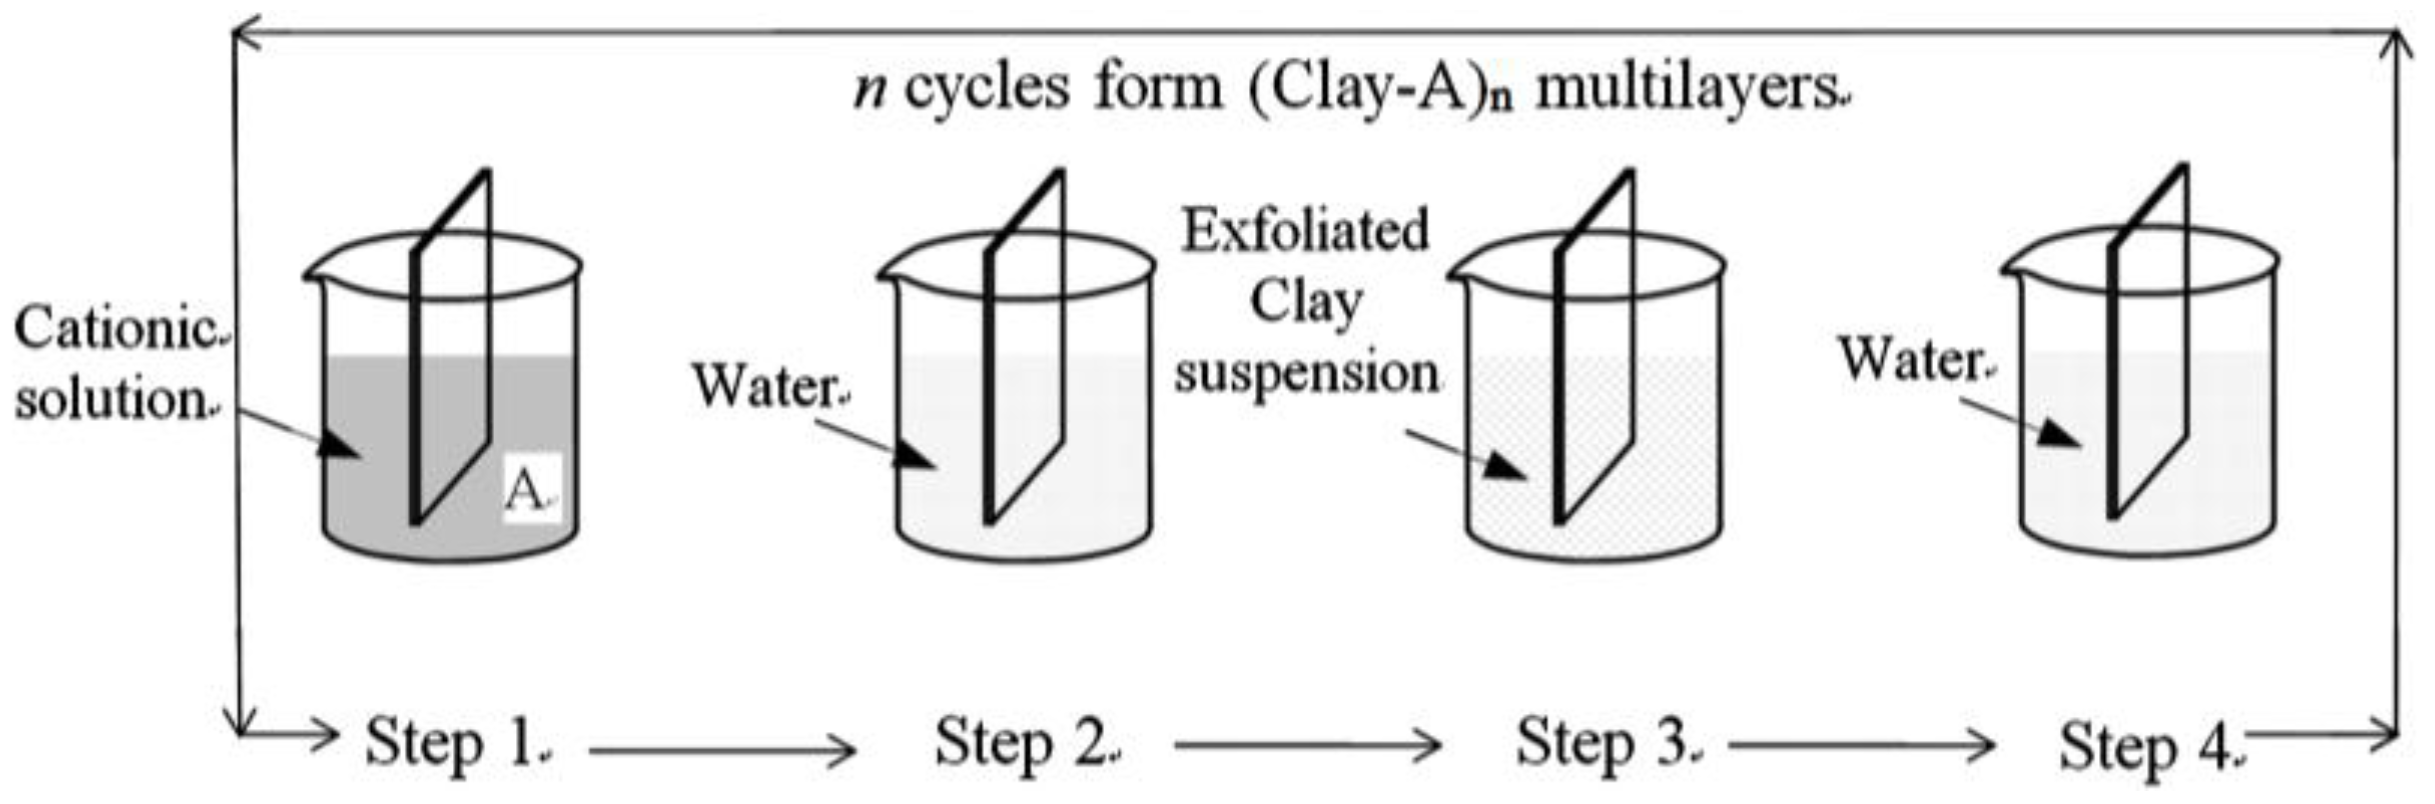
2.1. Sample Preparation

All of the films in this paper, including (ZrO2)30, (ZrO2-MMT)30, (ZrO2-MMT)60, (SnO2-MMT)30, and (ZrO2-MMT-SnO2-MMT)15 multilayer films, were prepared via a layer-by-layer (LbL) deposition process as described in [15,17] (Figure 1). A NIMA® automatic dip coater (Nima Technology Ltd., Coventry, UK) was used to deposit thin films. Epi-polished silicon wafers with thermally-oxidized surface layers (SiO2/Si) (Entegris Inc., San Diego, CA, USA), which is preferred for the wet chemical synthesis due to its relatively non-reactive SiO2 surface, were used as the substrate for all of the films.
Zirconia films were prepared by following a similar procedure described in [17]. The Si/SiO2 wafers were ultrasonically cleaned in 0.1 M NaOH solution for 20 min, immersed into piranha solution (3 vol. of 95–98 wt % H2SO4: 1 vol. of 30 wt % H2O2) for 20 min, rinsed with deionized water four times and dried in air. The substrates were alternately dipped into 0.06 M Zr4+ aqueous cationic precursor solution prepared from zirconium (IV) acetate hydroxide (Sigma-Aldrich, Saint Louis, MO, USA) and into 1.0 M aqueous ammonium hydroxide (NH4OH) anionic precursor solution at constant advance and withdraw dipping speeds of 20 mm per minute, with a holding time of 45 s in both anionic and cationic precursor solutions. Repeating the alternate deposition of 30 cycles gave an as-deposited (ZrO2)30 multilayered film, which was then isothermally annealed at 600 °C for 2 h in a box furnace, with ramped heating and cooling rates of 5 °C per minute.
A similar LbL deposition technique was employed to prepare clay-zirconia multilayered films [15,16]. Two kinds of sodium-rich montmorillonite (Na-MMT) clay minerals, Cloisite® Na+, and SWy-2, obtained from Southern Clay Products Inc. (Gonzales, TX, USA) and the Clay Minerals Society Repository (Purdue University, West Lafayette, IN, USA), respectively, were used to prepare 0.03 wt % and/or 0.4 wt % clay suspension. The clay samples were first stirred with magnet at 1000 rpm speed in deionized water for 20 min and then ultrasonicated for 20 min to achieve complete dispersion and exfoliation. The pre-cleaned substrates were dipped into a 0.1 M zirconium cationic precursor solution (pH = 4.14) prepared from zirconium (IV) acetate hydroxide and into the exfoliated clay suspension alternately without inter-dipping rinsing. Both the dipping and withdrawing speeds were controlled at 20 mm per minute. The holding time was kept to 45 s in air, Zr precursor solution, and clay suspension. The deposition cycle was repeated 30/60 times to prepare a (clay-ZrO2)30/60 multilayered film. The substrate was then air-dried at room temperature to form the as-deposited (clay-ZrO2)30/60 films, and further annealed isothermally to 400/600 °C for 2 h at a constant heating and cooling rate of 5 °C per minute to form the annealed (clay-ZrO2)30/60 films. Clay-tin oxide films (SnO2)30 and (ZrO2-Clay-SnO2-Clay)15 multilayer films were prepared with the same method as clay-zirconia films, with a clay solution of 0.4 wt % and cationic precursor solution of 0.05 M SnCl2. Summary of the clay-oxide films studied in this paper is presented in Table 1.

2.2. Nanoindentation Testing

Nanoindentation experiments were performed using an MTS Nano XP indenter® (MTS Nano Instruments Inc., Oak Ridge, TN, USA) at room temperature (~24 °C). A regular XP head and a dynamic contact module (DCM) head equipped with a diamond Berkovich indenter tip with a radius of <20 nm were used to indent the samples under a continuous stiffness measurement (CSM) mode, with load and displacement resolution of 50 nN and <0.01 nm for XP mode and 1 nN and <0.00002 nm for DCM mode. Combining a high-resolution DCM mode and a regular XP mode for shallow and deep indentations, respectively, improves the reliability of the test results.
Before indentation testing, each film, together with its substrate, was glued onto a cylindrical aluminum puck using melted Crystalbond 509 amber resin (Aremco Products Inc., Valley Cottage, NY, USA) heated to 130 °C. For each sample, a rigorous five-step testing scheme was employed to ensure high reliability and accuracy of the results: (1) tip cleaning by indentations (nine indents) on a piece of Scotch double-sided sticky tape; (2) pre-testing of the tip by indenting on standard fused silica to calibrate the tip and check the instrument working status; (3) film indentation testing on the film sample under XP and/or DCM mode at locations (15 indenting locations for each mode with a 3 × 5 array) spaced at 150 μm apart for XP mode, and in the same pattern but with 0.5 spacing shift for DCM mode; (4) post-testing tip checking by indenting on the same standard fused silica again. If the measured modulus and hardness value deviated from the standard value significantly, the data obtained in Step 3 were discarded and a new measurement was made starting with Step 1; and (5) data screening by checking the agreement of the 15 load-displacement curves plotted together. If a large discrepancy existed, all the data were discarded and indentations were repeated by selecting a new area of the film. If one or two curves shifted away from the majority curves, these curves were discarded and the rest of the data were regarded as acceptable.
The XP and DCM indentations followed the ISO 14577 method [24] under the load control mode, since no significant creep occurred within the peak load holding period during the preliminary indentation tests. For the 15 indentations under XP mode, the maximum load Fmax ranged from 500 mN to 0.39 mN, with each subsequent Fmax being 60% of the previous value. The same loading scheme was also used for the 15 DCM indentations, except that Fmax ranged from 10 mN to 0.008 mN. For both modes, a trapezoidal loading profile was used for all indentations, consisting of five steps (Figure 2): (1) increase the load linearly to a specified maximum value (Fmax) at a constant loading rate with a loading time of 30 s; (2) hold Fmax constant for 10 s; (3) decrease the load linearly to 10% of Fmax at the same rate as loading; (4) hold the load constant for 60 s to record the thermal drift of the instrument; and (5) decrease the load to zero linearly at the same loading rate in Steps (1) and (3).

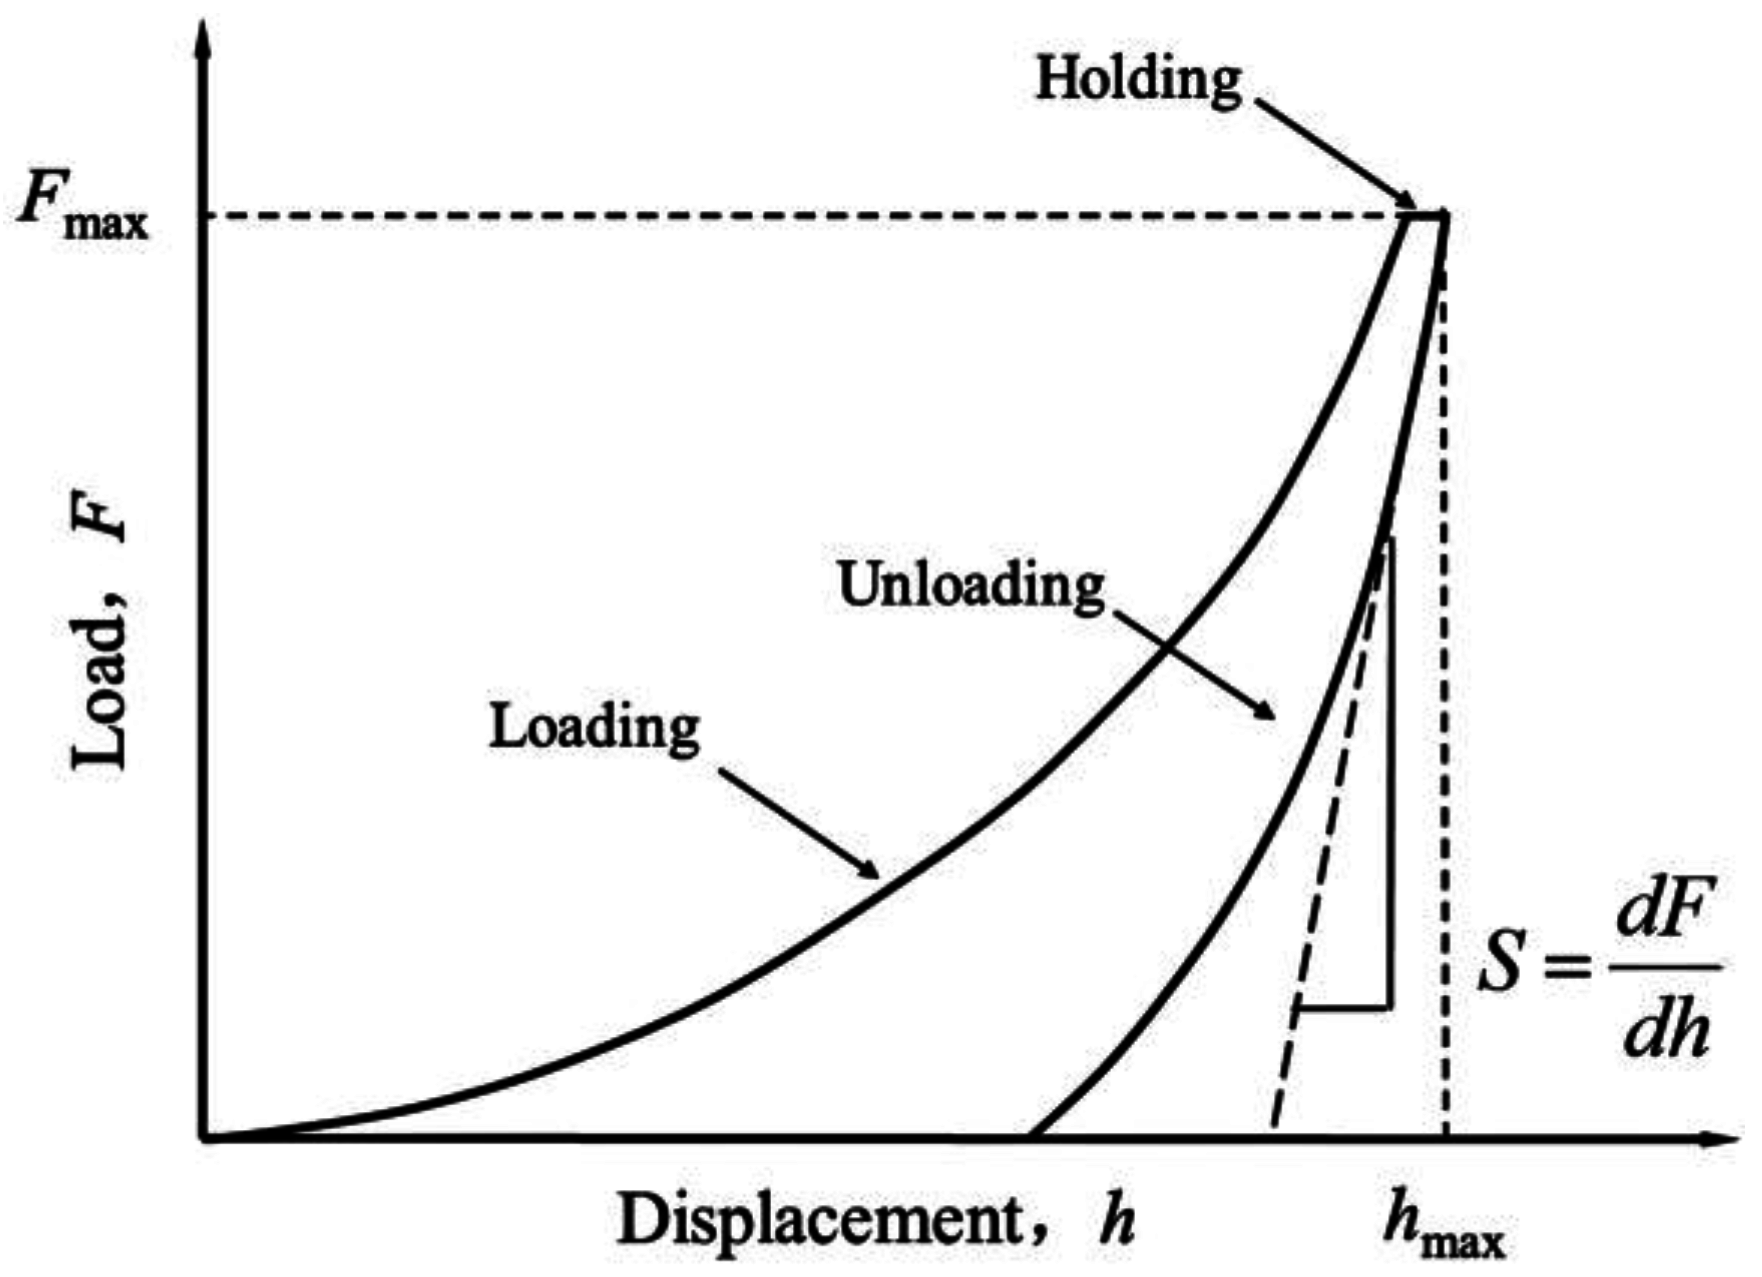
2.3. Data Analysis Method

The Young’s modulus was derived from the load F, indentation depth h, and harmonic contact stiffness S recorded during the loading section of the test by using the Oliver and Pharr method [22,23,25,26]. An elastic parameter, reduced modulus (Er), is obtained by:
E r = π 2 β A c S
where β is a dimensionless correction factor for the indenter tip shape and β = 1.05 is commonly recommended for a Berkovich indenter [26]; S is the contact stiffness defined as the slope of the initial unloading curve at the maximum indentation depth (hmax); Ac is the projected contact area between the indenter and sample, which is obtained through the contact depth hc [22,23]:
A c = C 0 h c 2 + j = 1 8 C j h c ( 1 2 ) j 1
where hc can be determined by:
h c = h max ε F max S
where ε is a constant that depends on the indenter tip geometry (for a Berkovich tip, ε = 0.75). For a perfect Berkovich indenter, the leading term C0 is 24.5; Cj (j = 1, 2, …, 8) are needed to describe the deviations of the tip shape from the perfect Berkovich geometry owing to tip blunting. These constants were determined through tip calibration indentation tests on standard fused silica with a Young’s modulus E of 72 GPa.
The elastic modulus of the sample is derived by [27,28]:
1 E r = 1 ν c 2 E c + 1 ν i 2 E i
where νc and νi are the Poisson’s ratio of the sample and indenter; Ei and Ec are the elastic modulus of the indenter and sample, respectively. For a diamond indenter, Ei = 1141 GPa, νi = 0.07. For the case of thin films, in which the indented zone is affected by the underlying substrate, Ec represents the “mean” response of the film-substrate composite.
Indentation hardness, also regarded as the composite hardness for substrate-affected films, is determined by:
H c = F max A c
The Oliver and Pharr method has been widely used to determine the hardness and elastic modulus of small-scale bulk materials. It can also be used for thin films on substrate, provided that the maximum indentation depth is less than 10% of the film thickness to avoid the stiffness contribution of the substrate to the indenter-sample contact [15]. Much effort has been devoted to finding methods of deriving the film modulus and hardness from the measured composite response of tip-film-substrate system, e.g., introduction of the exponential weighting factors to divide contributions of the film and substrate to the composite modulus by Doerner et al., King et al. and Saha et al. [28,29,30]; a closed-form solution based on moduli-perturbation method by Gao [31]; an extrapolating method of the best-fit curve of experimental data by Mencik et al. [32] and Fisher-Cripps [33,34]; the deconvolution of film properties method modified from Hu’s solution [35] by Jung et al. [36]. In this paper, the method proposed by Korsunsky et al. [37] and Tuck et al. [38] based on an energy-based analysis of indentation testing is used to extract the film hardness Hf by:
H c = H s + H f H s 1 + [ ( h / t ) / β 0 ] X
Similarly, the film modulus Ef can be obtained by the following equation proposed by Wei and Zhang [39,40]:
E c = E s + E f E s 1 + [ h / ( t β 1 ) ] Y
where β0, β1, X and Y are constants obtained through curve-fitting of the experimentally-determined Hc and Ec; Hs and Es are the substrate hardness and modulus, respectively, with Es = 172.4 GPa and Hs = 12.28 GP for the Si/SiO2 wafer substrate used herein; h/t is the normalized indentation depth, a non-dimensional parameter. In the present study, the film-substrate composite elastic modulus Ec and composite indentation hardness Hc were obtained using the nanoindenter control program TestWorks Explorer® based on the Oliver and Pharr method [22,23] with an assumed Poisson’s ratio of 0.22 for all of the films, where the value of the Possion’s ratio has little influence on the indentation results [30,32]. Deconvolution of film properties from composite hardness and modulus using Equations (6) and (7) was achieved by the statistical analysis program SAS® version 9.1, where nonlinear procedures and Newton iterative methods were adopted. It is noteworthy that the inaccuracy of film thickness t used in normalizing indentation depth (h/t) only causes the shift of the fitted curve along the h/t axis, but does not induce errors to the fitted film hardness Hf and modulus Ef. This advantage avoids the time-consuming work on the determination of film thickness. Another advantage is that the fitted substrate Es and Hs can be used to check the reliability and accuracy of the experiment data, since they can be easily obtained from literature or can be accurately determined by nanoindentation.

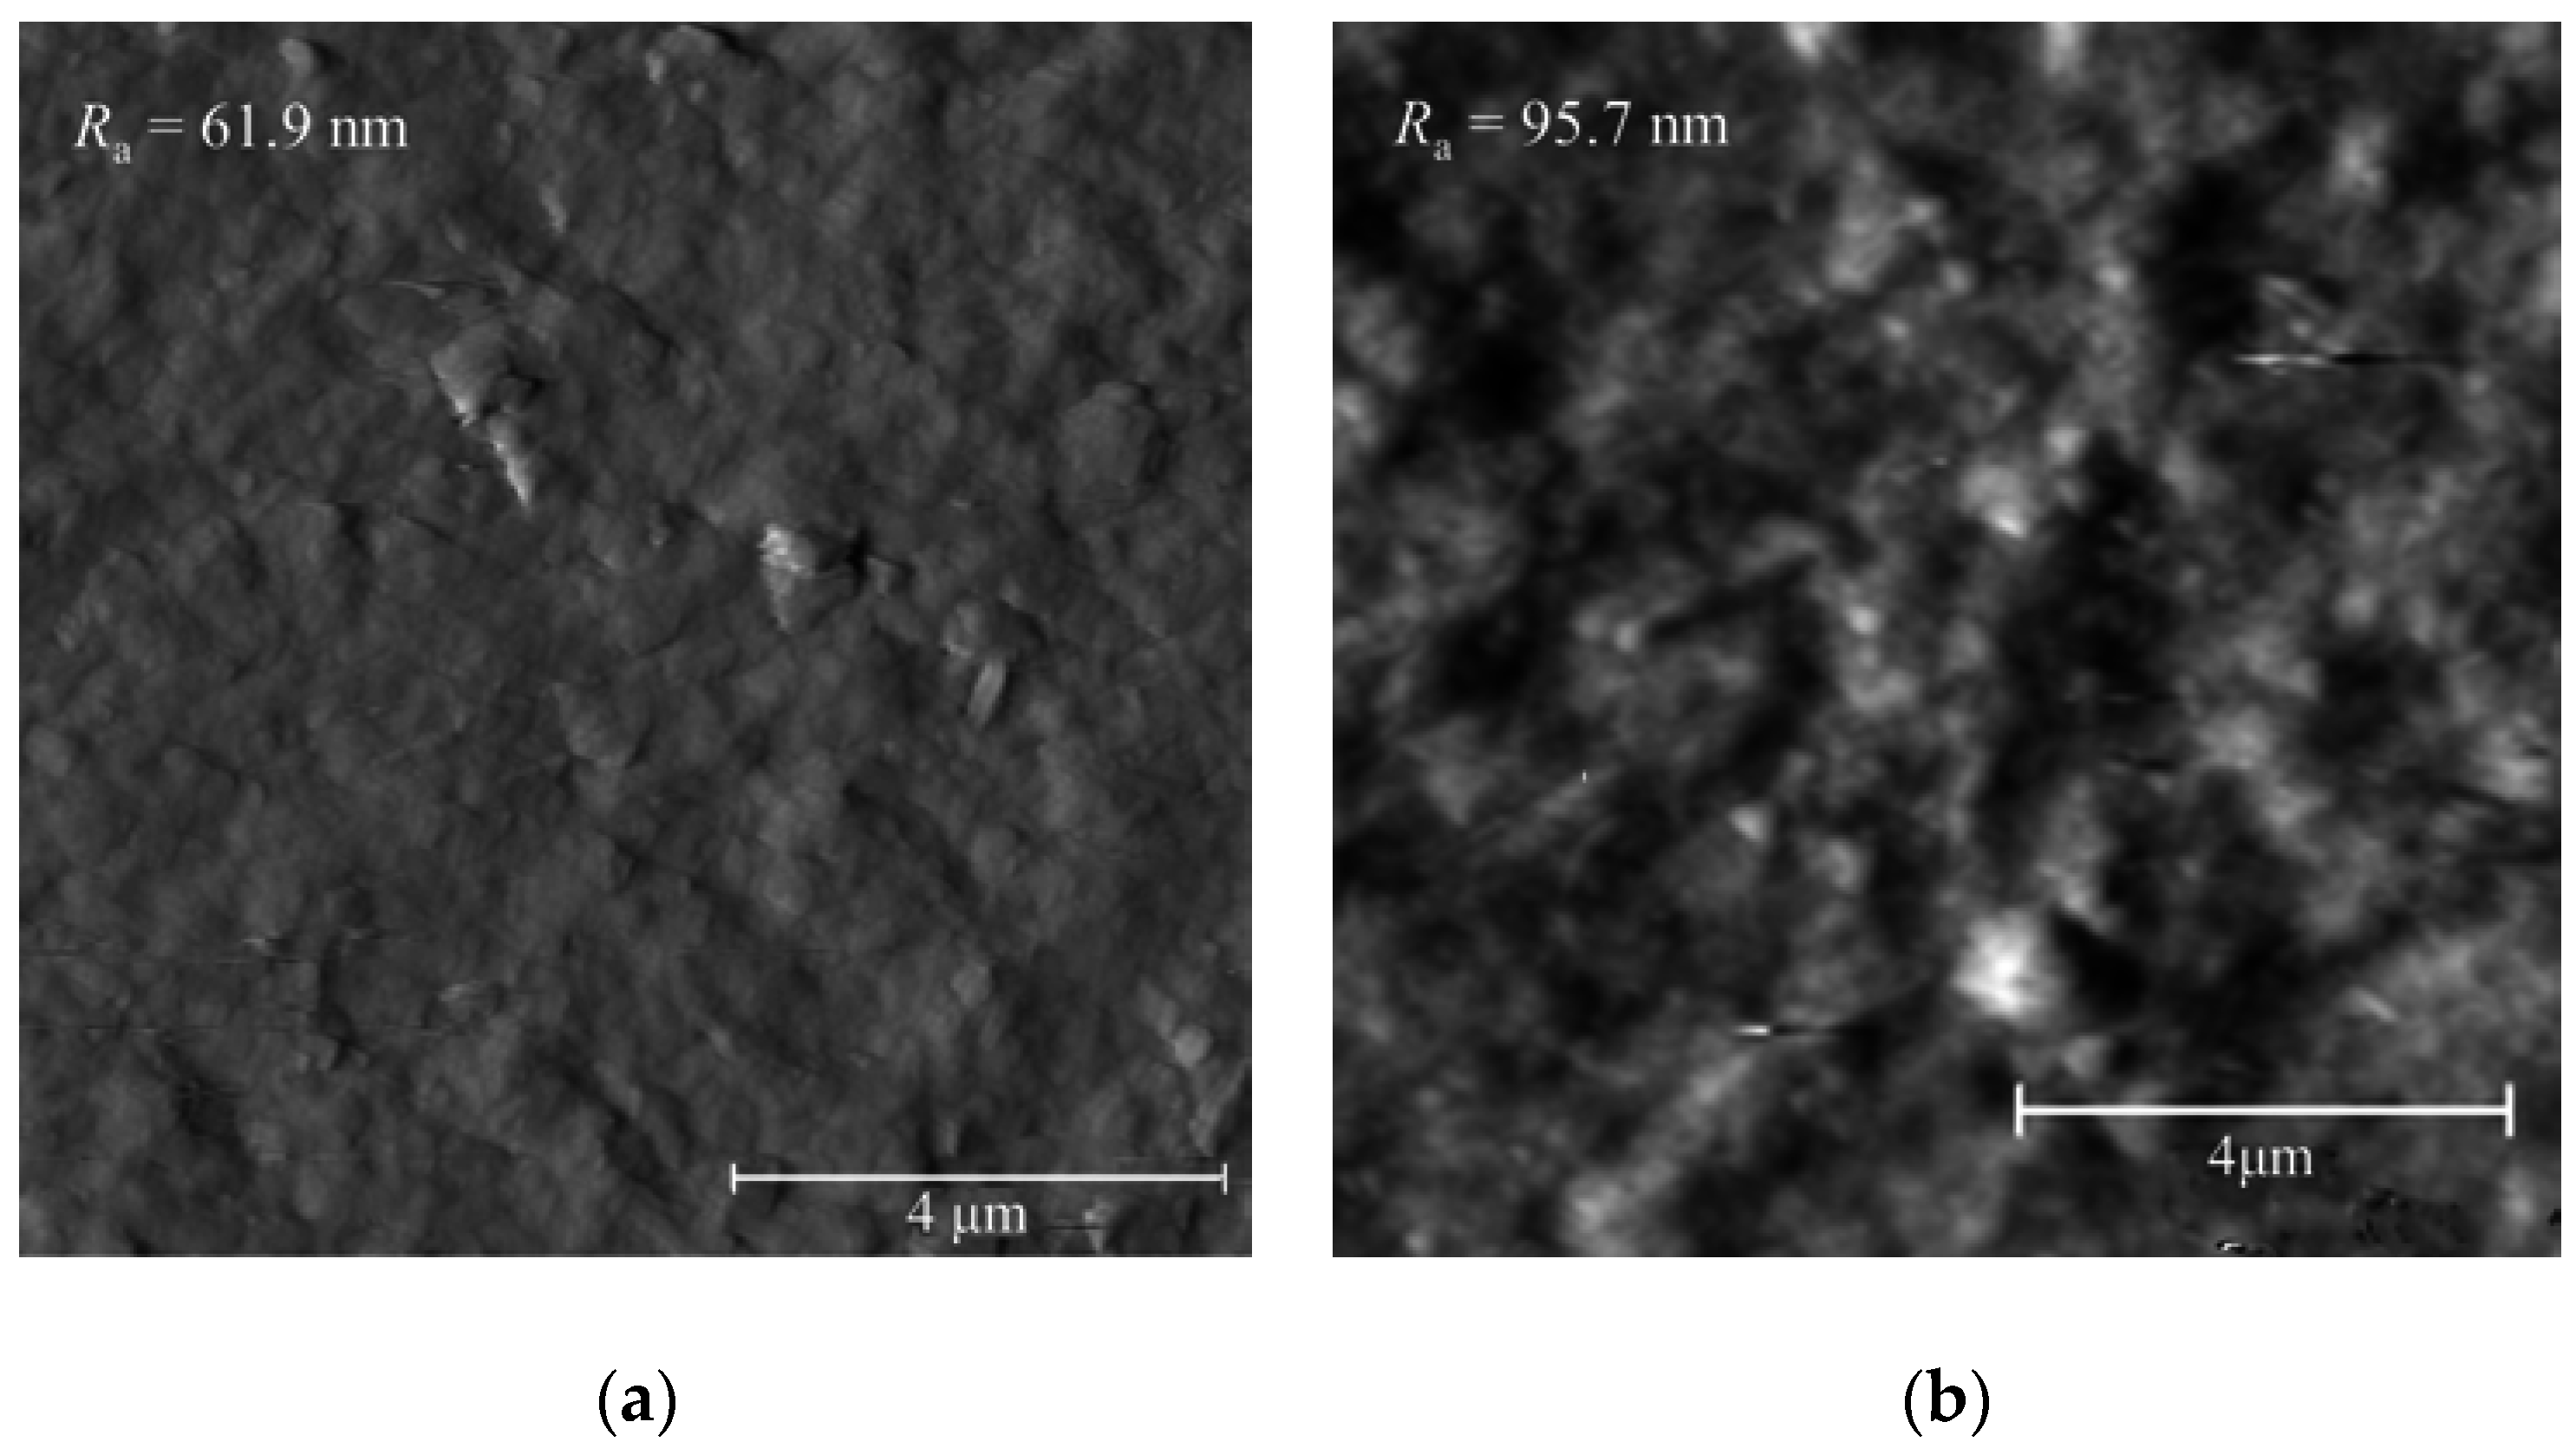
2.4. Atomic Force Microscopy (AFM) Images

The surface morphology of the films was characterized using a 5500 Scanning Probe Microscope (Agilent Technologies, Inc., Chandler, AZ, USA) with scan resolution of 512 pixels × 512 pixels, set point 1.000 V, and scan rate 1.0 Hz. The measurement was conducted in ambient temperature, in a contact mode with the PointProbe®Plus silicon tip (Nanosensors, Neuchatel, Switzerland) of 10–15 µm in height. The most commonly used surface roughness parameter Ra is used to characterize the surface topography:
R a = 1 n i = 1 n | y i |
where yi is the vertical distance from the mean line to the ith data point; n is the total tracing number within a specific area.
The residual indent image scanned by AFM is used to characterize the indent behavior (e.g., pile-up/sink-in, delamination between layers and between film and substrate) in parallel with the corresponding load-displacement curve.

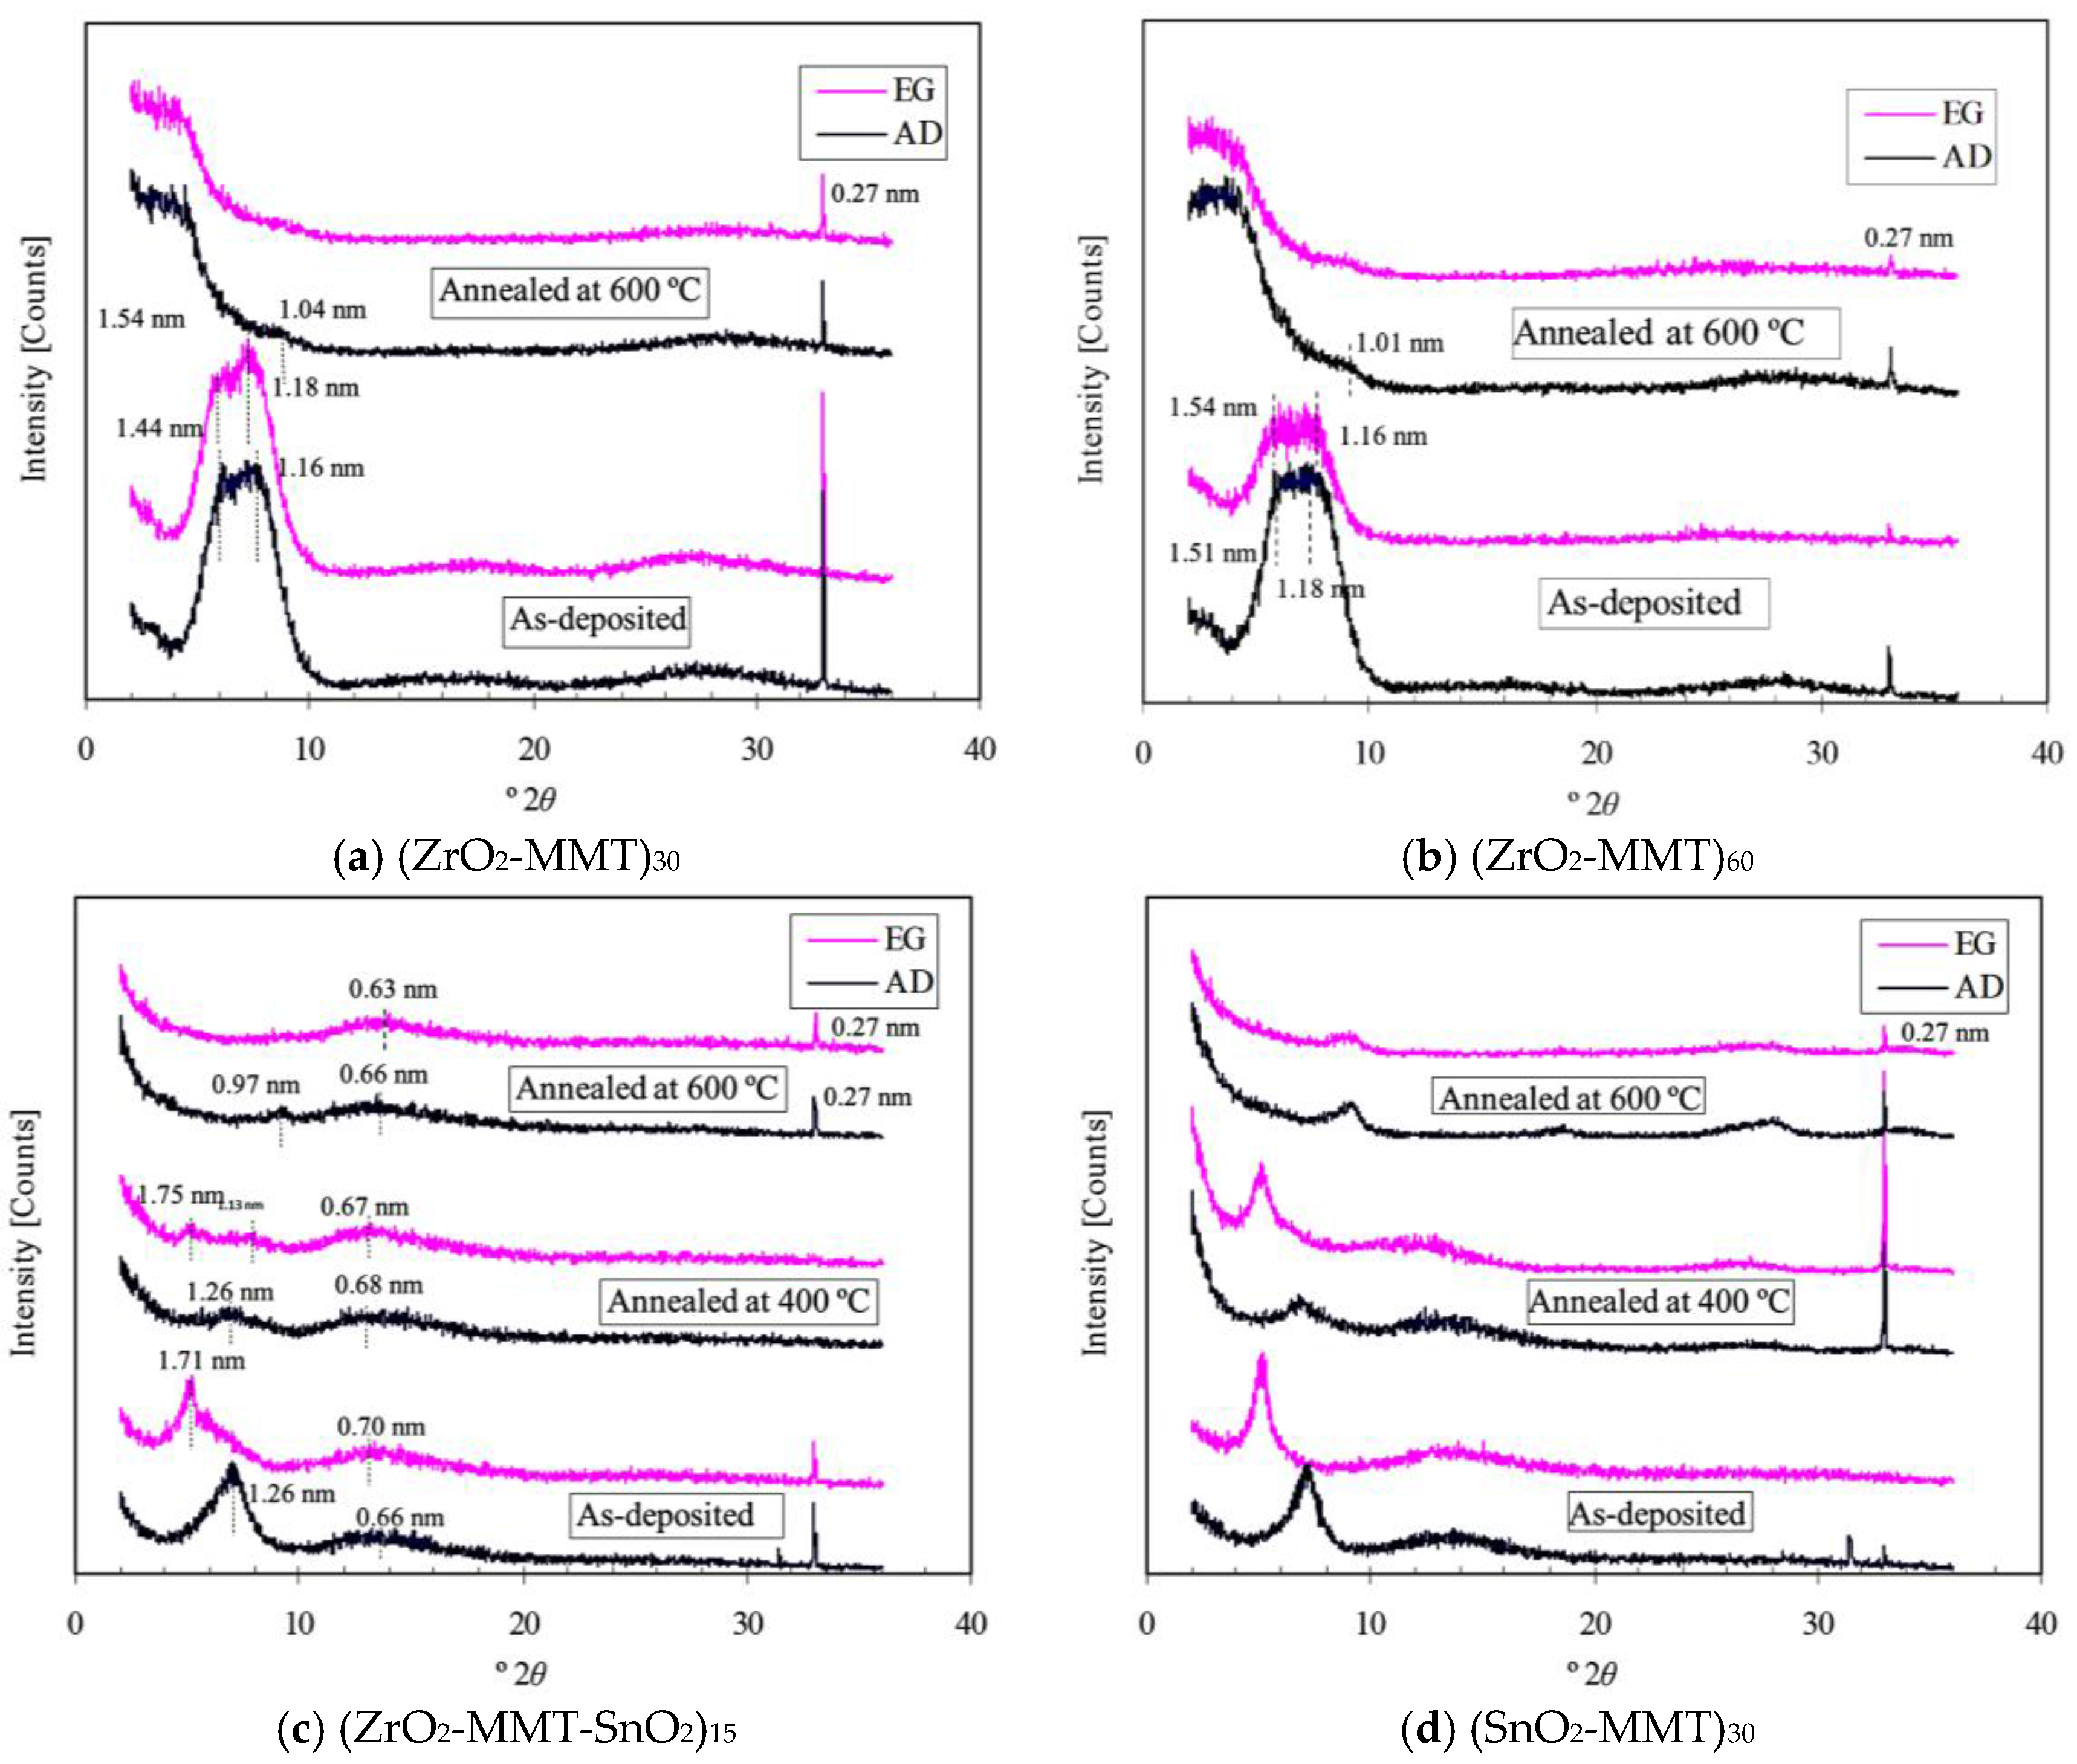
2.5. X-ray Diffraction (XRD)

Expandability of the clay-based multilayers formed under as-deposited and annealed conditions was investigated by X-ray diffraction (XRD). XRD patterns were collected on a Siemens D-5000 diffractometer using Cu-Kα radiation generated at 40 kV and 30 mA and a scan range of 2°–34° (2θ). All scans employed sample spinning and a 0.996° divergence slit, 0.501° scatter slit, 0.1 mm receiving slit, a speed of 1° (2θ)/min, and a step size of 0.02° (2θ).

3. Results and Analysis

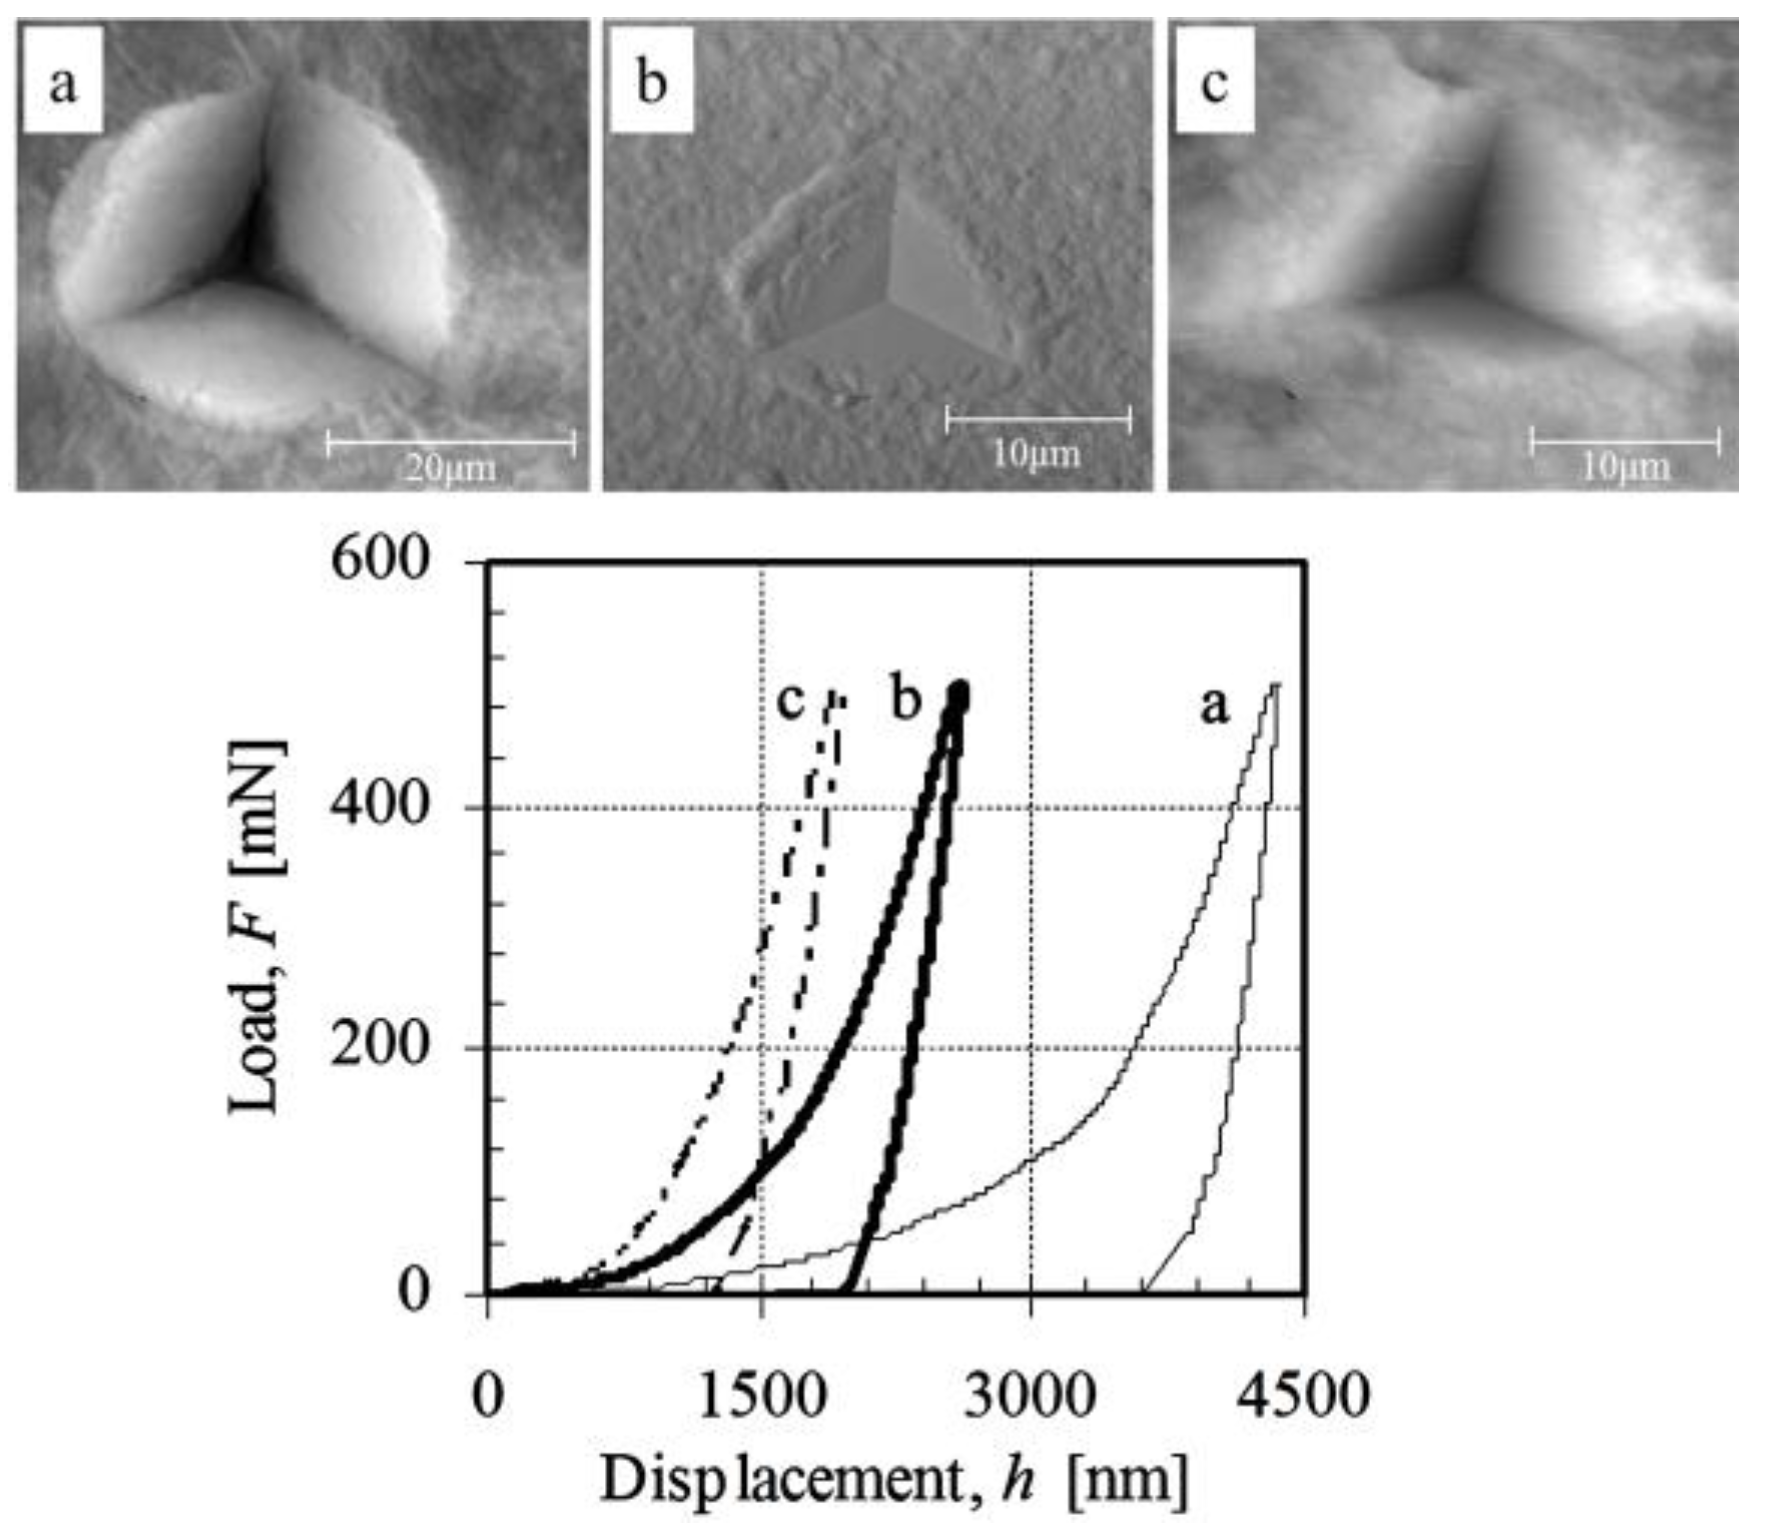
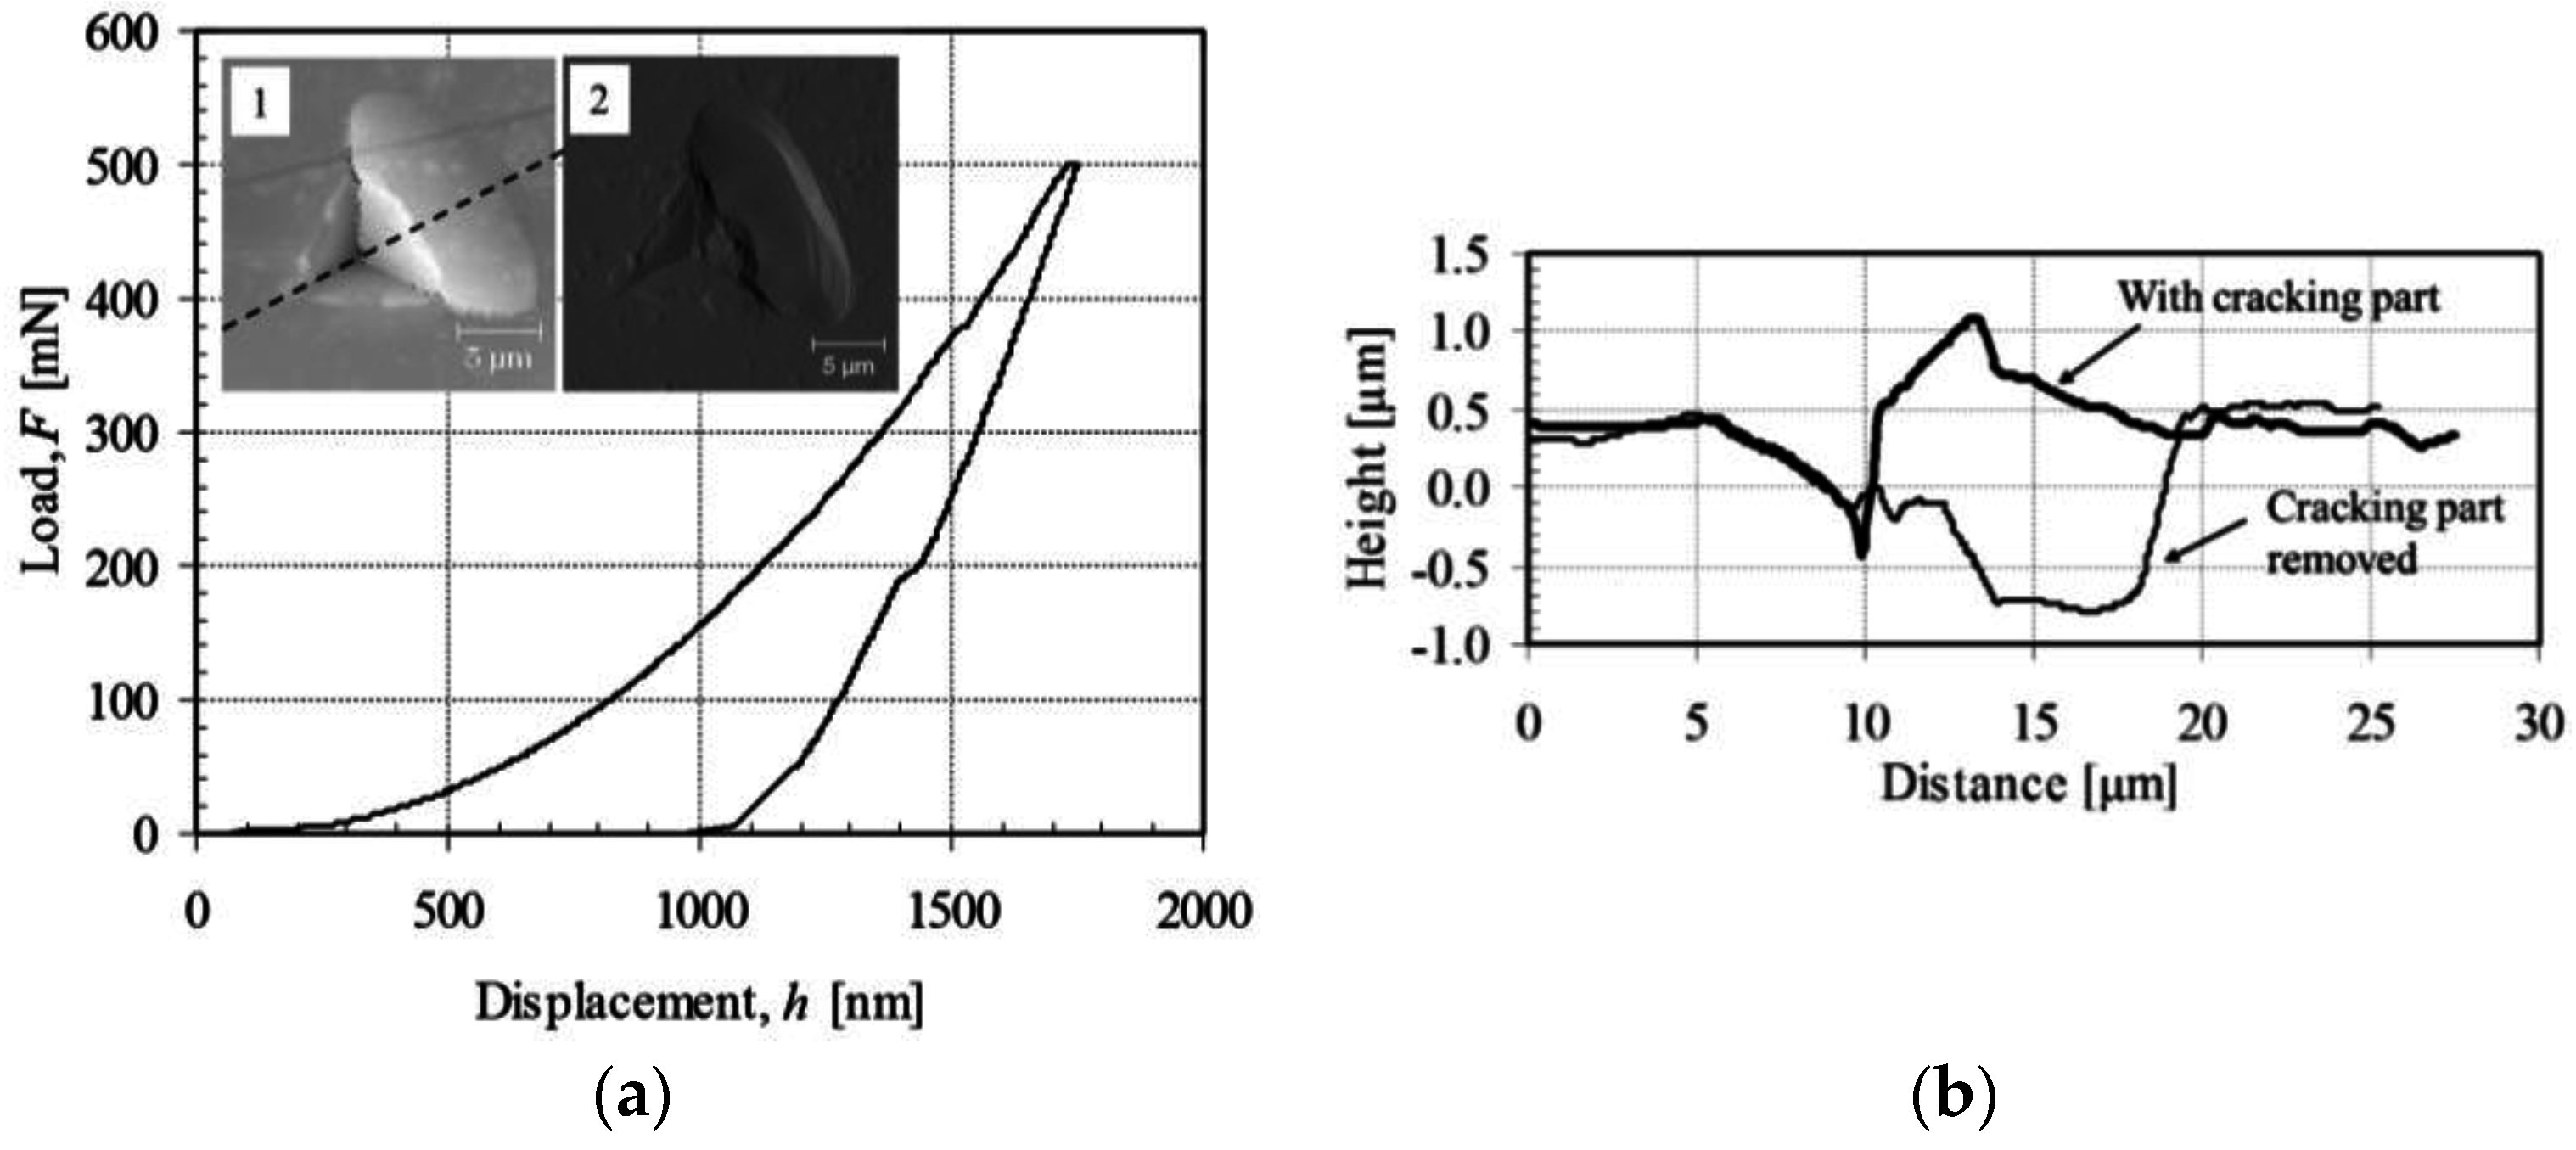
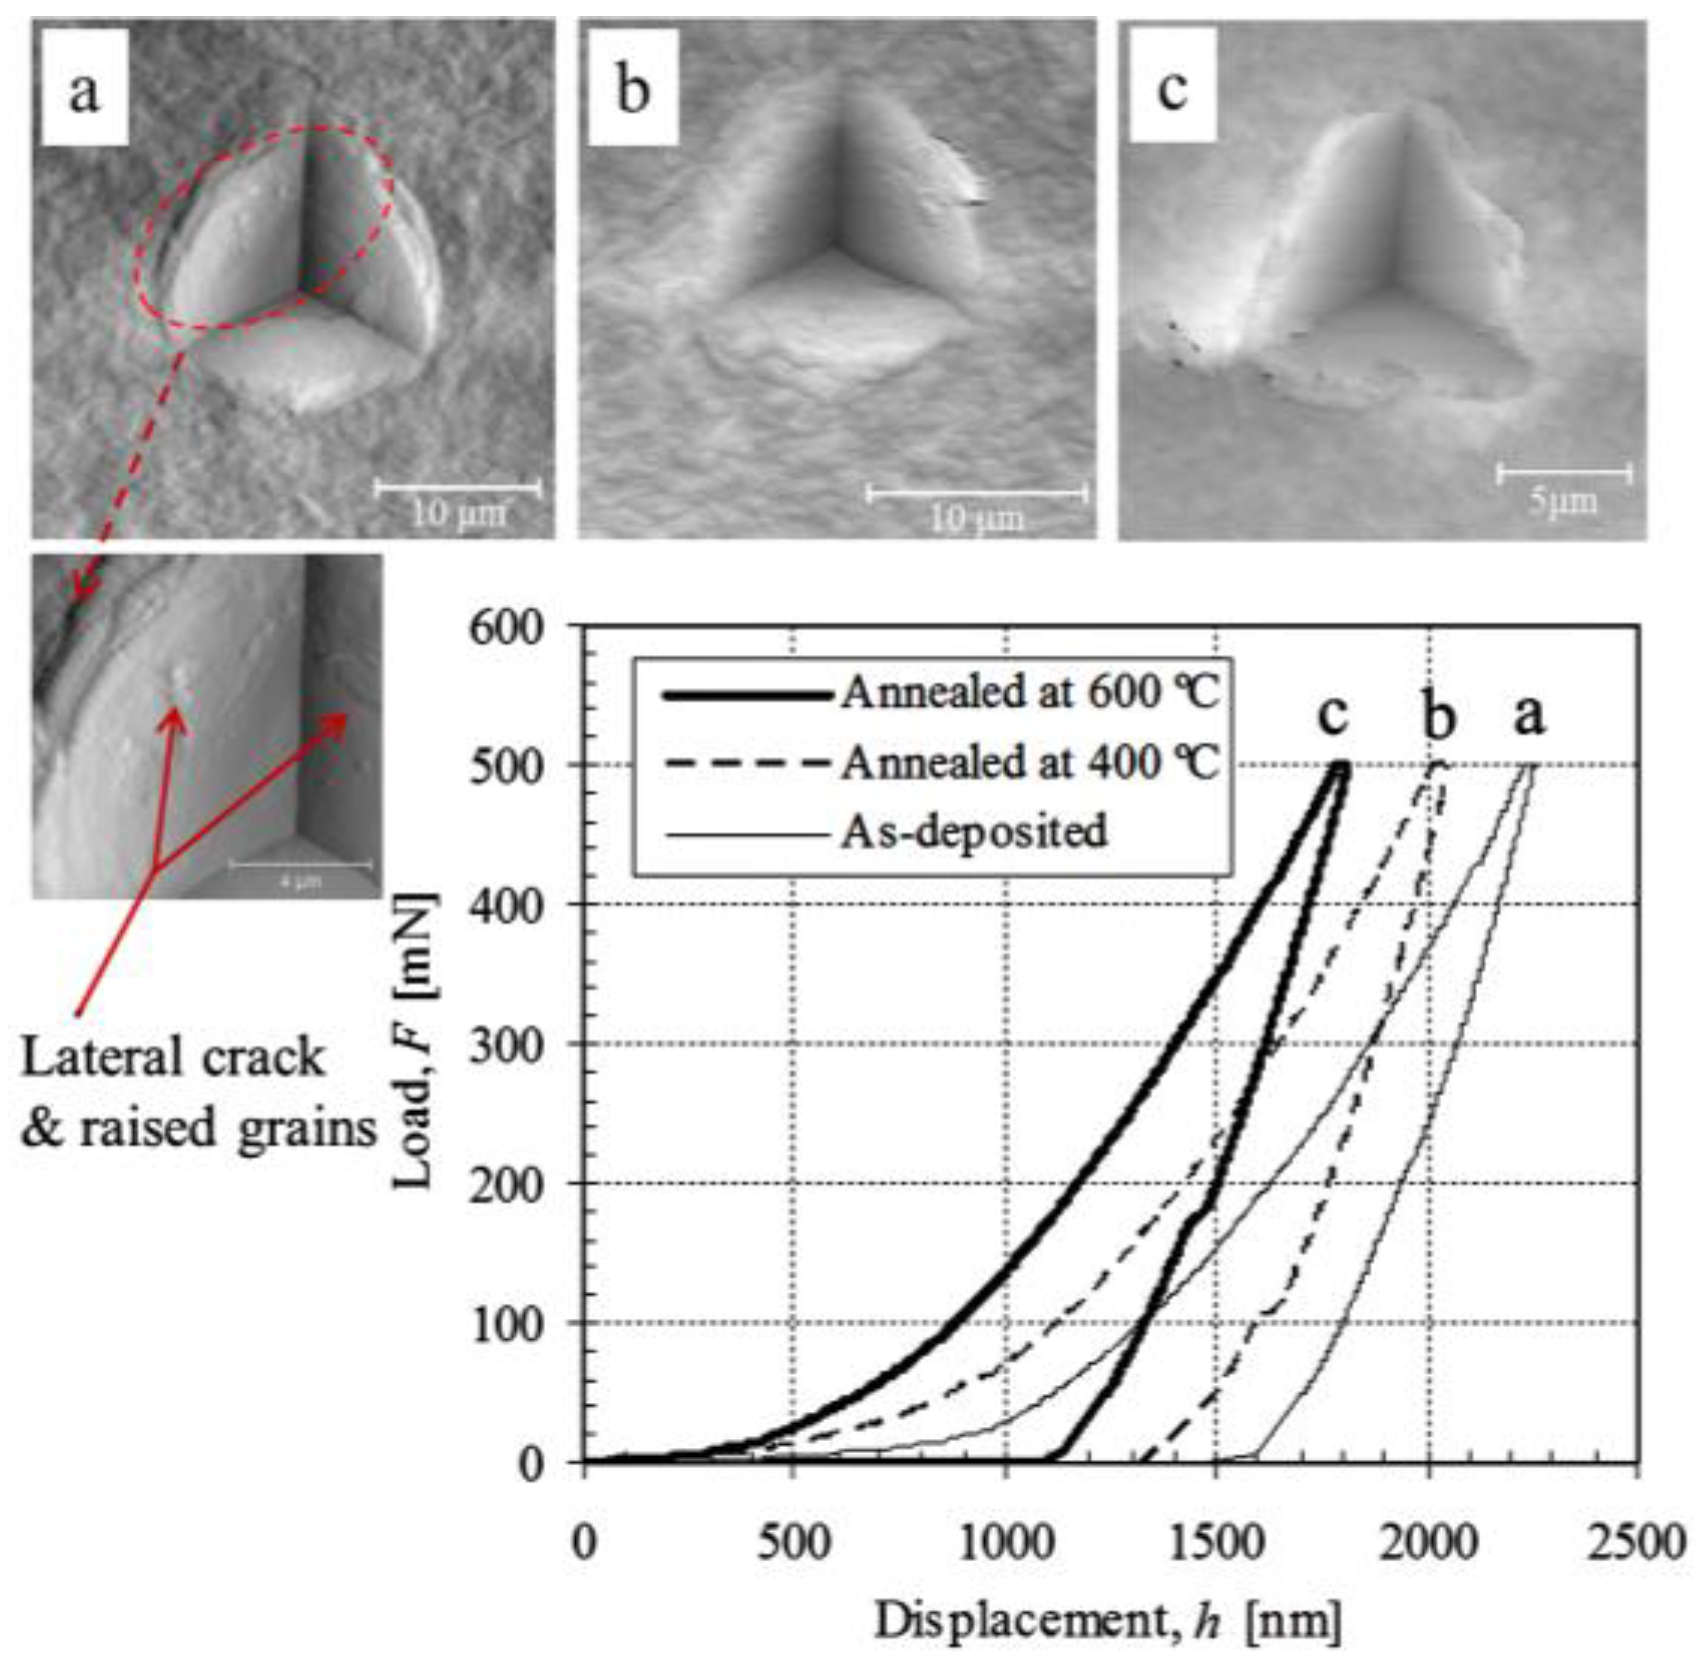
3.1. Typical F–h Curves and Residual Images

The typical indentation load-displacement curves and indent impressions of (SnO2-MMT)30 and (ZrO2-MMT-SnO2-MMT)15 multilayers are shown in Figure 3 and Figure 4, respectively. The total indentation depth and residual depth under the same maximum load are greatly reduced as the annealing temperature increases for both multilayers. The indent images show that an apparent pile-up occurred around the contact impressions for the as-deposited films. A tendency of sink-in impressions increases with the increment of the annealing temperature, which makes the film become stiffer. No visible radial cracks developed for all the samples as that happened in muscovite, a naturally-formed nanostructured multilayer [40,41]. A partial lateral crack and a few raised grains on the surface of impression are observed in the AFM image shown in insert (a) of Figure 4. These grains with dimension of 300–600 nm are possibly the non-exfoliated clay particles.
Smooth loading curves and non-visible cracks in Figure 3 and Figure 4 demonstrate that the bonding strength either between clay platelets and cation layers or at the interface between films and substrate is strong enough to resist the complicated stress and strain fields generated by the sharp indenter. The film thickness of annealed films at 600 °C considerably shrinks by ~50% compared with that of the as-deposited condition [15]. Such structural integrity may be attributed to the high lateral bond strength of clay platelets, as well as high bonding strength. It is evident that clay-oxide multilayers prepared by the above method have a great advantage of superior tolerance to mechanical strain.
An AFM image of one indent impression of as-deposited (ZrO2-MMT)30 multilayers with MMT 0.03 wt % was taken after 4 months of indentation testing and is shown in insert (1) of Figure 5a. The corresponding Fh curve indicates that small cracks occurred during both loading and unloading processes. However the jumped displacement under relatively constant load shown by the Fh curve is far smaller than that measured by the AFM images shown in the cross-section profile. This is mainly due to the continuous recovery of the strain within the indentation-affected volume during the long unloading time, which makes the cracked part rise upwards. Further investigation of the indent impression is conducted by carefully removing the cracked part and taking an AFM image, which is shown in insert (2) of Figure 5a. The cross-section profile along the dashed line in insert (1) of Figure 5a is shown in Figure 5b, indicating that the deepest cracking surface occurred far below the residual apex level. This reveals that the crack has passed the interface between the film and substrate and propagated into the substrate. Smoothness of the exposed crack surface further manifests that no delamination appears either between the multilayers or at the interface between the multilayers and the substrate.

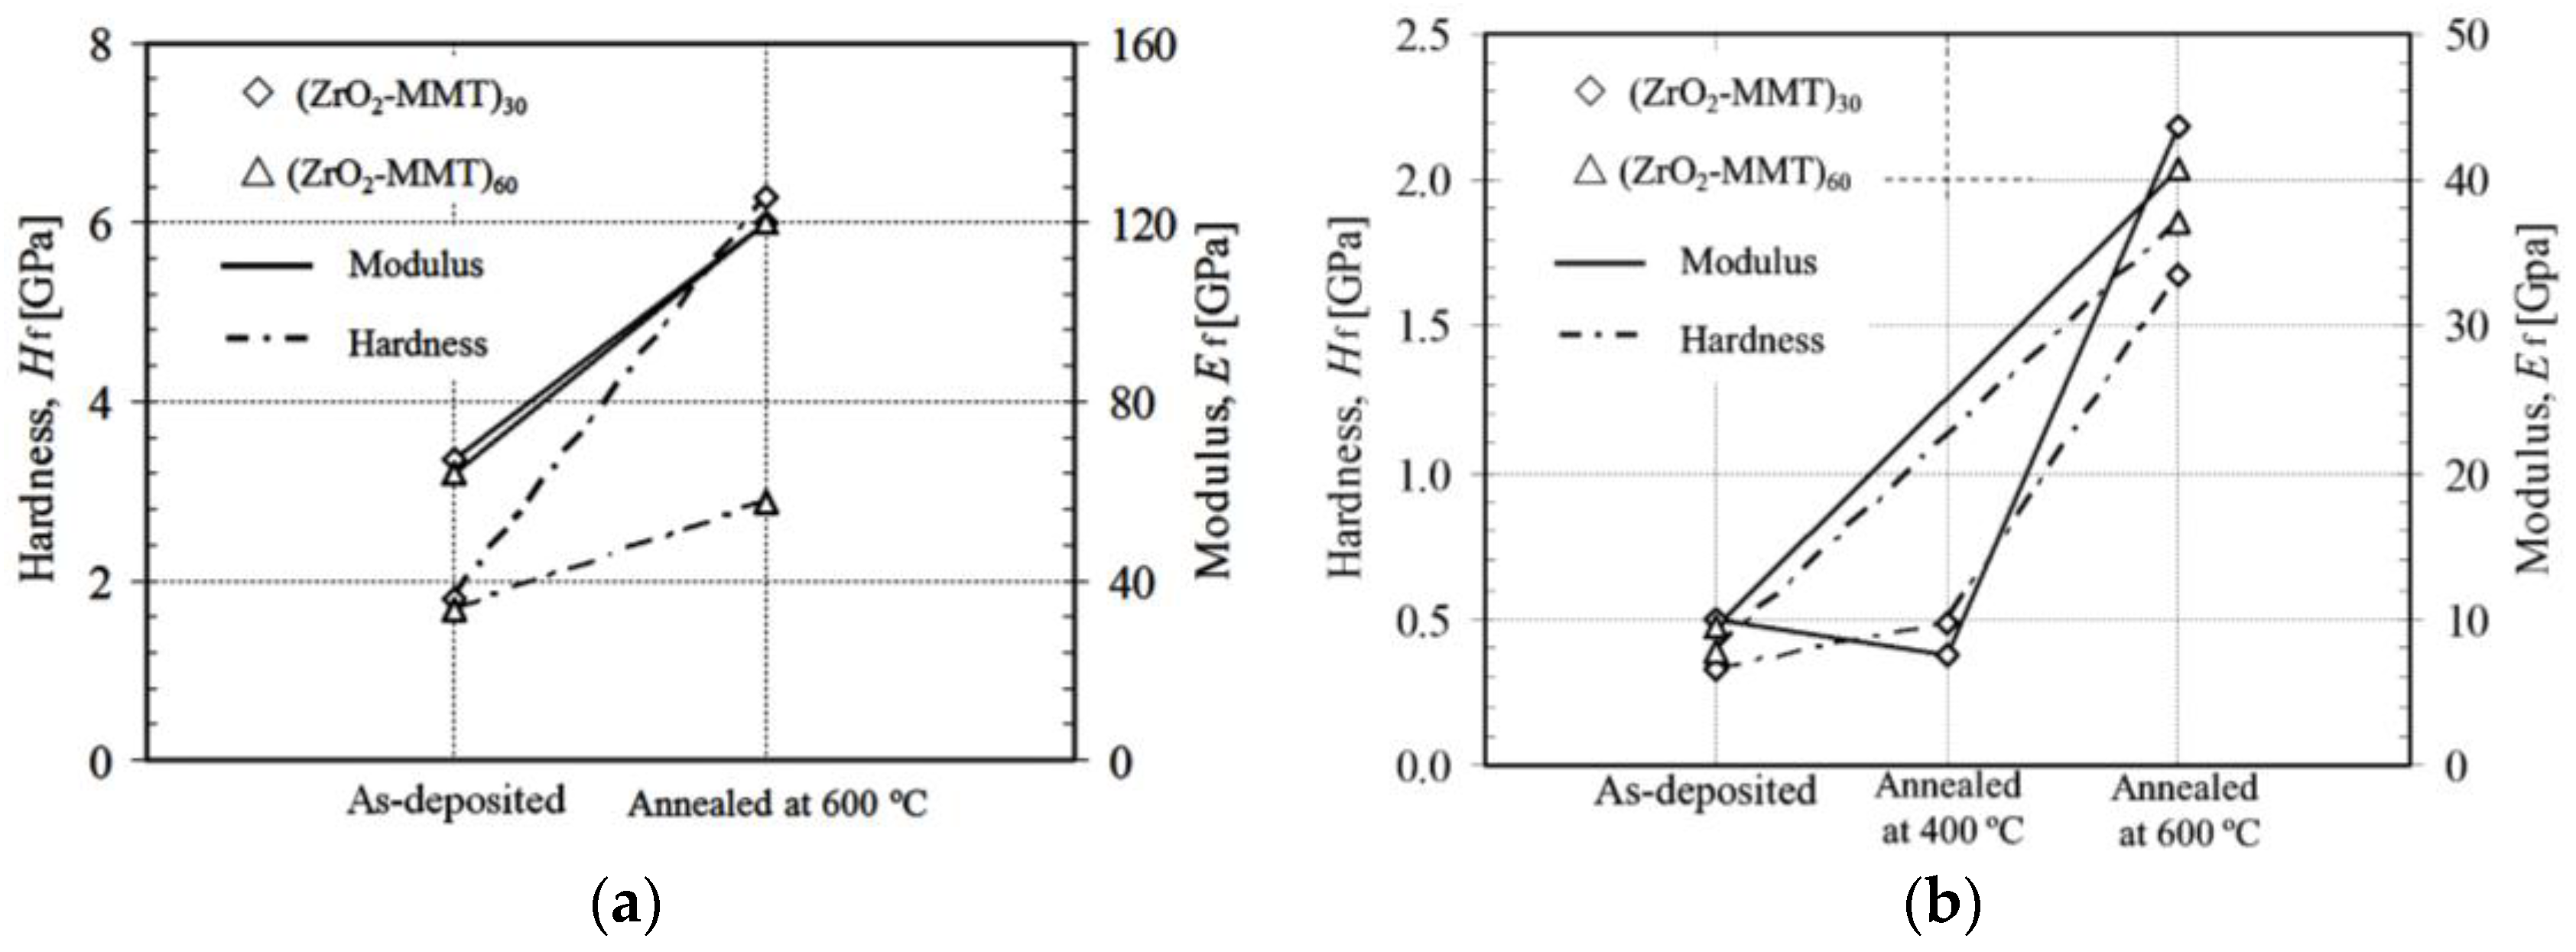
3.2. Effect of As-Deposited and Annealing Procedure

Figure 6 shows an example of experimental data fitting result using statistical analysis program SAS® version 9.1.3 on the zirconia-MMT multilayers. A summary of fitted film hardness and moduli of all of the testing samples is presented in Table 1, among which the typical results of the as-deposited and annealed conditions (at 600 °C) (ZrO2-MMT)30 and (ZrO2-MMT)60 multilayers with 0.03 wt % and 0.4 wt % of clay suspension are shown in Figure 7. It is evident that the annealing process considerably enhances the film hardness and modulus. For the zirconia-MMT multilayers with 0.03 wt % of clay suspension (Figure 7a), Hf increases from 1.82 GPa to 6.29 GPa for (ZrO2-MMT)30, and from 1.67 GPa to 2.89 GPa for (ZrO2-MMT)60. Meanwhile, significant increment of moduli Ef of the annealed multilayers (from 67.06 GPa to 119.9 GPa for (ZrO2-MMT)30, and from 63.78 GPa to 120.1 GPa for (ZrO2-MMT)60) were observed compared with the as-deposited ones. For the zirconia-MMT multilayers with 0.4 wt % of clay suspension (Figure 7b), Hf increases from 0.33 GPa to 1.68 GPa for (ZrO2-MMT)30, from 0.39 GPa to 1.86 GPa for (ZrO2-MMT)60, and Ef increases from 9.94 GPa to 43.75 GPa for (ZrO2-MMT)30, from 9.36 GPa to 40.69 GPa for (ZrO2-MMT)60. One reason for such enhancement of hardness and moduli is that the annealing process strengthens the bonding interaction between clay layers and Zr4+ cationic layers, where excess water is expelled out by physical and chemical reactions. Consequently, the interlayer spacing of clay layers occupied by Zr4+ cationic layers is reduced, resulting in a much thinner thickness of annealed multilayers than the as-deposited one. This is manifested by the average film growth rates of as-deposited and annealed multilayers of ~6.8 nm and 3.2 nm, respectively [15].

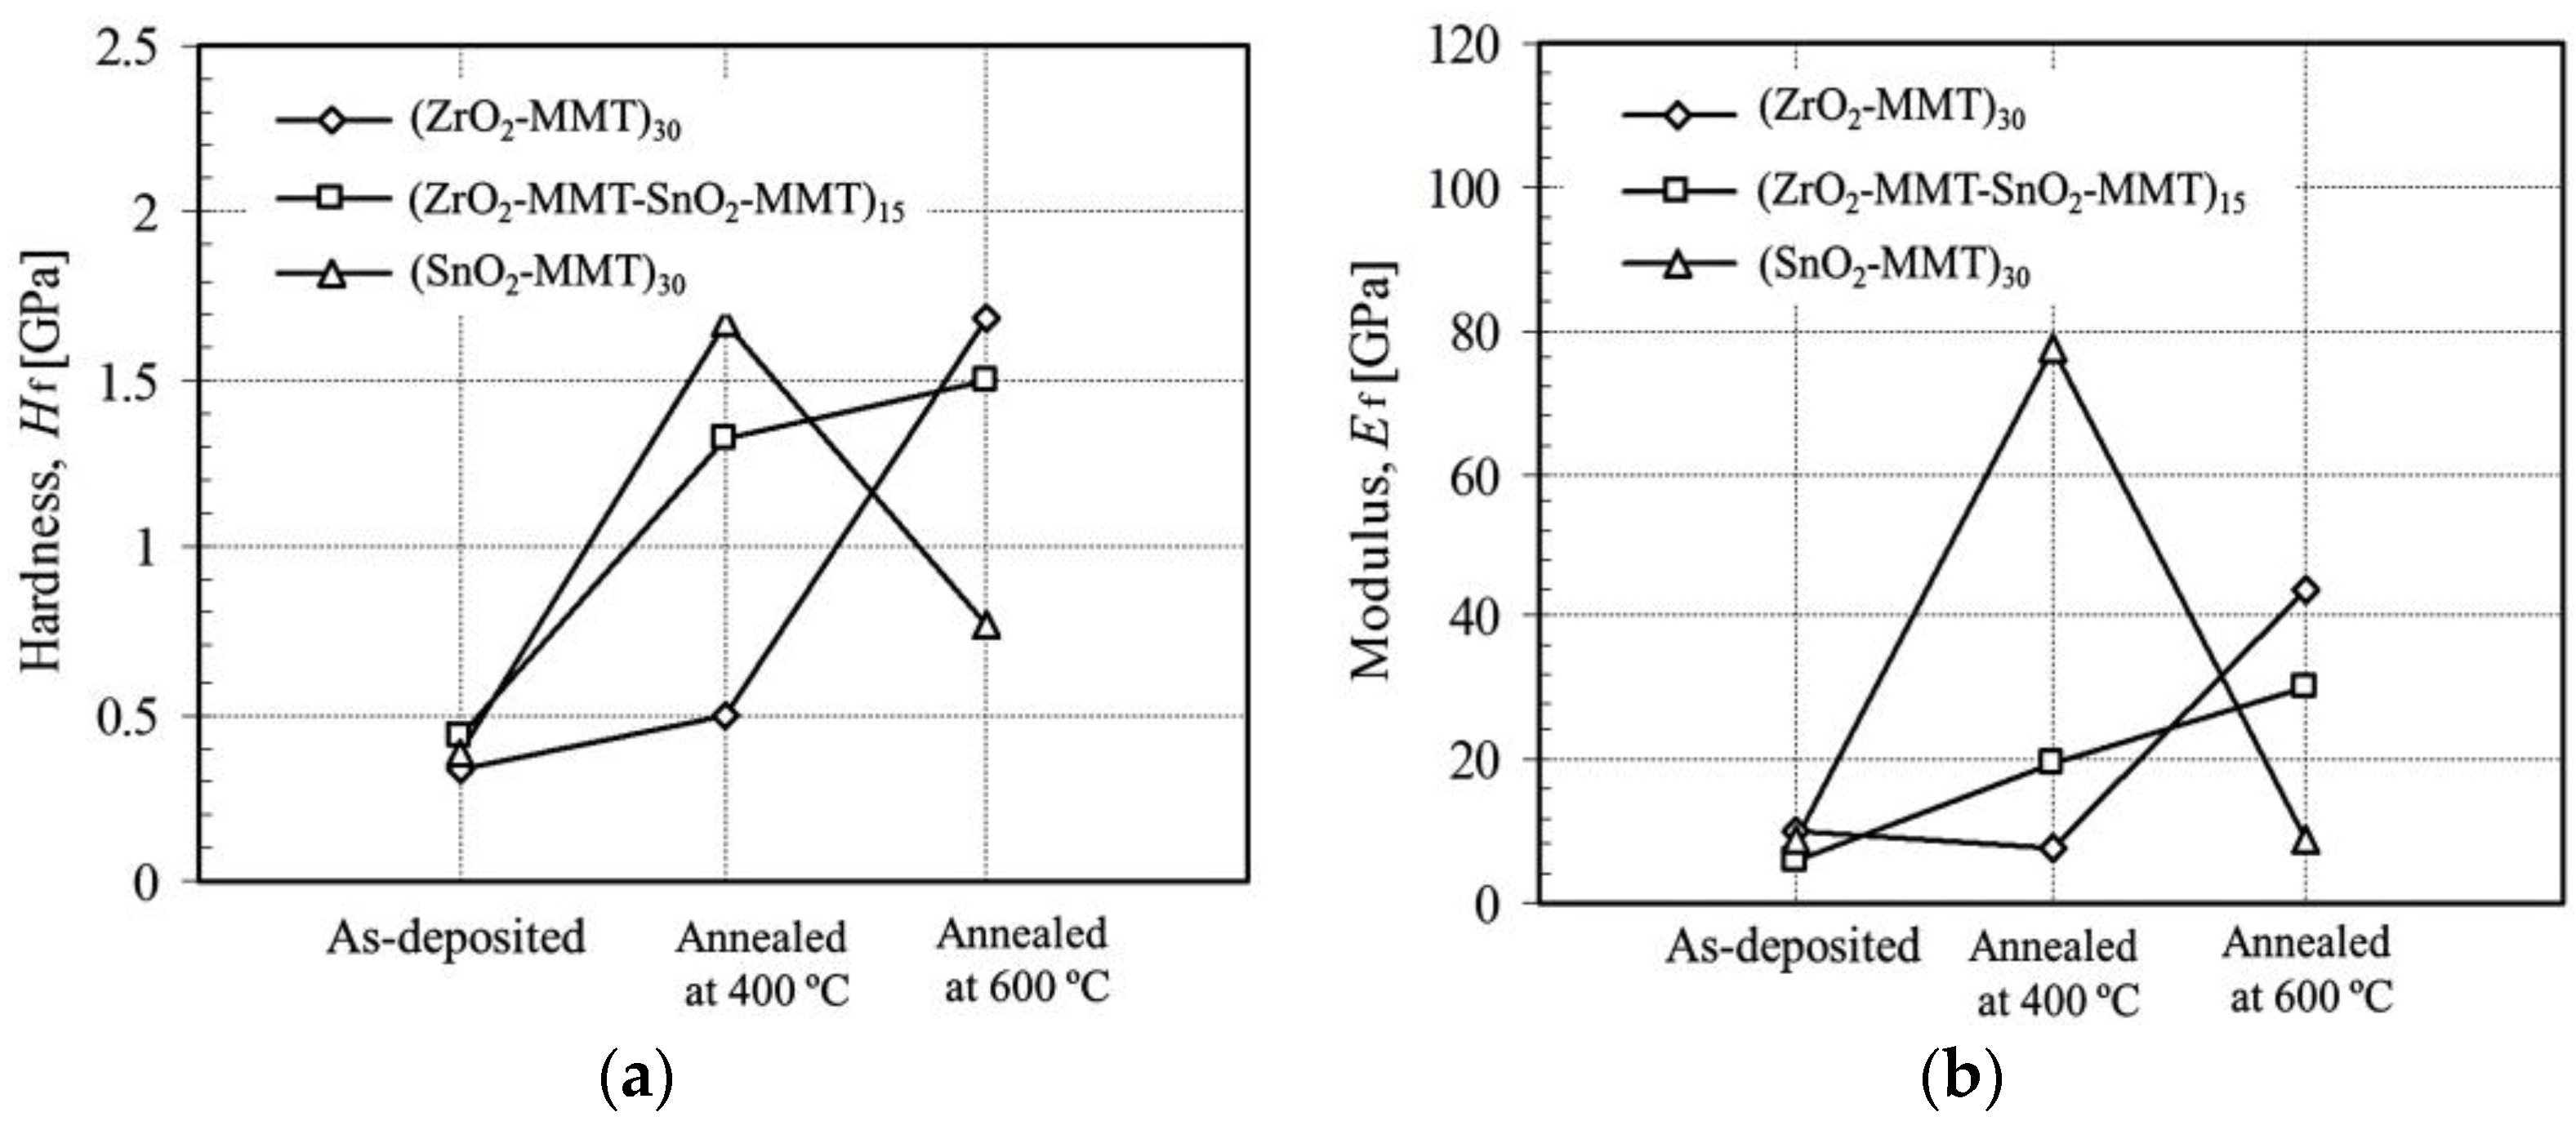
3.3. Effect of Annealing Temperature

Annealing process was applied at 400 °C and 600 °C on the three different multilayers (ZrO2-MMT)30, (ZrO2-MMT-SnO2-MMT)15, and (SnO2-MMT)30. Figure 8 shows the fitted hardness (Figure 8a) and modulus (Figure 8b) of the films formed under as-deposited, annealed at 400 °C, and annealed at 600 °C conditions. In the as-deposited deposition condition, all three multilayers have almost the same hardness (0.33 GPa, 0.43 GPa and 0.43 GPa) and slightly different moduli (9.94 GPa, 6.2 GPa and 8.8 GPa). However, significant difference of hardness and moduli was observed as annealing temperature varies. (ZrO2-MMT)30 film exhibits the highest hardness and modulus at an annealing temperature of 600 °C among these three formed conditions, whereas (SnO2-MMT)30 film reaches its highest hardness and modulus at a temperature of 400 °C, then drops down sharply at 600 °C, much lower than those of (ZrO2-MMT)30 multilayers. The hardness and modulus of (ZrO2-MMT-SnO2-MMT)15 reasonably resides between those of (ZrO2-MMT)30 and (SnO2-MMT)30. This implies that there exists a relationship between an annealing temperature and a corresponding hardness and modulus for a specific clay-oxide multilayer.

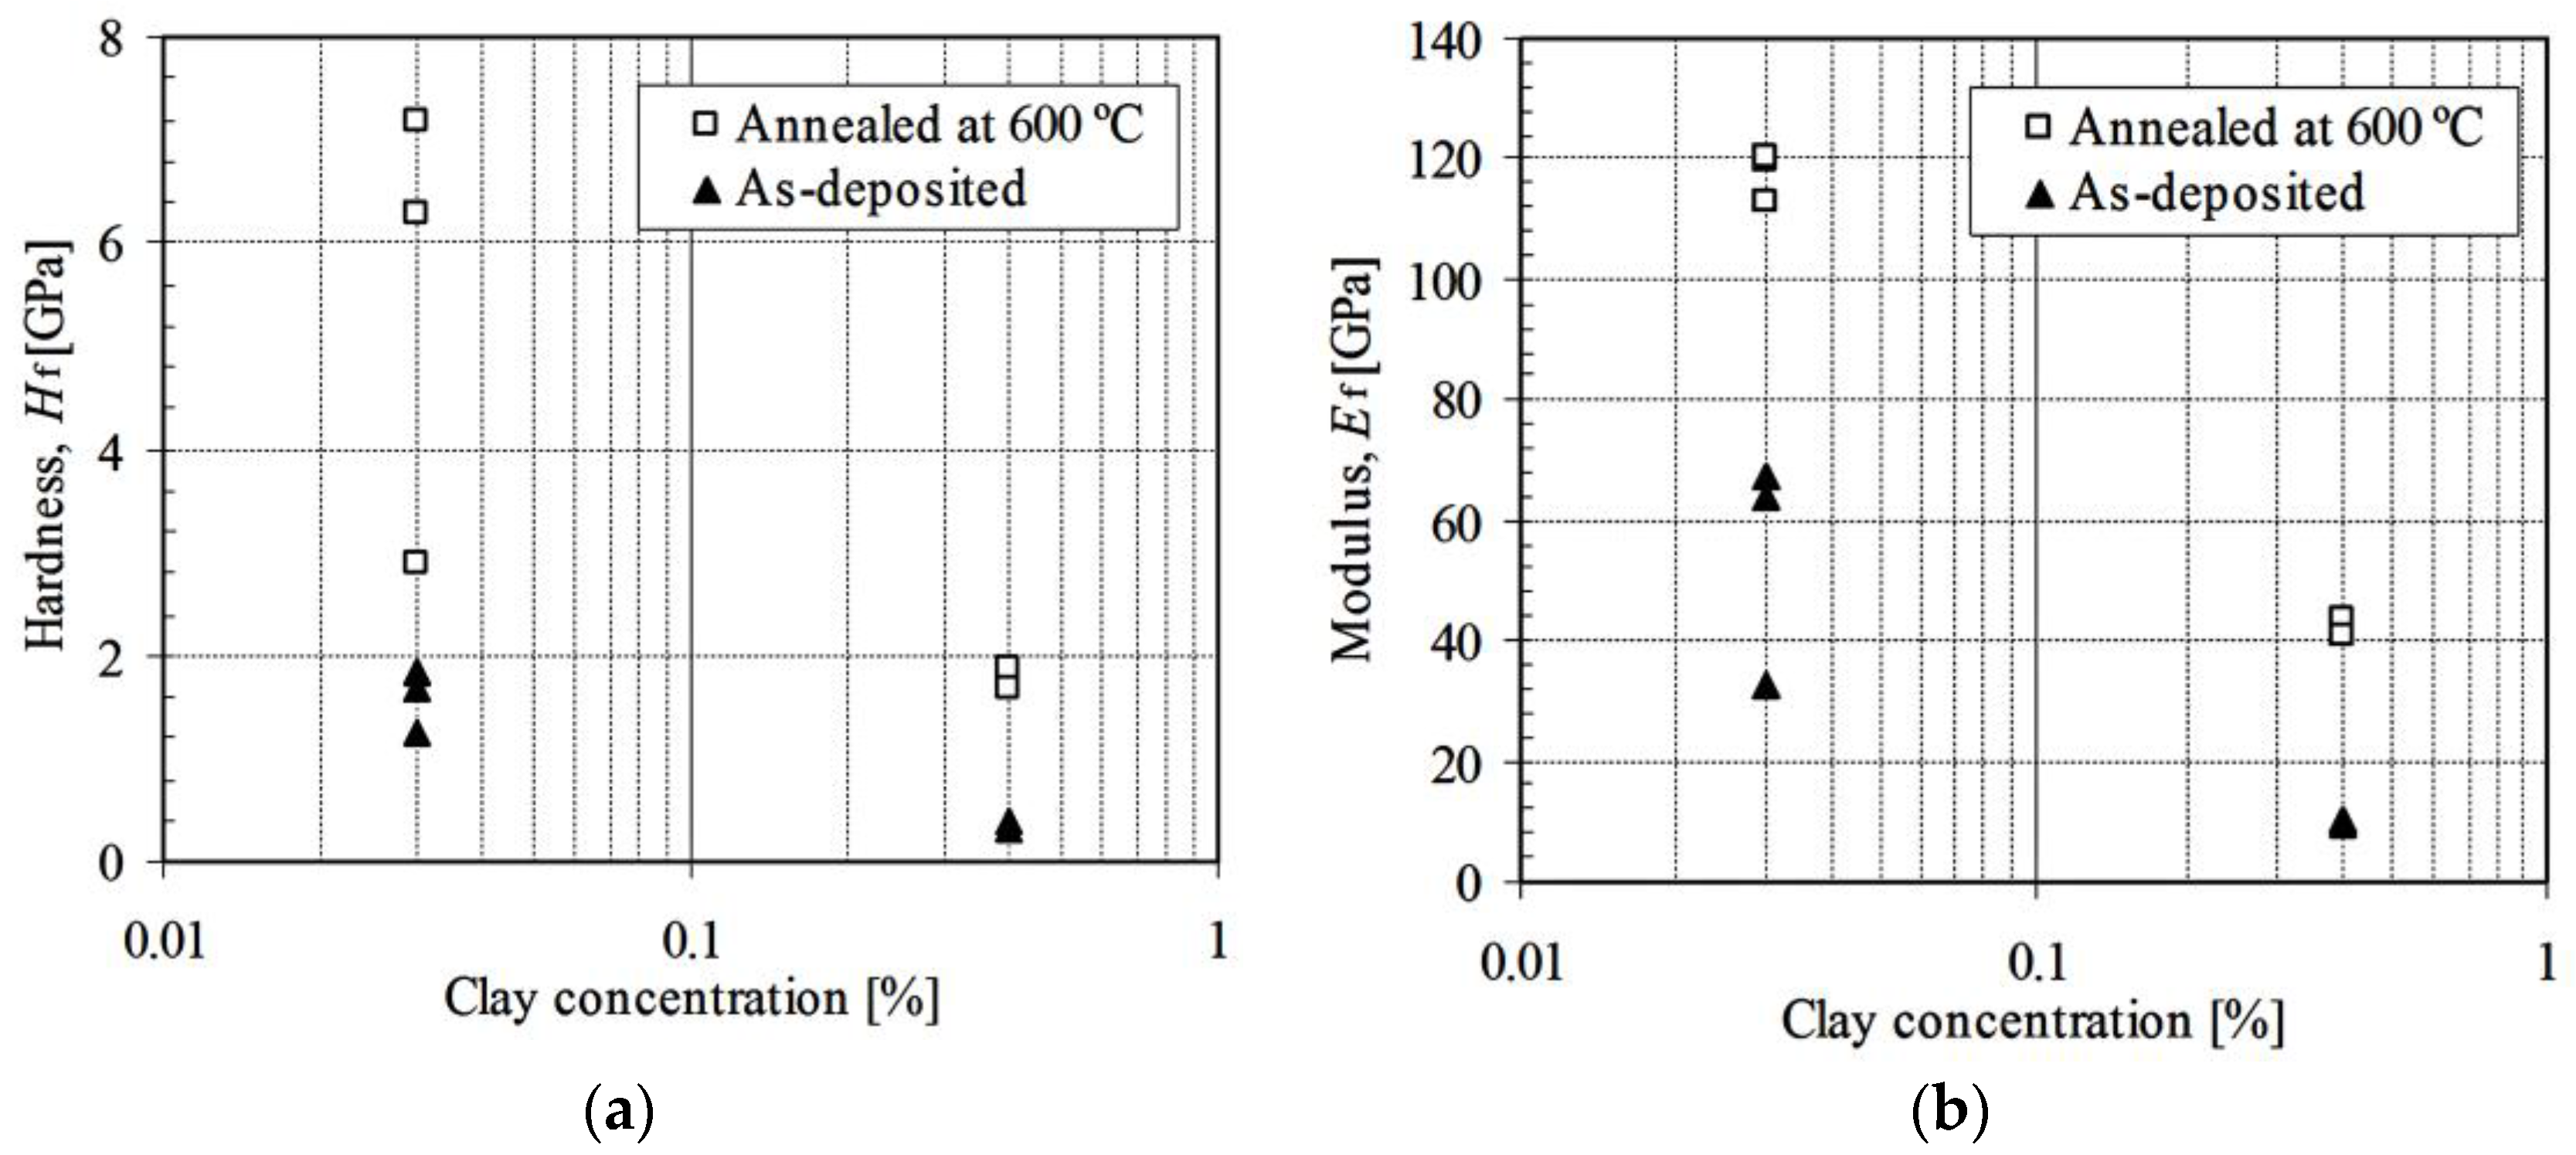
3.4. Effect of Clay Concentration

Figure 9 shows the hardness (Figure 9a) and modulus (Figure 9b) of clay-zirconia multilayers (30 and 60 deposition cycles) formed by the LbL procedure with two different clay suspension concentrations of 0.03 wt % and 0.4 wt %. The films with lower clay concentration exhibit much higher hardness and moduli than those with higher clay concentration for both as-deposited and annealed (at 600 °C) multilayers. This indicates that high clay concentration does not facilitate the increment of hardness and modulus of multilayers. One reason is that the higher clay concentration generates a higher film growth rate of 37 nm/cycle [15], which is much higher than 5.7 nm/cycle corresponding to a clay concentration of 0.03 wt %, subsequently creating higher porosity within the multilayers. In addition, each thicker individual clay layer constructs a strong thermal barrier which inhibits the effectiveness of the annealing process across the whole film thickness.

3.5. Expandability vs. Forming Conditions

XRD patterns of as-deposited and annealed multilayers (ZrO2-MMT)30, (ZrO2-MMT)60, (ZrO2-MMT-SnO2)15, and (SnO2-MMT)30 under air-dried (AD) and ethylene glycol-solvated (EG) preparation were obtained to study their expendability versus forming conditions as shown in Figure 10a–d.
The similar XRD patterns of (ZrO2-MMT)30 and (ZrO2-MMT)60 under as-deposited and annealed at 600 °C conditions shown in Figure 10a,b indicates that preparation of multilayers with consistent structures is achievable. Both as-deposited films have a broad peak region with the basal spacing from ~1.16 nm to ~1.54 nm should result from the montmorillonite with hydrated interlayer cation Zr4+ at different degrees of hydration, which agrees well with the commonly recognized d(001) spacing of around 1.0–2.0 nm. The presence of montmorillonite in these multiple layers demonstrates that some clay particles were undesirably adsorbed during the process of dipping in the clay suspension. In particular, no visible peak related to the periodic thickness formed by each deposition cycle for multilayers is observed, however, which appeared in clay-zirconia multilayers prepared with clay concentration of 0.03 wt % by Chen et al. [15]. Since the clay concentration used to prepare the above samples is 0.4 wt %, it manifests that it is necessary to determine a proper clay concentration in order to fabricate a clay-based multilayer with consistent periodic layered structures. Highly amorphous structures were observed from the XRD patterns of both annealed samples, which is not as expected as that of the clay concentration of 0.03 wt % reported by Chen et al. [15]. This further proves the importance of clay concentration in preparation of clay-based nanostructured multilayers.
Figure 10c shows the XRD patterns of (ZrO2-MMT-SnO2)15 under as-deposited and annealed at 400/600 °C conditions. Air-dried and ethylene glycol-solvated as-deposited samples exhibit two relatively sharp peaks at 1.26 nm and 1.71 nm, respectively, verifying the existence of clay particles adsorbed in clay-based multilayers again. This finding can also be obtained from the XRD patterns of the annealed samples (at 400 °C), which have weak peaks, but with almost the same values as those of as-deposited samples at less than 10° (2θ). It is further inferred that the expandability of montmorillonite with hydrated interlayer cations Zr4+ and Sn4+ is reversible even after being annealed at 400 °C. However, the corresponding peaks disappear in the XRD patterns of the annealed (at 600 °C) samples, probably due to the growth of ZrO2 and SnO2 nanocrystals, which disordered the multilayer structures [15].
The XRD patterns of (SnO2-MMT)30 shown in Figure 10d have almost the same features as those of (ZrO2-MMT-SnO2)15 except that two nearly identical peaks at 0.96 nm (AD) and 0.98 nm (EG) are observed. They may result from the consistent periodic deposition layers rather than montmorillonite particles, because montmorillonite particles should be expanded under ethylene glycol-solvated preparation. If these peaks are assumed due to montmorillonite particles, the only interpretation is that SnO2 nanocrystals formed under annealing temperature 600 °C contribute to the non-expandability of the formed clay-oxide multilayers. Based on this explanation, the multilayers (SnO2-MMT)30 after being annealed at 600 °C, should have better periodic layers than (ZrO2-MMT)30. However, this problem should be investigated more clearly in further studies.

4. Discussion

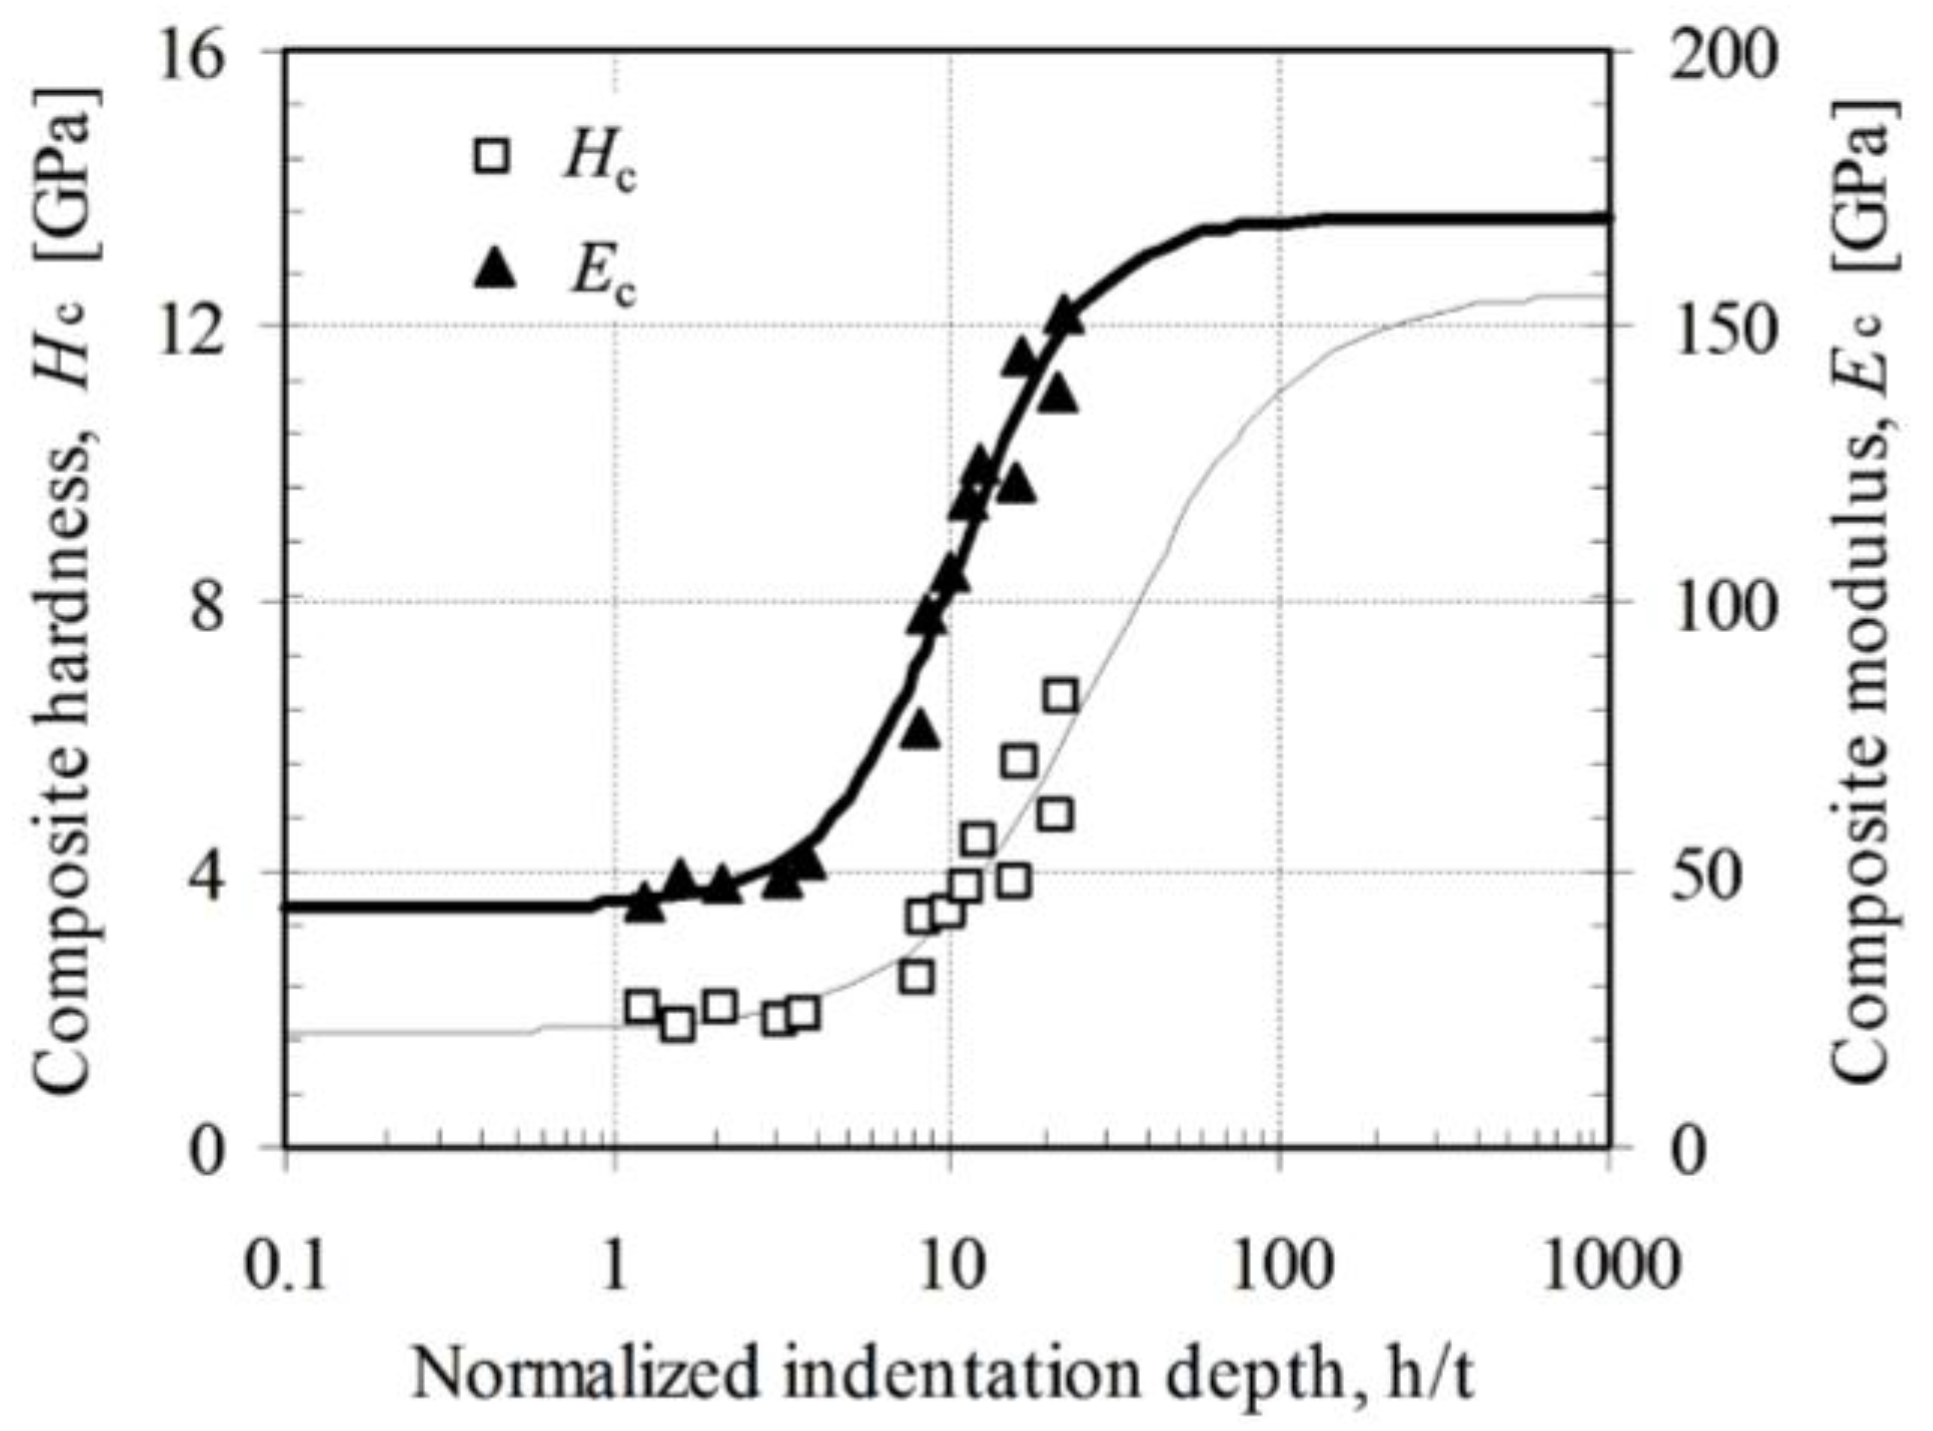
4.1. Analytical Method

The multilayers formed by the LbL procedure have intrinsic anisotropic properties. Since there is no theory applicable to the determination of mechanical properties of such micro- to nano-meter thick films, presently, the analytical method used in this paper is just an approach to approximately estimate the true film hardness and modulus in the direction perpendicular to the indentation surface, in which the main purpose is to use these mechanical parameters as references to check multilayer design variables and compare different film-forming conditions. The hardness defined by the applied load divided by the corresponding projected area is the mean contact pressure and is found to be proportional to the film’s yield or flow stress in compression for isotropic materials [34]. The hardness of multilayers has a similar physical meaning if the same concept is assumed valid. The difficulty is the interpretation of the modulus of the multilayer determined by the nanoindentation test. This is mainly due to the complex stress and strain distributions generated beneath the indenter and the continuously changed boundary conditions as the indenter penetrates into the sample. However, the modulus determined by the above method could be a good comprehensive parameter to characterize the elastic properties, because it is obtained based on the elastic response of the film during unloading. The true modulus normal to the loading surface is believed to be related to the measured modulus with some extent of degree-dependence on the anisotropy of the film. This correlation is unclear and needs to be studied further.
Another concern are the errors due to pile-up mainly observed in soft films on hard substrates (e.g., as-deposited multilayers in this paper). The main reason is that the contact depth hc in Equation (2) is determined based on an elastic contact analysis without consideration of plastic deformation occurring in elastic-plastic materials. The ignorance of pile-up will result in an underestimation of the contact area and, subsequently, an overestimation of hardness and modulus. For example, the hardness and modulus obtained for as-deposited multilayers in this paper, which exhibit pile-up around the contact impressions, should be the upper bound value.

4.2. Multilayer Design

This paper focuses on the mechanical behavior of multilayers formed by the LbL deposition process under different conditions. The factors affecting on the mechanical properties mainly include cationic precursor, anionic precursor, dipping control parameters, and post-deposition treatment measures, which are the primary design parameters to achieve the expected requirements. Among these factors, the anionic precursor, exfoliated clay platelets (montmorillonite) in this paper, is the most difficult control parameter because of the inability to effectively characterize the exfoliation status. The unexfoliated clay aggregates could coexist with exfoliated clay platelets in the suspension, and the exfoliated clay platelets are also possible to reaggregate as the dipping deposition cycle proceeds. Therefore, it is difficult to ensure the identical clay layer for each deposition cycle. Even in the same deposition cycle, the in-plane distribution of clay platelets and particles is not uniform, which results in an uneven surface of the deposited clay layer. The annealing process can significantly reduce the porosity of the multilayers by the shrinkage normal to the deposition surface, but cannot reduce the sizes of clay aggregates. The growth of the oxide crystals during the annealing process could also deform the clay layers by displacement [15]. The surface roughness presents the degree of such accumulative evenness of a certain number of depositing cycles as shown in Figure 11. The surface roughness in both cases is not in the same order of the individual clay platelet thickness (~1 nm), implying that an effective dispersing and exfoliating method of clay particles is needed to prepare the clay suspension to generate an uniform clay layer in thickness and the in-plane distribution for each dipping cycle.

5. Conclusions

Nanoindentation tests were conducted under load control mode on 18 clay-based multilayer samples, which were prepared under as-deposited and annealing conditions at 400 °C/600 °C with different precursor cations and multilayer structure. The modulus and hardness of each sample are extracted from the measured composite response of the sample-substrate system. The load-displacement curves and residual AFM images show that all of the multilayers exhibit a superior tolerance to mechanical strain because of the high lateral bonding strength of clay platelets and strong bonding strength between interlayers. In addition, annealing significantly enhances the resistance of the multilayers to penetration or plastic deformation.
A common tendency was found that the modulus and hardness of all clay-based multilayers prepared with lower clay concentrations have much higher values than those with higher clay concentrations. This is probably due to the higher porosity of the films generated by higher clay concentrations. Consequently the higher periodicity of the multilayers also reduces the annealing effects for property enhancement. Analysis of the results with two annealing temperatures indicates that a relationship between the annealing temperature and a corresponding hardness and modulus for a specific type of clay-oxide multilayers exist, and the optimal annealing temperature can be determined case by case with respect to each type of the clay-oxide multilayers.
Clay-oxide multilayers prepared by the LbL method have promising applications with the improvement in accurate control of clay exfoliation, clay concentration, and optimization of annealing temperatures. The elastic modulus determined by nanoindentation is a suitable parameter for characterizing multilayers even though there still exist some unsolved theoretical issues with respect to nanoindentation testing on anisotropic layered materials.

Acknowledgments

The financial supports from the National Natural Science Foundation of China (Grant No. 51308334 and 51479113) are greatly acknowledged. All the clay-based multilayer samples used in nanoindentation testing were prepared by Jian Luo’s group at the University of California San Diego, who was a collaborator of this research.

Author Contributions

Guoping Zhang conceived and designed the experiments; Zhongxin Wei and Rohit Raj Pant performed the experiments; All authors contributed to data analysis and interpretation as well as manuscript preparation, including writing, revision, and/or proofreading.

Conflicts of Interest

The authors declare no conflict of interest. The founding sponsors had no role in the design of the study; in the collection, analyses, or interpretation of data; in the writing of the manuscript, and in the decision to publish the results.

References

  1. Lan, T.; Kaviratna, P.D.; Pinnavaia, T.J. Mechanism of clay tactoid exfoliation in epoxy-clay nanocomposites. Chem. Mater. 1995, 7, 2144–2150. [Google Scholar] [CrossRef]
  2. Theng, B.K.G.; Walker, G.F. Interactions of clay minerals with organic monomers. Isr. J. Chem. 1970, 8, 417–424. [Google Scholar] [CrossRef]
  3. Theng, B.K.G. Interactions of clay minerals with organic polymers. Some practical applications. Clays Clay Miner. 1970, 18, 357–362. [Google Scholar] [CrossRef]
  4. Uskov, I.A.; Galinskaya, V.I.; Artyukh, L.V. Calorimetric method of determining the interaction energy of polymers with fillers. Polym. Sci. USSR 1966, 8, 2048. [Google Scholar] [CrossRef]
  5. Joly, S.; Garnaud, G.; Ollitrault, R.; Bokobza, L.; Mark, J.E. Organically modified layered silicates as reinforcing fillers for natural rubber. Chem. Mater. 2002, 14, 4202–4208. [Google Scholar] [CrossRef]
  6. Kolliopoulou, S.; Dimitrakis, P.; Normand, P.; Zhang, H.-L.; Cant, N.; Evans, S.D.; Paul, S.; Pearson, C.; Molloy, A.; Petty, M.C.; et al. Hybrid silicon-organic nanoparticle memory device. J. Appl. Phys. 2003, 94, 5234. [Google Scholar] [CrossRef]
  7. Ulman, A. An Introduction to Ultrathin Organic Films: From Langmuir—Blodgett to Self—Assembly; Academic Press: San Deogo, CA, USA, 2013. [Google Scholar]
  8. Decher, G.; Hong, J.-D. Buildup of ultrathin multilayer films by a self-assembly process, 1 consecutive adsorption of anionic and cationic bipolar amphiphiles on charged surfaces. Makromol. Chem. Macromol. Symp. 1991, 46, 321–327. [Google Scholar] [CrossRef]
  9. Kleinfeld, E.R.; Ferguson, G.S. Stepwise formation of multilayered nanostructural films from macromolecular precursors. Sci. China Technol. Sci. 1994, 265, 370–373. [Google Scholar] [CrossRef] [PubMed]
  10. Decher, G. Fuzzy nanoassemblies: Toward layered polymeric multicomposites. Science 1997, 277, 1232–1237. [Google Scholar] [CrossRef]
  11. Podsiadlo, P.; Kaushik, A.K.; Arruda, E.M.; Waas, A.M.; Shim, B.S.; Xu, J.; Nandivada, H.; Pumplin, B.G.; Lahann, J.; Ramamoorthy, A.; et al. Ultrastrong and stiff layered polymer nanocomposites. Science 2007, 318, 80–83. [Google Scholar] [CrossRef] [PubMed]
  12. Whitesides, G.M.; Grzybowski, B. Self-assembly at all scales. Science 2002, 295, 2418–2421. [Google Scholar] [CrossRef] [PubMed]
  13. Whitesides, G.M.; Kriebel, J.K.; Mayers, B.T. Self-assembly and nanostructured materials. In Nanostructure Science and Technology; Springer: New York, NY, USA, 2005; pp. 217–239. [Google Scholar]
  14. Bowden, N. Self-assembly of mesoscale objects into ordered two-dimensional arrays. Science 1997, 276, 233–235. [Google Scholar] [CrossRef] [PubMed]
  15. Chen, H.; Zhang, G.; Richardson, K.; Luo, J. Synthesis of nanostructured nanoclay-zirconia multilayers: A feasibility study. J. Nanomater. 2008, 2008, 1–8. [Google Scholar] [CrossRef]
  16. Chen, H.; Zhang, G.; Wei, Z.; Cooke, K.M.; Luo, J. Layer-by-layer assembly of sol-gel oxide “glued” montmorillonite-zirconia multilayers. J. Mater. Chem. 2010, 20, 4925. [Google Scholar] [CrossRef]
  17. Arcot, P.K.; Luo, J. Solution-based synthesis of oxide thin films via a layer-by-layer deposition method: Feasibility and a phenomenological film growth model. Surf. Coat. Technol. 2008, 202, 2690–2697. [Google Scholar] [CrossRef]
  18. Fendler, J.H. Self-assembled nanostructured materials. Chem. Mater. 1996, 8, 1616–1624. [Google Scholar] [CrossRef]
  19. Ferguson, G.S.; Kleinfeld, E.R. Mosaic tiling in molecular dimensions. Adv. Mater. 1995, 7, 414–416. [Google Scholar] [CrossRef]
  20. Kotov, N.A.; Dekany, I.; Fendler, J.H. Layer-by-layer self-assembly of polyelectrolyte-semiconductor nanoparticle composite films. J. Phys. Chem. 1995, 99, 13065–13069. [Google Scholar] [CrossRef]
  21. Kotov, N.A.; Haraszti, T.; Turi, L.; Zavala, G.; Geer, R.E.; Dekany, I.; Fendler, J.H. Mechanism of and defect formation in the self-assembly of polymeric polycation-montmorillonite ultrathin films. J. Am. Chem. Soc. 1997, 119, 6821–6832. [Google Scholar] [CrossRef]
  22. Oliver, W.C.; Pharr, G.M. An improved technique for determining hardness and elastic-modulus using load and displacement sensing indentation experiments. J. Mater. Res. 1992, 7, 1564–1583. [Google Scholar] [CrossRef]
  23. Pharr, G.M.; Oliver, W.C.; Brotzen, F.R. On the generality of the relationship among contact stiffness, contact area, and elastic modulus during indentation. J. Mater. Res. 1992, 7, 613–617. [Google Scholar] [CrossRef]
  24. ISO 14577. Metallic Materials-Instrumented Indentation Test for Hardness and Materials Parameters, 2002.
  25. Oliver, W.C.; Pharr, G.M. Measurement of hardness and elastic modulus by instrumented indentation: Advances in understanding and refinements to methodology. J. Mater. Res. 2004, 19, 3–20. [Google Scholar] [CrossRef]
  26. Li, X.; Bhushan, B. A review of nanoindentation continuous stiffness measurement technique and its applications. Mater. Charact. 2002, 48, 11–36. [Google Scholar] [CrossRef]
  27. Johnson, K.L. Contact Mechanics; Cambridge University Press: Cambridge, UK, 1985; p. 452. [Google Scholar]
  28. Doerner, M.F.; Nix, W.D. A method for interpreting the data from depth-sensing indentation instruments. J. Mater. Res. 1986, 1, 601–609. [Google Scholar] [CrossRef]
  29. King, R.B. Elastic analysis of some punch problems for a layered medium. Int. J. Solids Struct. 1987, 23, 1657–1664. [Google Scholar] [CrossRef]
  30. Saha, R.; Nix, W.D. Effects of the substrate on the determination of thin film mechanical properties by nanoindentation. Acta Mater. 2002, 50, 23–38. [Google Scholar] [CrossRef]
  31. Gao, H.; Chiu, C.-H.; Lee, J. Elastic contact versus indentation modeling of multi-layered materials. Int. J. Solids Struct. 1992, 29, 2471–2492. [Google Scholar]
  32. Menčík, J.; Munz, D.; Quandt, E.; Weppelmann, E.R.; Swain, M.V. Determination of elastic modulus of thin layers using nanoindentation. J. Mater. Res. 1997, 12, 2475–2484. [Google Scholar] [CrossRef]
  33. Fisher-Cripps, A. Nanoindentation; Springer: New York, NY, USA, 2002. [Google Scholar]
  34. Fischer-Cripps, A.C.; Nicholson, D.W. Nanoindentation. Mechanical engineering series. Appl. Mech. Rev. 2004, 57, 12. [Google Scholar] [CrossRef]
  35. Hu, X.Z.; Lawn, B.R. A simple indentation stress–strain relation for contacts with spheres on bilayer structures. Thin Solid Films 1998, 322, 225–232. [Google Scholar] [CrossRef]
  36. Jung, Y.-G.; Lawn, B.R.; Martyniuk, M.; Huang, H.; Hu, X.Z. Evaluation of elastic modulus and hardness of thin films by nanoindentation. J. Mater. Res. 2004, 19, 3076–3080. [Google Scholar] [CrossRef]
  37. Korsunsky, A.M.; McGurk, M.R.; Bull, S.J.; Page, T.F. On the hardness of coated systems. Surf. Coat. Technol. 1998, 99, 171–183. [Google Scholar] [CrossRef]
  38. Tuck, J.R.; Korsunsky, A.M.; Bhat, D.G.; Bull, S.J. Indentation hardness evaluation of cathodic arc deposited thin hard coatings. Surf. Coat. Technol. 2001, 139, 63–74. [Google Scholar] [CrossRef]
  39. Wei, Z.; Zhang, G.; Chen, H.; Luo, J.; Liu, R.; Guo, S. A simple method for evaluating elastic modulus of thin films by nanoindentation. J. Mater. Res. 2009, 24, 801–815. [Google Scholar] [CrossRef]
  40. Zhang, G.; Wei, Z.; Ferrell, R. Elastic modulus and hardness of muscovite and rectorite determined by nanoindentation. Appl. Clay Sci. 2009, 43, 271–281. [Google Scholar] [CrossRef]
  41. Zhang, G.; Wei, Z.; Ferrell, R.E.; Guggenheim, S.; Cygan, R.T.; Luo, J. Evaluation of the elasticity normal to the basal plane of non-expandable 2:1 phyllosilicate minerals by nanoindentation. Am. Mineral. 2010, 95, 863–869. [Google Scholar] [CrossRef]
Figure 1. Schematic illustration of the clay-based nanostructured multilayer process (two-phase film). Step 1: adsorption of cations; step 2 and step 4: rinsing with water; step 3: adsorption of clay platelets.
Nanomaterials 06 00204 g001
Figure 2. Schematic illustration of nanoindentation loading and unloading processes.
Nanomaterials 06 00204 g002
Figure 3. AFM images of typical indent impressions of (a) as-deposited; (b) annealed at 400 °C; and (c) annealed at 600 °C for 2 h (SnO2-MMT)30 multilayers with MMT 0.4 wt % and corresponding load-displacement curves. (AFM: atomic force microscopy; MMT: montmorillonite)
Nanomaterials 06 00204 g003
Figure 4. AFM images of typical indent impressions of (a) as-deposited; (b) annealed at 400 °C; and (c) annealed at 600 °C for 2 h (ZrO2-MMT-SnO2-MMT)15 multilayers with MMT 0.4 wt % and corresponding load-displacement curves.
Nanomaterials 06 00204 g004
Figure 5. AFM images of typical indent impression of as-deposited (ZrO2-MMT)30 multilayers with MMT 0.03 wt % (a) and corresponding cross-section profiles (b).
Nanomaterials 06 00204 g005
Figure 6. Example of film modulus and hardness fitting on experimental data of (ZrO2-MMT)30 annealed at 600 °C with clay montmorillonite 0.4 wt %. Fitted Ef = 43.75 ± 4.86 GPa, Es = 169.60 ± 7.83 GPa, Hf = 1.68 ± 0.36 GPa, and Hs = 12.50 ± 0.56 GPa.
Nanomaterials 06 00204 g006
Figure 7. Hardness and modulus of zirconia-clay multilayers under as-deposited and annealed at 400 °C/600 °C conditions with clay montmorillonite 0.03 wt % (a) and 0.4 wt % (b).
Nanomaterials 06 00204 g007
Figure 8. Hardness (a) and modulus (b) of zirconia-clay multilayers under as-deposited and annealed at 400/600 °C conditions with clay montmorillonite 0.4 wt %.
Nanomaterials 06 00204 g008
Figure 9. Effect of clay suspension concentration on hardness (a) and modulus (b) of zirconia-clay multilayers under as-deposited and annealed at 600 °C conditions.
Nanomaterials 06 00204 g009
Figure 10. X-ray Diffraction (XRD) patterns of clay-oxide multilayers with clay concentration of 0.40 wt %. (a) (ZrO2-MMT)30 with Na-HMP (5 g/L) to exfoliate the clay particles; (b) (ZrO2-MMT)60 with Na-HMP (5 g/L) to exfoliate the clay particles; (c) (ZrO2-MMT-SnO2)15; and (d) (SnO2-MMT)30.
Nanomaterials 06 00204 g010
Figure 11. Surface roughness of (a) as-deposited and (b) annealed (at 600 °C) (ZrO2-MMT)30 with clay montmorillonite 0.4 wt %.
Nanomaterials 06 00204 g011
Table 1. Summary of prepared clay-based multilayers, treatment method and mechanical properties.
FilmClay wt %Formed ConditionFilm Hardness Hf (GPa)Film Modulus Ef (GPa)
(ZrO2-MMT)300.03As-deposited1.8267.06
0.03Annealed at 600 °C6.29119.90
(ZrO2-MMT)600.03As-deposited1.6763.78
0.03Annealed at 600 °C2.89120.10
(ZrO2-MMT)60 *0.03As-deposited1.2632.35
0.03Annealed at 600 °C7.19113.10
(ZrO2-MMT)300.40As-deposited0.339.94
0.40Annealed at 400 °C0.497.74
0.40Annealed at 600 °C1.6843.75
(ZrO2-MMT)600.40As-deposited0.399.36
0.40Annealed at 600 °C1.8640.69
(SnO2-MMT)300.40As-deposited0.388.80
0.40Annealed at 400 °C1.6777.20
0.40Annealed at 600 °C0.779.09
(ZrO2-MMT-SnO2-MMT)150.40As-deposited0.436.20
0.40Annealed at 400 °C1.3219.4
0.40Annealed at 600 °C1.5030.72
(ZrO2)300.03Annealed at 600 °C10.30118.60
Note: MMT denotes montmorillonite; * denotes the multilayers prepared in clay suspension settled 24 h before being used.

