
Retrochalcone Echinatin Triggers Apoptosis of Esophageal Squamous Cell Carcinoma via ROS- and ER Stress-Mediated Signaling Pathways

 , , and
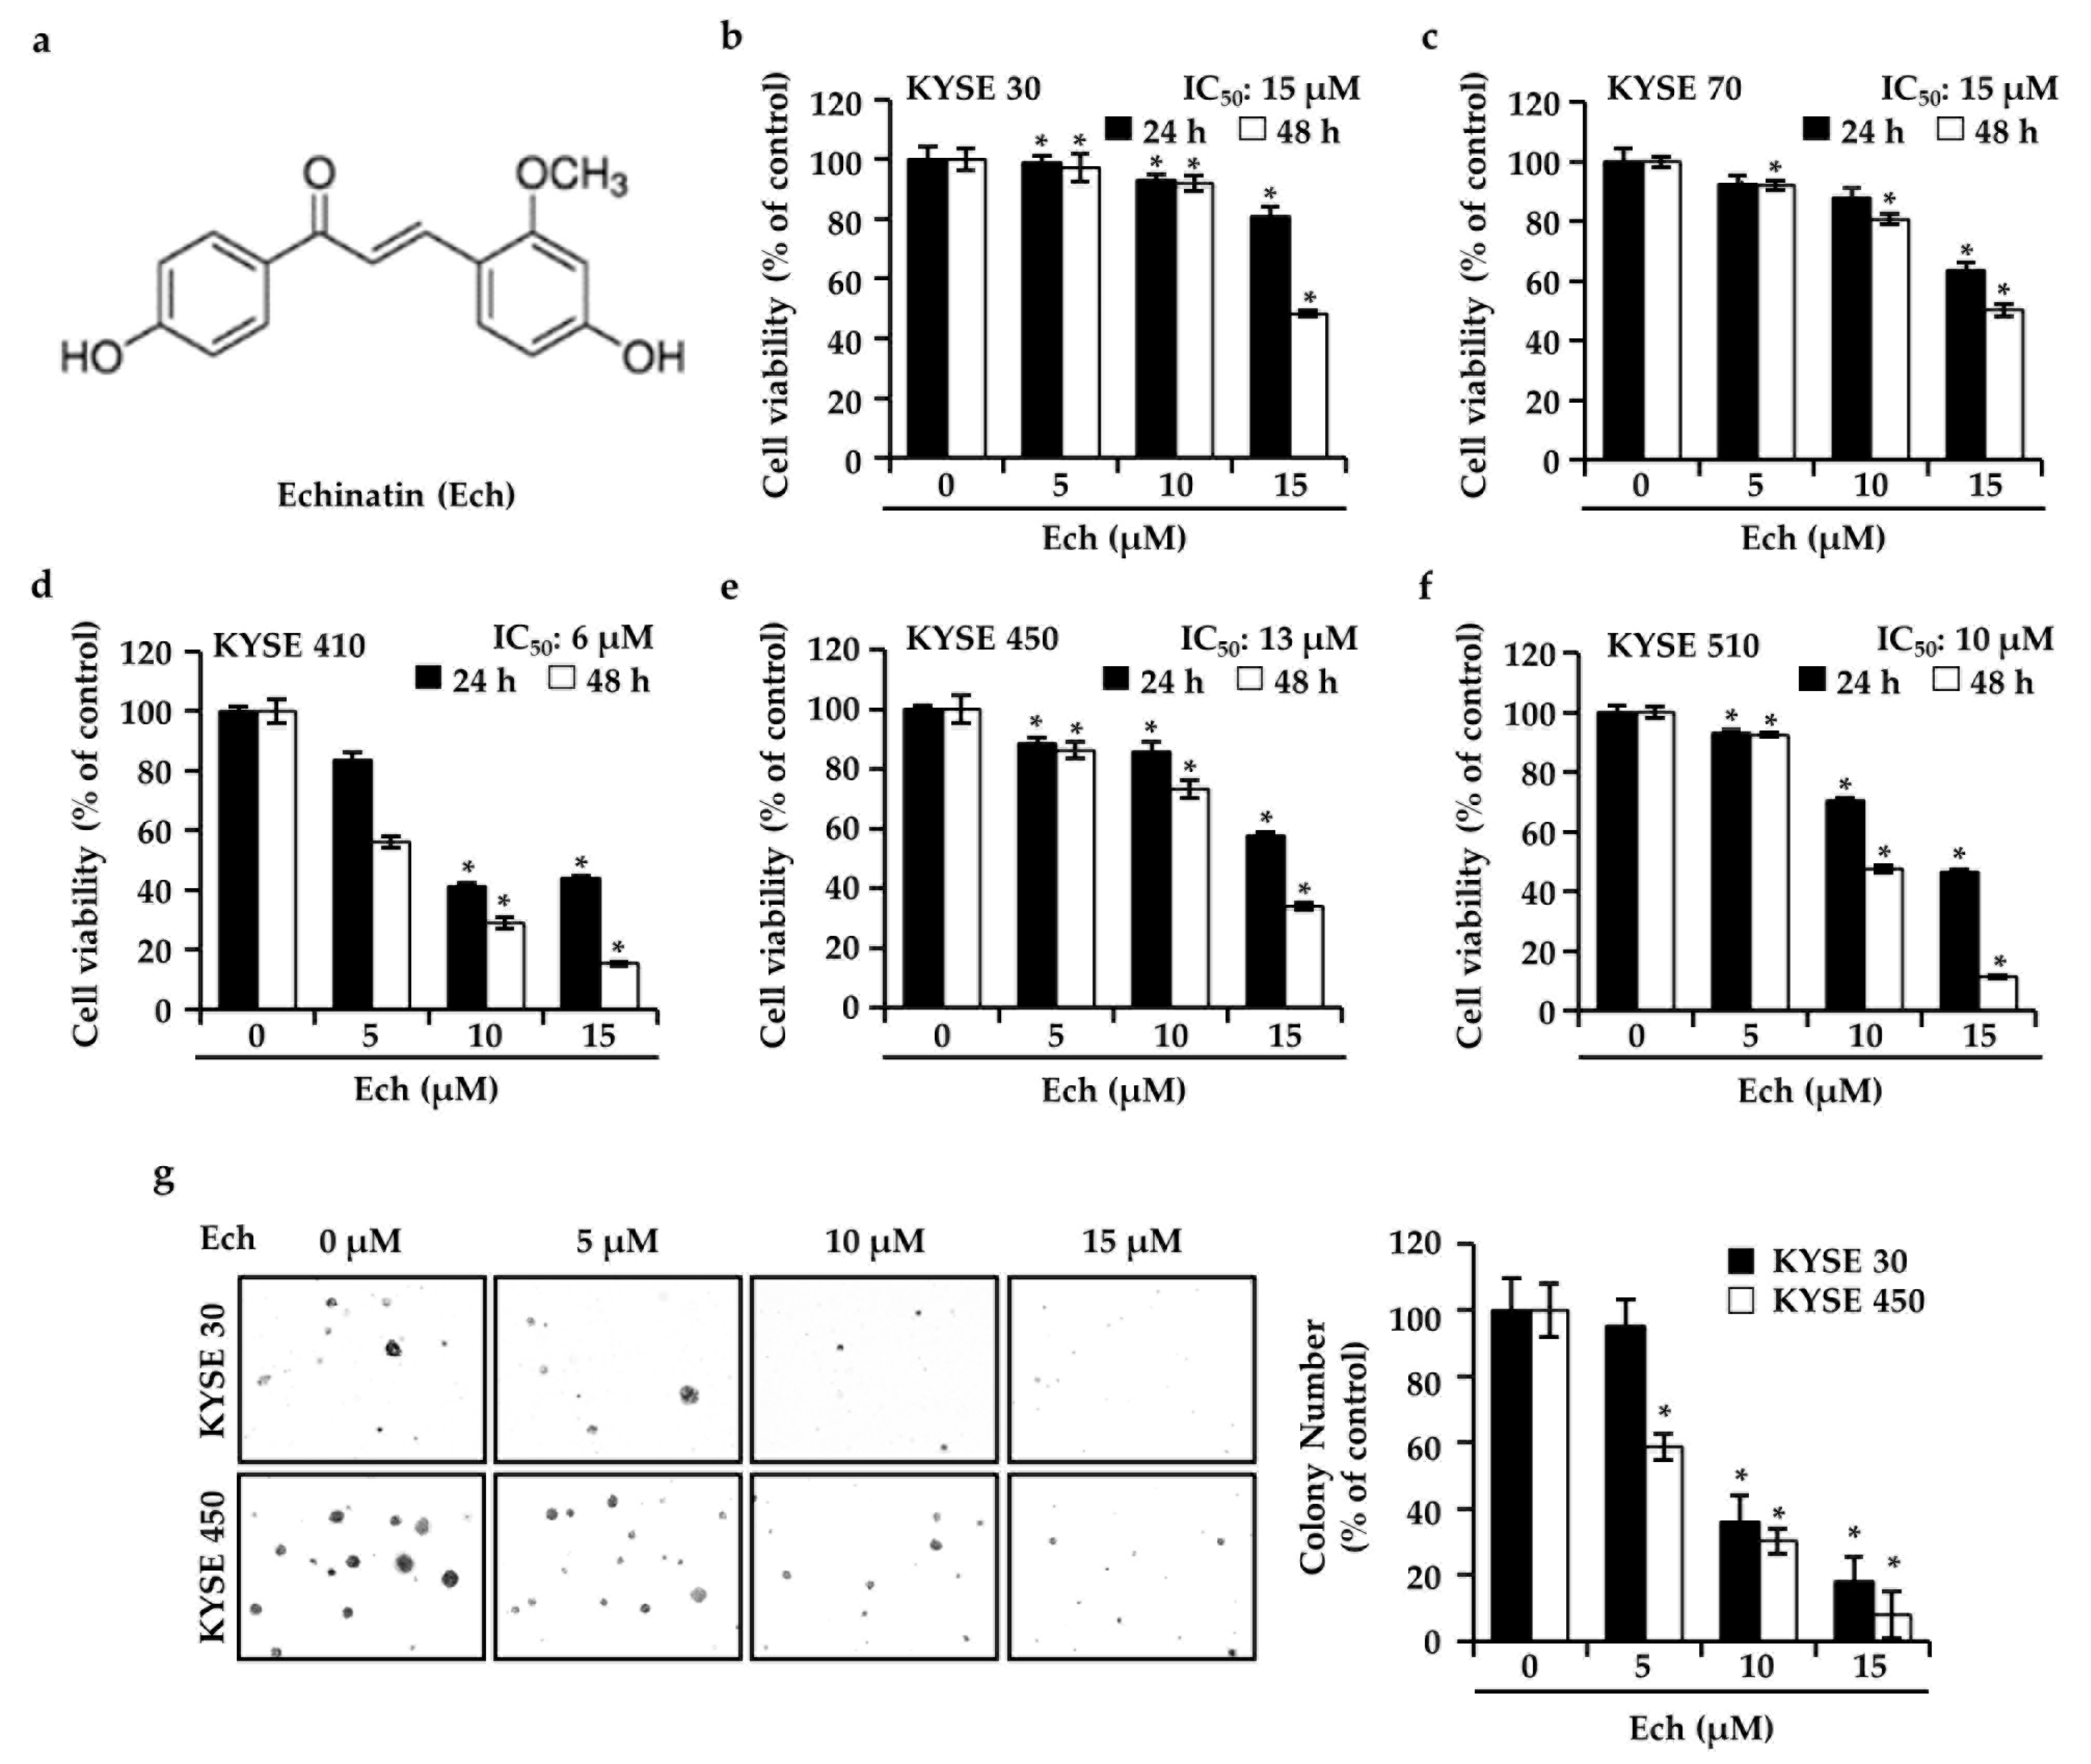
Abstract
:1. Introduction
2. Results
2.1. Ech Inhibits ESCC Cell Growth
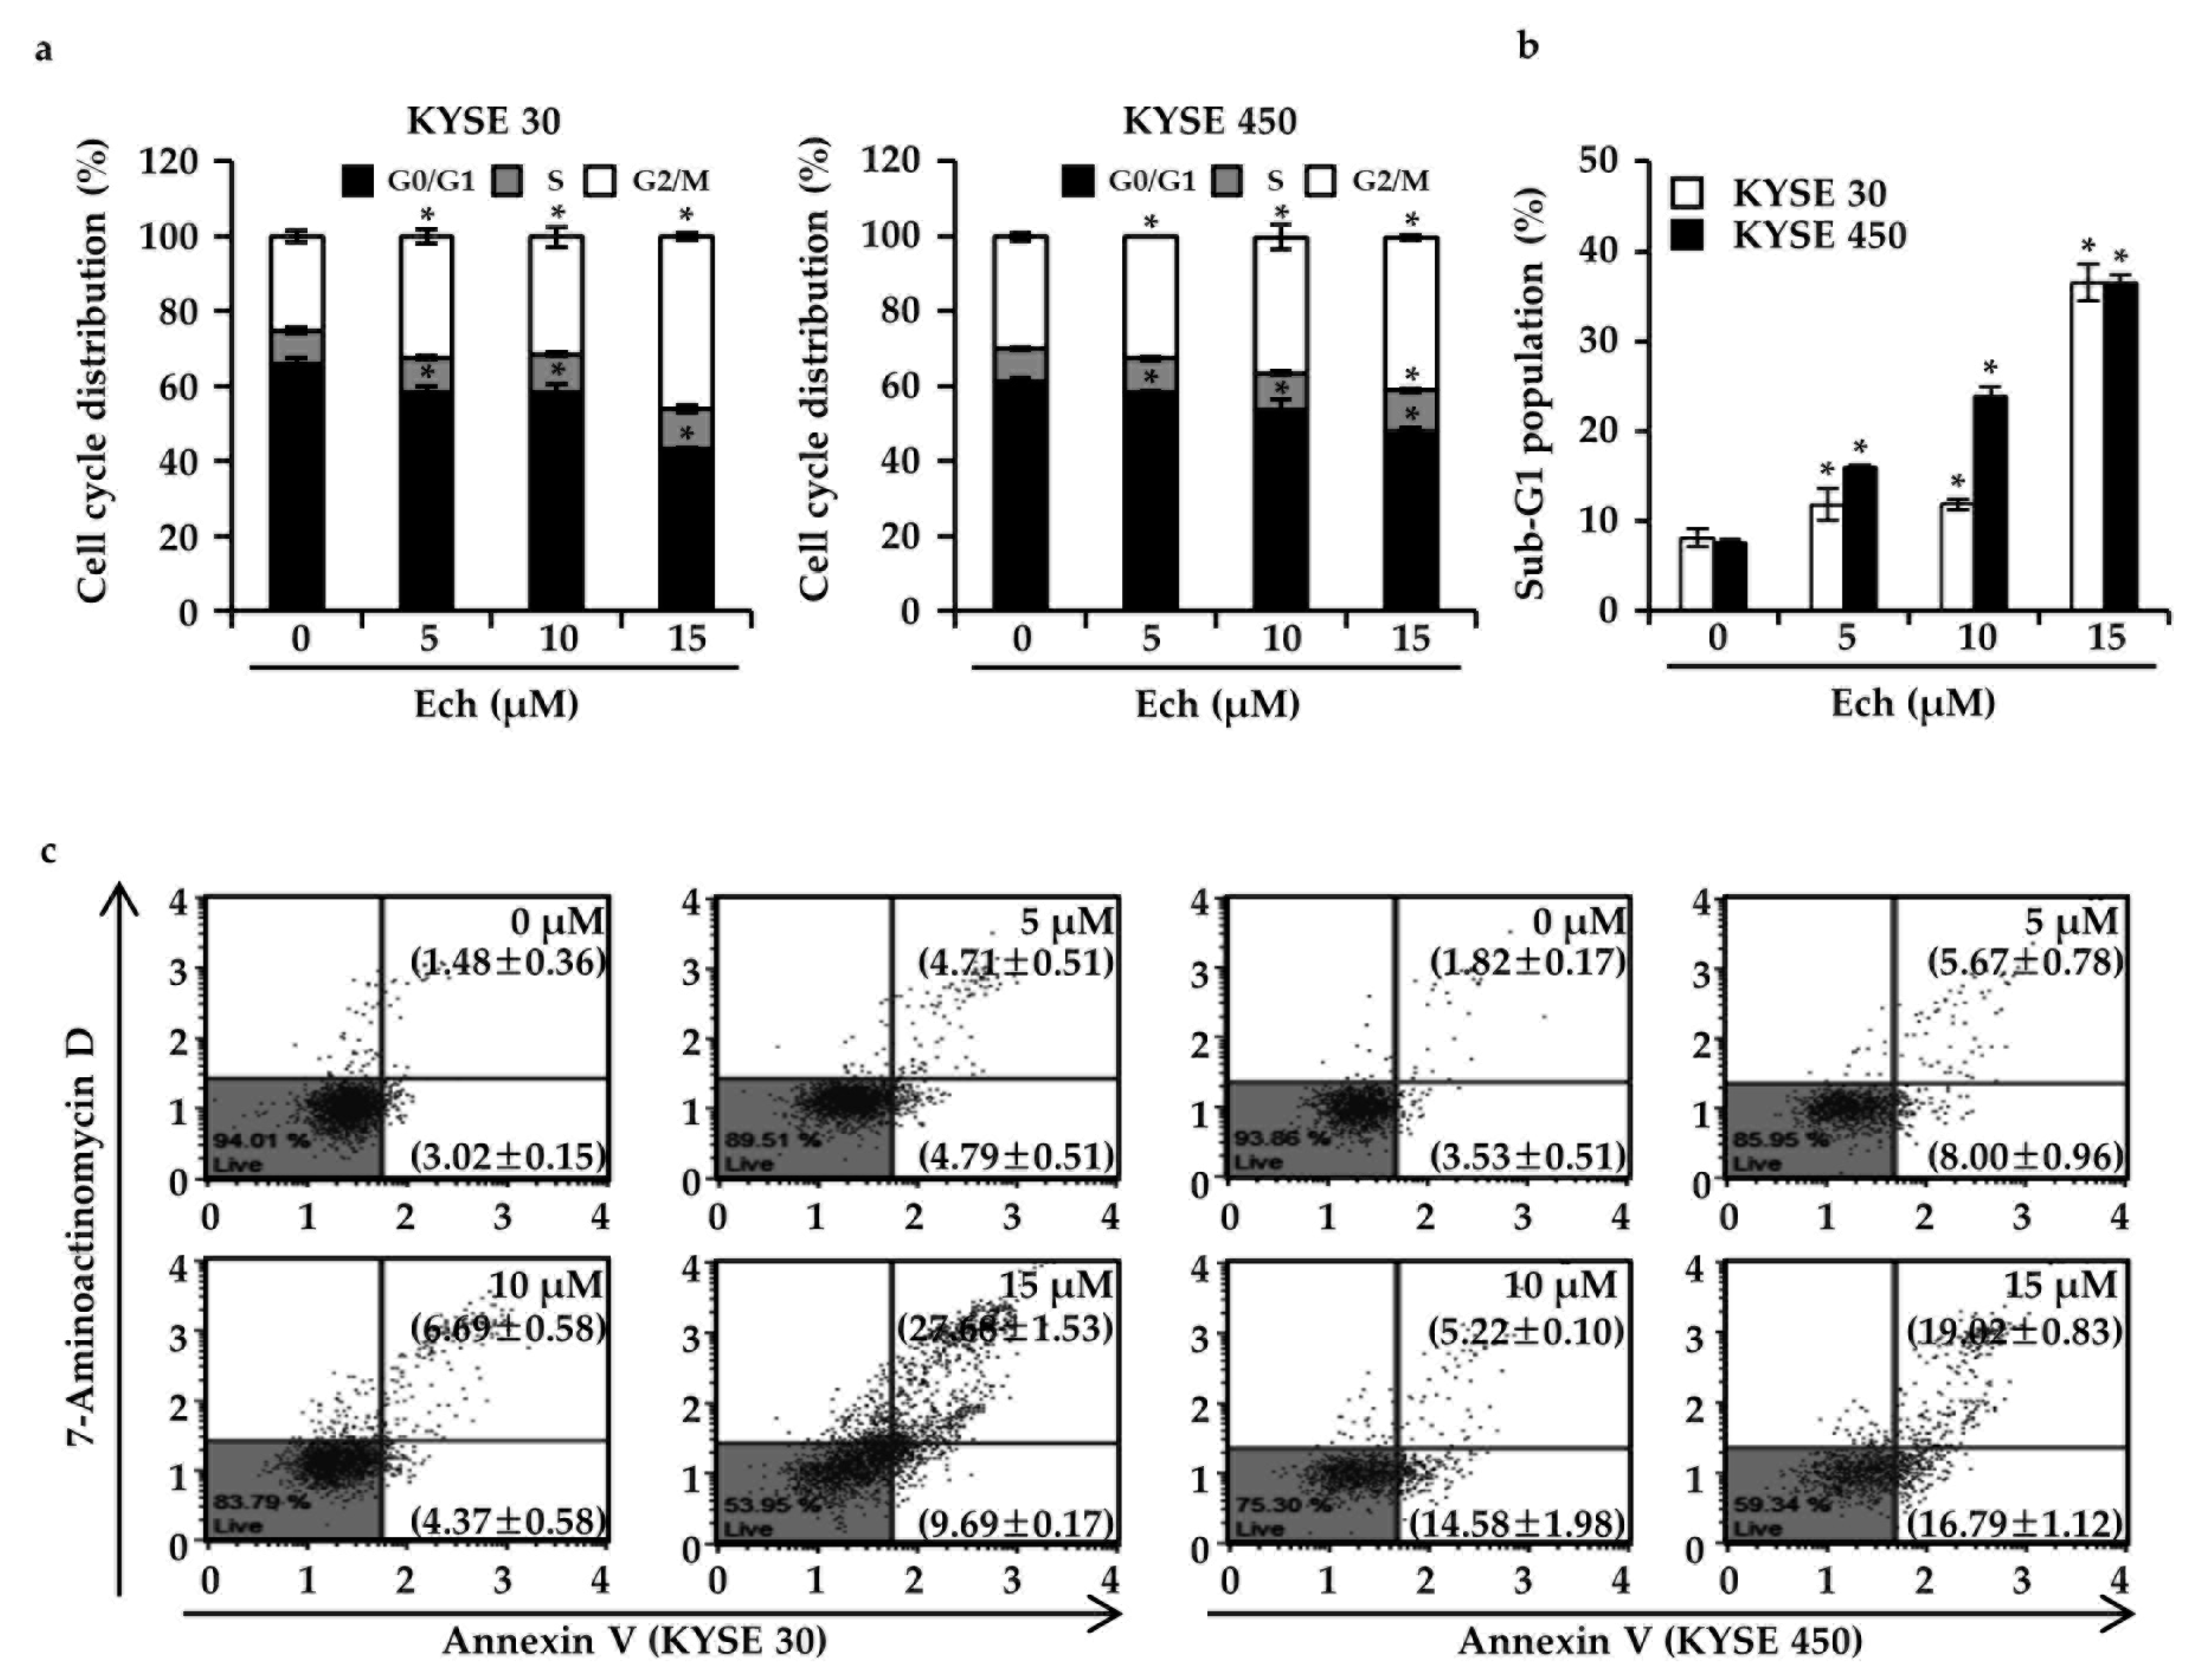
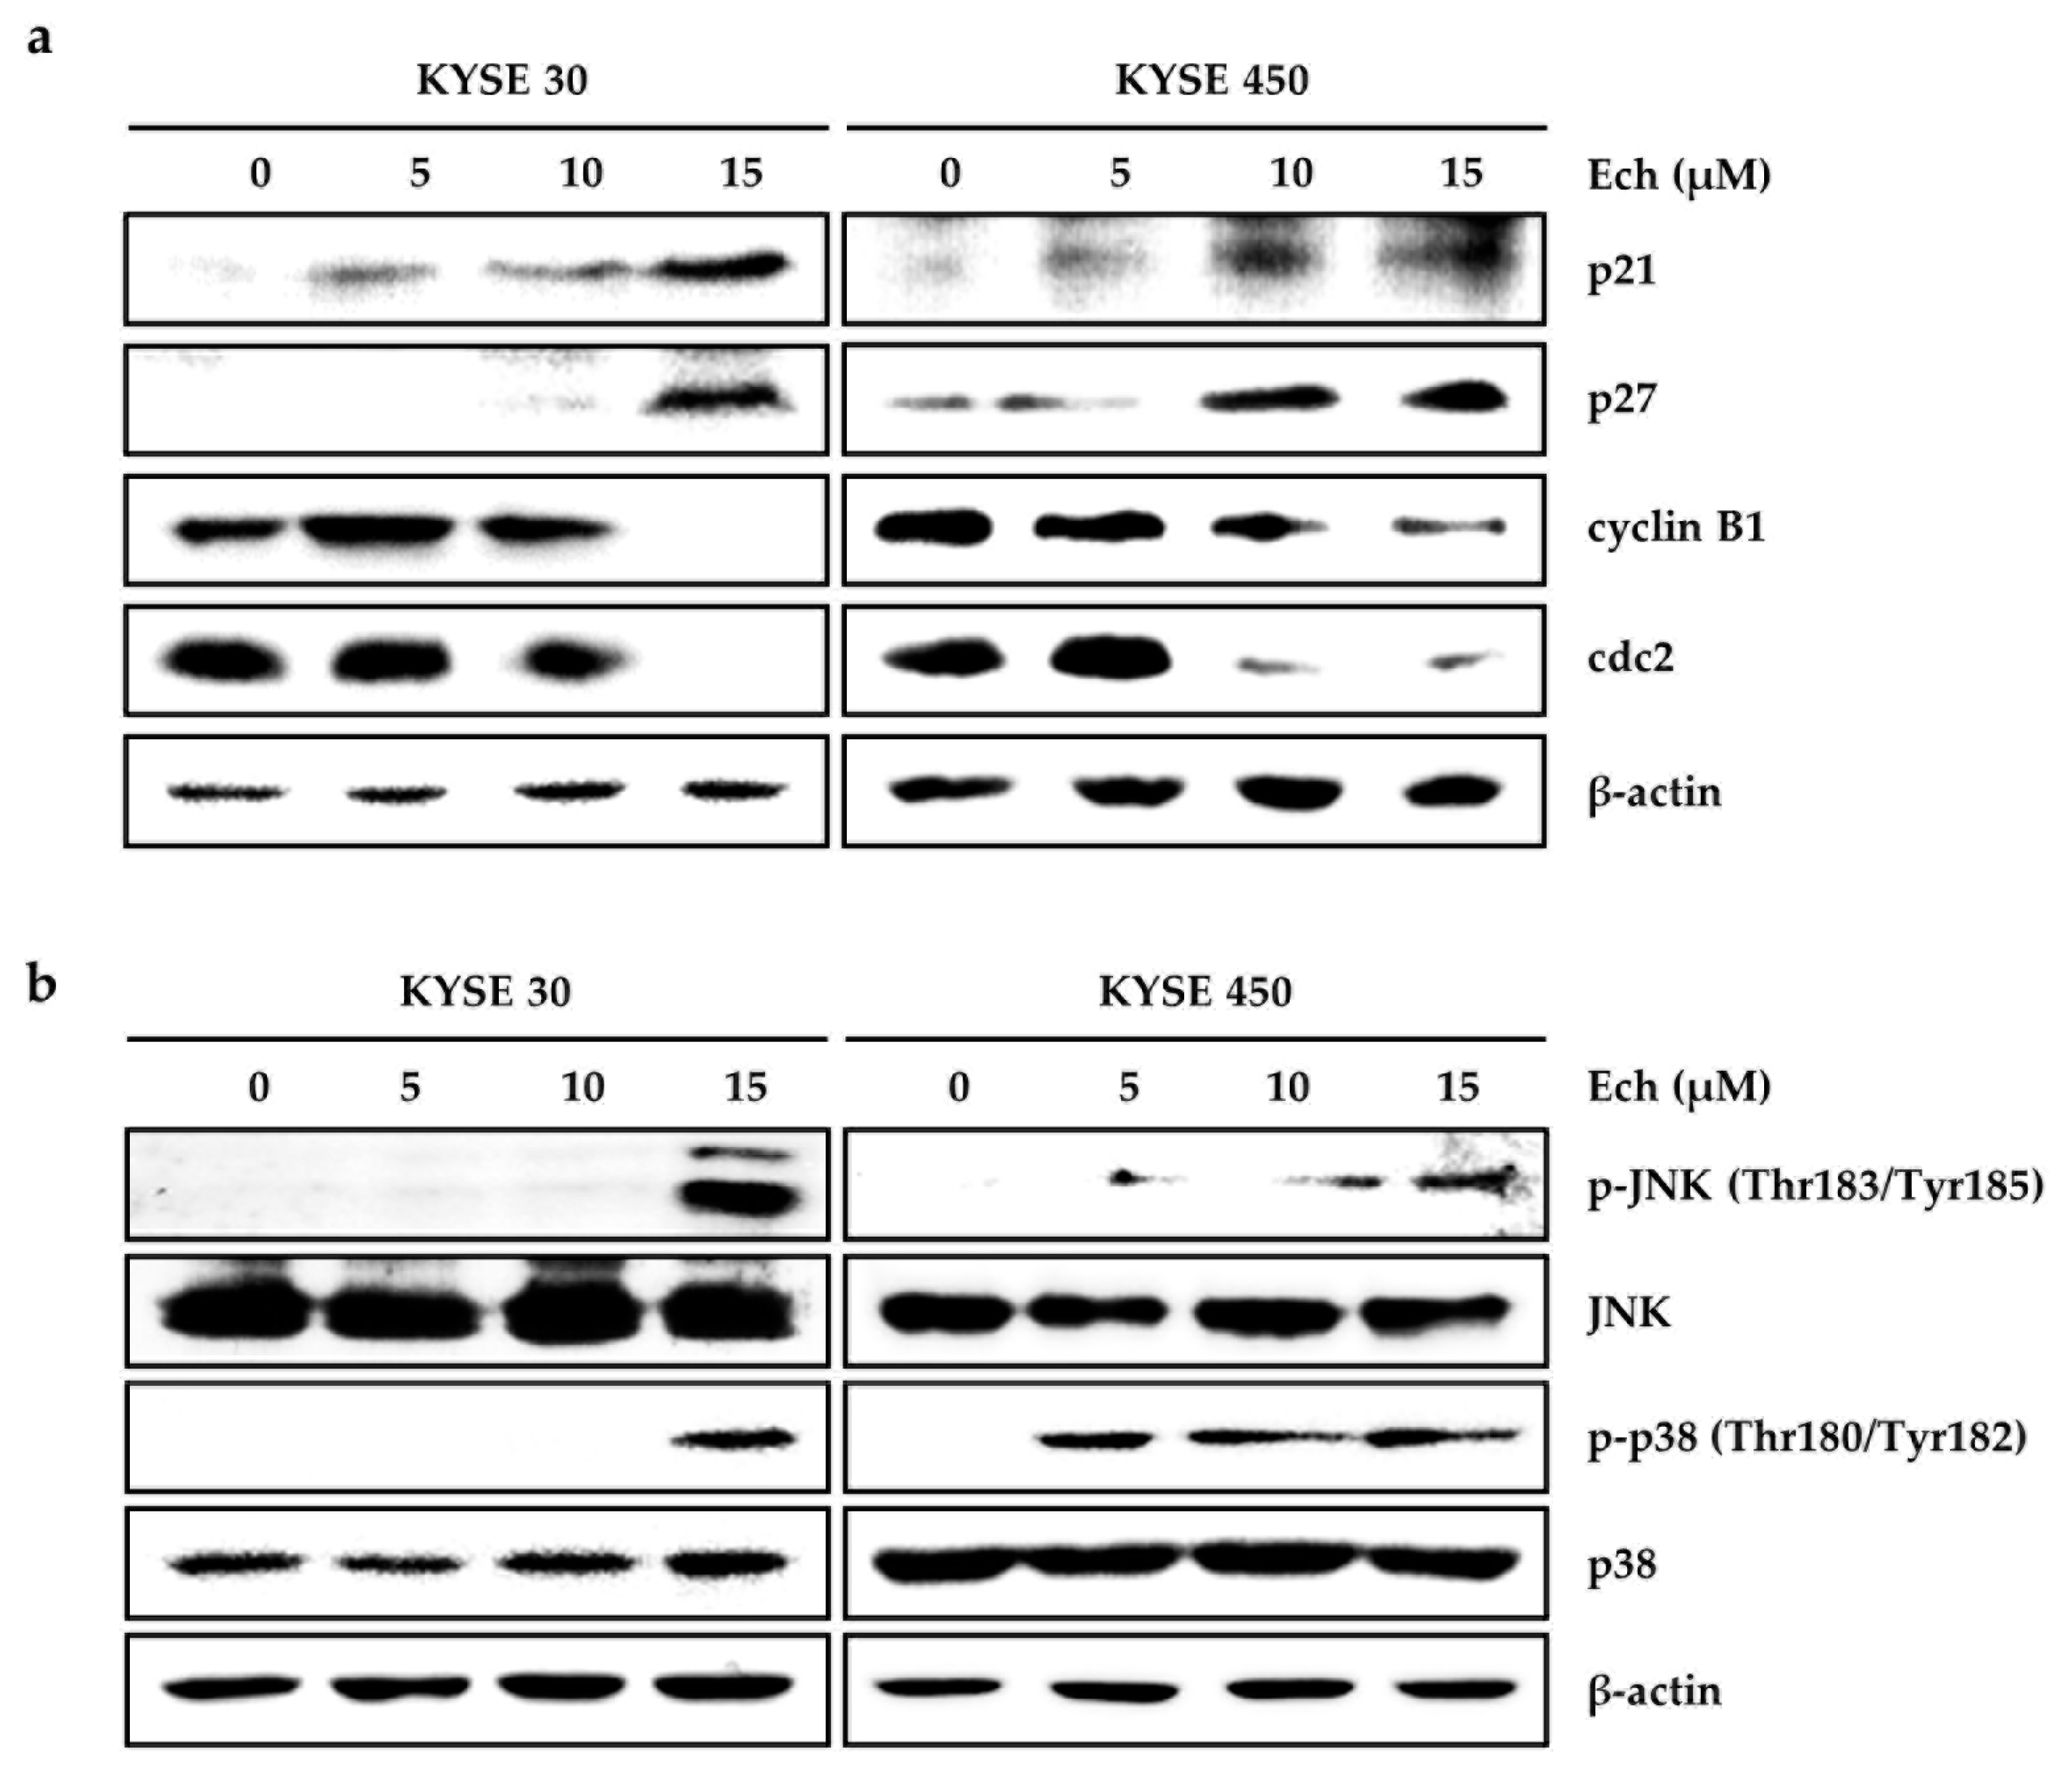
2.2. Ech Arrests Cell Cycle of ESCC Cells at G2/M Phase and Induces Apoptosis
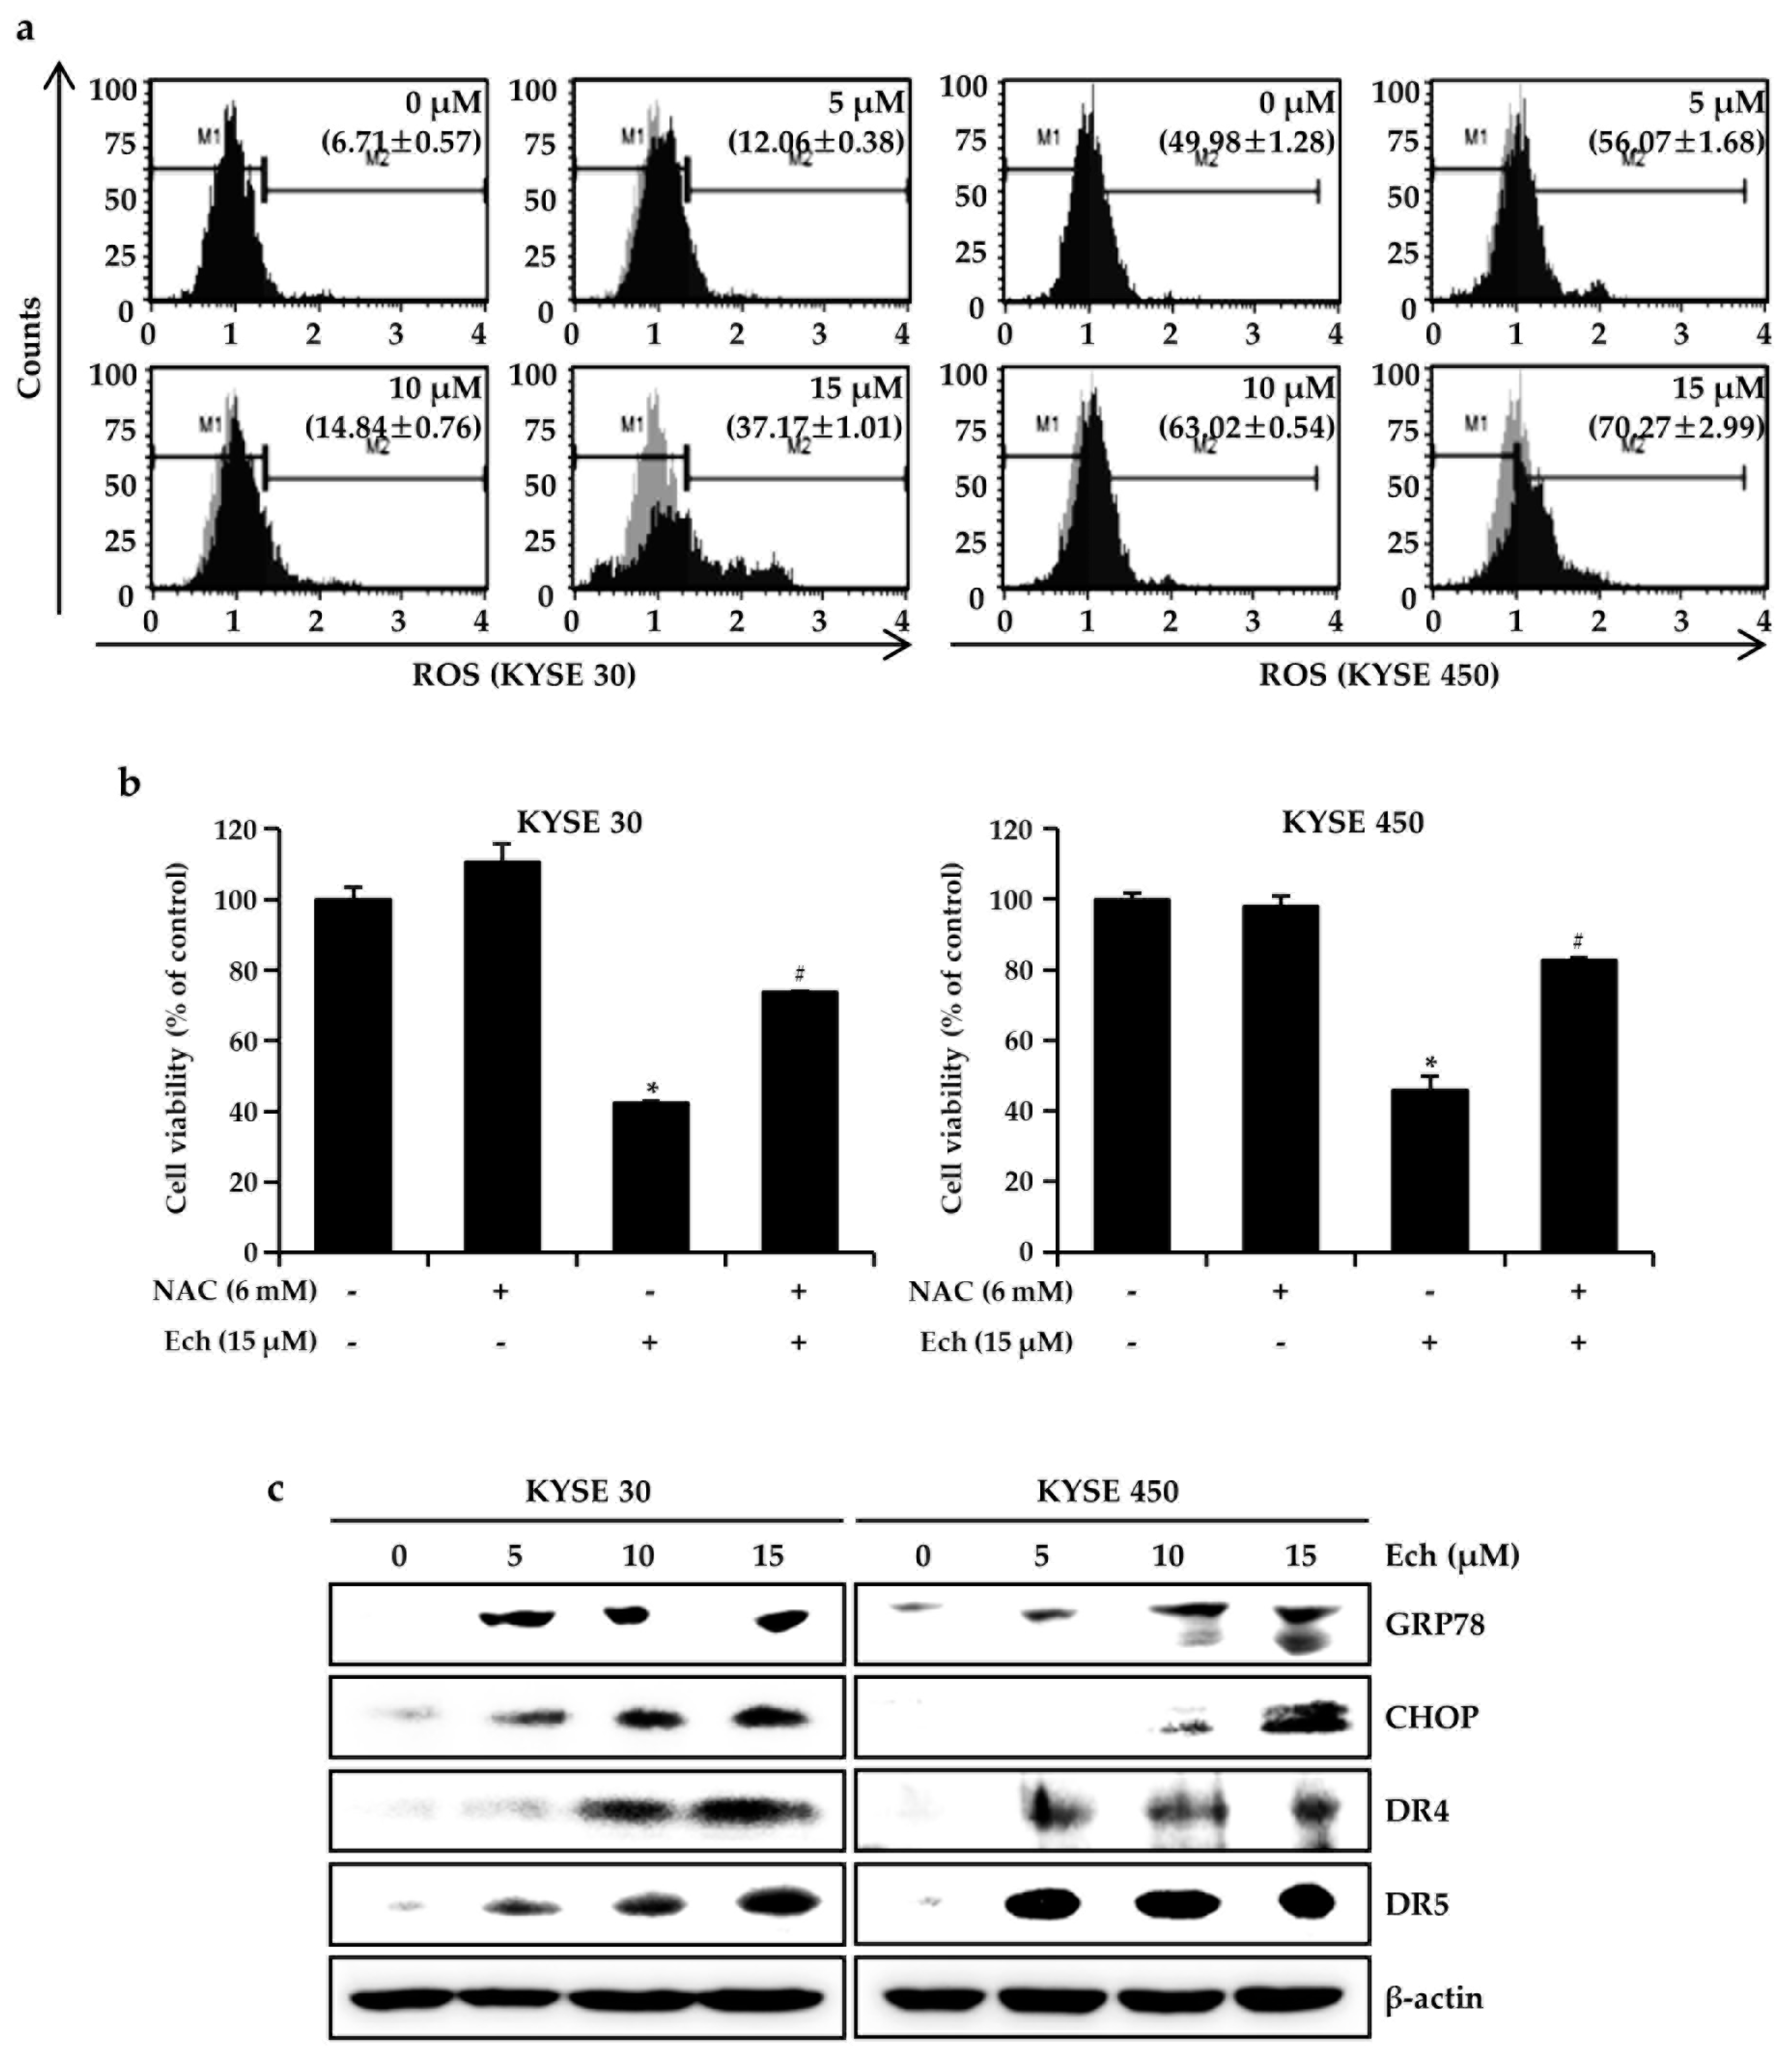
2.3. Ech Induces Apoptosis by Increasing ROS Levels and ER Stress
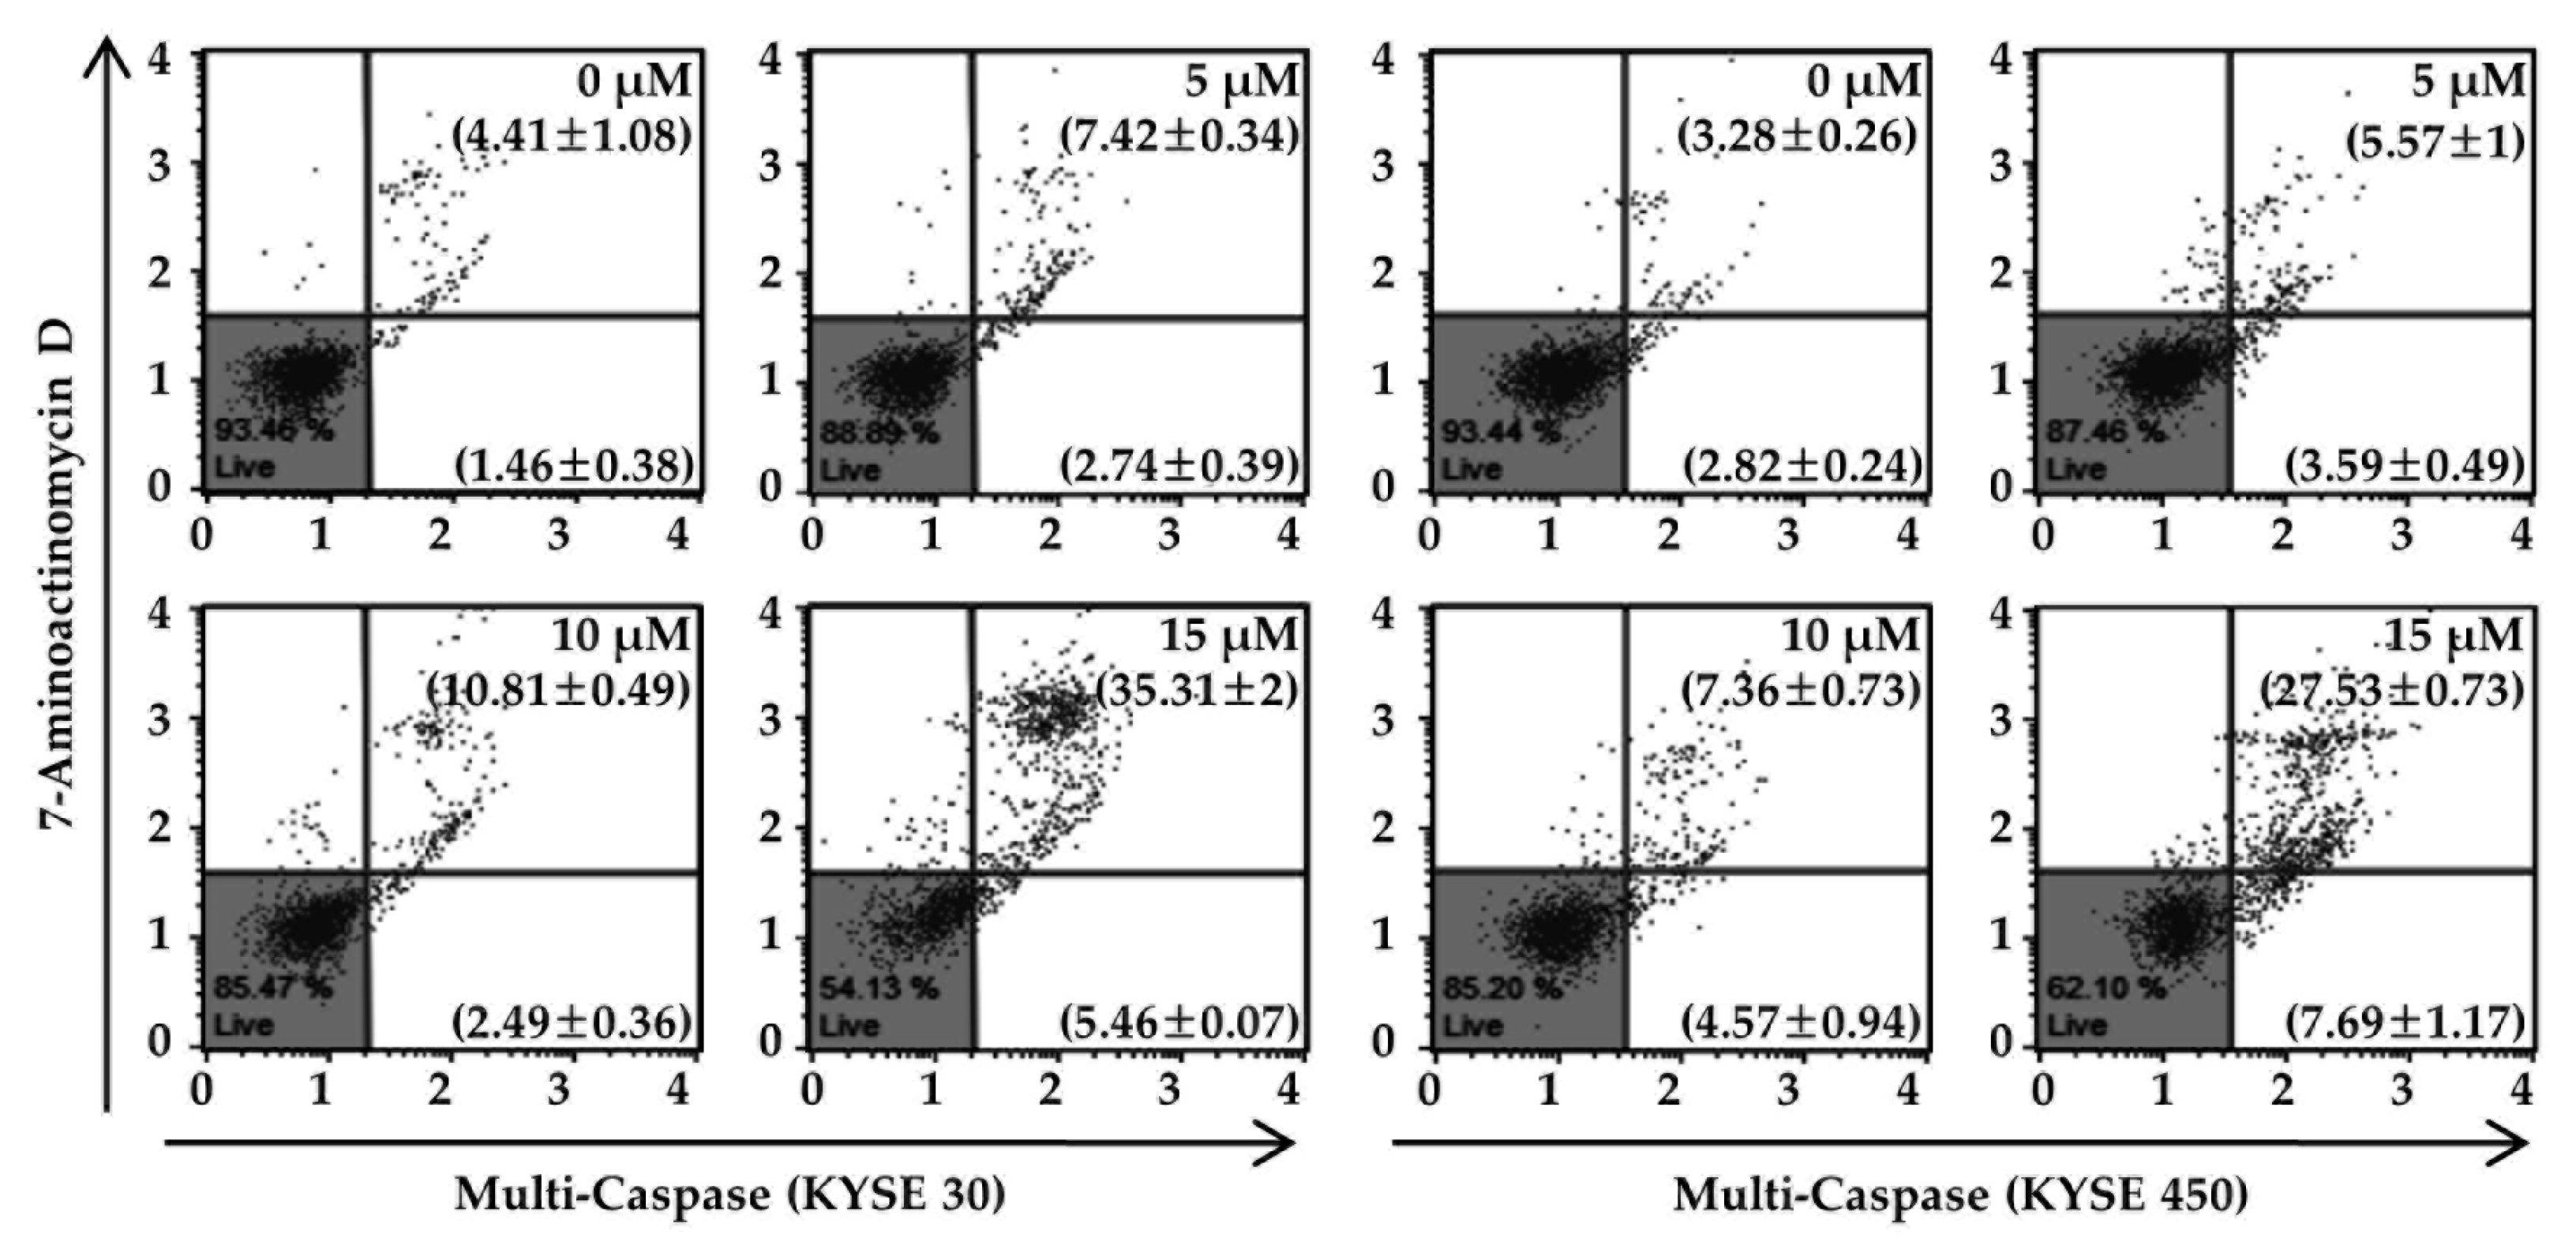
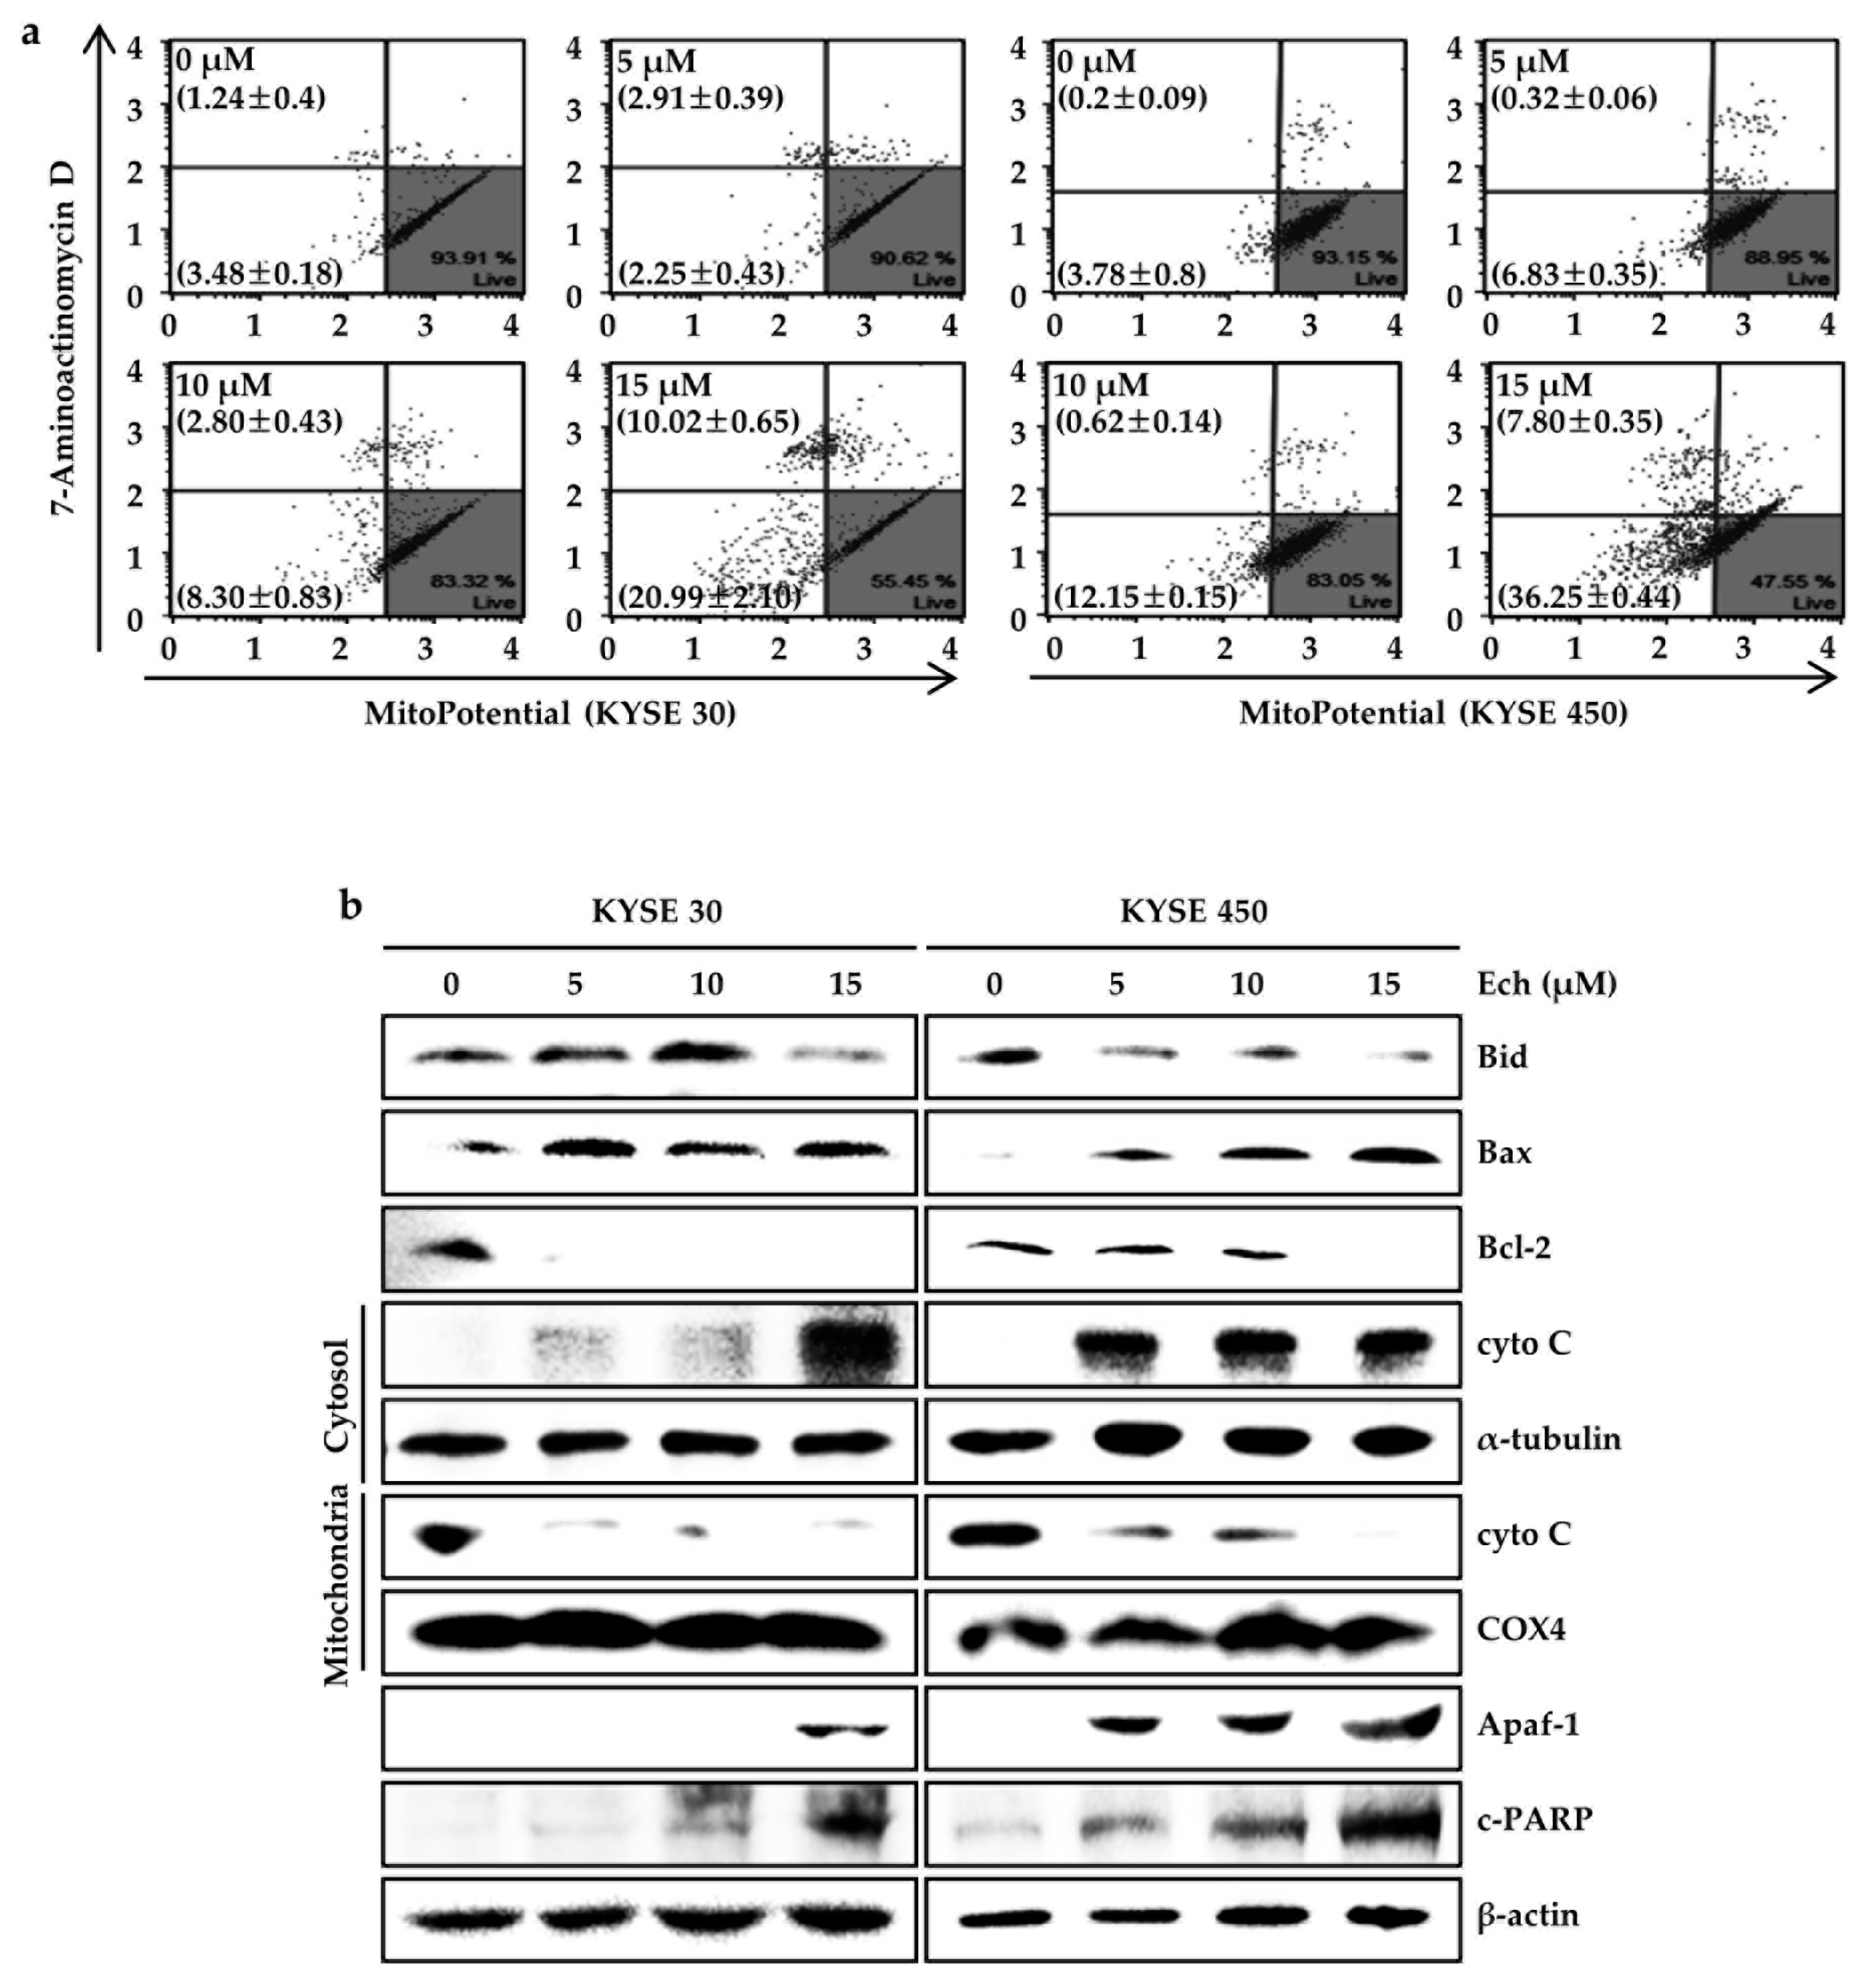
2.4. Ech Provokes Mitochondrial Dysfunction and Caspases Activation
3. Discussion
4. Materials and Methods
4.1. Purification of Echinatin
4.2. Chemicals and Reagents
4.3. Cell Culture
4.4. Cell Growth Assay
4.5. Soft Agar Assay
4.6. Cell Cycle Analysis
4.7. Apoptosis Analysis
4.8. Western Blotting
4.9. Cytosolic and Mitochondrial Fractions
4.10. Reactive Oxygen Species (ROS) Measurements
4.11. Mitochondrial Membrane Potential (MMP) Assay
4.12. Multi-Caspase Activity Analysis
4.13. Statistical Analysis
Author Contributions
Funding
Acknowledgments
Conflicts of Interest
References
- Ferlay, J.; Colombet, M.; Soerjomataram, I.; Mathers, C.; Parkin, D.M.; Pineros, M.; Znaor, A.; Bray, F. Estimating the global cancer incidence and mortality in 2018: GLOBOCAN sources and methods. Int. J. Cancer 2019, 144, 1941–1953. [Google Scholar] [CrossRef] [PubMed]
- Siegel, R.L.; Miller, K.D.; Jemal, A. Cancer statistics, 2019. Ca: A Cancer J. Clin. 2019, 69, 7–34. [Google Scholar] [CrossRef] [PubMed]
- Abnet, C.C.; Arnold, M.; Wei, W.Q. Epidemiology of Esophageal Squamous Cell Carcinoma. Gastroenterology 2018, 154, 360–373. [Google Scholar] [CrossRef] [PubMed]
- Newman, D.J.; Cragg, G.M. Natural Products as Sources of New Drugs from 1981 to 2014. J. Nat. Prod. 2016, 79, 629–661. [Google Scholar] [CrossRef] [Green Version]
- Jung, S.K.; Lee, M.H.; Lim, D.Y.; Kim, J.E.; Singh, P.; Lee, S.Y.; Jeong, C.H.; Lim, T.G.; Chen, H.; Chi, Y.I.; et al. Isoliquiritigenin induces apoptosis and inhibits xenograft tumor growth of human lung cancer cells by targeting both wild type and L858R/T790M mutant EGFR. J. Biol. Chem. 2014, 289, 35839–35848. [Google Scholar] [CrossRef]
- Oh, H.N.; Seo, J.H.; Lee, M.H.; Yoon, G.; Cho, S.S.; Liu, K.; Choi, H.; Oh, K.B.; Cho, Y.S.; Kim, H.; et al. Oridonin induces apoptosis in oral squamous cell carcinoma probably through the generation of reactive oxygen species and the p38/JNK MAPK pathway. Int. J. Oncol. 2018, 52, 1749–1759. [Google Scholar] [CrossRef] [Green Version]
- Surh, Y.J. Cancer chemoprevention with dietary phytochemicals. Nature reviews. Cancer 2003, 3, 768–780. [Google Scholar]
- Zhao, R.; Huang, H.; Choi, B.Y.; Liu, X.; Zhang, M.; Zhou, S.; Song, M.; Yin, F.; Chen, H.; Shim, J.H.; et al. Cell growth inhibition by 3-deoxysappanchalcone is mediated by directly targeting the TOPK signaling pathway in colon cancer. Phytomedicine: Int. J. Phytother. Phytopharm. 2018, 61, 152813. [Google Scholar] [CrossRef]
- Fu, Y.; Chen, J.; Li, Y.J.; Zheng, Y.F.; Li, P. Antioxidant and anti-inflammatory activities of six flavonoids separated from licorice. Food Chem. 2013, 141, 1063–1071. [Google Scholar] [CrossRef]
- Lin, Y.; Kuang, Y.; Li, K.; Wang, S.; Ji, S.; Chen, K.; Song, W.; Qiao, X.; Ye, M. Nrf2 activators from Glycyrrhiza inflata and their hepatoprotective activities against CCl4-induced liver injury in mice. Bioorganic Med. Chem. 2017, 25, 5522–5530. [Google Scholar] [CrossRef]
- Elmore, S. Apoptosis: A review of programmed cell death. Toxicol. Pathol. 2007, 35, 495–516. [Google Scholar] [CrossRef] [PubMed]
- Fulda, S.; Debatin, K.M. Extrinsic versus intrinsic apoptosis pathways in anticancer chemotherapy. Oncogene 2006, 25, 4798–4811. [Google Scholar] [CrossRef] [PubMed] [Green Version]
- Schumacker, P.T. Reactive oxygen species in cancer: A dance with the devil. Cancer Cell 2015, 27, 156–157. [Google Scholar] [CrossRef] [PubMed]
- Ott, M.; Gogvadze, V.; Orrenius, S.; Zhivotovsky, B. Mitochondria, oxidative stress and cell death. Apoptosis: Int. J. Program. Cell Death 2007, 12, 913–922. [Google Scholar] [CrossRef] [PubMed]
- Sui, X.; Kong, N.; Ye, L.; Han, W.; Zhou, J.; Zhang, Q.; He, C.; Pan, H. p38 and JNK MAPK pathways control the balance of apoptosis and autophagy in response to chemotherapeutic agents. Cancer Lett. 2014, 344, 174–179. [Google Scholar] [CrossRef] [PubMed]
- Asghar, U.; Witkiewicz, A.K.; Turner, N.C.; Knudsen, E.S. The history and future of targeting cyclin-dependent kinases in cancer therapy. Nature reviews. Drug Discov. 2015, 14, 130–146. [Google Scholar] [CrossRef]
- Wlodkowic, D.; Skommer, J.; Darzynkiewicz, Z. Flow cytometry-based apoptosis detection. Methods Mol. Biol. 2009, 559, 19–32. [Google Scholar]
- Matsuda, S.; Takeuchi, H.; Kawakubo, H.; Ando, N.; Kitagawa, Y. Current Advancement in Multidisciplinary Treatment for Resectable cStage II/III Esophageal Squamous Cell Carcinoma in Japan. Ann. Thorac. Cardiovasc. Surg. 2016, 22, 275–283. [Google Scholar] [CrossRef] [Green Version]
- Nageen, B.; Sarfraz, I.; Rasul, A.; Hussain, G.; Rukhsar, F.; Irshad, S.; Riaz, A.; Selamoglu, Z.; Ali, M. Eupatilin: A natural pharmacologically active flavone compound with its wide range applications. J. Asian Nat. Prod. Res. 2018, 1–16. [Google Scholar] [CrossRef]
- Oh, H.N.; Seo, J.H.; Lee, M.H.; Kim, C.; Kim, E.; Yoon, G.; Cho, S.S.; Cho, Y.S.; Choi, H.W.; Shim, J.H.; et al. Licochalcone C induced apoptosis in human oral squamous cell carcinoma cells by regulation of the JAK2/STAT3 signaling pathway. J. Cell Biochem. 2018, 119, 10118–10130. [Google Scholar] [CrossRef]
- Yao, K.; Chen, H.; Lee, M.H.; Li, H.; Ma, W.; Peng, C.; Song, N.R.; Lee, K.W.; Bode, A.M.; Dong, Z.; et al. Licochalcone A, a natural inhibitor of c-Jun N-terminal kinase 1. Cancer Prev. Res. 2014, 7, 139–149. [Google Scholar] [CrossRef] [PubMed]
- Kang, T.H.; Yoon, G.; Kang, I.A.; Oh, H.N.; Chae, J.I.; Shim, J.H. Natural Compound Licochalcone B Induced Extrinsic and Intrinsic Apoptosis in Human Skin Melanoma (A375) and Squamous Cell Carcinoma (A431) Cells. Phytother. Res. Ptr. 2017, 31, 1858–1867. [Google Scholar] [CrossRef] [PubMed]
- Wang, H.; Zhang, T.; Sun, W.; Wang, Z.; Zuo, D.; Zhou, Z.; Li, S.; Xu, J.; Yin, F.; Hua, Y.; et al. Erianin induces G2/M-phase arrest, apoptosis, and autophagy via the ROS/JNK signaling pathway in human osteosarcoma cells in vitro and in vivo. Cell Death Dis. 2016, 7, e2247. [Google Scholar] [CrossRef] [PubMed]
- Stark, G.R.; Taylor, W.R. Analyzing the G2/M checkpoint. Methods Mol. Biol. 2004, 280, 51–82. [Google Scholar]
- Kawamoto, H.; Koizumi, H.; Uchikoshi, T. Expression of the G2-M checkpoint regulators cyclin B1 and cdc2 in nonmalignant and malignant human breast lesions: Immunocytochemical and quantitative image analyses. Am. J. Pathol. 1997, 150, 15–23. [Google Scholar]
- Galluzzi, L.; Vitale, I.; Aaronson, S.A.; Abrams, J.M.; Adam, D.; Agostinis, P.; Alnemri, E.S.; Altucci, L.; Amelio, I.; Andrews, D.W.; et al. Molecular mechanisms of cell death: Recommendations of the Nomenclature Committee on Cell Death 2018. Cell Death Differ. 2018, 25, 486–541. [Google Scholar] [CrossRef]
- Malhotra, J.D.; Kaufman, R.J. Endoplasmic reticulum stress and oxidative stress: A vicious cycle or a double-edged sword? Antioxid. Redox Signal. 2007, 9, 2277–2293. [Google Scholar] [CrossRef]
- Dauer, P.; Sharma, N.S.; Gupta, V.K.; Durden, B.; Hadad, R.; Banerjee, S.; Dudeja, V.; Saluja, A.; Banerjee, S. ER stress sensor, glucose regulatory protein 78 (GRP78) regulates redox status in pancreatic cancer thereby maintaining “stemness”. Cell Death Dis. 2019, 10, 132. [Google Scholar] [CrossRef]
- Ulianich, L.; Insabato, L. Endoplasmic reticulum stress in endometrial cancer. Front. Med. 2014, 1, 55. [Google Scholar] [CrossRef]
- Hardy, B.; Raiter, A.; Yakimov, M.; Vilkin, A.; Niv, Y. Colon cancer cells expressing cell surface GRP78 as a marker for reduced tumorigenicity. Cell. Oncol. 2012, 35, 345–354. [Google Scholar] [CrossRef]
- Nishitoh, H. CHOP is a multifunctional transcription factor in the ER stress response. J. Biochem. 2012, 151, 217–219. [Google Scholar] [CrossRef] [PubMed]
- Liao, H.Y.; Kao, C.M.; Yao, C.L.; Chiu, P.W.; Yao, C.C.; Chen, S.C. 2,4,6-Trinitrotoluene Induces Apoptosis via ROS-Regulated Mitochondrial Dysfunction and Endoplasmic Reticulum Stress in HepG2 and Hep3B Cells. Sci. Rep. 2017, 7, 8148. [Google Scholar] [CrossRef] [PubMed]
- Csordas, G.; Thomas, A.P.; Hajnoczky, G. Quasi-synaptic calcium signal transmission between endoplasmic reticulum and mitochondria. Embo. J. 1999, 18, 96–108. [Google Scholar] [CrossRef] [PubMed] [Green Version]
Sample Availability: Samples of the compounds are not available from the authors. |


© 2019 by the authors. Licensee MDPI, Basel, Switzerland. This article is an open access article distributed under the terms and conditions of the Creative Commons Attribution (CC BY) license (http://creativecommons.org/licenses/by/4.0/).
Share and Cite
Kwak, A.-W.; Choi, J.-S.; Lee, M.-H.; Oh, H.-N.; Cho, S.-S.; Yoon, G.; Liu, K.; Chae, J.-I.; Shim, J.-H. Retrochalcone Echinatin Triggers Apoptosis of Esophageal Squamous Cell Carcinoma via ROS- and ER Stress-Mediated Signaling Pathways. Molecules 2019, 24, 4055. https://doi.org/10.3390/molecules24224055
Kwak A-W, Choi J-S, Lee M-H, Oh H-N, Cho S-S, Yoon G, Liu K, Chae J-I, Shim J-H. Retrochalcone Echinatin Triggers Apoptosis of Esophageal Squamous Cell Carcinoma via ROS- and ER Stress-Mediated Signaling Pathways. Molecules. 2019; 24(22):4055. https://doi.org/10.3390/molecules24224055
Chicago/Turabian StyleKwak, Ah-Won, Joon-Seok Choi, Mee-Hyun Lee, Ha-Na Oh, Seung-Sik Cho, Goo Yoon, Kangdong Liu, Jung-Il Chae, and Jung-Hyun Shim. 2019. "Retrochalcone Echinatin Triggers Apoptosis of Esophageal Squamous Cell Carcinoma via ROS- and ER Stress-Mediated Signaling Pathways" Molecules 24, no. 22: 4055. https://doi.org/10.3390/molecules24224055