Article

Characterization of the Key Aroma Compounds in Marselan Wine by Gas Chromatography-Olfactometry, Quantitative Measurements, Aroma Recombination, and Omission Tests

1
Key Laboratory of Industrial Biotechnology of Ministry of Education, Jiangnan University, 1800 Lihu Ave, Wuxi 214122, Jiangsu, China
2
State Key Laboratory of Food Science and Technology, Jiangnan University, 1800 Lihu Ave, Wuxi 214122, Jiangsu, China
*
Authors to whom correspondence should be addressed.
Molecules 2019, 24(16), 2978; https://doi.org/10.3390/molecules24162978
Submission received: 26 July 2019 / Revised: 13 August 2019 / Accepted: 14 August 2019 / Published: 16 August 2019
(This article belongs to the Section Analytical Chemistry)

Abstract

:
Key odorants of red wine made from the hybrid grapes of Marselan (Vitis vinifera L.) were isolated by solid-phase extraction (SPE) and explored by gas chromatography-olfactometry (GC-O) analysis. Application of aroma extract dilution analysis (AEDA) revealed 43 odor-active compounds, and 31 odorants among them were detected with flavor dilution (FD) factors ranging from 9 to 2187. Comprehensive two-dimensional gas chromatography and time-of-flight mass spectrometry (GC × GC-TOF-MS) were exploited to quantitate the aroma-active compounds with FD ≥9. The identification indicated β-damascenone as having the highest FD factors, followed by eugenol, 2,3-butanedione, citronellol, 4-hydroxy-2,5-dimethyl-3(2H)-furanone, phenethyl acetate, guaiacol, and 2-methoxy-4-vinylphenol. A total of 21 compounds were found to have odor activity values (OAVs) >1.0. Aroma reconstitution validation experiments showed a good similarity of blackberry, green pepper, honey, raspberry, caramel, smoky, and cinnamon aroma attributes between the original Marselan wine and the reconstructed wine. In addition, omission tests were carried out to further determine the contribution of odorants to the overall aroma.

1. Introduction

Marselan (Vitis vinifera L.) is hybrid cultivar of two famous grape varieties, Cabernet Sauvignon and Grenache [1]. The grape got its name from the French region where it was first bred in 1961. With its strong adaptability to the environment, strong resistance to common diseases, and small berries conducive to extracting aromatic and deep-colored wines with soft tannins, it became a very advantageous grape variety, and was officially registered as a wine grape in France in 1990 [2]. This grape has been gradually accepted and is exclusively used in making some world class wines, especially in “new world” wine countries [3]. Strongly structured and elegant wines are made from Marselan; the result is that it is regarded as a grape variety which is highly adapted to the taste of Chinese consumers [4]. Hence, the planting area has been increasing year by year since Marselan was introduced to China in 2001. At present, China is one of countries with the largest Marselan planting areas. Due to its good performance in China, Marselan might serve as flagship variety in China, like Shiraz for Australian and Sauvignon Blanc for New Zealand [5].
Numerous publications have proved the capacity of Marselan for producing high quality wines [6,7], but few studies have dealt with the aroma aspects associated with its high quality. The key aroma compounds of Cabernet Sauvignon and Grenache, from which Marselan was obtained, have been extensively investigated in previous studies [8,9,10]. Several compounds were identified as important, including β-damascenone and 3-mercapto-1-hexanol in Grenache wine [8], and β-ionone as well as 2-methoxy-3-isobutylpyrazine in Cabernet Sauvignon wine [11]. It is worth noting that the sensory characteristics of the wine from the hybrid are usually different from those of its parents [12,13], as with Marselan wine. It has already been reported that Marselan was shown to produce wines with juicy vegetable and spicy aroma characteristics [14]. A few studies focused on the flavor of Marselan wine through analyzing non-volatile components, and malvidin-3-glucoside was the richest anthocyanin-derived pigment component [1,15]. However, as far as we know, the aromatic and chemical characteristics of Marselan wine have rarely been reported with respect to quantitative data for aroma compounds and their aroma contributions.
To clarify key aroma compounds, the so-called “sensomics” approach proposed by Schieberle and Hofmann [16] has been successfully used in different kinds of wines [10,17,18,19]. This approach includes aroma extract dilution analysis (AEDA) performed on gas chromatography-olfactometry (GC-O) to discover key odorants, and accurate quantitation followed by aroma reconstitution and omission experiments [20]. In the procedures, the identification and the accurate quantitation of target odor-active regions are crucial [21]. Although the odor-active region can be targeted by GC-O, some key odorants with low thresholds are difficult and time-consuming to identify and quantitate due to the extremely low concentration and the polarity of the compound itself [22]. Comprehensive two-dimensional gas chromatography in combination with time-of-flight mass spectrometry (GC × GC-TOF-MS) has an outstanding performance for identifying compounds [23]. Furthermore GC × GC-TOF-MS, with an excellent ability to separate and enhanced detector capabilities, has been shown to have the advantage in the quantitation of a set of key odorants over foods [24,25]. It can avoid complicated sample pretreatment and simultaneously quantify compounds with large differences of concentration in one run [26].
The objective of this research consisted of (1) the identification of the key aroma compounds in Marselan wine by AEDA, (2) the quantitation of key odorants through GC × GC-TOF-MS and calculation of odor active values (OAVs), and (3) validation via aroma reconstitution experiments, sensory description analysis, and omission tests to determine the importance of these compounds.

2. Results and Discussion

The volatile compounds of Marselan wine isolated through the solid-phase extraction (SPE) method were evaluated by five assessors among panelists. They confirmed that the extracts exhibited the same typical aroma characteristics compared with the real Marselan wine samples. Thus, the method of SPE was proven to be reasonable for aroma extraction and key aroma compound screening.

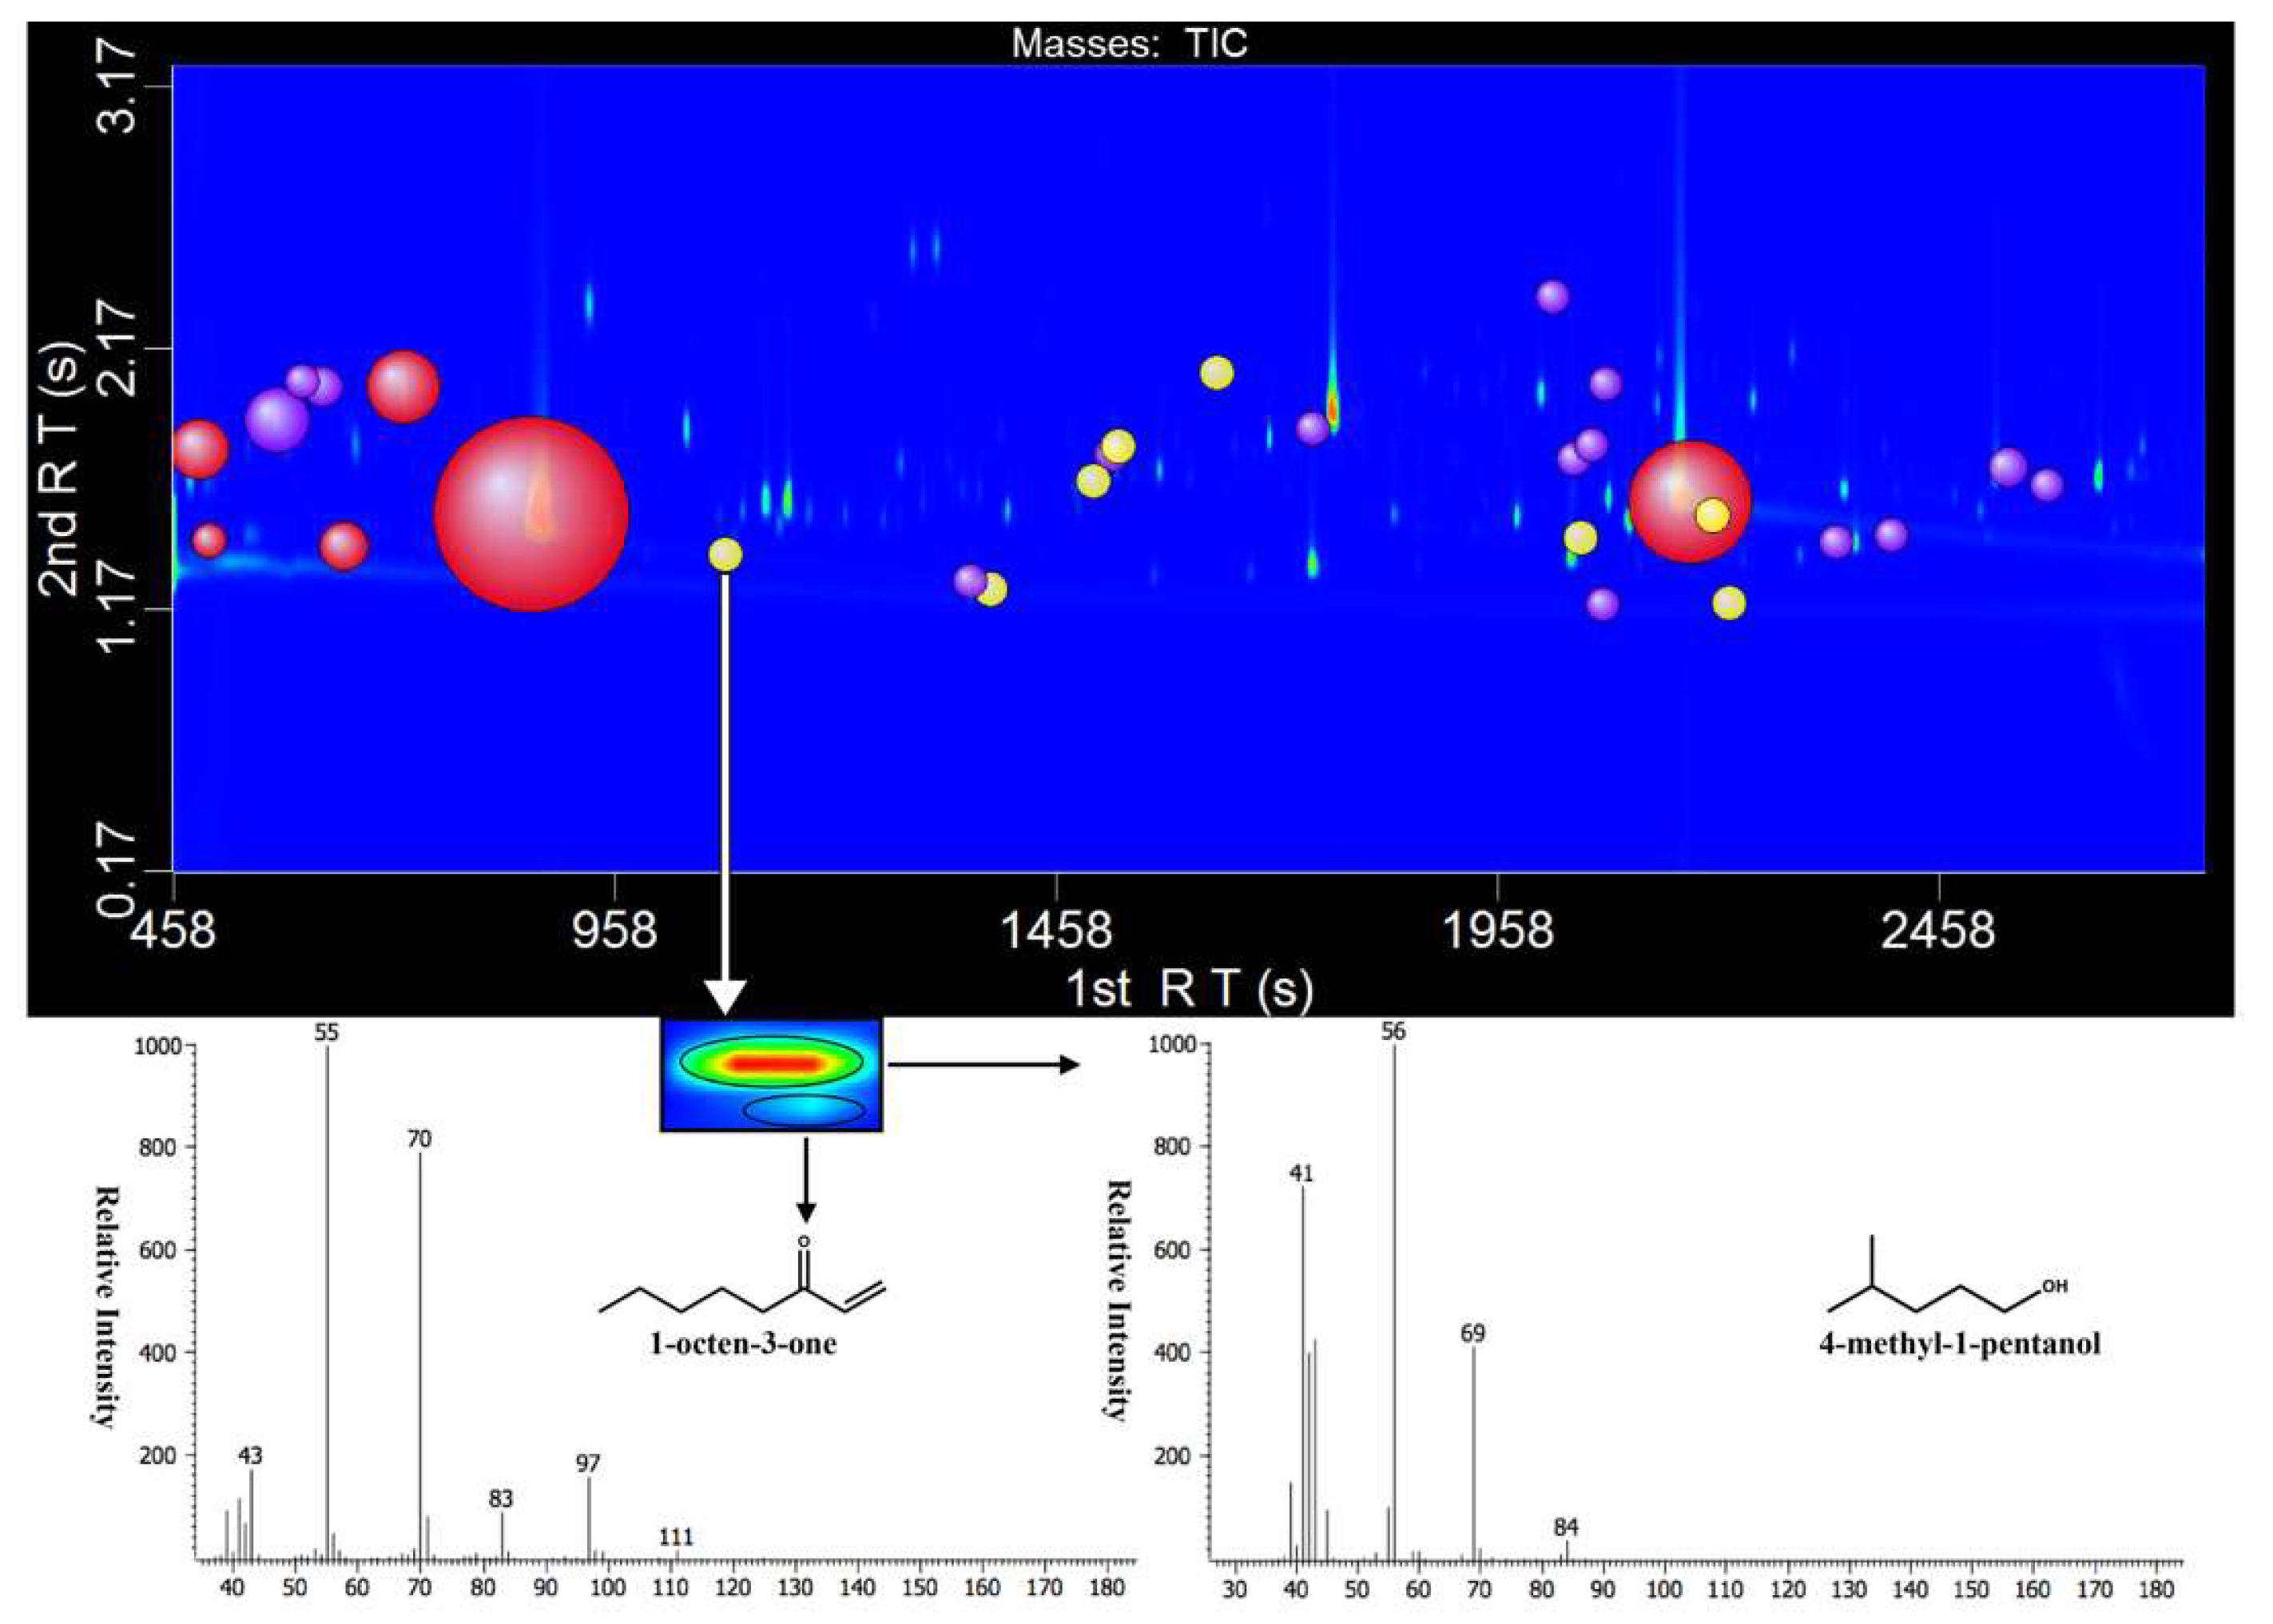
2.1. Identification of Odor-Active Compounds

AEDA was carried out on the entire set of volatiles isolated by the SPE method. A total set of 43 odorants were detected by GC-O analysis on DB-FFAP and HP-5MS columns in two wine samples (Table 1). The identical odor-active compounds in two different wines of Marselan wines were almost the same. Aroma compounds with high FD factors may make great contributions to the overall aroma of wine [27]. Aroma compounds with FD ≥ 9 were detected as the most odor-active compounds in Marselan wines and the number of these compounds in the 2014 wine was slightly greater than in the 2015 wine.
β-Damascenone, with the greatest FD factors (FD ≥ 2187), was determined as the most important aroma compound in both samples. The aroma characteristics of β-damascenone was not the same in different studies, and aromas were found to include cooked apple [28], honey [29], and fruit [30], as well as a honey-like flavor in this study. The second highest FD (FD = 729) was observed for the clove-like eugenol, the butter-like 2,3-butanedione, the rose-like citronellol, the caramel-like furaneol®, and the flower-like phenethyl acetate, along with the smoky-like guaiacol and 2-methoxy-4-vinylphenol. Only furaneol® was both detected in the two samples with FD = 729, which was associated with jam or caramel notes. Furthermore, the blueberry-like ethyl isovalerate, the rancid-like 3-methylbutanoic acid, the caramel-like homofuraneol, and cooked-potato odors like methional and methionol were identified with FD ≥ 81 in both samples. The above aroma compounds were suggested as potential contributors to the overall aroma of Marselan red wine considering their high FD factors. Although all the odor-active compounds identified in Marselan wine have been previously reported in other red wines, research has shown that the volatile aroma compositions of wines made from different varieties might only vary in the proportions of those compounds, despite the distinctive aroma perception in varietal wines [31]. The GC-O screening of key odorants was based on their odor threshold in air and not in the wine matrix. In order to further determine their contribution to the overall aroma profile of Marselan wine, the odor activity values (OAVs) of the key odorant needs to be investigated through accurately quantifying the concentration of key odorants to calculate the ratio of the concentration of the odorant and its odor threshold in corresponding matrix [20].

2.2. Quantitation of Aroma Compounds

The 2014 Marselan wine was selected to be quantified for its composition of more odorants with FD ≥ 9 and higher FD factors. A total of 31 aroma compounds with FD ≥ 9 were quantified by GC × GC-TOF-MS analysis (Table 2 and Table 3). As GC × GC-TOF-MS obtains a higher peak capacity and has enhanced detector capacity, it not only can accurately quantify alcohol compounds exceeding 100 mg/L, but also ng/L concentration of methoxypyrazine compounds in the meantime (Figure 1). For some aldehyde ketone compounds such as 2,3-butanedione, 1-octen-3-one, because the peak time of these compounds is close to some compounds with higher concentration, the sample is often necessary for derivative processing [29,32]. Owing to the excellent separation capabilities of GC × GC-TOF-MS, the sample did not need to be derivatives, and these compounds could be directly separated (Figure 1).
The compound with the highest concentration was 3-methyl-1-butanol (382,940.8 μg/L), followed by phenethyl alcohol (30,823.2 μg/L) and 2-methyl-1-propanol (10,999.4 μg/L) (Table 2). Apparently the three alcohols are volatile constituents of all alcoholic beverages from yeast metabolism [17]. They are produced when the yeast catabolizes amino acids through the Ehrlich pathway [33]. Via this pathway, the amino acids are completely consumed during the early yeast growth phase, resulting in production of the corresponding alcohols later during the yeast stationary phase [34]. There were 14 compounds above 100 μg/L, while eight compounds were found below 10 μg/L. In particular, β-ionone and 3-isobutyl-2-methoxypyrazine were at extremely low concentrations (below 1 μg/L).
The OAVs were calculated to evaluate the contributions of odorants. Among these 31 quantified odorants, a total of 21 odorants were verified as important odorants in Marselan wine due to their OAVs above 1.0 (Table 2). β-damascenone was not only the odorant with the highest OAV, but also had the greatest FD factors as mentioned before. β-damascenone is derived from carotenoid-derived metabolites of grape fruit and also plays an important role in the characteristic aroma in many different varieties of wines such as Cabernet Sauvignon, Merlot, and Shiraz [9,18]. The OAVs of ethyl 2-methylpropanoate, ethyl 2-methylpropanoate, ethyl butanoate, ethyl isovalerate, and isoamyl acetate were all greater than 10. These ester compounds are generally thought to contribute a fruity expression in red wines [35]. Though the concentration of 3-isobutyl-2-methoxypyrazine was only 0.002 μg/L, the OAV value of 3-isobutyl-2-methoxypyrazine reached 10 because of its extremely low threshold (2 ng/L). 3-isobutyl-2-methoxypyrazine is a characteristic compound in Cabernet Sauvignon which imparts sensory characteristics of bell pepper to wines [36]. It is derived from the metabolism and synthesis of grape fruit itself, and is greatly influenced by climatic conditions such as light and water [37]. However, the specific biosynthetic pathway is not clear at present. It is worth noting that the concentration of furaneol® exceeded 100 μg/L, a value much higher than its threshold (5 μg/L). Furaneol® is considered to be the characteristic aroma several hybrid grape varieties and imparts a caramel-like note at a high concentration and a fruity note at a low concentration [38]. In recent years, it has been studied to identify furaneol glucoside from the hybrid grape variety Muscat Bailey, considered to be an important precursor compound of furaneol® [38]. The reason for the higher furaneol® content in Marselan wine might be the accumulation of furaneol glucoside in the grape fruit, which was released during the alcohol fermentation process. Other than this, some compounds were detected with FD factors, but the OAVs of them were below 1, probably due to the threshold, which was significantly different between in the air and in wine matrix.

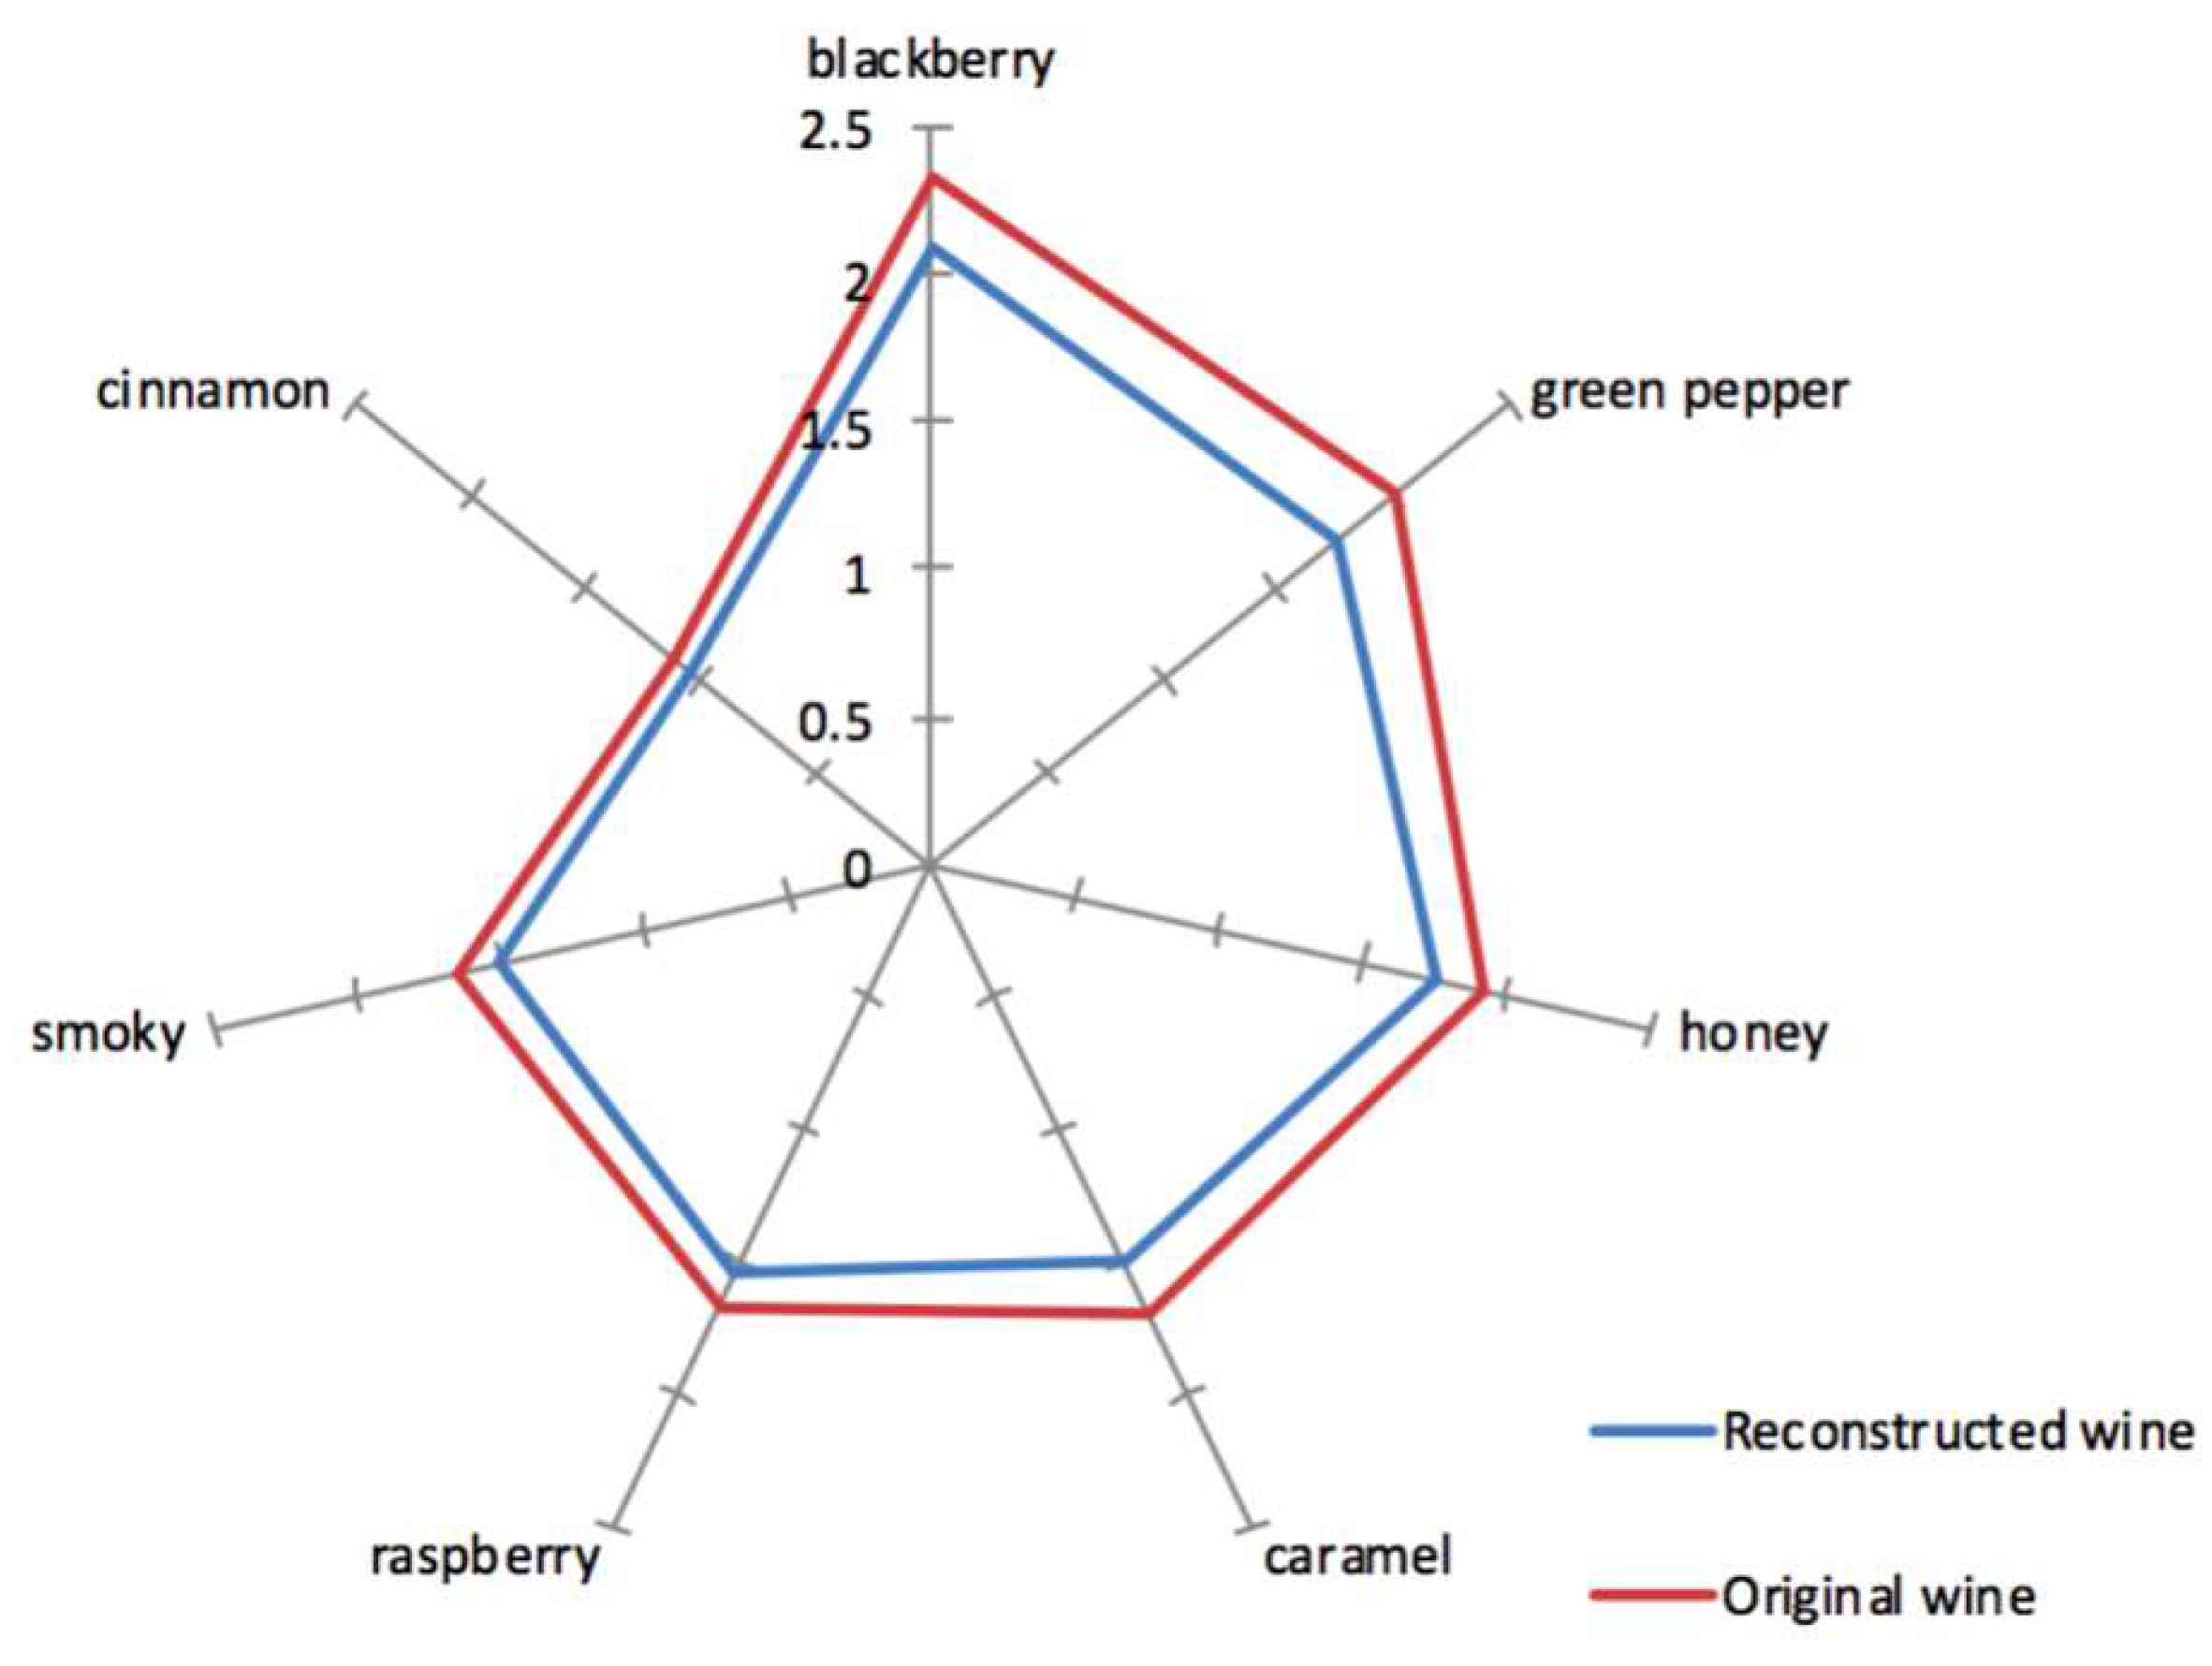
2.3. Aroma Profile Analysis and Aroma Reconstitution

The aroma profile analysis of the Marselan wine revealed that blackberry was the strongest aroma attribute perceivable by panelists, with the highest intensity of 2.3 (red line in Figure 2), followed by moderate green pepper, honey, caramel, raspberry, and smoky aromas. The cinnamon was the weakest perceived aroma attribute.
The global aroma of Marselan wine is a result of natural composition of key odorants in appropriate concentration. An aroma reconstitution experiment was carried out to mimic the characteristic aroma of the Marselan wine and further to confirm the quantitative result. Considering the effect of nonvolatile matrix on aroma perception [49], the reconstitution aroma sample containing 21 key odorants (OAV ≥ 1) was prepared in an odorless wine matrix and was compared with the corresponding real wine. The intensity of seven odor attributes was evaluated. The aroma profile of the recombined wine was similar to that of the original wine, whereas the aroma intensity except cinnamon was slightly lower in the recombined one (Figure 2). However, there is no significant difference in aroma attributes between the Marselan wine and the recombinate wine according to the one-way analysis of variance (ANOVA). Although it is usually suggested that the compounds with low OAVs (less than 1) had no or only little contribution to the overall aroma, there are a lot of perceptual interactions when compounds interact together or interact with the non-volatile components of the wine matrix; these phenomena may affect the perceived intensity of the aroma profile [50]. Therefore the omission test needs to be further implemented to verify the importance of the potential key aroma compounds.

2.4. Omission Tests

In order to investigate the significance of the aroma contribution to Marselan wine, a total of 22 omission models were prepared to compare with the reconstitution model by a triangle test. According to Table 3, the data showed that the omission of all esters which were mainly responsible for the fruity in wine were successfully perceived by all panelists with a very high significance (p ≤ 0.001). Moreover, the omission of ethyl 2-methylpropanoate as well as ethyl 2-methylbutyrate showed a high significant difference with respect to the reconstitution model (p ≤ 0.01) and a significant difference was reflected with the omission of ethyl isovalerate and (p ≤ 0.05). Although with the omission of isoamyl acetate and ethyl butanoate a significant difference was detected, the single omission of the two compounds showed no the difference compared with the reconstitution model. This could be the result of the combined action among these compounds. The lack of 3-isobutyl-2-methoxypyrazine was detected with a very significant difference (p ≤ 0.001) and the omission of furaneol® (p ≤ 0.01) was detected as having a highly significant difference. This result revealed that the green pepper and caramel note could play a very important role in the overall aroma of the sample.

3. Materials and Methods

3.1. Wine Samples

The two commercial monovarietal Marselan dry red wines respectively harvested in 2014 and 2015 were selected on the basis of highly representative sensory features through wine expert blind tasting. The wine samples were from the southern foot of Tianshan Mountain in Yanqi County, Xinjiang, China. The basic indicators of two sample wines are as follows: the 2014 Marselan wine (13.5% v/v ethanol, pH 3.50, titratable acidity = 6.6 g/L, total SO2 = 65 mg/L), and the 2015 Marselan wine (13.5% v/v ethanol, pH 3.40, titratable acidity = 6.8 g/L, total SO2 = 73 mg/L).

3.2. Chemicals

All analytical standards used in quantitative analysis and as reference standards during GC-O were purchased from Sigma-Aldrich China Co. (St. Louis, Missouri, USA) with at least 97% purity. These analytical standards were ethyl acetate, ethyl 2-methylbutyrate, 2,3-butanedione, ethyl butyrate, ethyl isovalerat, 1-hexanal, isoamyl acetate, 2-methyl-1-propanol, methyl hexanoate, 3-methyl-1-butanol, ethyl hexanoate, γ-terpinene, 1-octen-3-one, 2,6-dimethylpyrazine, 1-octen-3-ol, 1-heptanol, 3-methylthiopropanal (methional), benzaldehyde, 3-isobutyl-2-methoxypyrazine, linalool, terpinen-4-ol, β-cyclocitral, acetophenone, 3-methylbutanoic acid, 3-methylthiopropanol (methionol), citronellol, ethyl laurate, β-damascenone, guaiacol, phenethyl alcohol, geraniol, β-ionone, 5-butyldihydro-4-methyl-2(3H)-furanone (whiskey lactone), 3-hydroxy-2-methyl-4H-pyran-4-one (maltol), 4-hydroxy-2,5-dimethyl-3(2H)-furanone (furaneol®), γ-nonalactone, 4-hydroxy-5-ethyl-2-methyl-3(2H)-furanone (homofuraneol), δ-decalactone, eugenol, and 2-methoxy-4-vinylphenol. Absolute ethanol (≥99.8%, HPLC grade), dichloromethane (≥99.8%, HPLC grade), methanol (≥99.9%, HPLC grade), and 2-octanol (internal standard, IS2) were purchased from Sigma-Aldrich China Co. (St. Louis, MO, USA). Ethyl octanoate-d15 (internal standard, IS1), 2-isobutyl-3-methoxy-d3-pyrazine (internal standard, IS3), 2-phenylethyl acetate-d3 (internal standard, IS4) and 2-methoxy-d3-phenol (internal standard, IS5) were purchased from CDN Isotopes (Quebec, Canada). Ultrapure water was obtained from Milli-Q purification system (Millipore, Bedford, MA).

3.3. Isolation of the Volatiles

Volatile compounds were enriched by solid-phase extraction (SPE). [29] Extraction 50 mL of wine sample was at a flow rate of 1 mL/min using a column (LiChrolut EN, Merck, Germany; 500 mg of phase). Before use, the column was rinsed with 6 mL of dichloromethane, 6 mL of methanol and 6 mL of a 12% water–ethanol mixture (ethanol by volume) successively. After the sample was enriched, the column was washed with 20 mL of ultrapure water to eliminate excess pigment, and other low-molecular-weight polar compounds. Then, the sorbent was eluted with 10 mL of dichloromethane and dried with anhydrous sodium sulfate. Finally, under a stream of pure nitrogen, the organic phase was concentrated to a volume of 250 μL and stored at −20 °C before analysis.

3.4. Gas Chromatography-Mass Spectrometric/Olfactometry (GC-MS-O)

The instruments of an Agilent 6890 gas chromatograph equipped with an Agilent 5975 mass-selective detector (MSD) (Agilent, Palo Alto, CA, USA) and a sniffing port (ODP 2, Gerstel, Germany) were used to analysis. The analytical columns were made up of a DB-FFAP polar column (60 m × 0.25 mm i.d., 0.25-μm film thickness, Agilent, Torrance, CA) and a HP-5MS non-polar column (30 m × 0.25 mm i.d., 0.25-μm film thicknesses, Agilent, Torrance, CA). Helium was used to be as carrier gas at flow rate of 2 mL/min. Aroma extraction of wine sample (1 μL) was injected into the front inlet programmed in splitless mode, and the oven temperature was initially held at 45 °C for 2 min, then raised to 230 °C at 4 °C/min and held for 15 min. The supplemented effluent with helium was split to the olfactory port fixed at the back of the GC detector. The sniffing time was 45 min for each analysis and the capillary, which was connected with the sniffing port, was kept at 250 °C. The data acquisition (electron impact (EI) at 70 eV) was in scan mode with an m/z range of 35–400 for compound identification.
GC-O analysis was conducted by four well-trained assessors (two females and two males) from the Laboratory of Brewing Microbiology and Applied Enzymology at Jiangnan University. The assessors first analyzed the extracts on both DB-FFAP column and HP-5MS column and recorded the retention time and descriptors of the odor peak for each compound. After discussion and checking the aroma descriptor with the chemical standards, a lexicon for GC-O analysis of Marselan wine was generated. After some aroma characteristic remembering and recognition tests, aroma extract dilution analysis (AEDA) was used for searching important odorants.

3.5. Aroma Extract Dilution Analysis (AEDA)

AEDA was applied to screen for the most potent odor-active compounds. Aroma extracts were stepwise diluted with dichloromethane (1:2(v/v)) to yield dilutions of 3, 9, 27, etc., finally up to 2187 relative to the initial extracts. Each dilution was analyzed by GC-O on the DB-FFAP column under the same temperature programming conditions until no more odorant appeared. The flavor dilution (FD) factor of each compound was defined as the maximum dilution at which the odorant could be finally perceived by at least three of four assessors. Identification of aroma compounds was achieved by comparing their odors, retention indices (RI) on both columns, and mass spectra with those of pure standards. RI was calculated using a series of standard linear n-alkanes (C5–C30) under the same chromatographic conditions. Furthermore, in order to confirm the identification of the odor-active compounds, samples were run on GC × GC-TOF-MS.
GC × GC-TOF-MS The Leco Pegasus 4D GC × GC-TOF-MS hardware system includes Agilent GC model 7890B, the Leco dual nozzle thermal modulator system, and the secondary column thermostat connected to the time of flight mass spectrometer. The column consisted of a one-dimensional chromatographic polar column DB-FFAP (60 m × 0.25 mm × 0.25 μm, Agilent Technologies, Palo Alto, CA, USA) and a two-dimensional chromatographic medium polarity column Rxi-17Sil MS (1.5 m × 0.25 mm × 0.25 μm, Restek, Bellefonte, PA, USA). The front inlet was programmed in splitless mode, the primary oven temperature program conditions were as follows: the initial temperature was 45 °C for 2 min, then raised at 4 °C/min to 230 °C and held for 15 min. The secondary oven temperature was 5 °C higher than the primary oven during the chromatographic run. The modulator temperature was offset +15 °C from primary oven and the modulation time was set at 4 s. The ion source voltage and temperature was 70 eV, 230 °C respectively. The transfer line temperature was 240 °C. The detector voltage was 1430 V. The acquisition mass range was 35–400 amu and the acquisition frequency was 100 spectra/s. The collected data was processed by LECO ChromaTOF workstation, automated peak find and spectral deconvolution with a baseline offset of 0.5.

3.6. Quantitative Analysis

The solution of standard compounds was prepared in a model wine (13.5% v/v ethanol solution in Milli-Q-water with 6.6 g/L tartaric acid and adjusted to pH 3.5 with NaOH). Ethyl octanoate-d15 (177.0 μg/L), 2-octanol (91.9 μg/L), 2-isobutyl-3-methoxy-d3-pyrazine (0.198 μg/L), 2-phenylethyl acetate-d3 (210.8 μg/L), and 2-methoxy-d3-phenol (156.4 μg/L) were added to the solutions used as internal standards. The range of compound concentration was listed in Table 4. The SPE method used to extract aroma standard compounds in solution is similar to the above mentioned. The extraction volume for the solution was 25 mL and it was passed through the column at a flow rate of 1 mL/min, but the final sorbent was eluted with 1.5 mL of dichloromethane. For GC × GC-TOF-MS analysis, the extraction (1 μL) was injected into the front inlet in splitless mode. The relative area of each compound (area of compound/area of internal standard) was plotted against the respective compound concentration. Linear regression with at least six concentration levels for each standard compound was constructed by least square linear regression. The standard curve and validation data are shown in Table 4. The LODs (Limit of Detection) were calculated as the analyte concentration of a standard that produced a signal-to-noise ratio of 3 and the LOQs (Limit of Quantitation) were calculated as the analyte concentration of a standard that produced a signal-to-noise ratio of 10.

3.7. Aroma Profile Analysis

3.7.1. Panel

Thirteen panelists (eight females and five males), between 20 and 25 years old were recruited from the Laboratory of Brewing Microbiology and Applied Enzymology at Jiangnan University for aroma descriptive analysis. They were provided informed consent and came voluntarily and were paid for their participation.

3.7.2. Panel Training and Performance

Panelists were all trained for at least 6 months on a weekly basis to recognize and describe the odor qualities of a wide range of odorants and products. “Le nez du vin” (Jean Lenoir, Provence, France) was used as the aroma standard to help panelists to recognize and describe the wine odor qualities of 54 odorants. After basic training, the Marselan wine samples were provided to the panelists in the consensus training session for generating a lexicon for Marselan wine. After discussion, a consensus was reached on the main aroma characteristics of the wines, and seven major aroma attributes were selected for descriptive analysis: caramel, cinnamon, smoky, green pepper, honey, raspberry, and blackberry. The standard reference for these attributes were all from the “Le nez du vin” (Jean Lenoir, Provence, France). The vials with different numbers corresponded to their respective aroma attributes in “Le nez du vin” (number 13—raspberry, number 17—blackberry, number 27—honey, number 30—green pepper, number 41—cinnamon, number 51—caramel, and 54—smoky). After training with these standards, the performance of the panel was assessed for each sensory attribute separately by adding these different odors in real Marselan wine samples. It showed that there was a significant difference in the sample effect, and there were no significant differences in the sample–panelist effect and the sample–session effect. That was to say, the panel had good performance in attribute discrimination and the agreement between panelists, as well as repeatability.

3.8. Descriptive Analysis

With higher FD values than the 2015 wine sample (Table 1), the 2014 wine sample was chosen to be evaluated by aroma descriptive analysis, and then further verified by aroma reconstitution. The wine (15 mL) was poured into a glass vessel (45 mL) and analyzed by scoring the intensity of each attribute on a seven-point scale (steps of 0.5) from 0 (not perceivable) to 3 (strongly perceivable). Samples were analyzed in triplicate, and during the session, the assessors evaluated these samples with a 5 min break after each sample in separated sensory booths according to the standards ISO 8589:2007 [51]. The aroma intensity for each attribute was averaged.

3.9. Aroma Reconstitution

The aroma compounds with FD ≥ 9 (Table 2) of wine were added into an odorless wine according to their occurring concentrations. Preparation of the odorless wine was as follows: the wine sample was extracted by the SPE method until the remaining solution was odorless, then through freeze-drying to obtain lyophilizate matrix. The lyophilizate matrix was dissolved by aqueous solutions containing 13.5% of alcohol, and pH was adjusted to 3.5 by tartaric acid before the recombination. The panelists were asked to evaluate the intensity of seven attribute corresponding to the original wine was scored on a seven-point scale (steps of 0.5) from 0 (not perceivable) to 3 (strongly perceivable).

3.10. Aroma Omission Tests

A total of 22 aroma omission models were performed to determine the contribution of certain compounds. Each model was compared with two complete reconstitution by a triangle test and three glass of sample was randomly labeled with numbers. The panelists (six females a four males) were asked to sniff the samples and then select the odd one.

3.11. Data Analysis

Quantification data was calculated as mean values with standard deviation from replicate determination (Microsoft Excel 2019, Redmond, WA, USA). The sensory data was analyzed through one-way analysis of variance (ANOVA) with SPSS 24.0 (SPSS Inc., Chicago, IL, USA).

4. Conclusions

This study preliminarily analyzed the aroma characteristics and the key odorants of Marselan wine. In addition, the qualitative and quantitative determination of key odorants was verified by a reconstitution experiment. A total of 43 odor-active compounds were detected by GC-O and 31 compounds with FD ≥9 were quantified by GC × GC-TOF-MS. The reconstitution experiment that compared the samples was recombined successfully through 21 aroma compounds with OAV > 1. The omission test revealed that ethyl 2-methylpropanoate, ethyl 2-methylbutyrate, ethyl isovalerate, 2,3-butanedione, 1-octen-3-one, 3-isobutyl-2-methoxypyrazine, β-damascenone, guaiacol, β-ionone, and furaneol® were important to the overall aroma. However, the non-volatile components of the wine matrix may interact with the aroma compounds; as a result, the volatility of the aroma compounds could be influenced. For further research, it is essential to investigate the interaction of the non-volatile components and aroma compounds on the molecular level to better understand the perception of the aroma in wine.

Author Contributions

K.T. and Y.N.; methodology, J.L.; software, J.L.; validation, J.L., Y.M. and K.T.; formal analysis, Y.X.; investigation, K.T.; resources, K.T.; data curation, J.L.; writing—original draft preparation, J.H.; writing—review and editing, J.L.; visualization, K.T.; supervision, K.T.; project administration, Y.X.; funding acquisition, Y.X.

Funding

This work was supported by the National Key R&D Program (2016YFD0400504), and National First-class Discipline Program of Light Industry Technology and Engineering (LITE 2018-12) and Postgraduate Research & Practice Innovation Program of Jiangsu Provence (KYCX18_1800).

Conflicts of Interest

The authors declare no conflict of interest.

References

  1. Alcalde-Eon, C.; Boido, E.; Carrau, F.; Dellacassa, E.; Rivas-Gonzalo, J.C. Pigment profiles in monovarietal wines produced in Uruguay. Am. J. Enol. Vitic. 2006, 57, 449–459. [Google Scholar]
  2. Robinson, J.; Harding, J.; Vouillamoz, J. Wine Grapes: A Complete Guide to 1368 Vine Varieties, Including Their Origins and Flavours; Penguin: London, UK, 2013; pp. 601–602. [Google Scholar]
  3. Dos Santos, C.E.; Debastiani, R.; Souza, V.S.; Peretti, D.E.; Jobim, P.F.; Yoneama, M.L.; Dias, J.F. The influence of the winemaking process on the elemental composition of the Marselan red wine. J. Sci. Food Agric. 2019, 99, 4642–4650. [Google Scholar] [CrossRef] [PubMed]
  4. Jiao, L.; Ouyang, S. The Chinese Wine Industry. In The Palgrave Handbook of Wine Industry Economics; Palgrave Macmillan: Cham, Switzerland, 2019; pp. 225–246. [Google Scholar]
  5. Ma, H. Cool climate wine production in China. Wine Vitic. J. 2017, 32, 23–25. [Google Scholar]
  6. Favre, G.; Hermosin-Gutierrez, I.; Piccardo, D.; Gomez-Alonso, S.; Gonzalez-Neves, G. Selectivity of pigments extraction from grapes and their partial retention in the pomace during red-winemaking. Food Chem. 2019, 277, 391–397. [Google Scholar] [CrossRef] [PubMed]
  7. Miele, A.; Rizzon, L.A.; Zanus, M.C. Discrimination of Brazilian red wines according to the viticultural region, varietal, and winery origin. Food Sci. Technol. 2010, 30, 268–275. [Google Scholar] [CrossRef]
  8. Ferreira, V.; Ortín, N.; Escudero, A.; López, R.; Cacho, J. Chemical characterization of the aroma of Grenache rose wines: Aroma extract dilution analysis, quantitative determination, and sensory reconstitution studies. J. Agric. Food Chem. 2002, 50, 4048–4054. [Google Scholar] [CrossRef] [PubMed]
  9. Kotseridis, Y.; Baumes, R. Identification of impact odorants in Bordeaux red grape juice, in the commercial yeast used for its fermentation, and in the produced wine. J. Agric. Food Chem. 2000, 48, 400–406. [Google Scholar] [CrossRef]
  10. Gürbüz, O.; Rouseff, J.M.; Rouseff, R.L. Comparison of aroma volatiles in commercial Merlot and Cabernet Sauvignon wines using gas chromatography-olfactometry and gas chromatography- mass spectrometry. J. Agric. Food Chem. 2006, 54, 3990–3996. [Google Scholar] [CrossRef]
  11. Falcão, L.D.; de Revel, G.; Perello, M.C.; Moutsiou, A.; Zanus, M.C.; Bordignon-Luiz, M.T. A survey of seasonal temperatures and vineyard altitude influences on 2-methoxy-3-isobutylpyrazine, C13-norisoprenoids, and the sensory profile of Brazilian Cabernet Sauvignon wines. J. Agric. Food Chem. 2007, 55, 3605–3612. [Google Scholar] [CrossRef]
  12. Sun, Q.; Gates, M.J.; Lavin, E.H.; Acree, T.E.; Sacks, G.L. Comparison of odor-active compounds in grapes and wines from vitis vinifera and non-foxy American grape species. J. Agric. Food Chem. 2011, 59, 10657–10664. [Google Scholar] [CrossRef]
  13. Chisholm, M.G.; Guiher, L.A.; Vonah, T.M.; Beaumont, J.L. Comparison of some French-American hybrid wines with White Riesling using gas chromatography-olfactometry. Am. J. Enol. Vitic. 1994, 45, 201–212. [Google Scholar]
  14. Miele, A.; Rizzon, L.A. Discrimination of Brazilian red varietal wines according to their sensory descriptors. Cienc. Agrotec. 2011, 35, 1172–1176. [Google Scholar] [CrossRef]
  15. Ostapenko, V.; Tkachenko, O.; Iukuridze, E. Sensory and chemical attributes of dessert wines made by different freezing methods of Marselan grapes. UK Food J. 2017, 6, 278–290. [Google Scholar] [CrossRef]
  16. Schieberle, P.; Hofmann, T. Mapping the combinatorial code of food flavors by means of molecular sensory science approach. In Food Flavors; CRC Press: Boca Raton, FL, USA, 2011; pp. 413–438. [Google Scholar]
  17. Frank, S.; Wollmann, N.; Schieberle, P.; Hofmann, T. Reconstitution of the flavor signature of Dornfelder red wine on the basis of the natural concentrations of its key aroma and taste compounds. J. Agric. Food Chem. 2011, 59, 8866–8874. [Google Scholar] [CrossRef] [PubMed]
  18. Mayr, C.M.; Geue, J.P.; Holt, H.E.; Pearson, W.P.; Jeffery, D.W.; Francis, I.L. Characterization of the key aroma compounds in Shiraz wine by quantitation, aroma reconstitution, and omission studies. J. Agric. Food Chem. 2014, 62, 4528–4536. [Google Scholar] [CrossRef] [PubMed]
  19. Escudero, A.; Gogorza, B.; Melús, M.A.; Ortín, N.; Cacho, J.; Ferreira, V. Characterization of the aroma of a wine from maccabeo. Key role played by compounds with low odor activity values. J. Agric. Food Chem. 2004, 52, 3516. [Google Scholar]
  20. Hofmann, T.; Krautwurst, D.; Schieberle, P. Current status and future perspectives in flavor research: Highlights of the 11th Wartburg Symposium on Flavor Chemistry & Biology. J. Agric. Food Chem. 2018, 66, 2197–2203. [Google Scholar]
  21. Dunkel, A.; Steinhaus, M.; Kotthoff, M.; Nowak, B.; Krautwurst, D.; Schieberle, P.; Hofmann, T. Nature’s chemical signatures in human olfaction: A foodborne perspective for future biotechnology. Angew. Chem. Int. Ed. 2014, 53, 7124–7143. [Google Scholar] [CrossRef]
  22. Cordero, C.; Kiefl, J.; Schieberle, P.; Reichenbach, S.E.; Bicchi, C. Comprehensive two-dimensional gas chromatography and food sensory properties: Potential and challenges. Anal. Bioanal. Chem. 2015, 407, 169–191. [Google Scholar] [CrossRef]
  23. Lubes, G.; Goodarzi, M. Analysis of volatile compounds by advanced analytical techniques and multivariate chemometrics. Chem. Rev. 2017, 117, 6399–6422. [Google Scholar] [CrossRef]
  24. Kiefl, J.; Pollner, G.; Schieberle, P. Sensomics analysis of key hazelnut odorants (Corylus avellana L. “Tonda Gentile”) using comprehensive two-dimensional gas chromatography in combination with time-of-flight mass spectrometry (GC×GC-TOF-MS). J. Agric. Food Chem. 2013, 61, 5226–5235. [Google Scholar] [CrossRef] [PubMed]
  25. Kiefl, J.; Schieberle, P. Evaluation of process parameters governing the aroma generation in three hazelnut cultivars (Corylus avellana L.) by correlating quantitative key odorant profiling with sensory evaluation. J. Agric. Food Chem. 2013, 61, 5236–5244. [Google Scholar] [CrossRef] [PubMed]
  26. Nicolotti, L.; Mall, V.; Schieberle, P. Characterization of key aroma compounds in a commercial rum and an Australian red wine by means of a new sensomics based Expert System (SEBES)-an approach to use artificial intelligence in determining food odor codes. J. Agric. Food Chem. 2019, 67, 4011–4022. [Google Scholar] [CrossRef] [PubMed]
  27. Grosch, W. Detection of potent odorants in foods by aroma extract dilution analysis. Trends Food Sci. Technol. 1993, 4, 68–73. [Google Scholar] [CrossRef]
  28. López, R.; Ortín, N.; Pérez-Trujillo, J.P.; Cacho, J.; Ferreira, V. Impact odorants of different young white wines from the Canary Islands. J. Agric. Food Chem. 2003, 51, 3419–3425. [Google Scholar] [CrossRef] [PubMed]
  29. Ma, Y.; Tang, K.; Xu, Y.; Li, J.M. Characterization of the key aroma compounds in Chinese Vidal icewine by gas chromatography-olfactometry, quantitative measurements, aroma recombination, and omission tests. J. Agric. Food Chem. 2017, 65, 394–401. [Google Scholar] [CrossRef]
  30. Zhao, P.; Qian, Y.; He, F.; Li, H.; Qian, M. Comparative characterization of aroma compounds in merlot wine by LiChrolut-EN-Based aroma extract dilution analysis and odor activity value. Chemosens. Percept. 2017, 10, 149–160. [Google Scholar] [CrossRef]
  31. Francis, I.; Newton, J. Determining wine aroma from compositional data. Aust. J. Grape Wine Res. 2005, 11, 114–126. [Google Scholar] [CrossRef]
  32. López-Vázquez, C.; Orriols, I.; Perelló, M.-C.; de Revel, G. Determination of aldehydes as pentafluorobenzyl derivatives in grape pomace distillates by HS-SPME-GC/MS. Food Chem. 2012, 130, 1127–1133. [Google Scholar] [CrossRef]
  33. Robinson, A.L.; Boss, P.K.; Solomon, P.S.; Trengove, R.D.; Heymann, H.; Ebeler, S.E. Origins of grape and wine aroma. Part 1. Chemical components and viticultural impacts. Am. J. Enol. Vitic. 2013, 65, 1–24. [Google Scholar]
  34. Bell, S.J.; Henschke, P.A. Implications of nitrogen nutrition for grapes, fermentation and wine. Aust. J. Grape Wine Res. 2005, 11, 242–295. [Google Scholar] [CrossRef]
  35. Lytra, G.; Tempere, S.; Le Floch, A.; de Revel, G.; Barbe, J.C. Study of sensory interactions among red wine fruity esters in a model solution. J. Agric. Food Chem. 2013, 61, 8504–8513. [Google Scholar] [CrossRef] [PubMed]
  36. Sala, C.; Mestres, M.; Martí, M.P.; Busto, O.; Guasch, J. Headspace solid-phase microextraction method for determining 3-alkyl-2-methoxypyrazines in musts by means of polydimethylsiloxane–divinylbenzene fibres. J. Chromatogr. A 2000, 880, 93–99. [Google Scholar] [CrossRef]
  37. Sala, C.; Busto, O.; Guasch, J.; Zamora, F. Influence of vine training and sunlight exposure on the 3-alkyl-2-methoxypyrazines content in musts and wines from the vitis vinifera variety Cabernet Sauvignon. J. Agric. Food Chem. 2004, 52, 3492–3497. [Google Scholar] [CrossRef] [PubMed]
  38. Sasaki, K.; Takase, H.; Tanzawa, F.; Kobayashi, H.; Saito, H.; Matsuo, H.; Takata, R. Identification of furaneol glucopyranoside, the precursor of strawberry-like aroma, furaneol, in Muscat Bailey A. Am. J. Enol. Vitic. 2015, 66, 91–94. [Google Scholar] [CrossRef]
  39. Saenz-Navajas, M.P.; Campo, E.; Cullere, L.; Fernandez-Zurbano, P.; Valentin, D.; Ferreira, V. Effects of the nonvolatile matrix on the aroma perception of wine. J. Agric. Food Chem. 2010, 58, 5574–5585. [Google Scholar] [CrossRef]
  40. Ryan, D.; Prenzler, P.D.; Saliba, A.J.; Scollary, G.R. The significance of low impact odorants in global odour perception. Trends Food Sci. Technol. 2008, 19, 383–389. [Google Scholar] [CrossRef]
  41. Guth, H. Quantitation and sensory studies of character impact odorants of different white wine varieties. J. Agric. Food Chem. 1997, 45, 3027–3032. [Google Scholar] [CrossRef]
  42. Veronika, G.; Peter, S. Characterization of the key aroma compounds in apricots (Prunus armeniaca) by application of the molecular sensory science concept. J. Agric. Food Chem. 2007, 55, 5221–5228. [Google Scholar]
  43. Chetschik, I.; Granvogl, M.; Schieberle, P. Comparison of the key aroma compounds in organically grown, raw west-african peanuts (Arachis hypogaea) and in ground, pan-roasted meal produced thereof. J. Agric. Food Chem. 2008, 56, 10237–10243. [Google Scholar] [CrossRef]
  44. Fazzalari, F. Compilation of Odor and Taste Threshold Values Data; ASTM data series DS 48A; ASTM: Philadelphia, PA, USA, 1978. [Google Scholar]
  45. Escudero, A.; Hernándezorte, P.; Cacho, J.; Ferreira, V. Clues about the role of methional as character impact odorant of some oxidized wines. J. Agric. Food Chem. 2000, 48, 4268–4272. [Google Scholar] [CrossRef] [PubMed]
  46. Isogai, A.; Utsunomiya, H.; Ryoko Kanda, A.; Iwata, H. Changes in the aroma compounds of Sake during aging. J. Agric. Food Chem. 2005, 53, 4118–4123. [Google Scholar] [CrossRef] [PubMed]
  47. Ferreira, V.; López, R.; Cacho, J.F. Quantitative determination of the odorants of young red wines from different grape varieties. J. Sci. Food Agric. 2000, 80, 1659–1667. [Google Scholar] [CrossRef]
  48. Schirack, A.; Drake, M.; Sanders, T.; Sandeep, K. Characterization of aroma-active compounds in microwave blanched peanuts. J. Food Sci. 2006, 71, C513–C520. [Google Scholar] [CrossRef]
  49. Takeoka, G.R.; Flath, R.A.; Mon, T.R.; Teranishi, R.; Guentert, M. Volatile constituents of apricot (Prunus armeniaca). J. Agric. Food Chem. 1990, 38, 471–477. [Google Scholar] [CrossRef]
  50. Pino, J.A.; Mesa, J. Contribution of volatile compounds to mango (Mangifera indica L.) aroma. Flavour Frag. J. 2006, 21, 207–213. [Google Scholar] [CrossRef]
  51. ISO-8589:2007. Sensory Analysis. In General Guidance for the Design of Test Rooms; ISO: Geneva, Switzerland, 2007. [Google Scholar]
Sample Availability: Samples of the compounds are not available from the authors.
Figure 1. The quantitative compounds in a wine sample displayed using a two-dimensional gas chromatography and time-of-flight mass spectrometry (GC × GC-TOF-MS) contour plot. The size of the bubble represented the relative intensity of the compound’s quantitative ion response, and the minimum size of the bubble was set for clarity. The quantitative compounds were marked by bubbles and the bubbles with different colors represented different concentration ranges. Red bubbles: greater than 1000 μg/L, purple bubbles: between 10 and 1000 μg/L, yellow bubbles: less than 10 μg/L.
Molecules 24 02978 g001
Figure 2. Comparison of the main aroma attribute between Marselan wine and its recombinate wine.
Molecules 24 02978 g002
Table 1. Aroma compounds identified in Marselan wine by GC-O.
No.Compounds a Odor Description FDDB-FFAPHP-5
20142015LRI bRILRI cRI
1ethyl acetatepineapple33896907659648
2ethyl 2-methylpropanoate strawberry927956976760751
32,3-butanedionebutter729243967985593574
4ethyl butanoate banana812710181013744762
5ethyl 2-methylbutyrateapple27910501049826842
6ethyl isovalerateblueberry2438110681063839853
71-hexanalgrass3110881083780
82-methyl-1-propanolsolvent81910991086647626
9isoamyl acetatebanana 9311251116849862
101,4-cineole* pine 33116511641010
11methyl hexanoatefruity1311901193907
123-methyl-1-butanolsolvent 812712151206722730
13ethyl hexanoate apple3112381231971983
14γ-terpinene pine 331252123810601053
151-octen-3-onemushroom9913301308912947
162,6-dimethylpyrazineroasted nut3113381349847853
171-octen-3-olmushroom3314501443986976
181-heptanolfatty27914601451959971
193-methylthiopropanalbaked potato818114901473885909
(methional)
203-isobutyl-2-methoxypyrazine pepper27271517153311791181
21benzaldehydealmond9315201537960930
22linaloolfloral991550154210701102
23terpinen-4-olturpentine9811612160311641162
24β-cyclocitral green131622163012121182
25acetophenonealmond9 1645165010521065
263-methylbutanoic acidrancid24324316661664839827
273-methylthiopropanolpotato8181171517209871000
(methionol)
28citronellolrose7292431767176412121221
29ethyl laurateleaf931848184915971578
30phenethyl acetaterose7297291856182612291183
31β-damascenonehoney218721871859183113651397
32guaiacol smoky7292431875187311191090
33geraniol geranium27271893184313301306
34phenethyl alcoholflowery81271903191910991072
35β-iononeviolet27811953196414771470
365-butyldihydro-4-methyl-coconut27271968198712991310
2(3H)-furanone
(whiskey lactone)
373-hydroxy-2-methyl-caramel391998198510881077
4H-pyran-4-one
(maltol)
384-hydroxy-2,5-dimethyl-caramel7297292043204511151098
3(2H)-furanone
(furaneol®)
39γ-nonalactone prune332050205413621388
404-hydroxy-5-ethyl-2-methyl-caramel 243812091209311731170
3(2H)-furanone
(homofuraneol)
41δ-decalactone apricot312176219515731578
42eugenolclove7292432198218013521333
432-methoxy-4-vinylphenolsmoky7292432213221612981300
a The odorants were identified by comparing their retention indices (RIs), mass spectra, and aroma attributes with those of pure standards (except for compounds marked with ‘*’) b,c The RI in literature. FD: flavor dilution.
Table 2. Quantitative data odor thresholds and odor activity values (OAVs) of aroma compounds in Marselan wine.
No.CompoundThresholds (μg/L) aConcentration (μg/L) bRSD cOAV
1ethyl 2-methylpropanoate 15.0 [39] 1847.6 5.0 123.2
22,3-butanedione100.0 [39]1909.2 8.9 19.1
3ethyl butanoate 20.0 [39] 400.8 2.7 20.0
4ethyl 2-methylbutyrate1.0 [39] 186.7 0.8 186.7
5ethyl isovalerate3.0 [39] 56.8 2.3 18.9
62-methyl-1-propanol40,000.0 [39] 10,999.4 1.2 <1.0
7isoamyl acetate30.0 [39] 1667.2 7.8 55.6
83-methyl-1-butanol30,000.0 [39] 382,940.8 1.2 12.8
91-octen-3-one0.04 [40] 4.2 1.1 105.7
101-heptanol3.0 [41] 20.5 8.4 6.8
113-methylthiopropionaldehyde0.5 [42] 5.1 7.3 10.2
123-isobutyl-2-methoxypyrazine0.002 [43] 0.026.7 10.0
13benzaldehyde990.0 [44] 77.3 0.4 <1.0
14linalool15.0 [39]4.4 8.3 <1.0
15terpinen-4-ol250.0 [45]3.6 6.6 <1.0
16acetophenone200.0 [46] 51.7 0.2 0.3
173-methylbutanoic acid33.0 [45] 465.2 0.2 14.1
183-methylthiopropanol1000.0 [45]1514.2 4.1 1.5
19citronellol40 [47]4.8 1.2 <1.0
20ethyl laurate5900.0 [48] 37.1 0.6 <1.0
21phenethyl acetate250.0 [39] 114.7 2.0 <1.0
22β-damascenone0.05 [39] 40.6 4.5 812
23guaiacol 9.5 [39]51.1 8.9 5.4
24geraniol 30.0 [39]12.2 6.2 <1.0
25phenethyl alcohol10,000.0 [41]30,823.2 1.6 3.1
26β-ionone0.1 [45] 0.1 6.4 1.2
275-butyldihydro-4-methyl-67.0 [45]1.9 3.2 <1.0
2(3H)-furanone (whiskey lactone)
284-hydroxy-2,5-dimethyl- 5.0 [8]105.9 2.6 21.2
3(2H)-furanone (furaneol®)
294-hydroxy-5-ethyl-2-methyl-125.0 [8]408.3 8.5 3.3
3(2H)-furanone (homofuraneol)
30eugenol6.0 [45]17.0 8.9 2.8
312-methoxy-4-vinylphenol1100.0 [39] 125.8 7.0 <1.0
a Thresholds were taken from the references. In ethanol-water solution except for refs [42,43,45,48,49] in water. b Average concentration of triplicates. c RSD, relative standard deviation of the average concentration.
Table 3. Omission tests from complete recombination model.
No.CompoundCorrect Number in AllSignificance a
1all esters10/10***
2ethyl 2-methylpropanoate 8/10**
3ethyl butanoate 5/10
4ethyl 2-methylbutyrate8/10**
5ethyl isovalerate7/10*
6isoamyl acetate4/10
7ethyl butanoate, isoamyl acetate7/10*
82,3-butanedione7/10*
93-methyl-1-butanol5/10
101-octen-3-one7/10*
111-heptanol3/10
123-methylthiopropionaldehyde5/10
133-isobutyl-2-methoxypyrazine9/10***
143-methylbutanoic acid6/10
153-methylthiopropanol3/10
16β-damascenone9/10***
17guaiacol 7/10*
18phenethyl alcohol
19β-ionone7/10*
204-hydroxy-2,5-dimethyl- 8/10**
3(2H)-furanone (furaneol®)
214-hydroxy-5-ethyl-2-methyl-3/10
3(2H)-furanone (homofuraneol)
22eugenol4/10
a “*”, “**”, and “***” indicate significance at p ≤ 0.05, 0.01, and 0.001, respectively.
Table 4. Validation data for the chemical standards, quantitative ions, and calibrated intervals using GC × GC-TOF-MS.
CompoundsISQuantitativeCalibration CurveRangeLODLOQRecovery
Ion (m/z)SlopeInterceptR2(μg/L)(μg/L)(μg/L)(%)
ethyl 2-methylpropanoate IS1710.115 −0.002 0.998 139.3–8915.40.664 2.213 108.7
2,3-butanedioneIS2430.049 −0.076 0.999 183.7–95,763.80.196 0.655 107.6
ethyl butanoate IS11160.240 0.08540.998 44.1–2824.00.236 0.788 106.6
ethyl 2-methylbutyrateIS11020.076 −0.064 0.997 44.4–2651.60.051 0.170 117.6
ethyl isovalerateIS1880.441 −0.075 0.998 16.4–1048.00.186 0.619 114.2
2-methyl-1-propanolIS2410.014 −0.052 0.997 1563.0–50,017.52.054 6.847 123.2
isoamyl acetateIS1870.140 0.347 0.998 32.2–2048.60.187 0.625 115.9
3-methyl-1-butanolIS1390.002 0.552 1.000 486.2–497,752.00.173 0.577 113.6
1-octen-3-oneIS1700.641 −0.023 1.000 1.4–90.10.065 0.218 85.4
1-heptanol IS2560.187 0.002 1.000 13.6–874.20.044 0.147 81.7
3-methylthiopropionaldehydeIS1480.151 −0.006 1.000 2.9–191.40.133 0.444 103.2
3-isobutyl-2-methoxypyrazine IS31240.455 0.120 0.999 0.01-0.20.001 0.004 89.7
benzaldehydeIS1510.460 −0.320 0.994 19.6–1252.00.060 0.199 83.9
linaloolIS21210.177 0.003 1.000 10.5–334.50.322 1.073 115.5
terpinen-4-olIS1710.433 −0.007 0.999 1.2–80.70.027 0.091 103.9
acetophenoneIS1770.459 −0.225 0.998 9.6–615.60.089 0.296 79.9
3-methylbutanoic acidIS2600.565 −2.408 0.993 85.3–4269.40.079 0.264 82.1
3-methylthiopropanolIS21060.026 0.019 0.999 48.7–3117.80.242 0.808 112.8
citronellolIS2690.130 −0.005 0.998 3.5–222.40.154 0.513 96.6
ethyl laurateIS11570.474 −0.126 1.000 11.2–715.00.010 0.033 89.4
phenethyl acetateIS41040.155 −0.037 0.997 8.8–563.20.536 1.787 101.3
β-damascenoneIS41210.060 −0.028 1.000 20.7–1386.90.428 1.427 104.8
guaiacol IS51240.080 −0.012 0.999 11.6–744.80.030 0.100 118.8
geraniol IS4410.445 −0.008 0.999 5.9–187.40.087 0.290 109.2
phenethyl alcoholIS41220.020 −1.375 1.000 829.1–849,017.00.360 1.200 92.9
β-iononeIS51770.181 −0.001 0.995 1.3–80.90.008 0.027 118.1
5-butyldihydro-4-methyl-IS4990.238 −0.087 0.999 1.4–88.10.008 0.026 124.6
2(3H)-furanone
(whiskey lactone)
4-hydroxy-2,5-dimethyl-IS41280.003 0.0010.996 27.6–884.40.663 2.209 96.4
3(2H)-furanone
(furaneol®)
4-hydroxy-5-ethyl-2-methyl-IS4570.012 0.0010.999 42.5–681.01.059 3.529 107.0
3(2H)-furanone
(homofuraneol)
eugenolIS51640.155 0.007 0.999 0.9–59.20.007 0.022 113.9
2-methoxy-4-vinylphenolIS51350.024 −0.085 0.997 11.8–755.00.133 0.444 89.1
a The internal standard (IS) used to quantitate the compounds: ethyl octanoate-d15 ( IS1, m/z = 187), 2-octanol ( IS2, m/z = 45), 2-isobutyl-3-methoxy-d3-pyrazine (IS3, m/z = 127 ), 2-phenylethyl acetate-d3 (IS4, m/z = 127 ), 2-methoxy-d3-phenol (IS5, m/z = 127).

