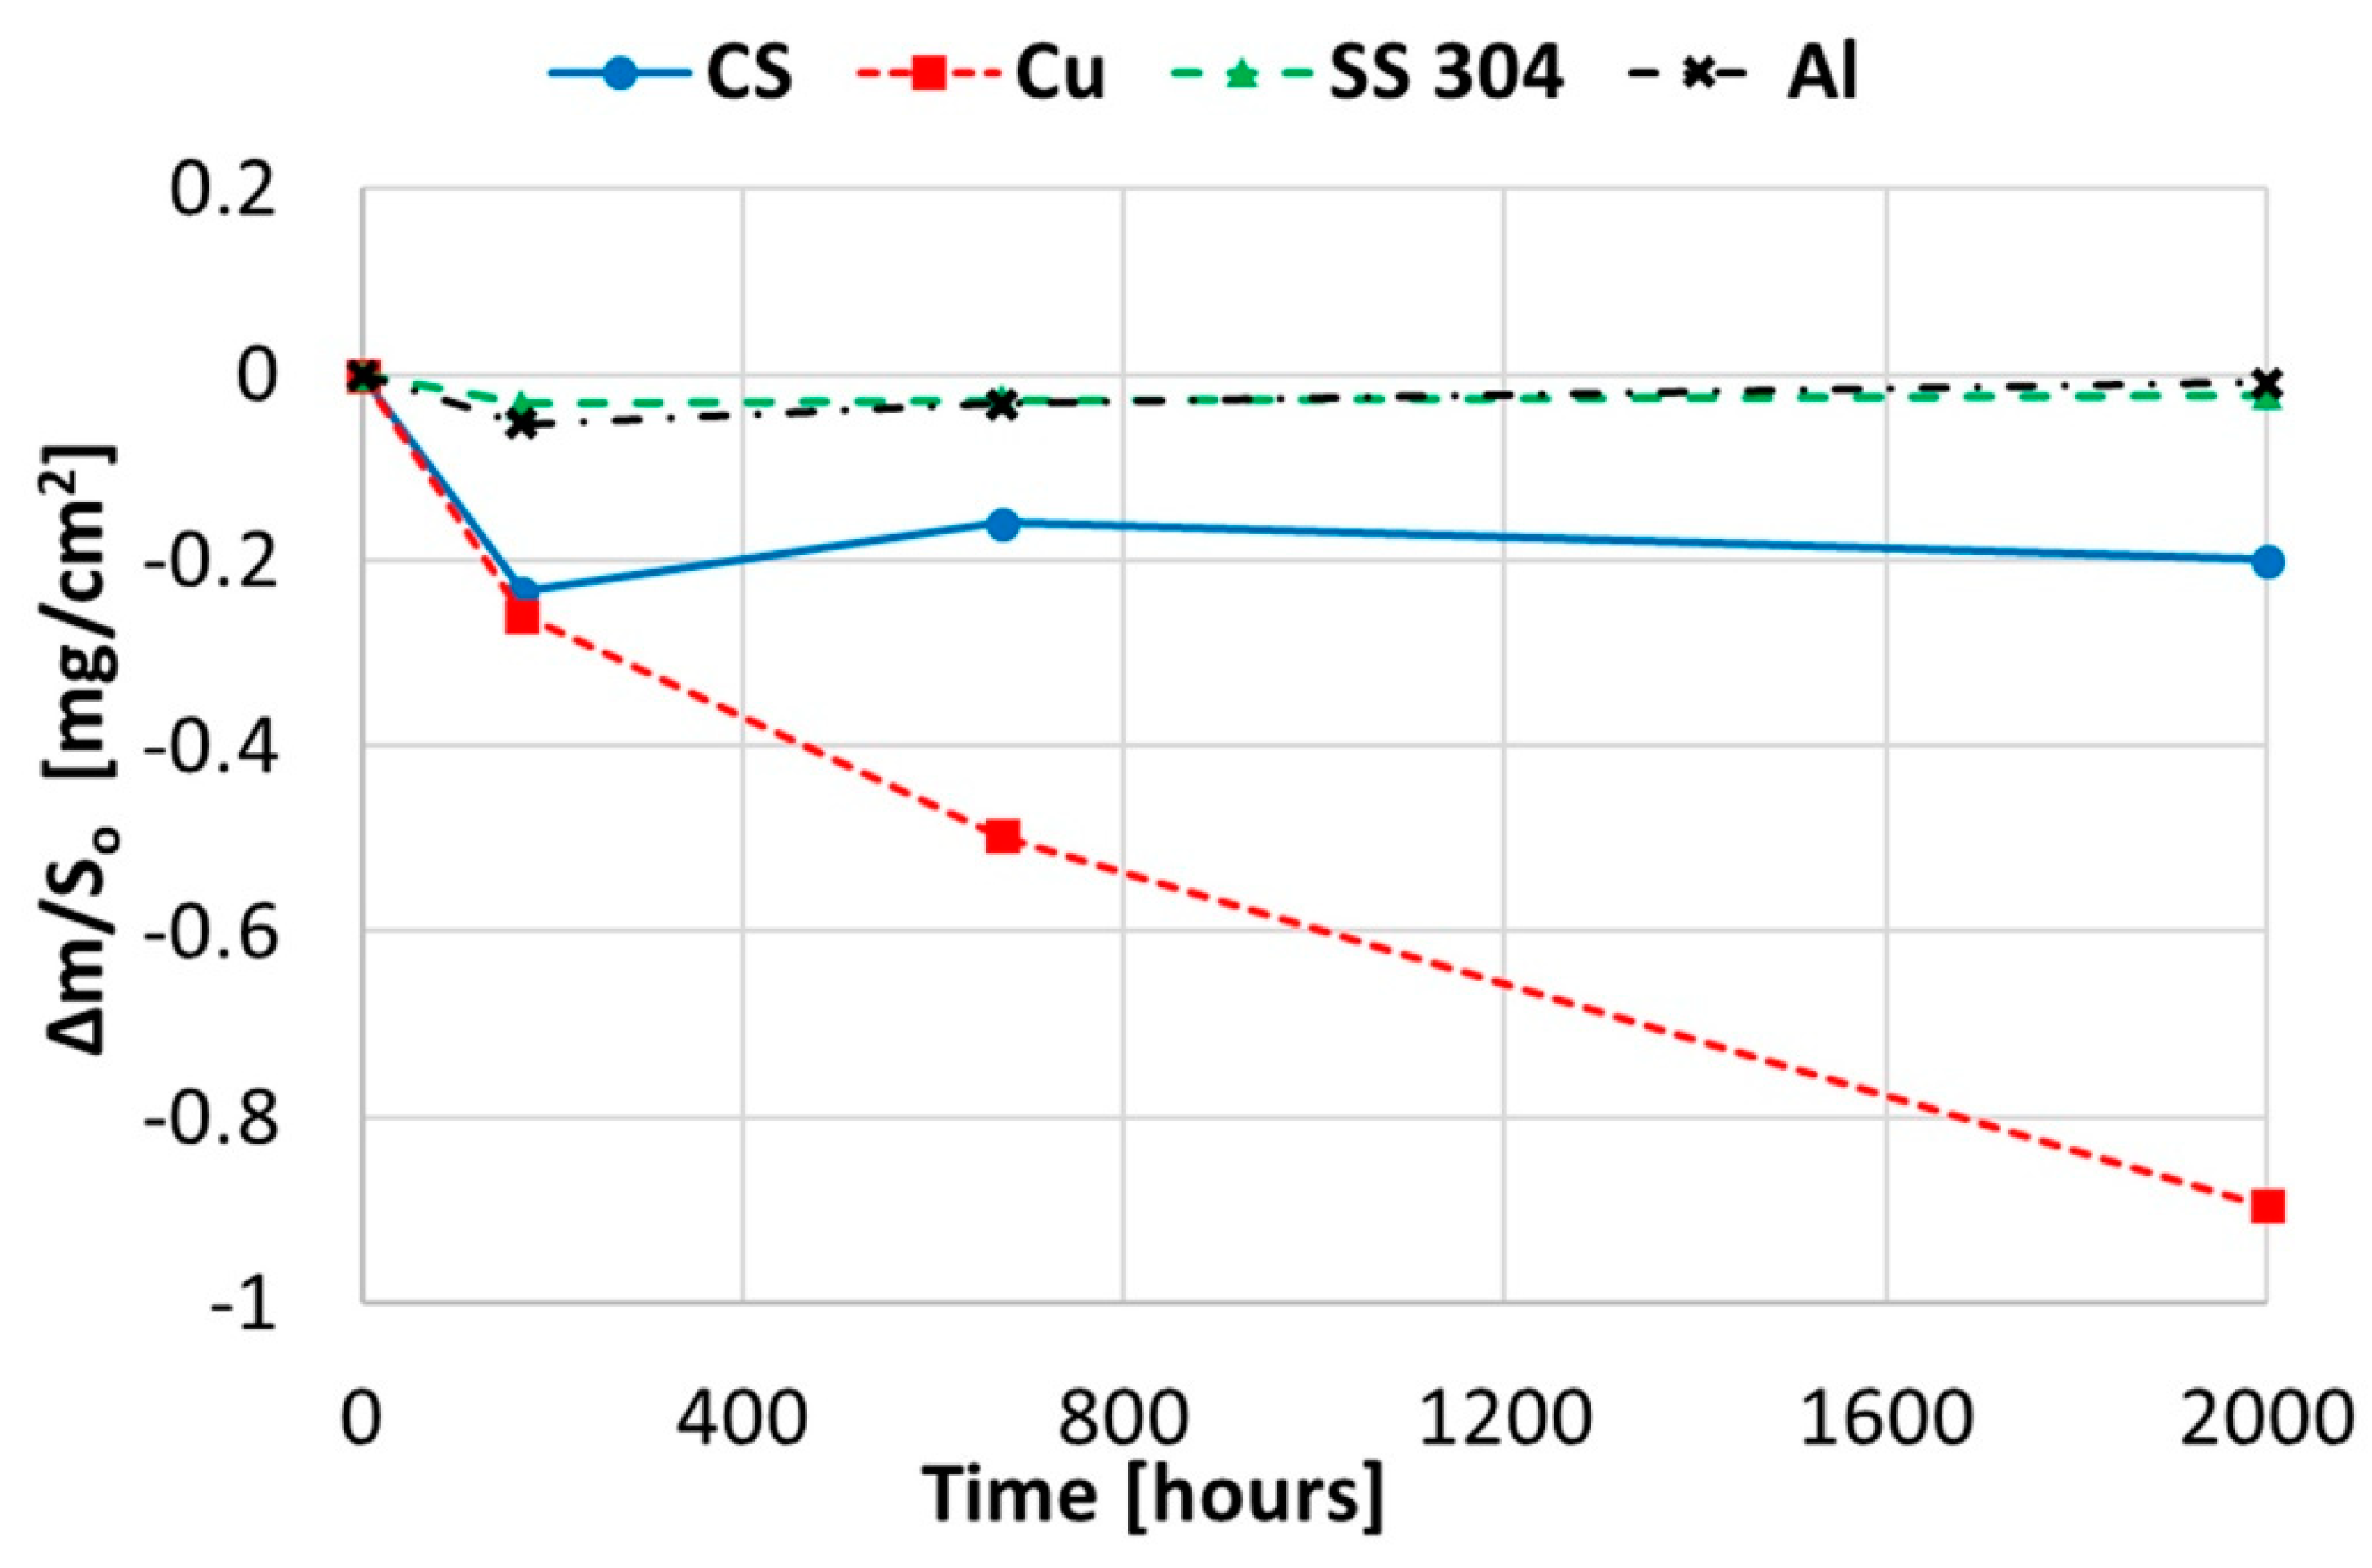
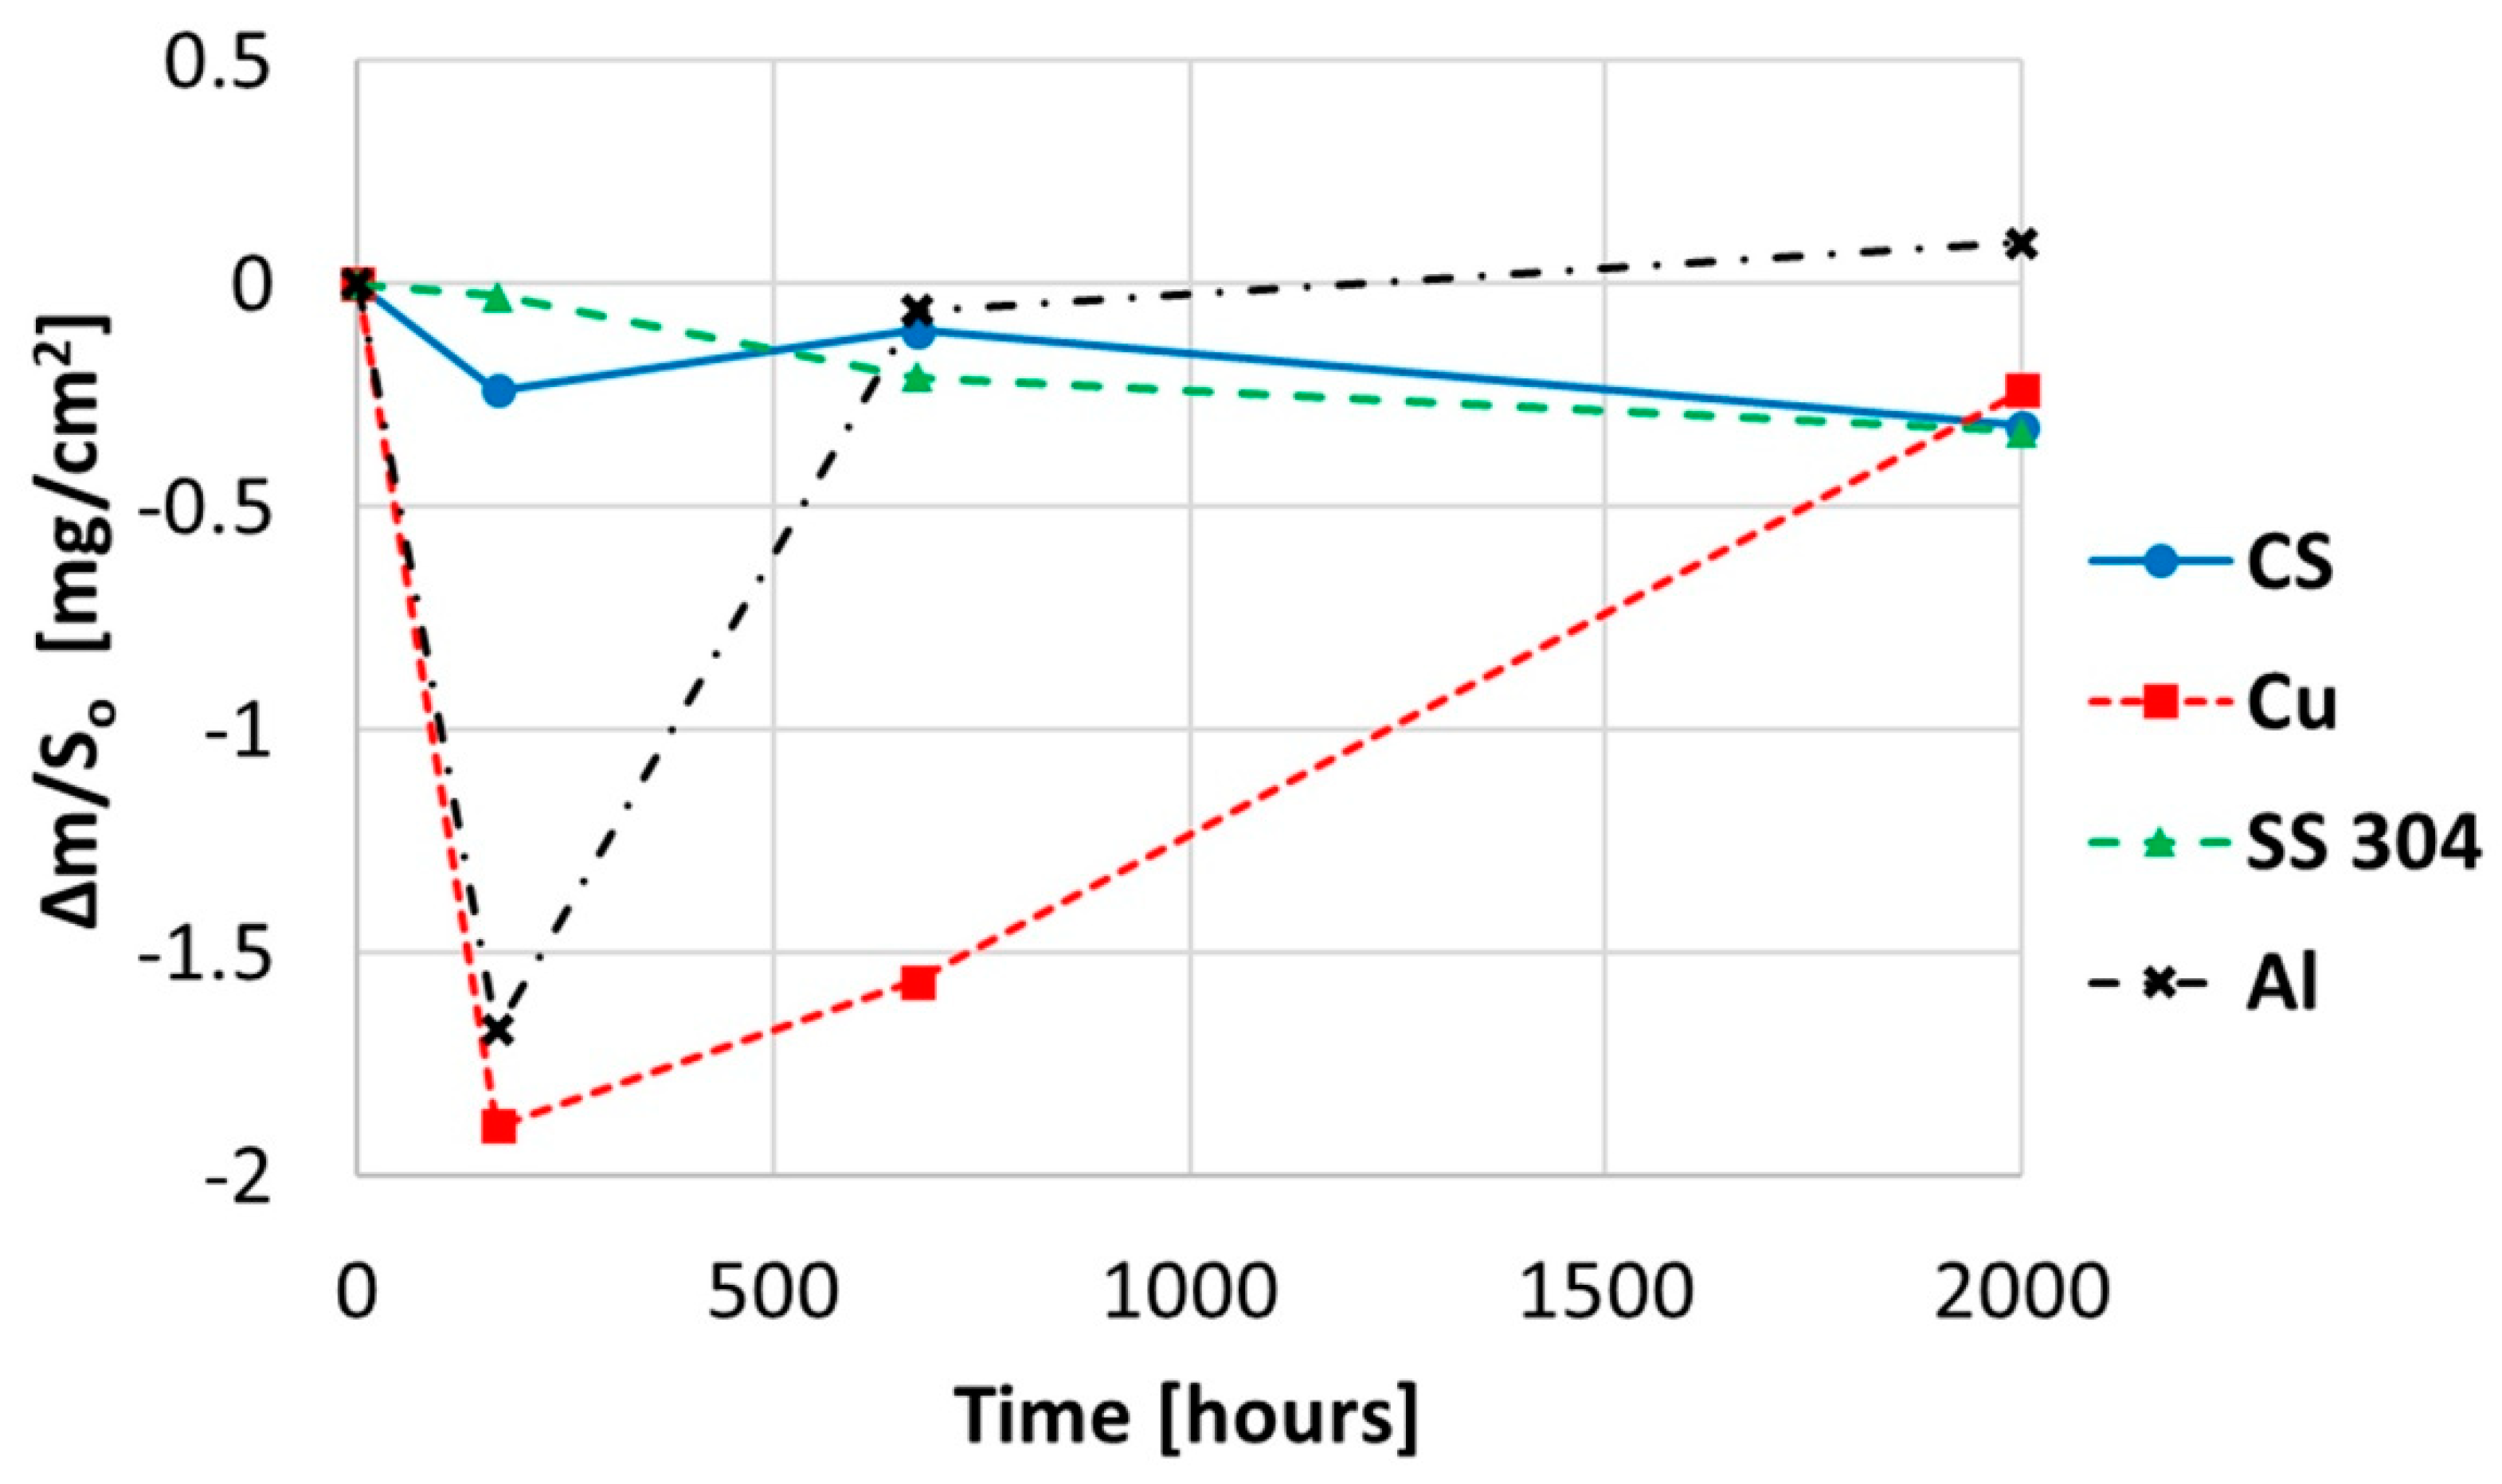
Figure 1.
Gravimetric weight loss curve obtained for copper, aluminium, and stainless and carbon steel in solar salt at 250 °C.
Figure 1.
Gravimetric weight loss curve obtained for copper, aluminium, and stainless and carbon steel in solar salt at 250 °C.
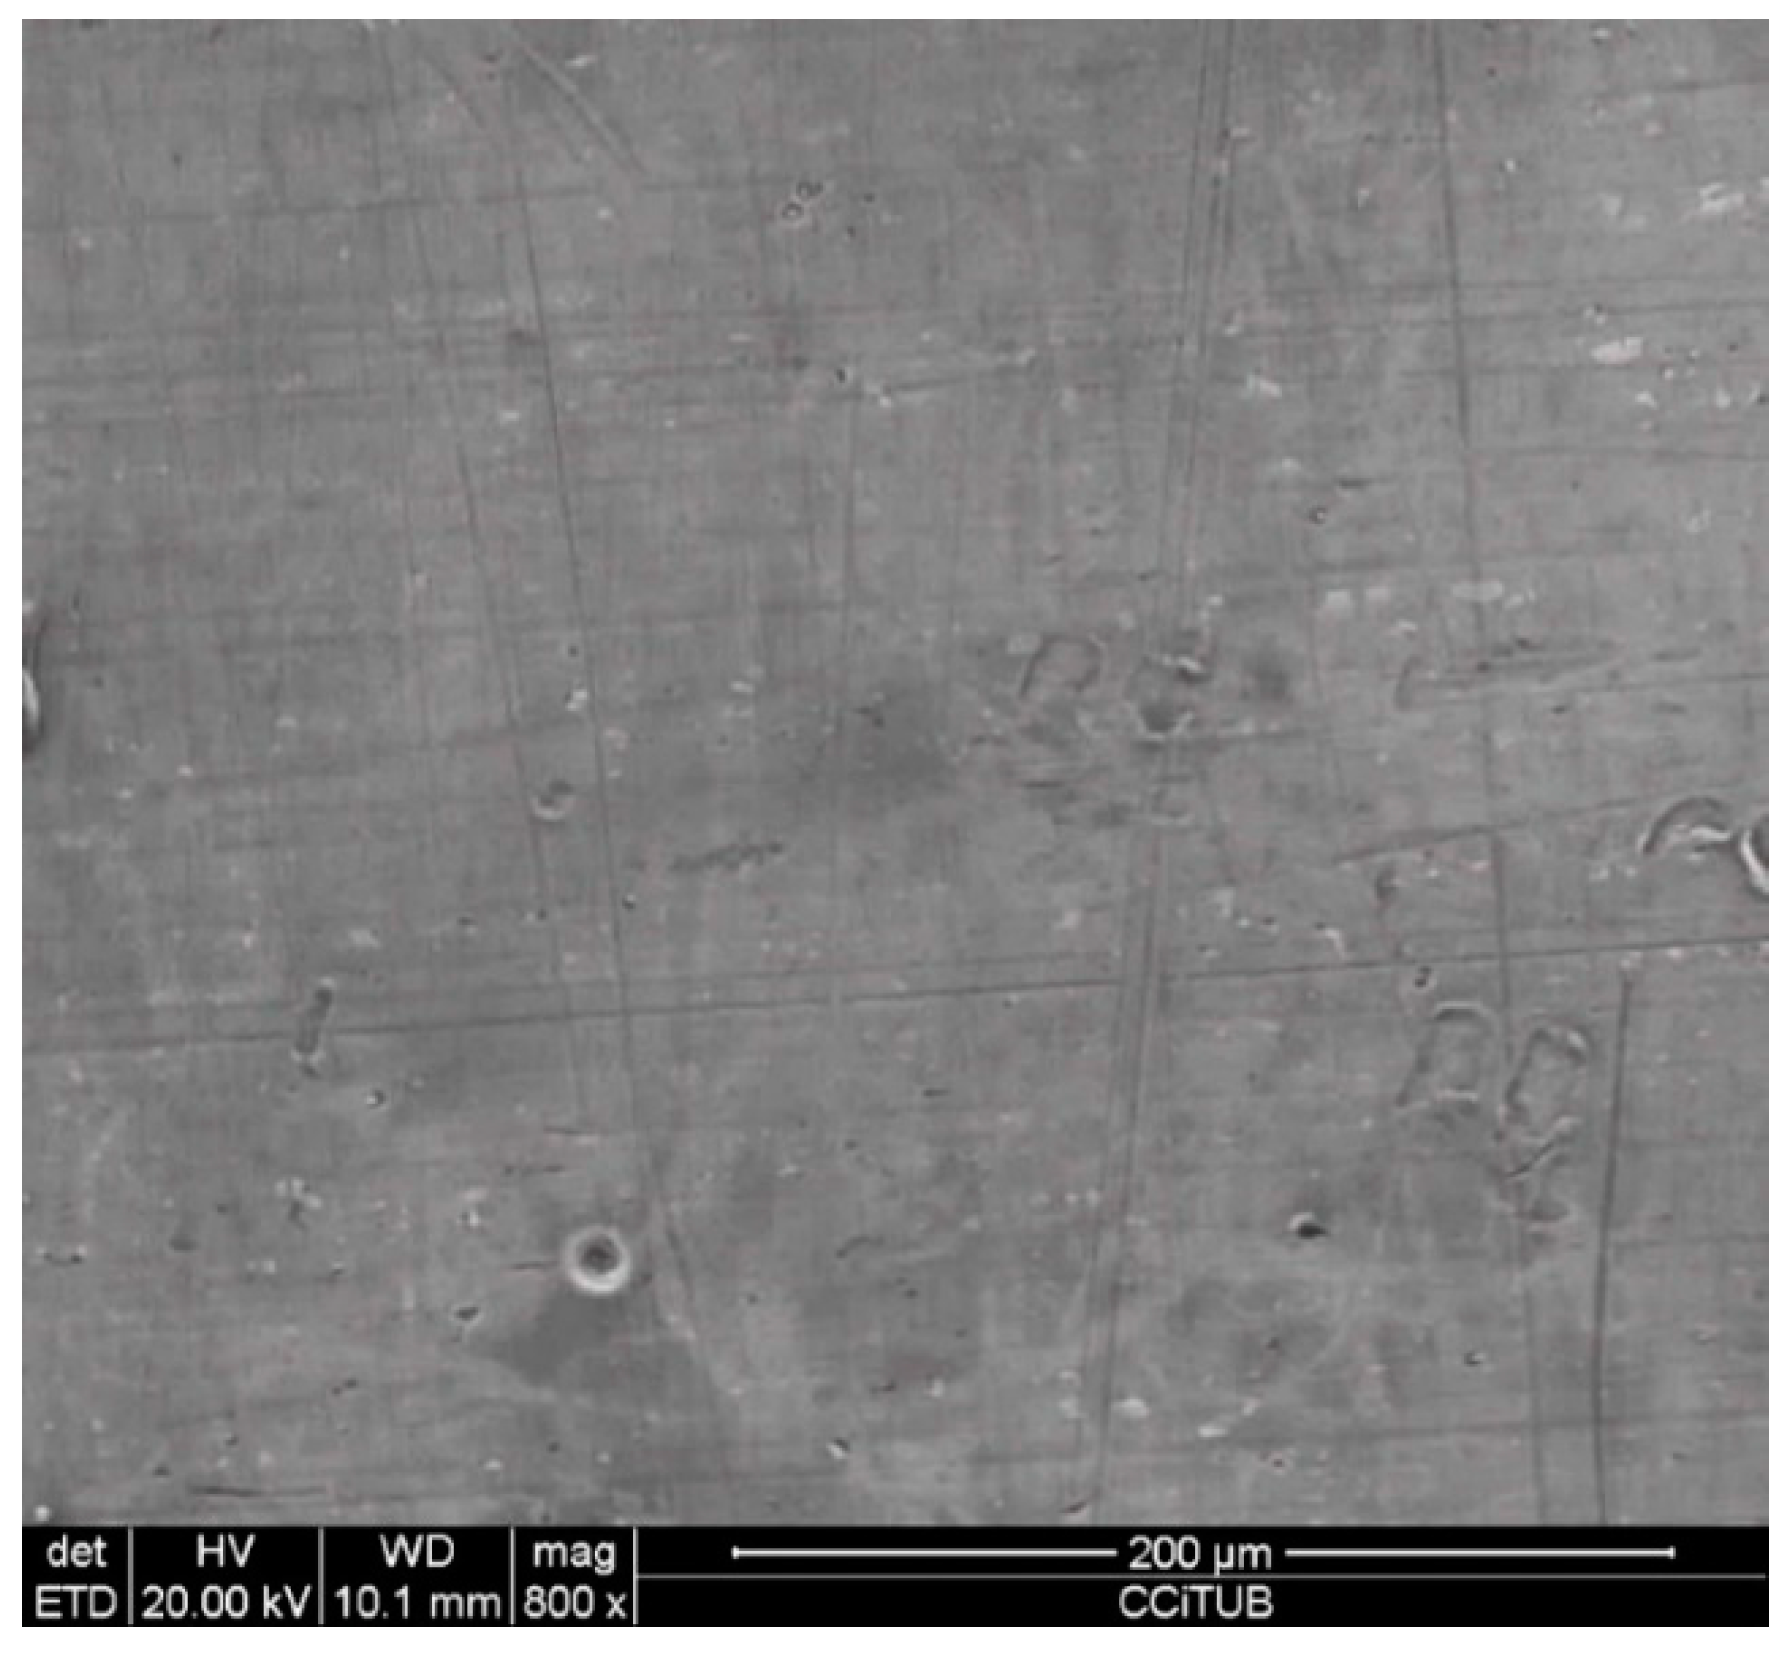
Figure 2.
Detail of the aluminium specimen surface after 2000 h immersed in solar salt.
Figure 2.
Detail of the aluminium specimen surface after 2000 h immersed in solar salt.
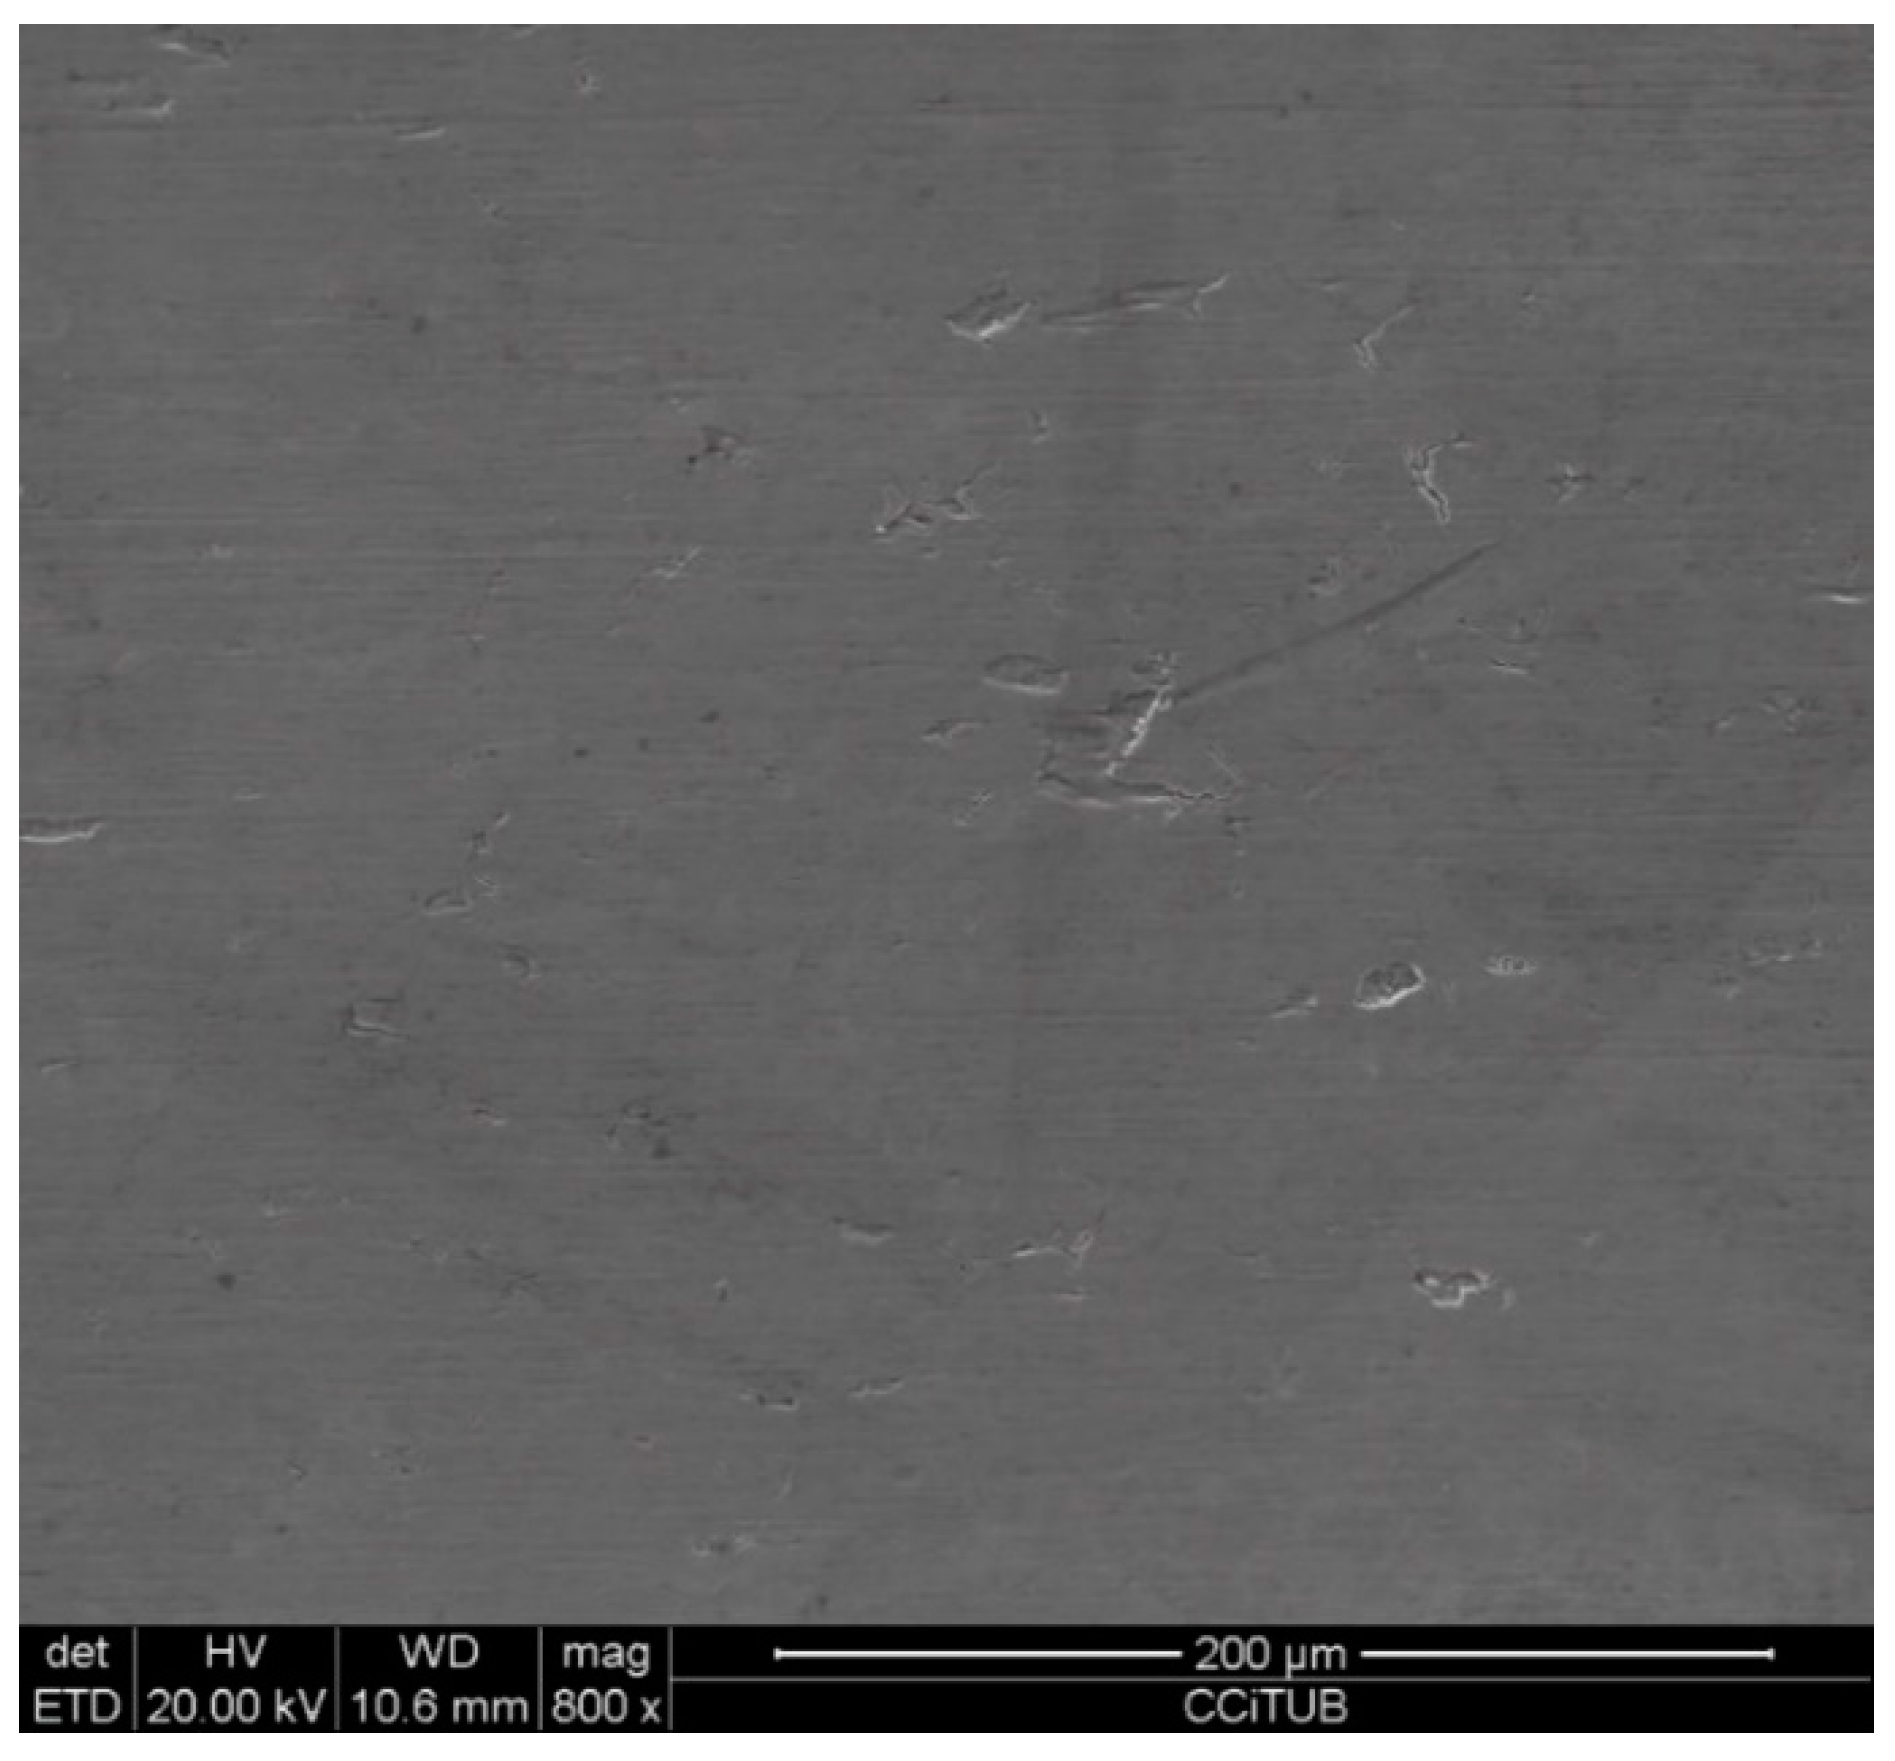
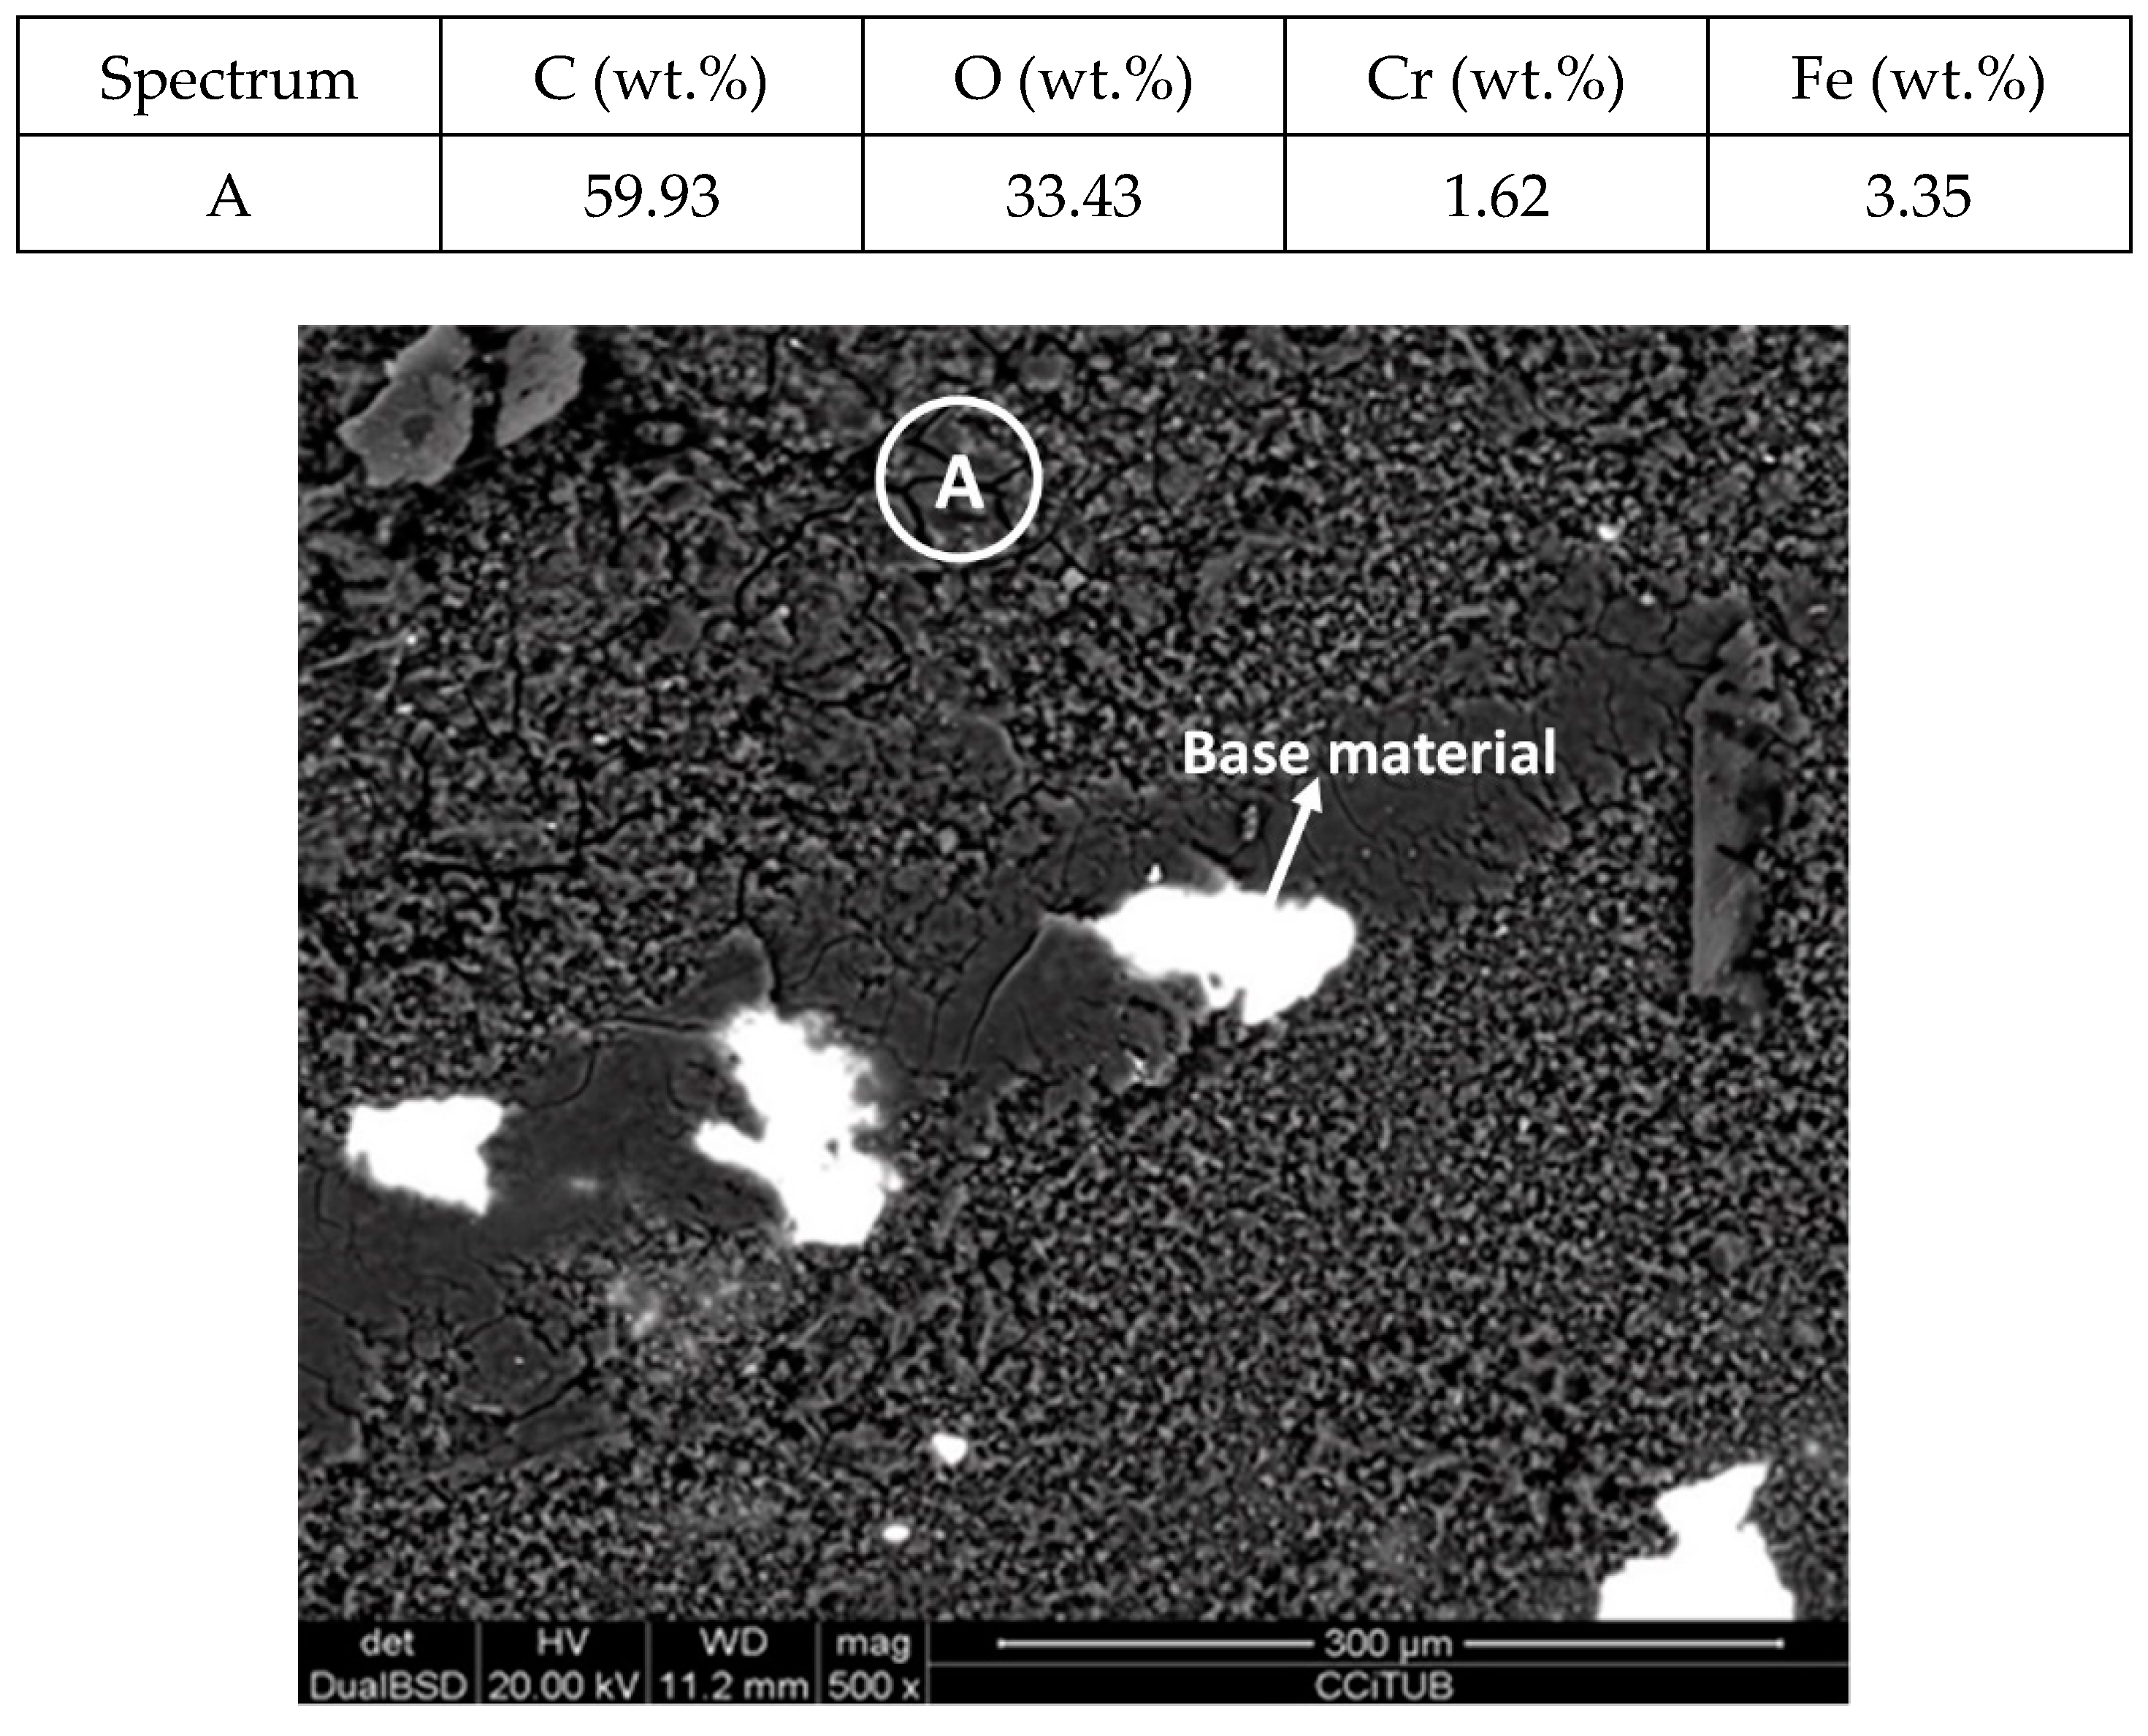
Figure 3.
Detail of the stainless steel SS304 specimen surface after 2000 h immersed in solar salt.
Figure 3.
Detail of the stainless steel SS304 specimen surface after 2000 h immersed in solar salt.
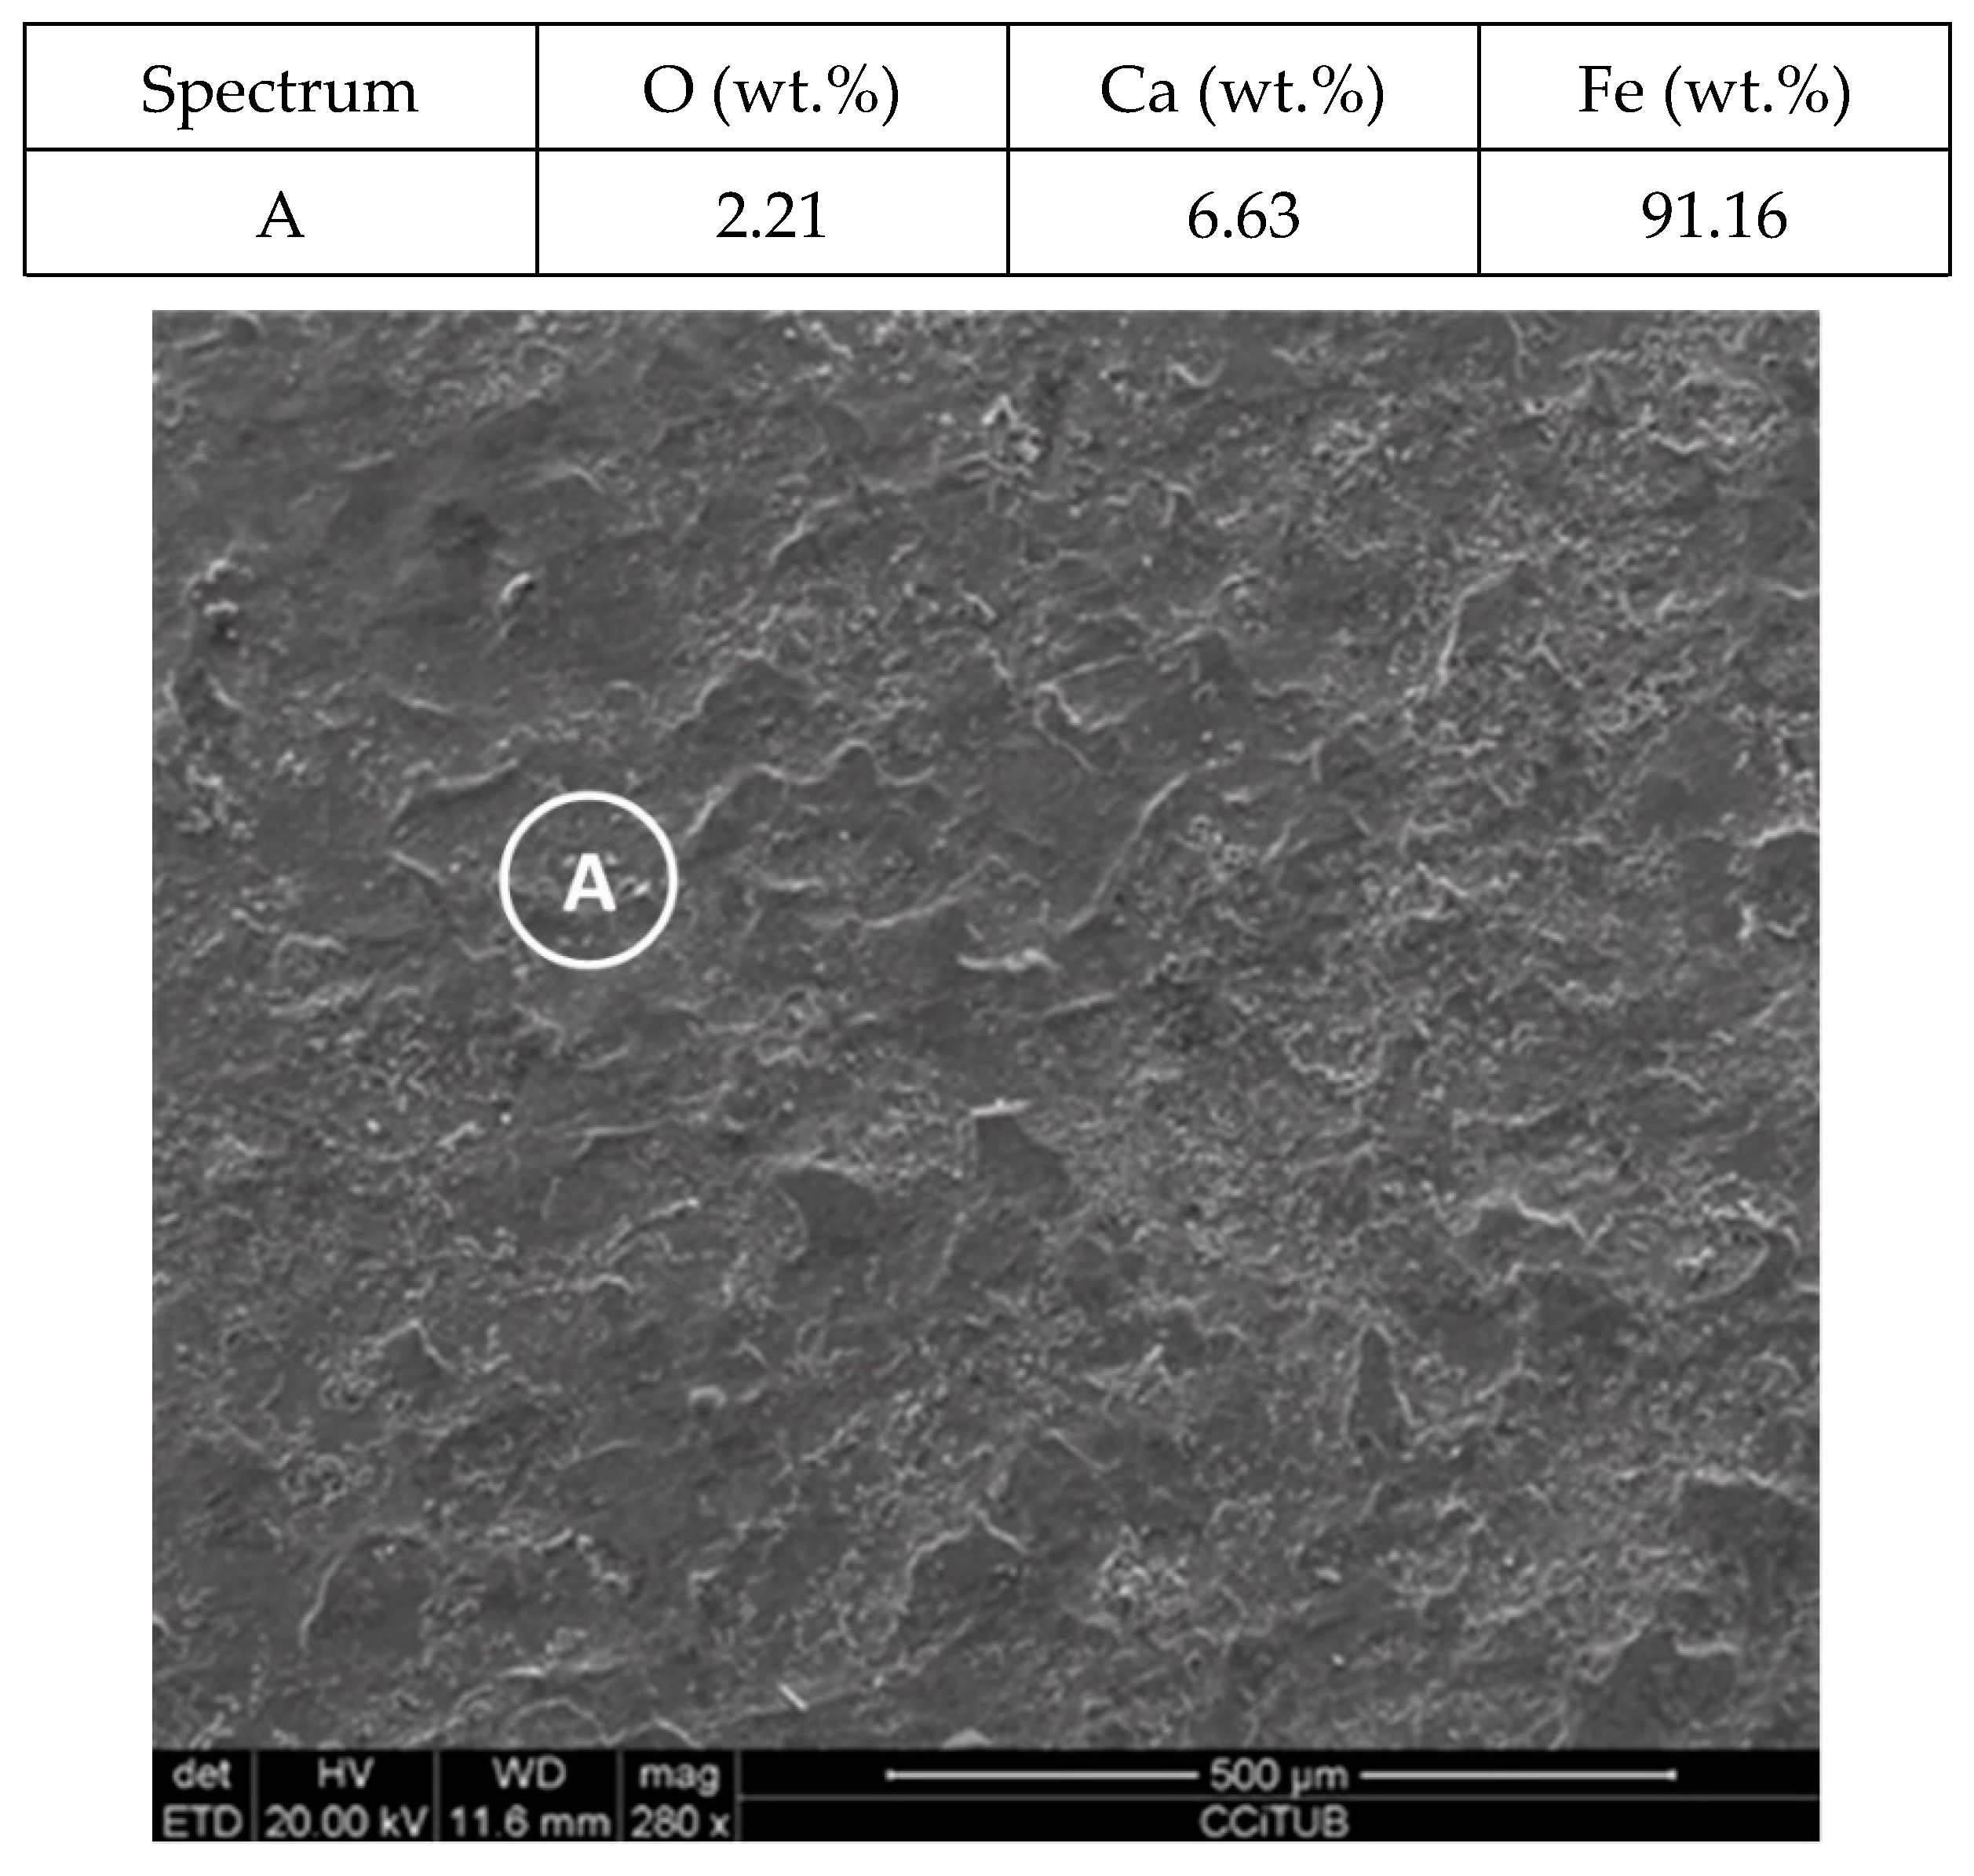
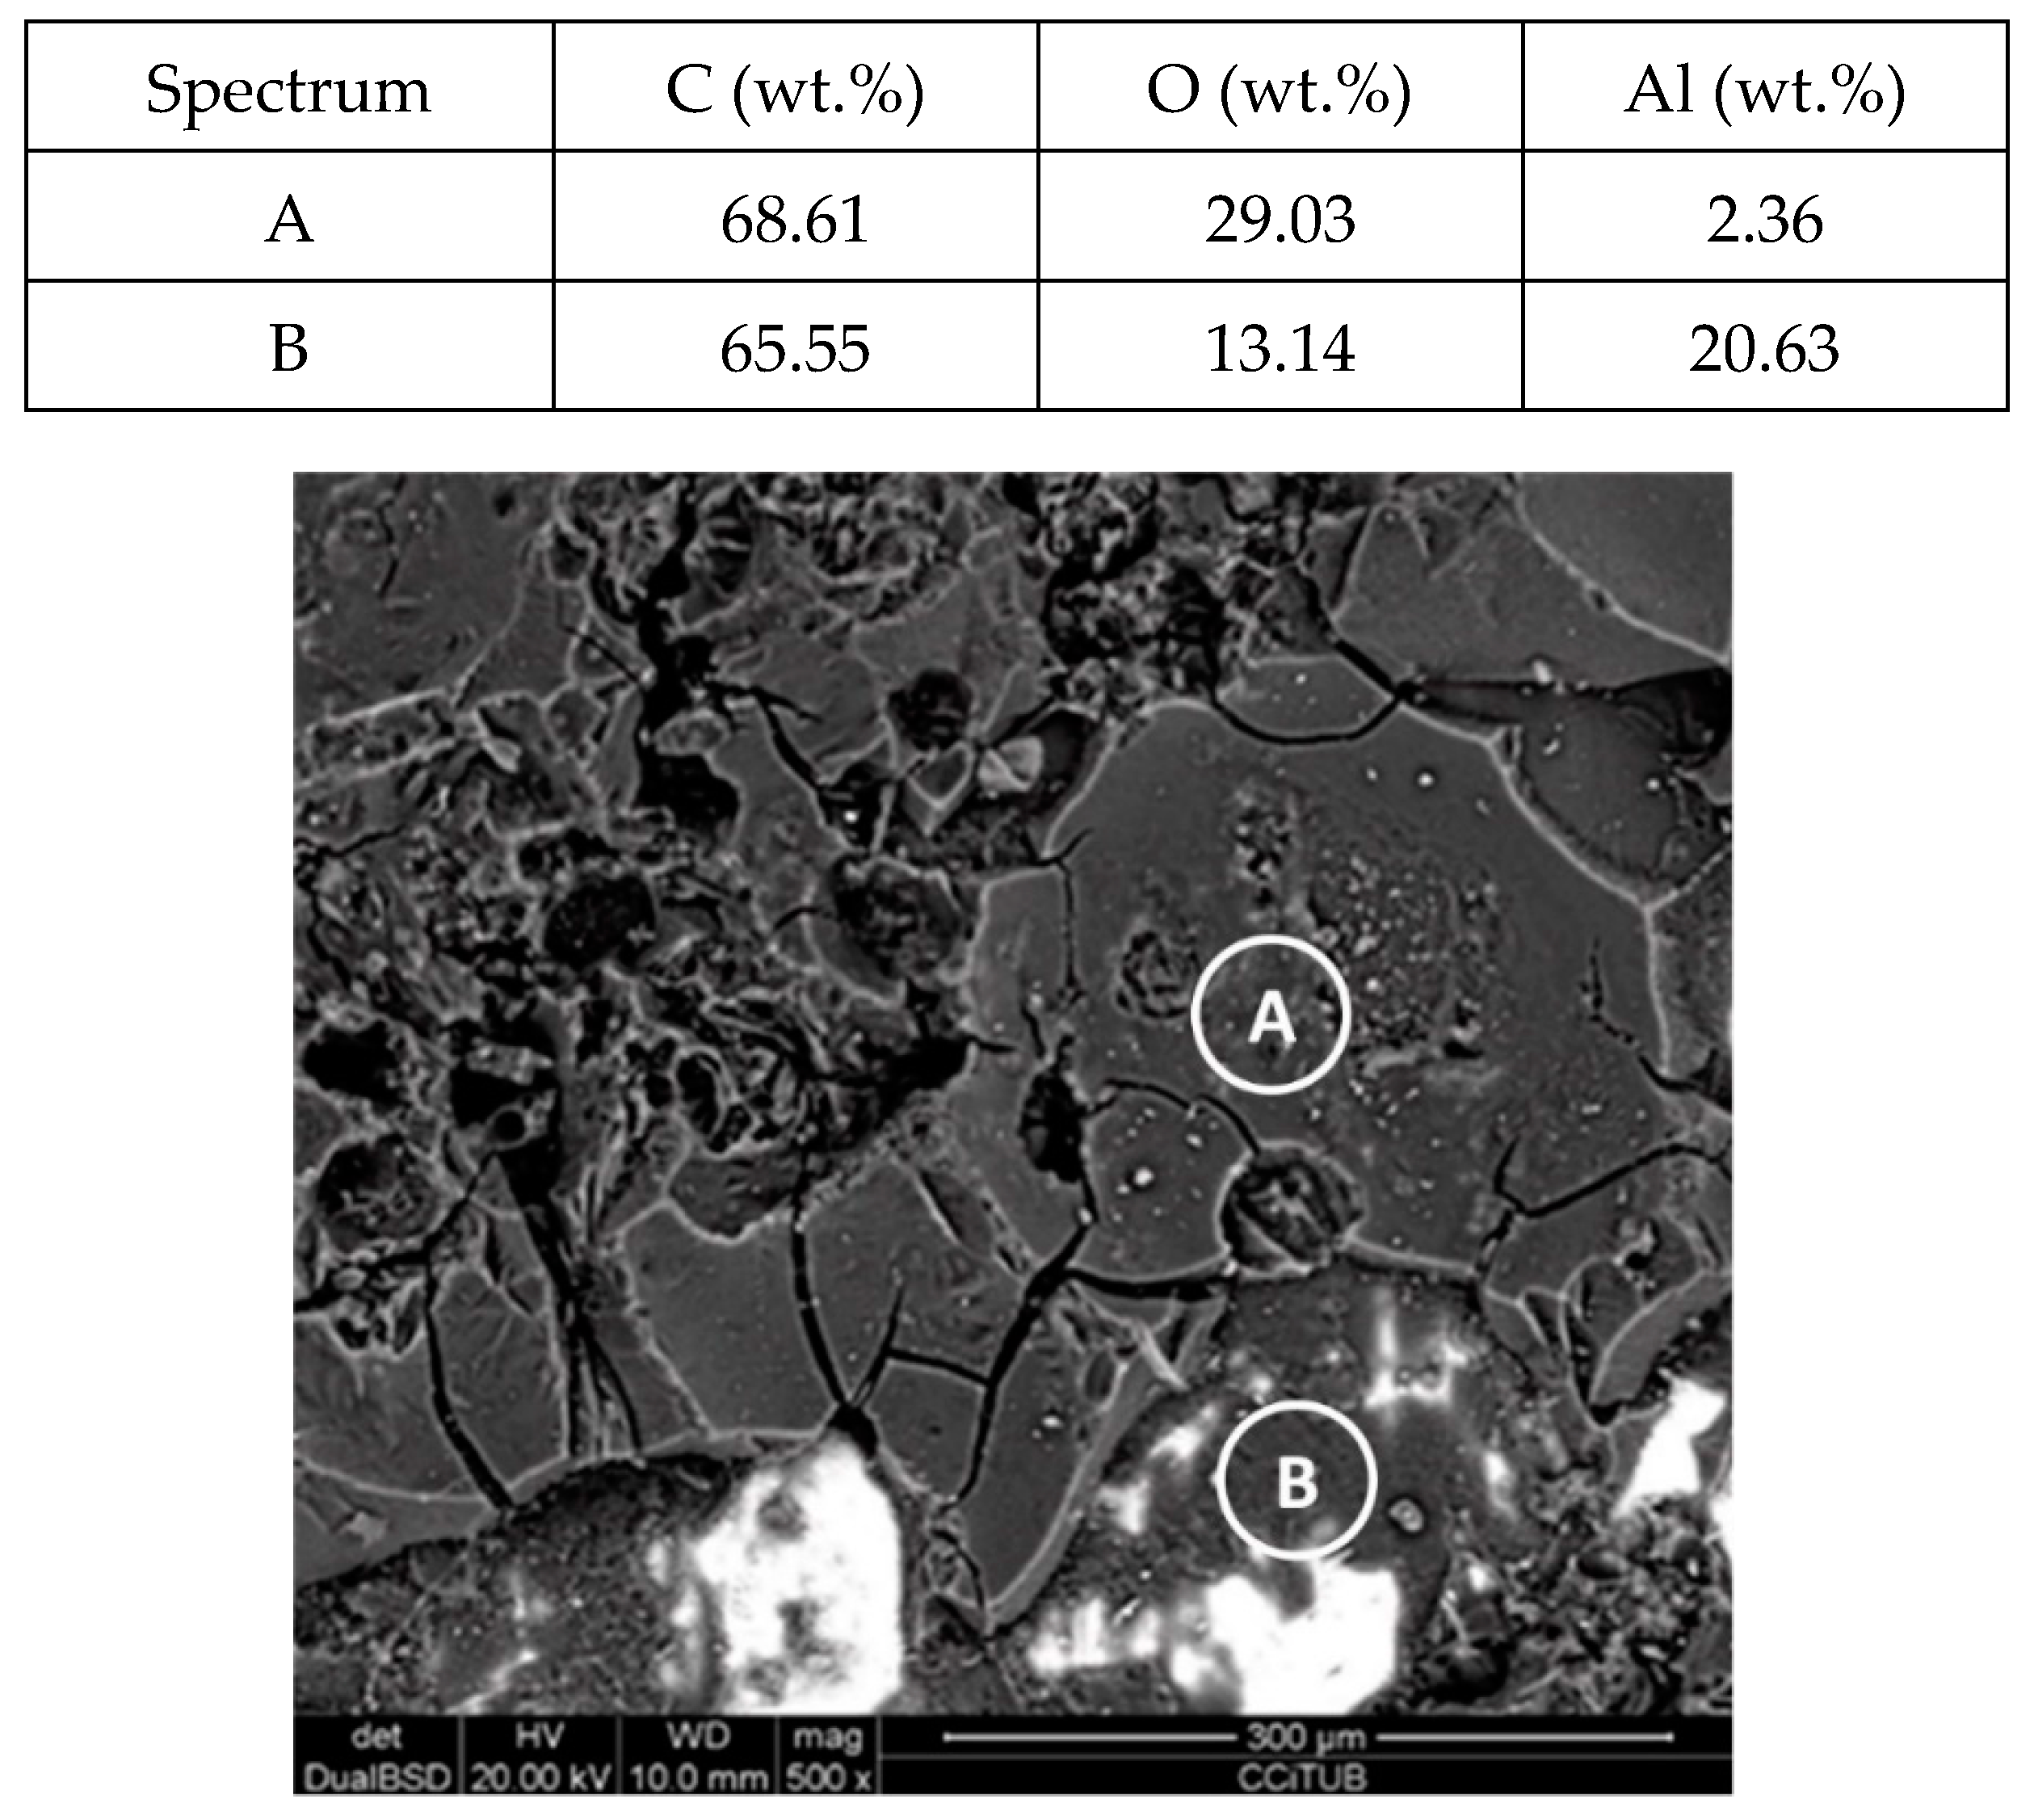
Figure 4.
Detail (lower) and energy-dispersive X-ray (EDX) analysis (upper) of the carbon steel (AISI 1090) specimen surface after 2000 h immersed in solar salt.
Figure 4.
Detail (lower) and energy-dispersive X-ray (EDX) analysis (upper) of the carbon steel (AISI 1090) specimen surface after 2000 h immersed in solar salt.
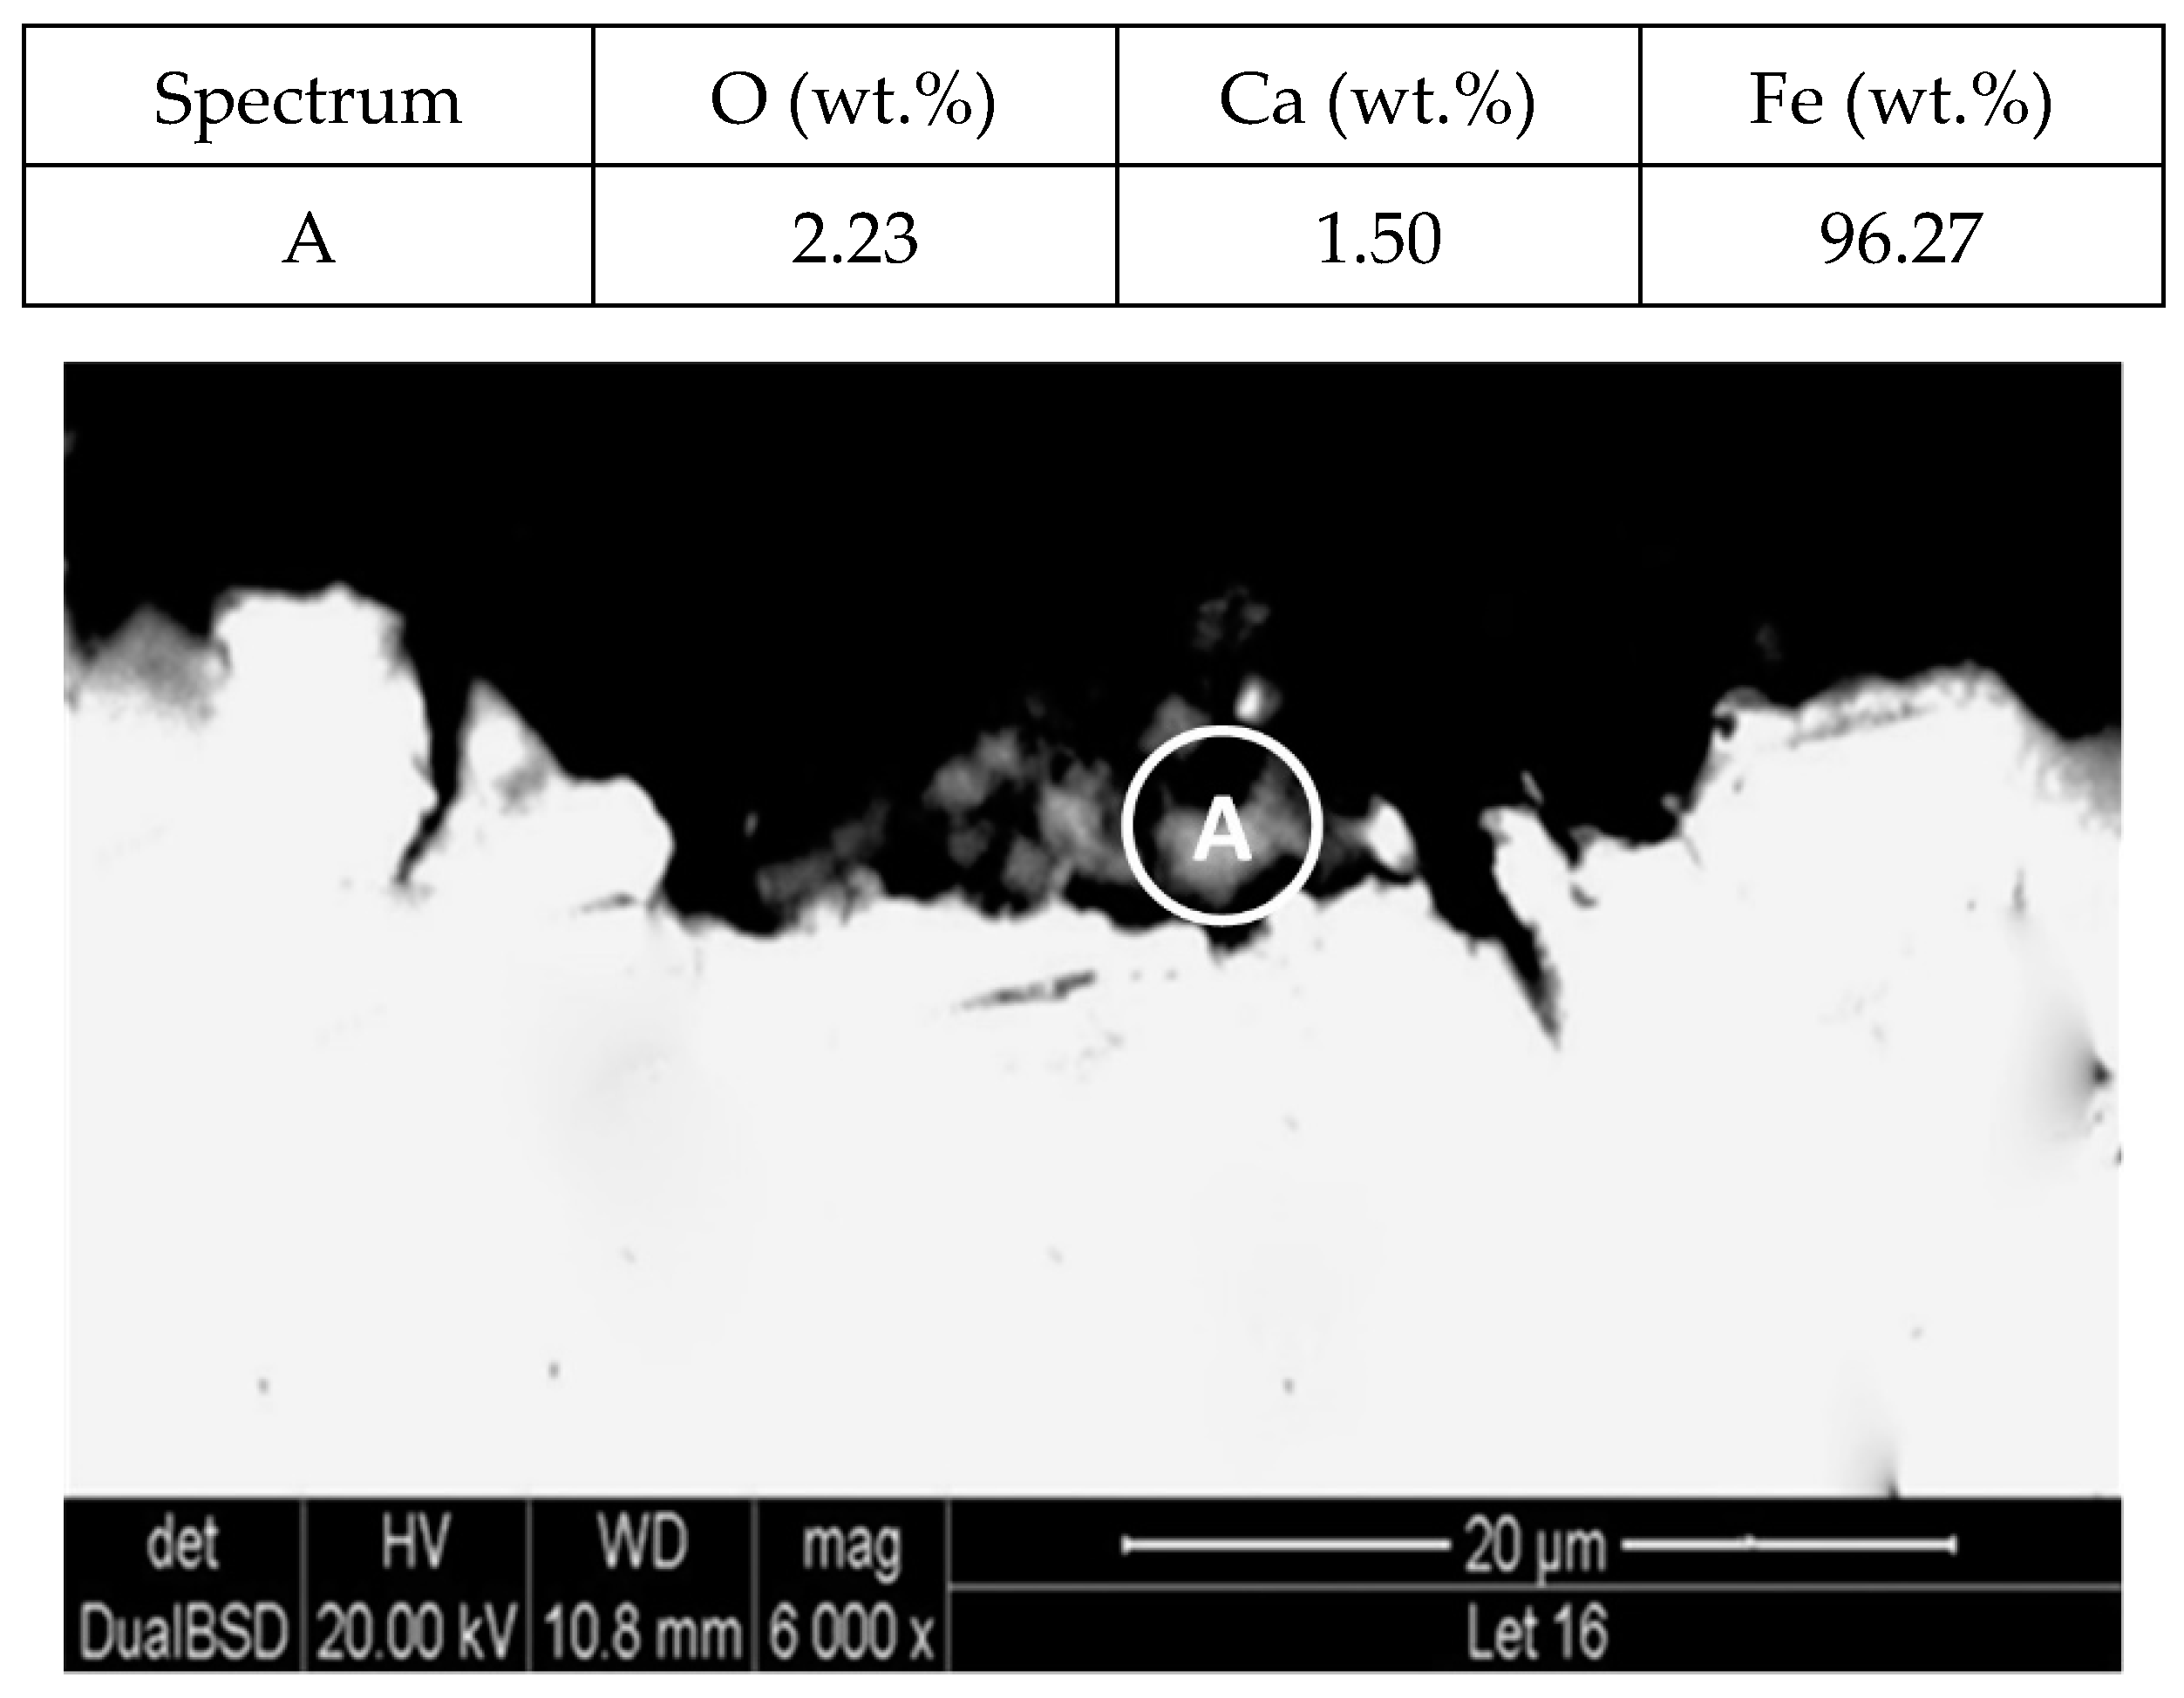
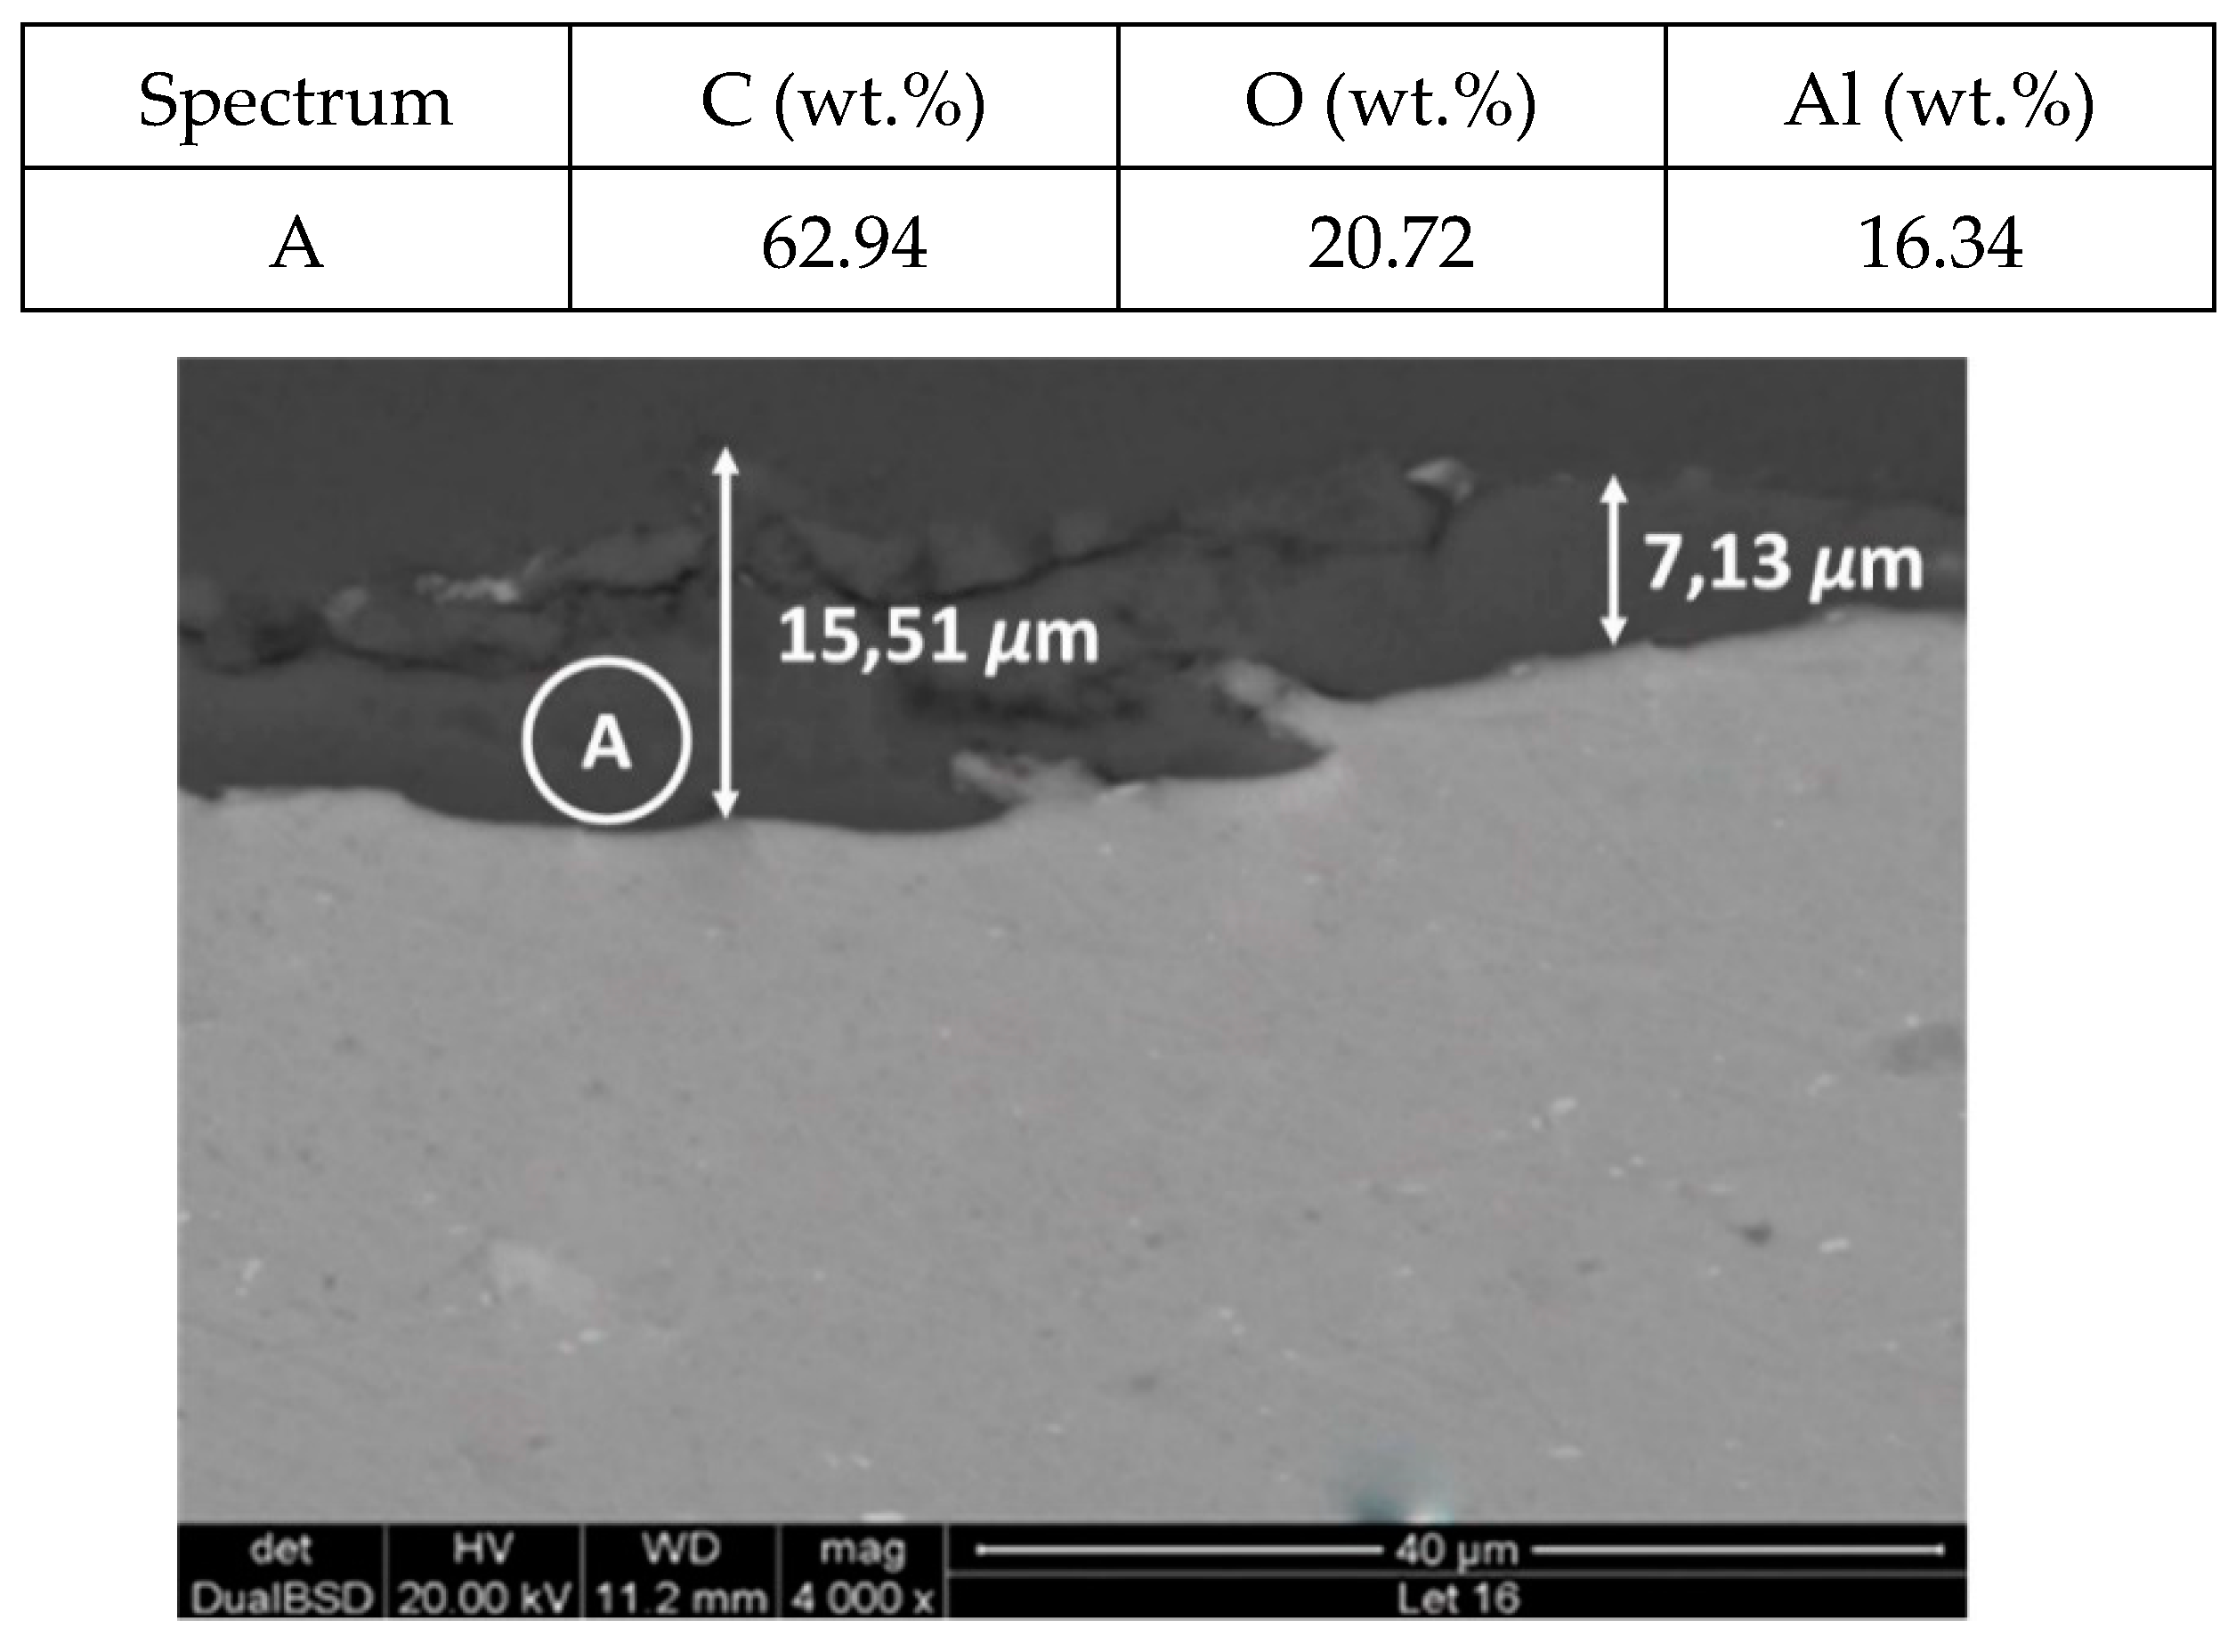
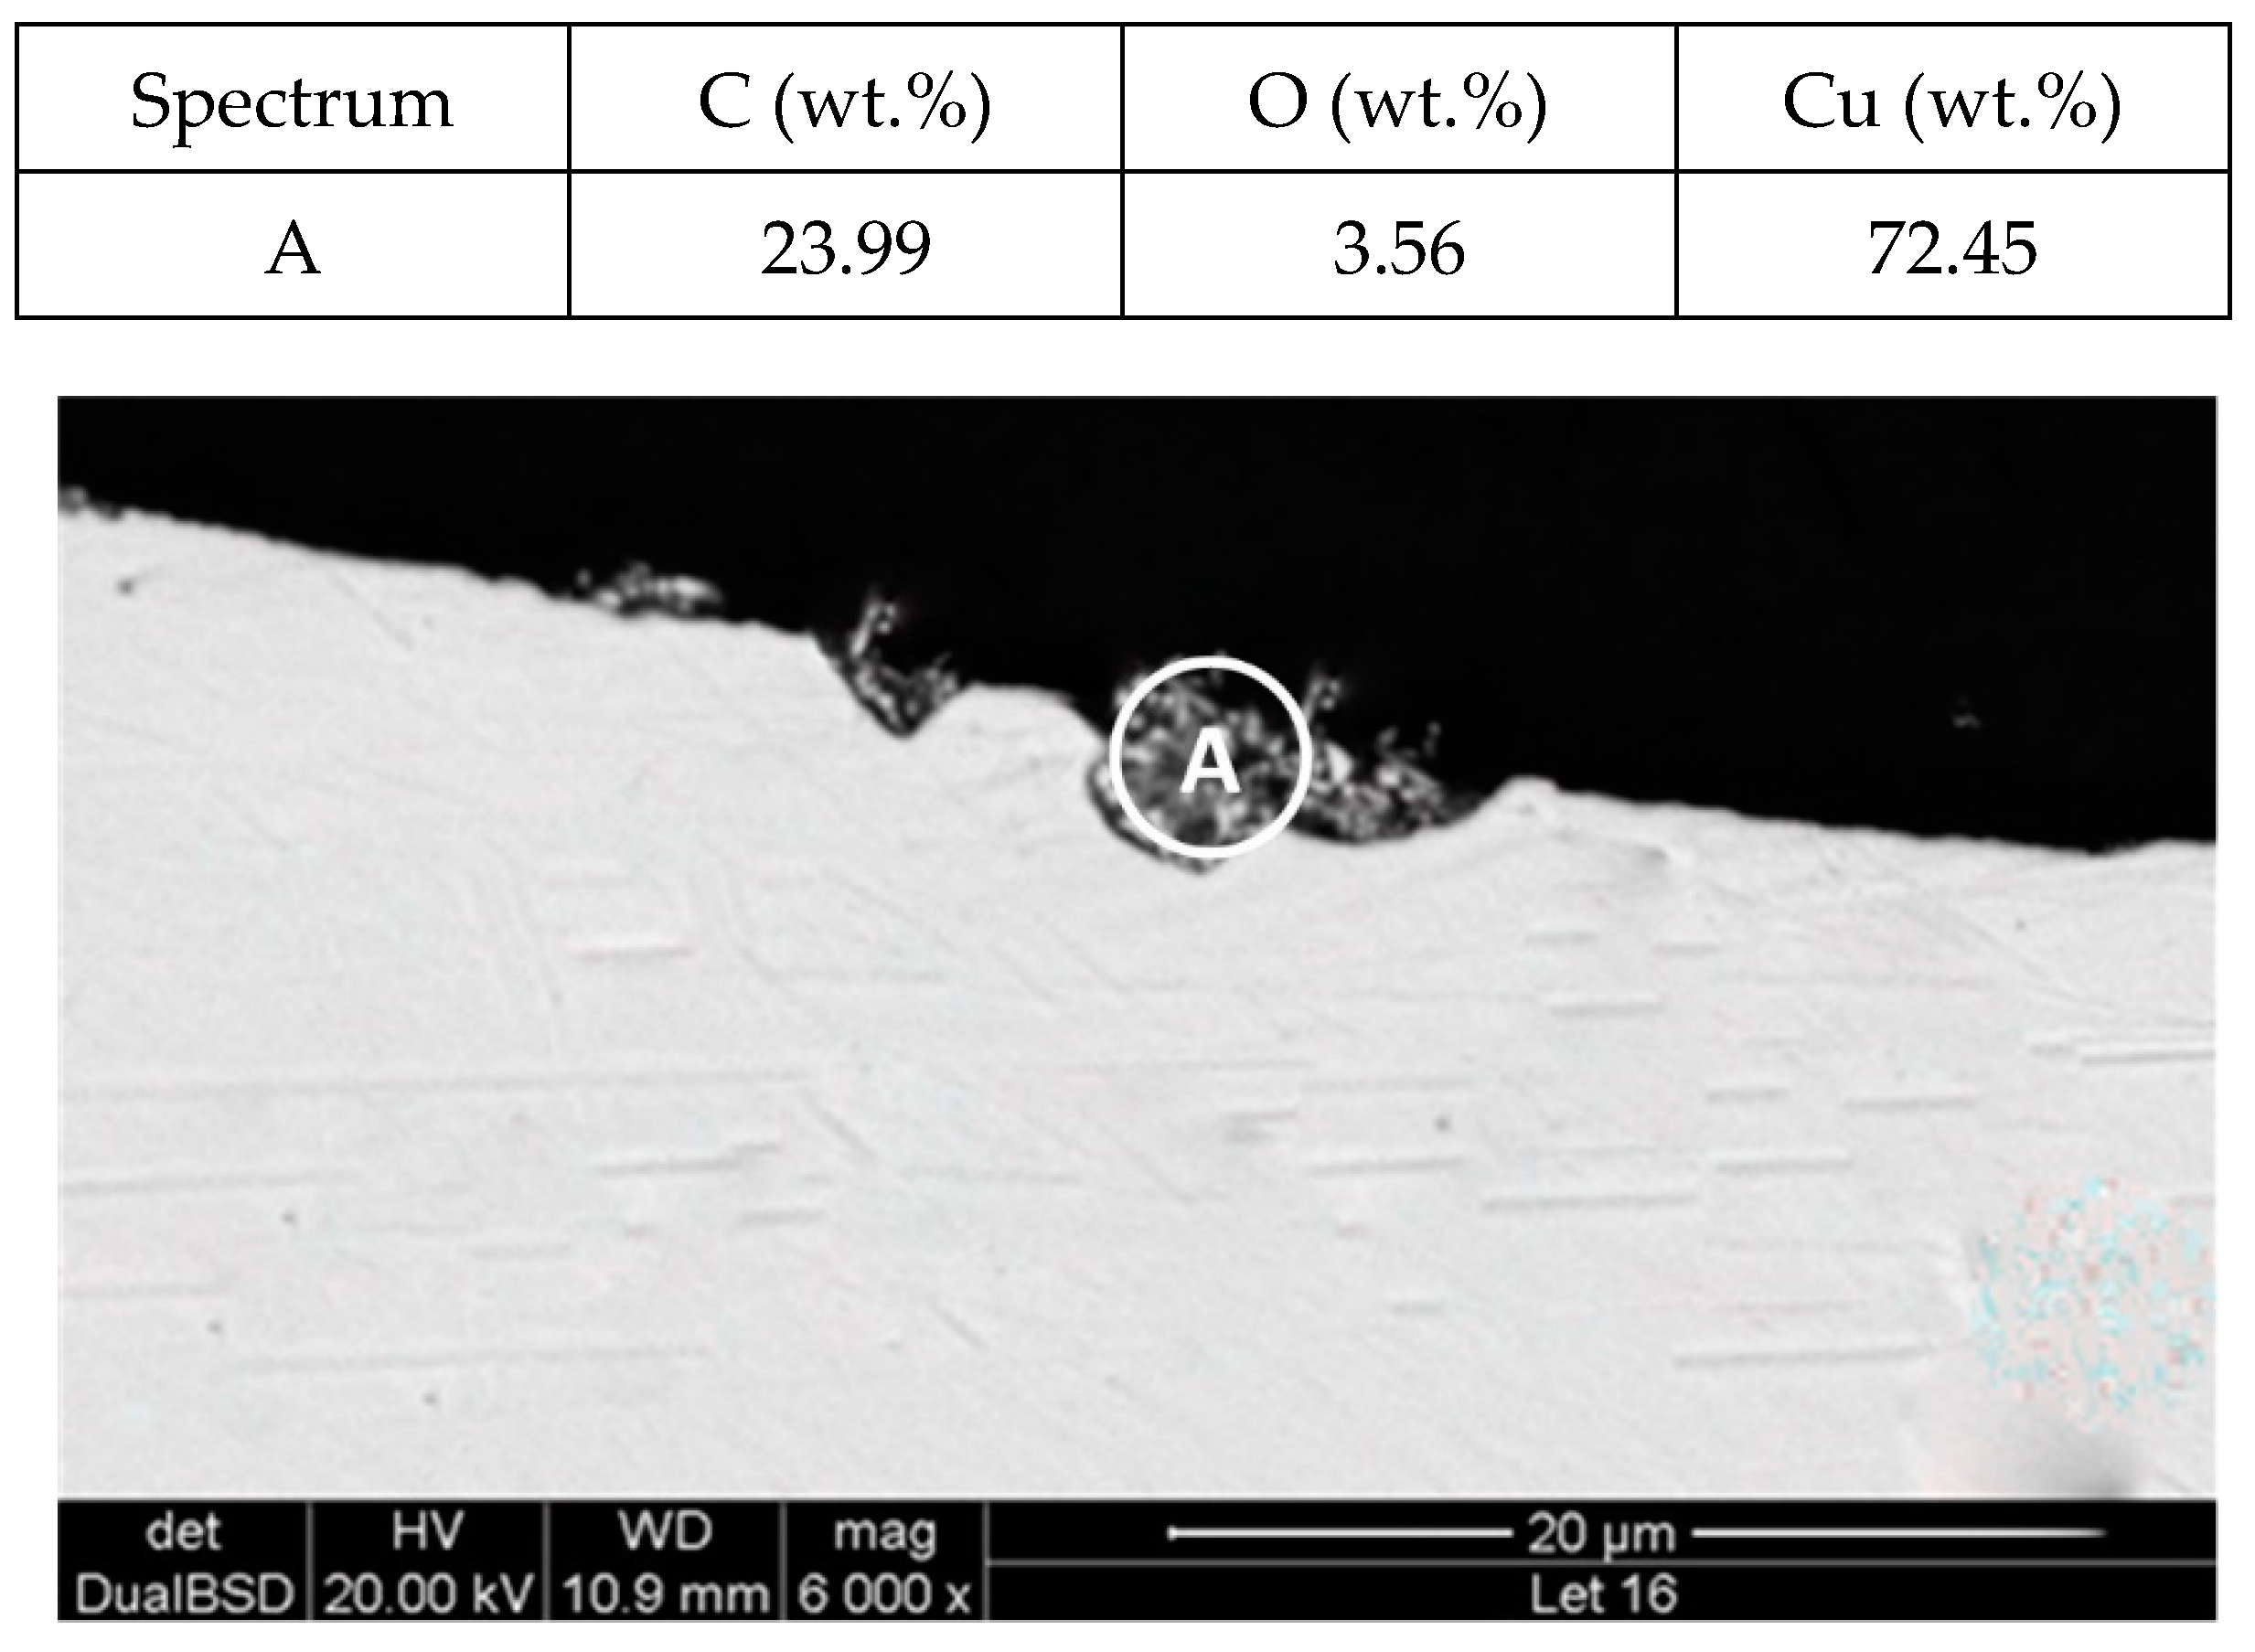
Figure 5.
Detail (lower) and EDX analysis (upper) of the carbon steel (AISI 1090) specimen cross-section after 2000 h immersed in solar salt.
Figure 5.
Detail (lower) and EDX analysis (upper) of the carbon steel (AISI 1090) specimen cross-section after 2000 h immersed in solar salt.
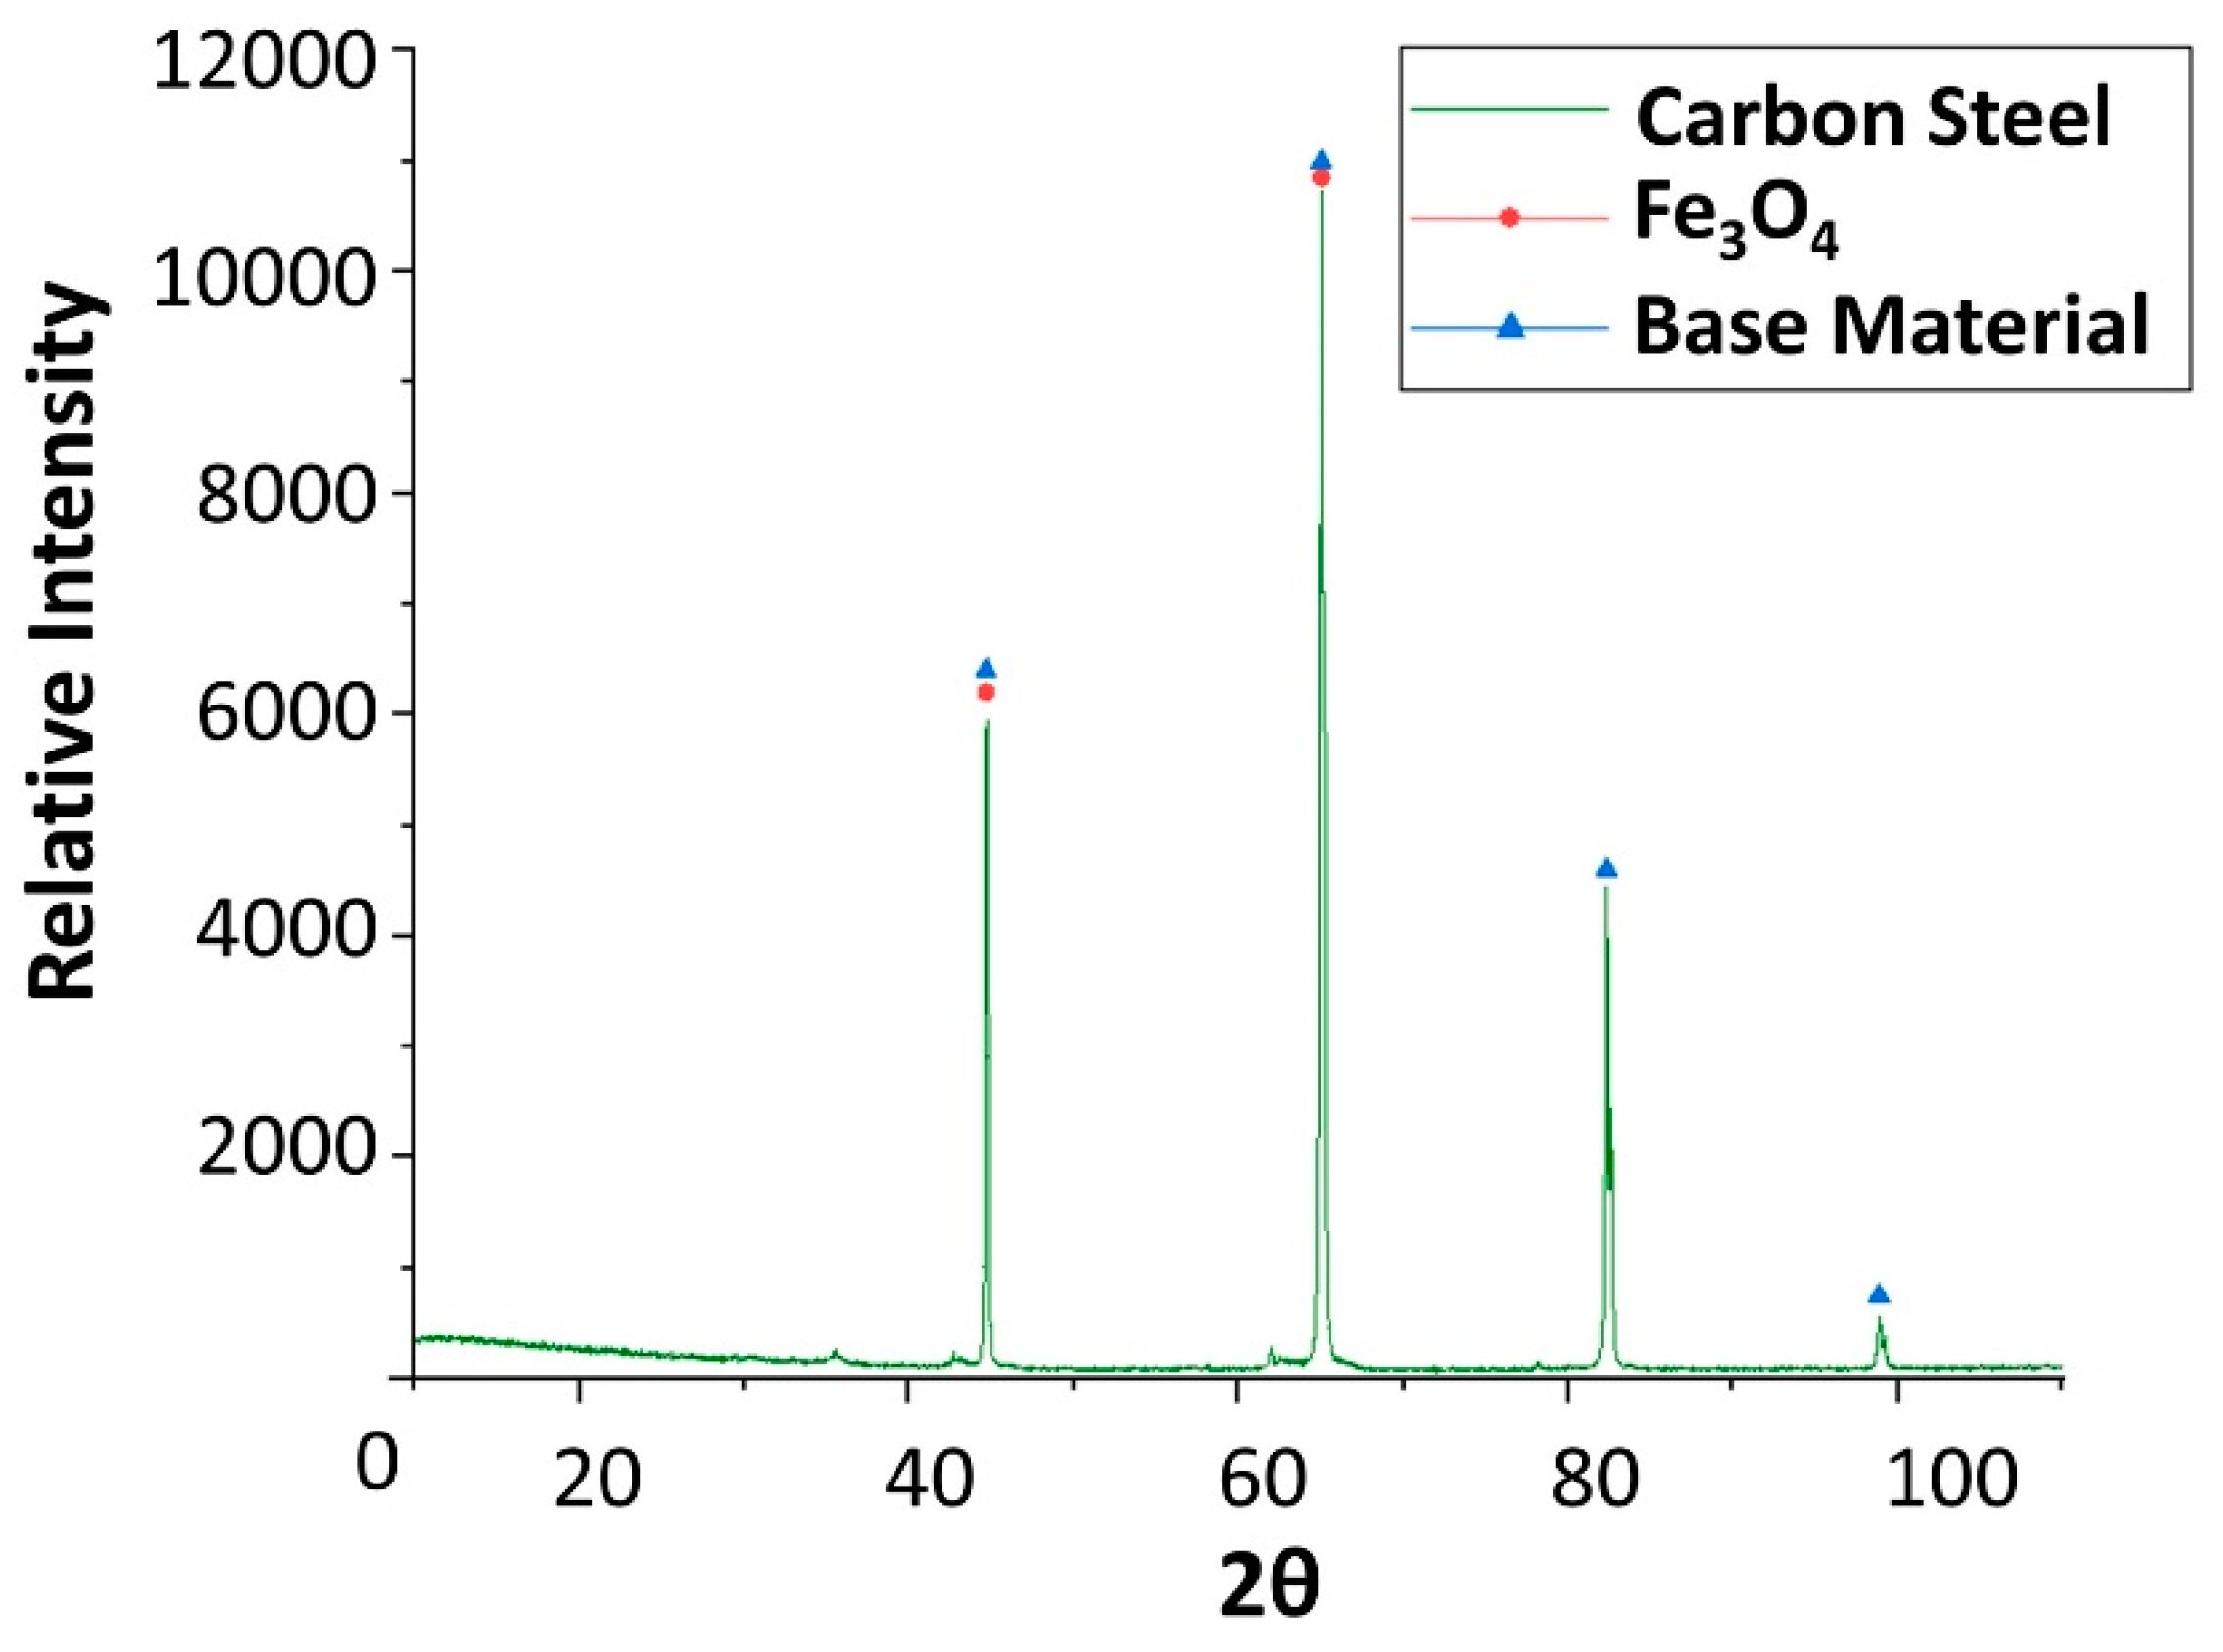
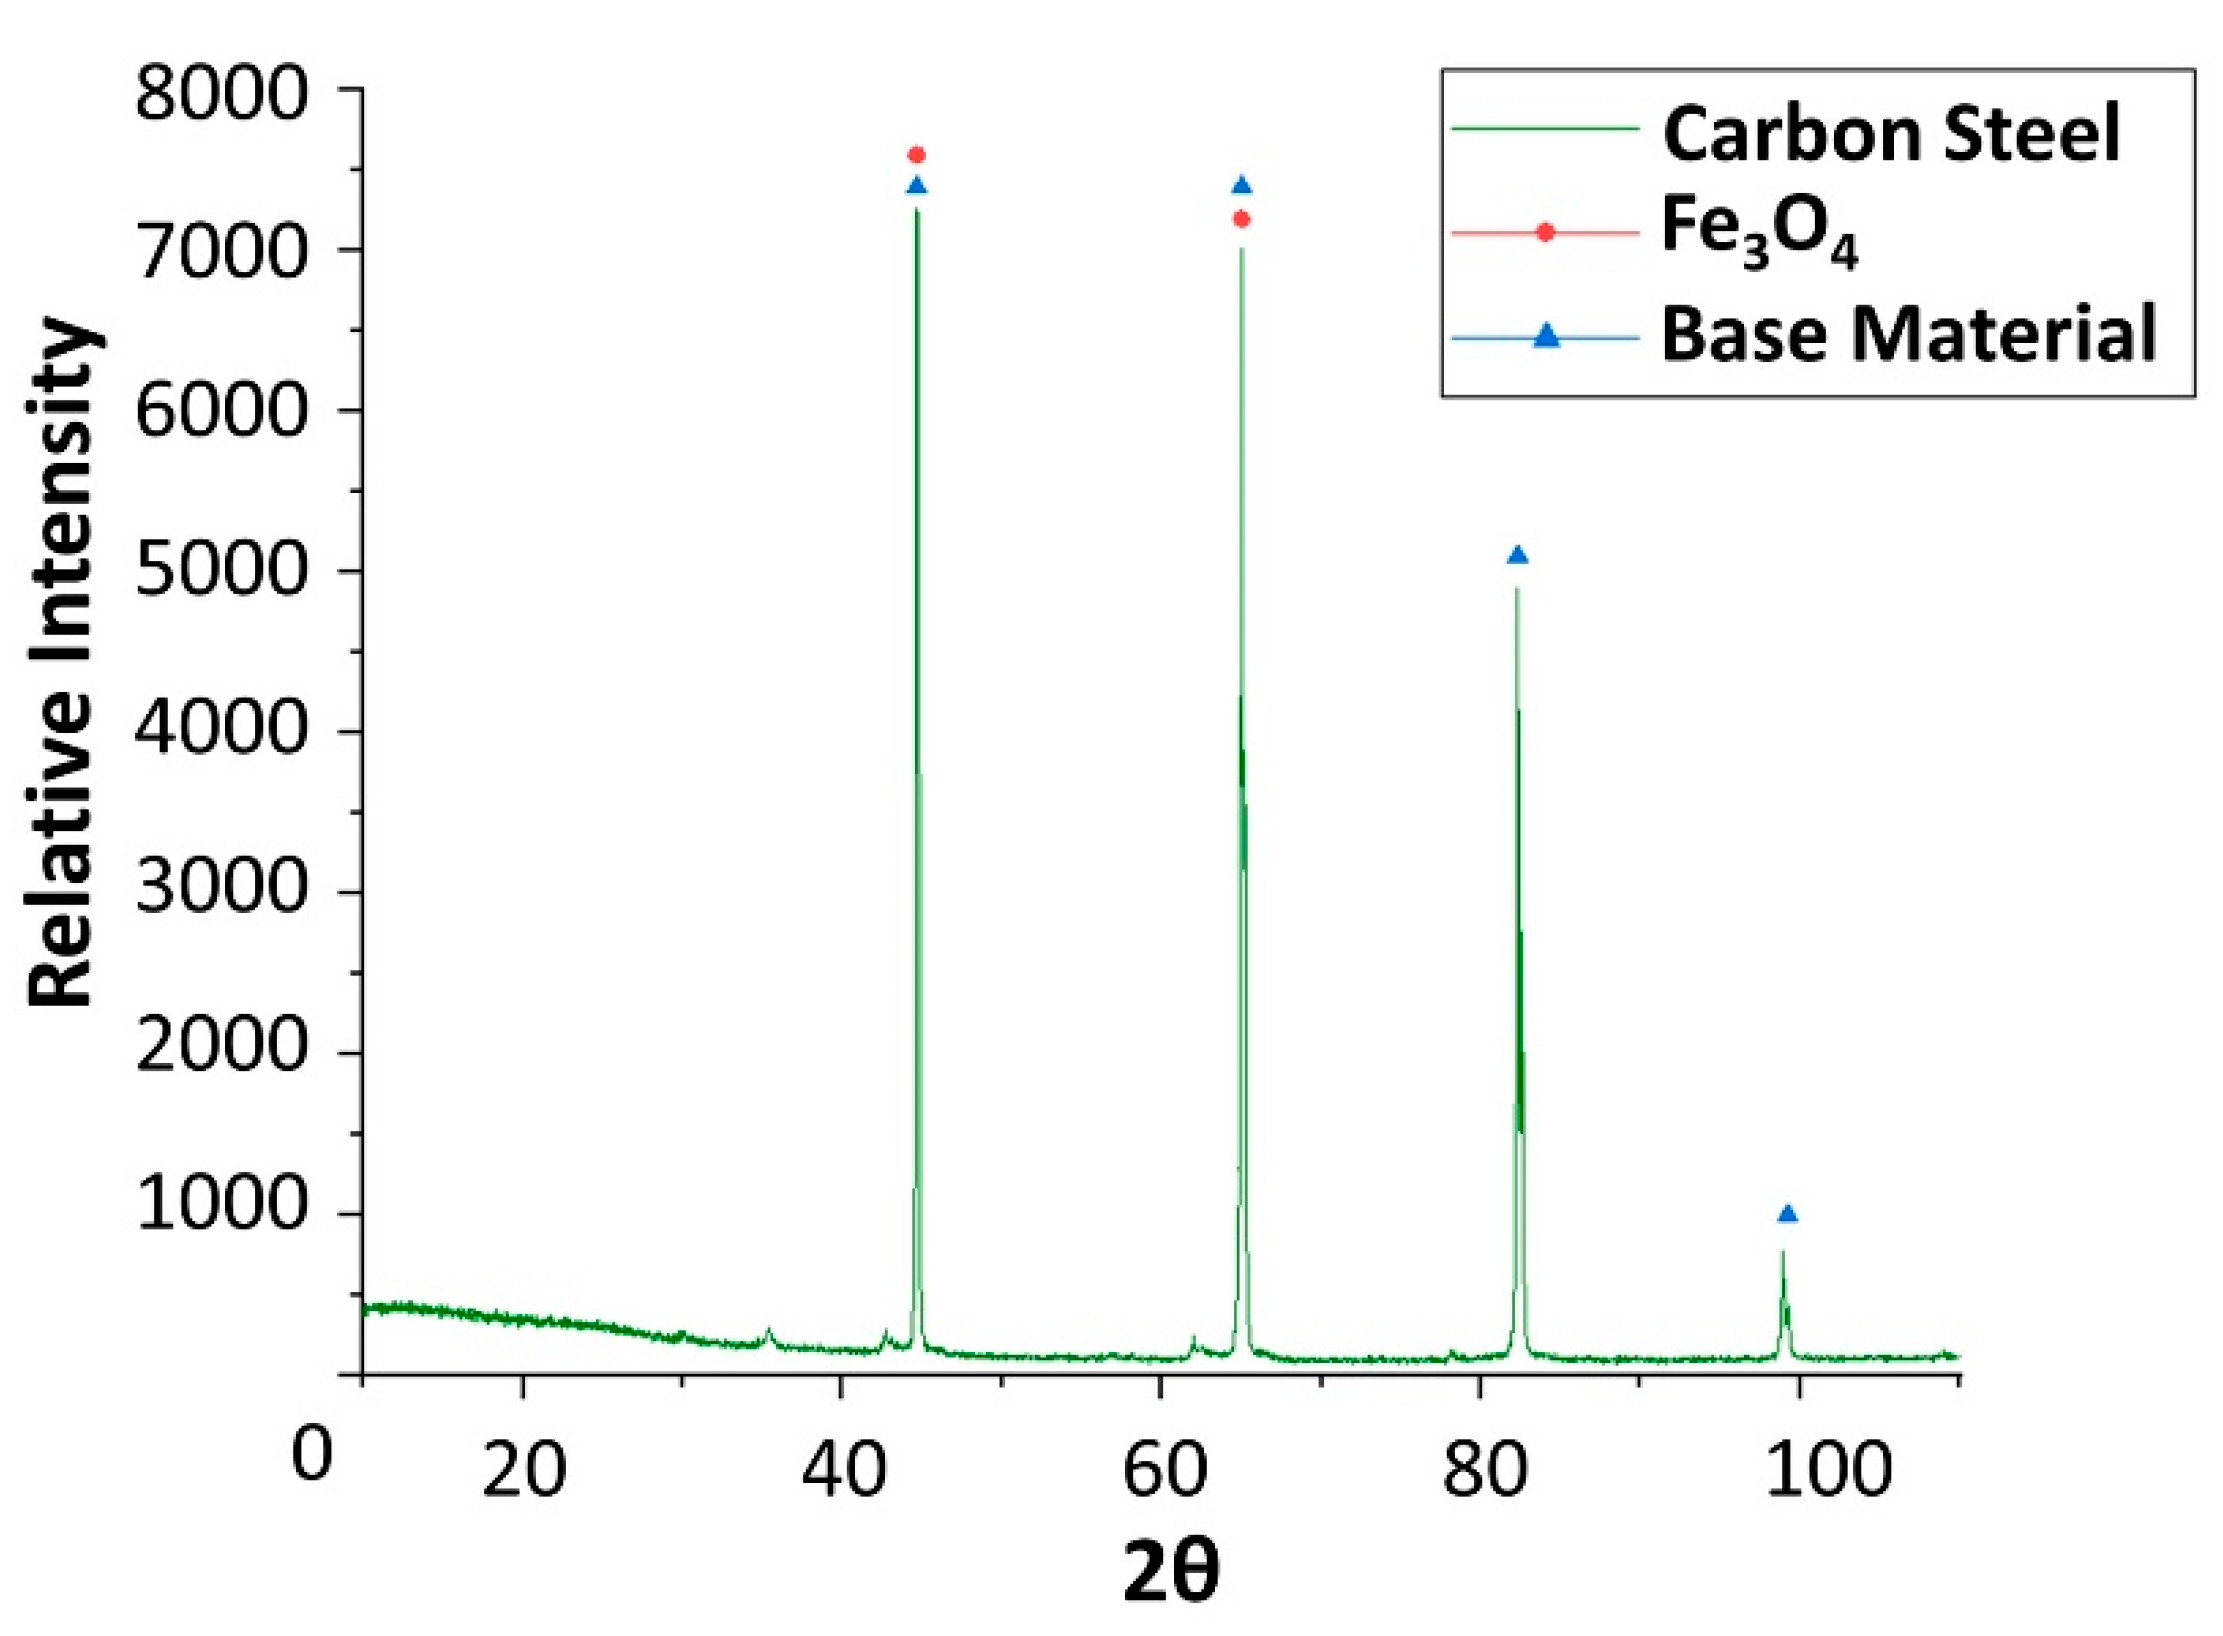
Figure 6.
X-ray diffraction analysis of the carbon steel (AISI 1090) specimen after 4 weeks immersed in solar salt.
Figure 6.
X-ray diffraction analysis of the carbon steel (AISI 1090) specimen after 4 weeks immersed in solar salt.
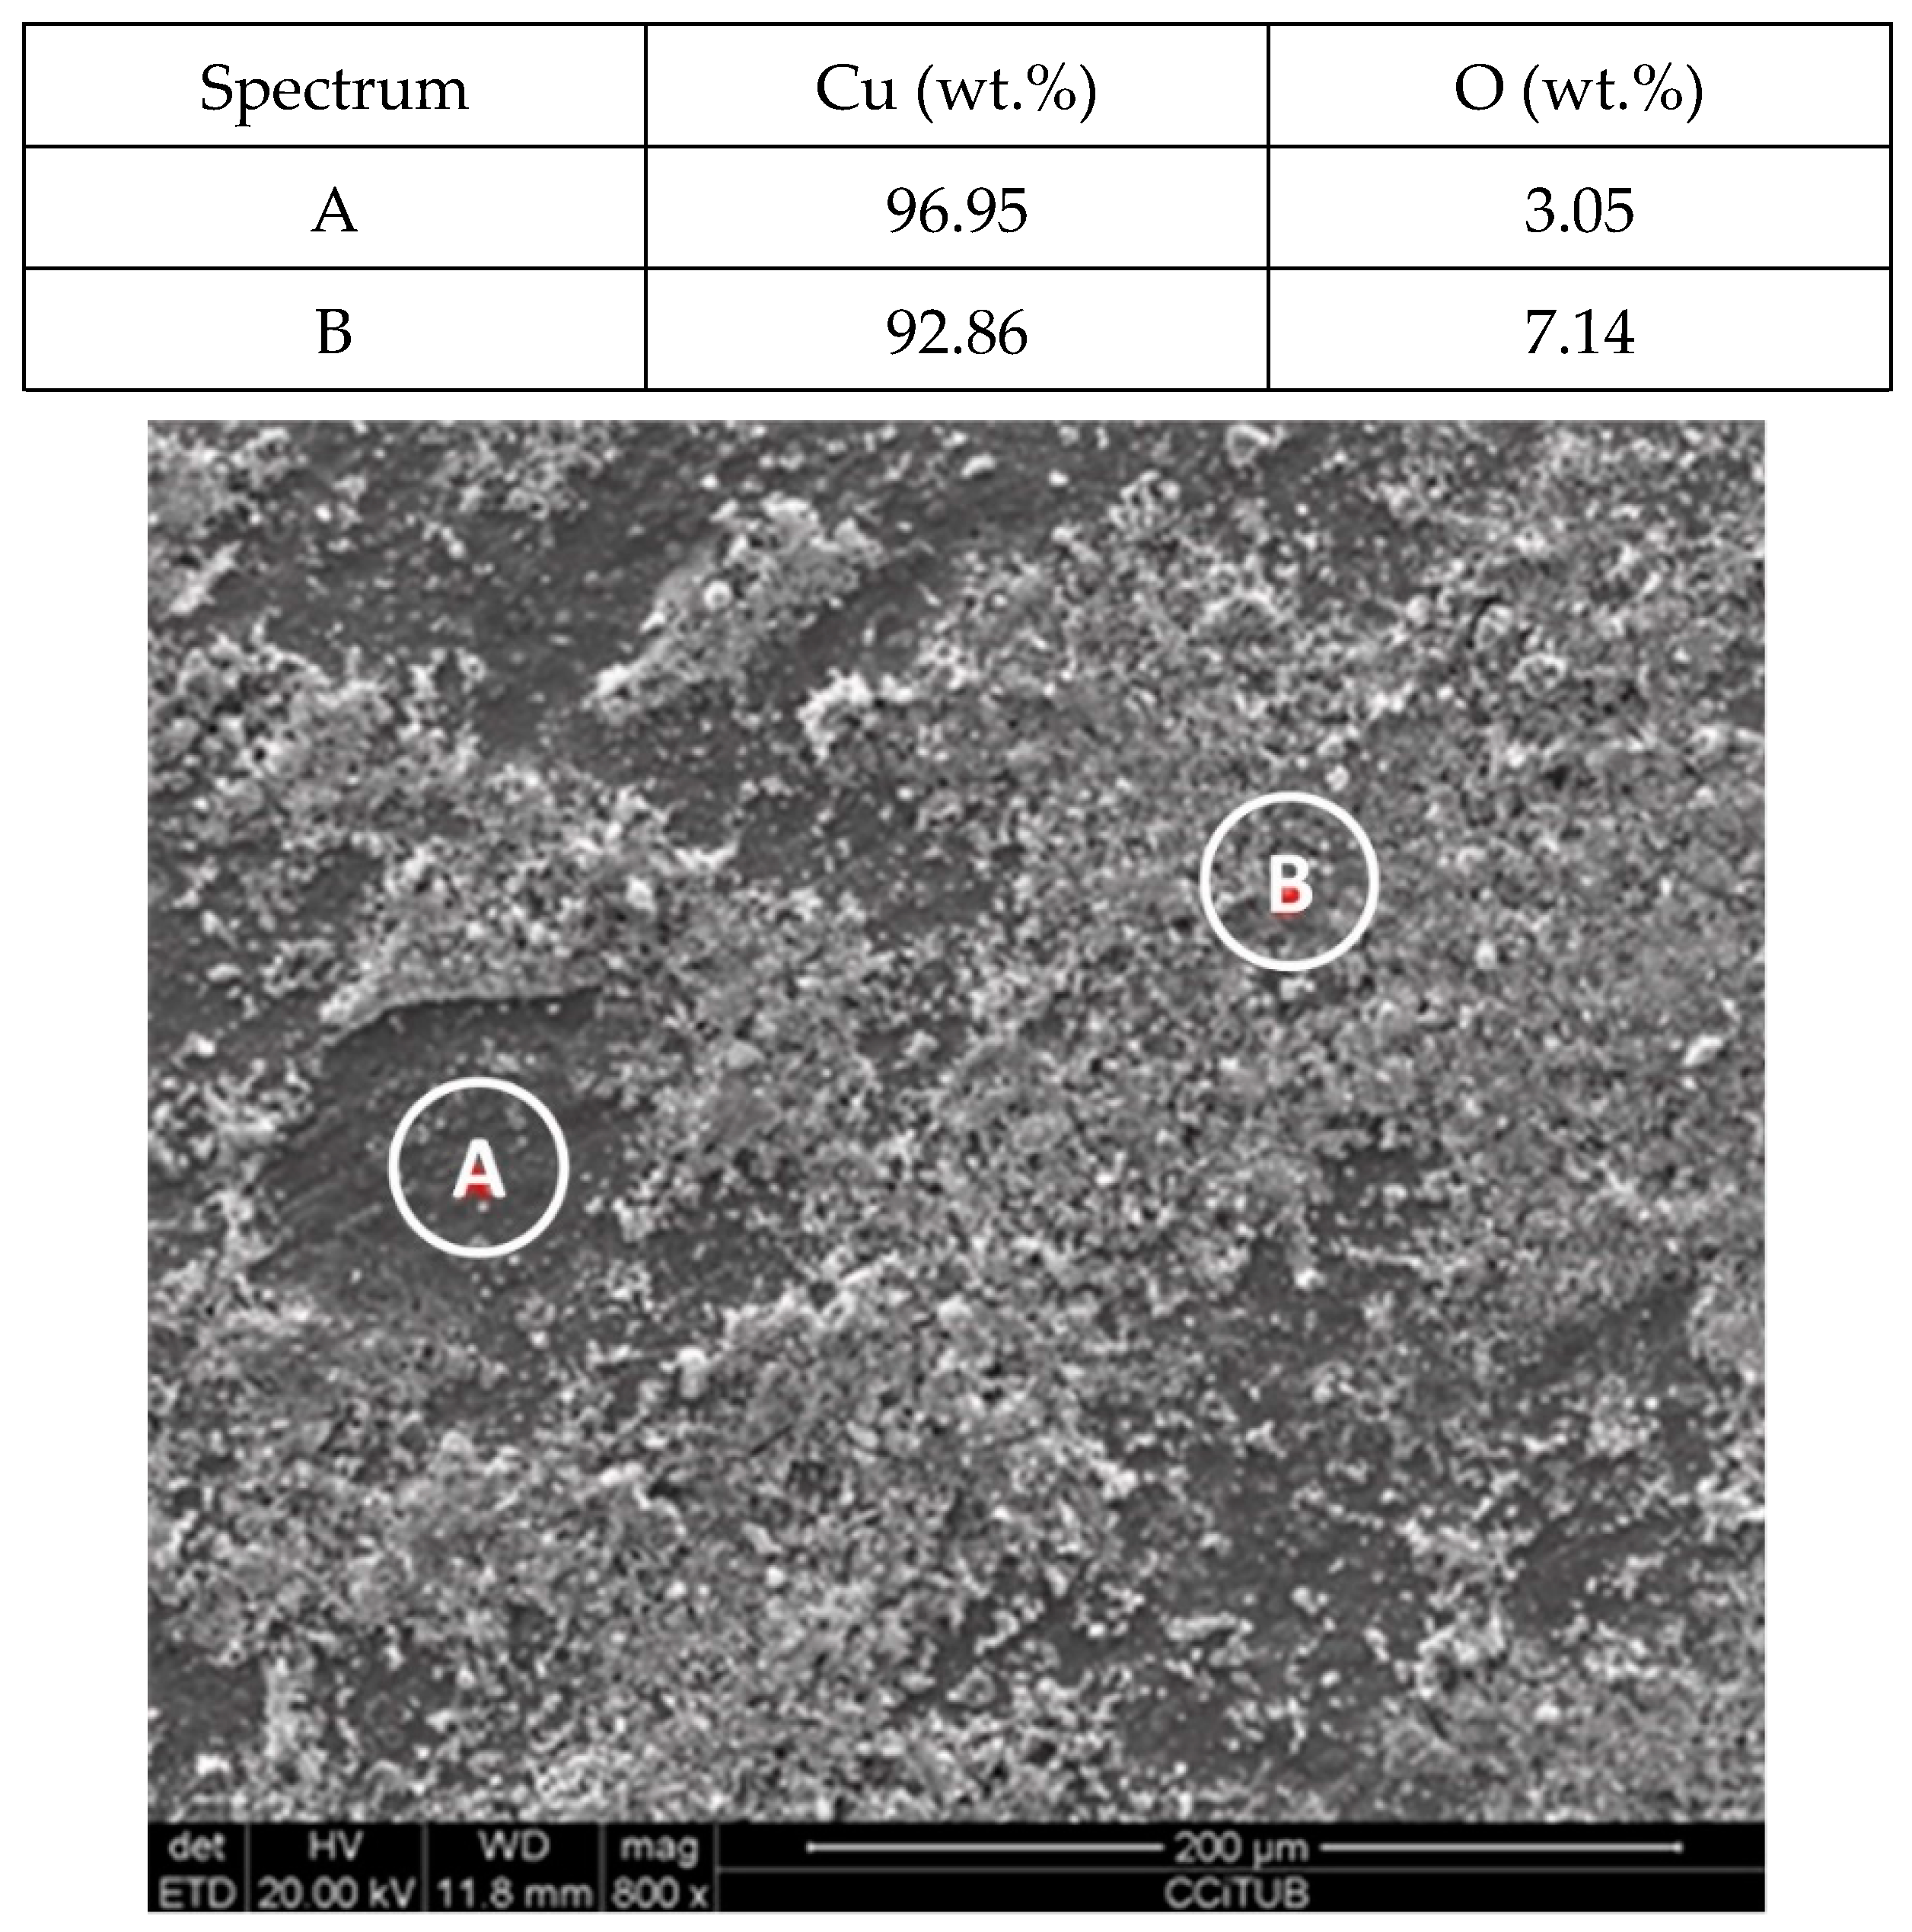
Figure 7.
Detail (lower) and EDX analysis (upper) of the copper specimen surface after 2000 h immersed in solar salt.
Figure 7.
Detail (lower) and EDX analysis (upper) of the copper specimen surface after 2000 h immersed in solar salt.
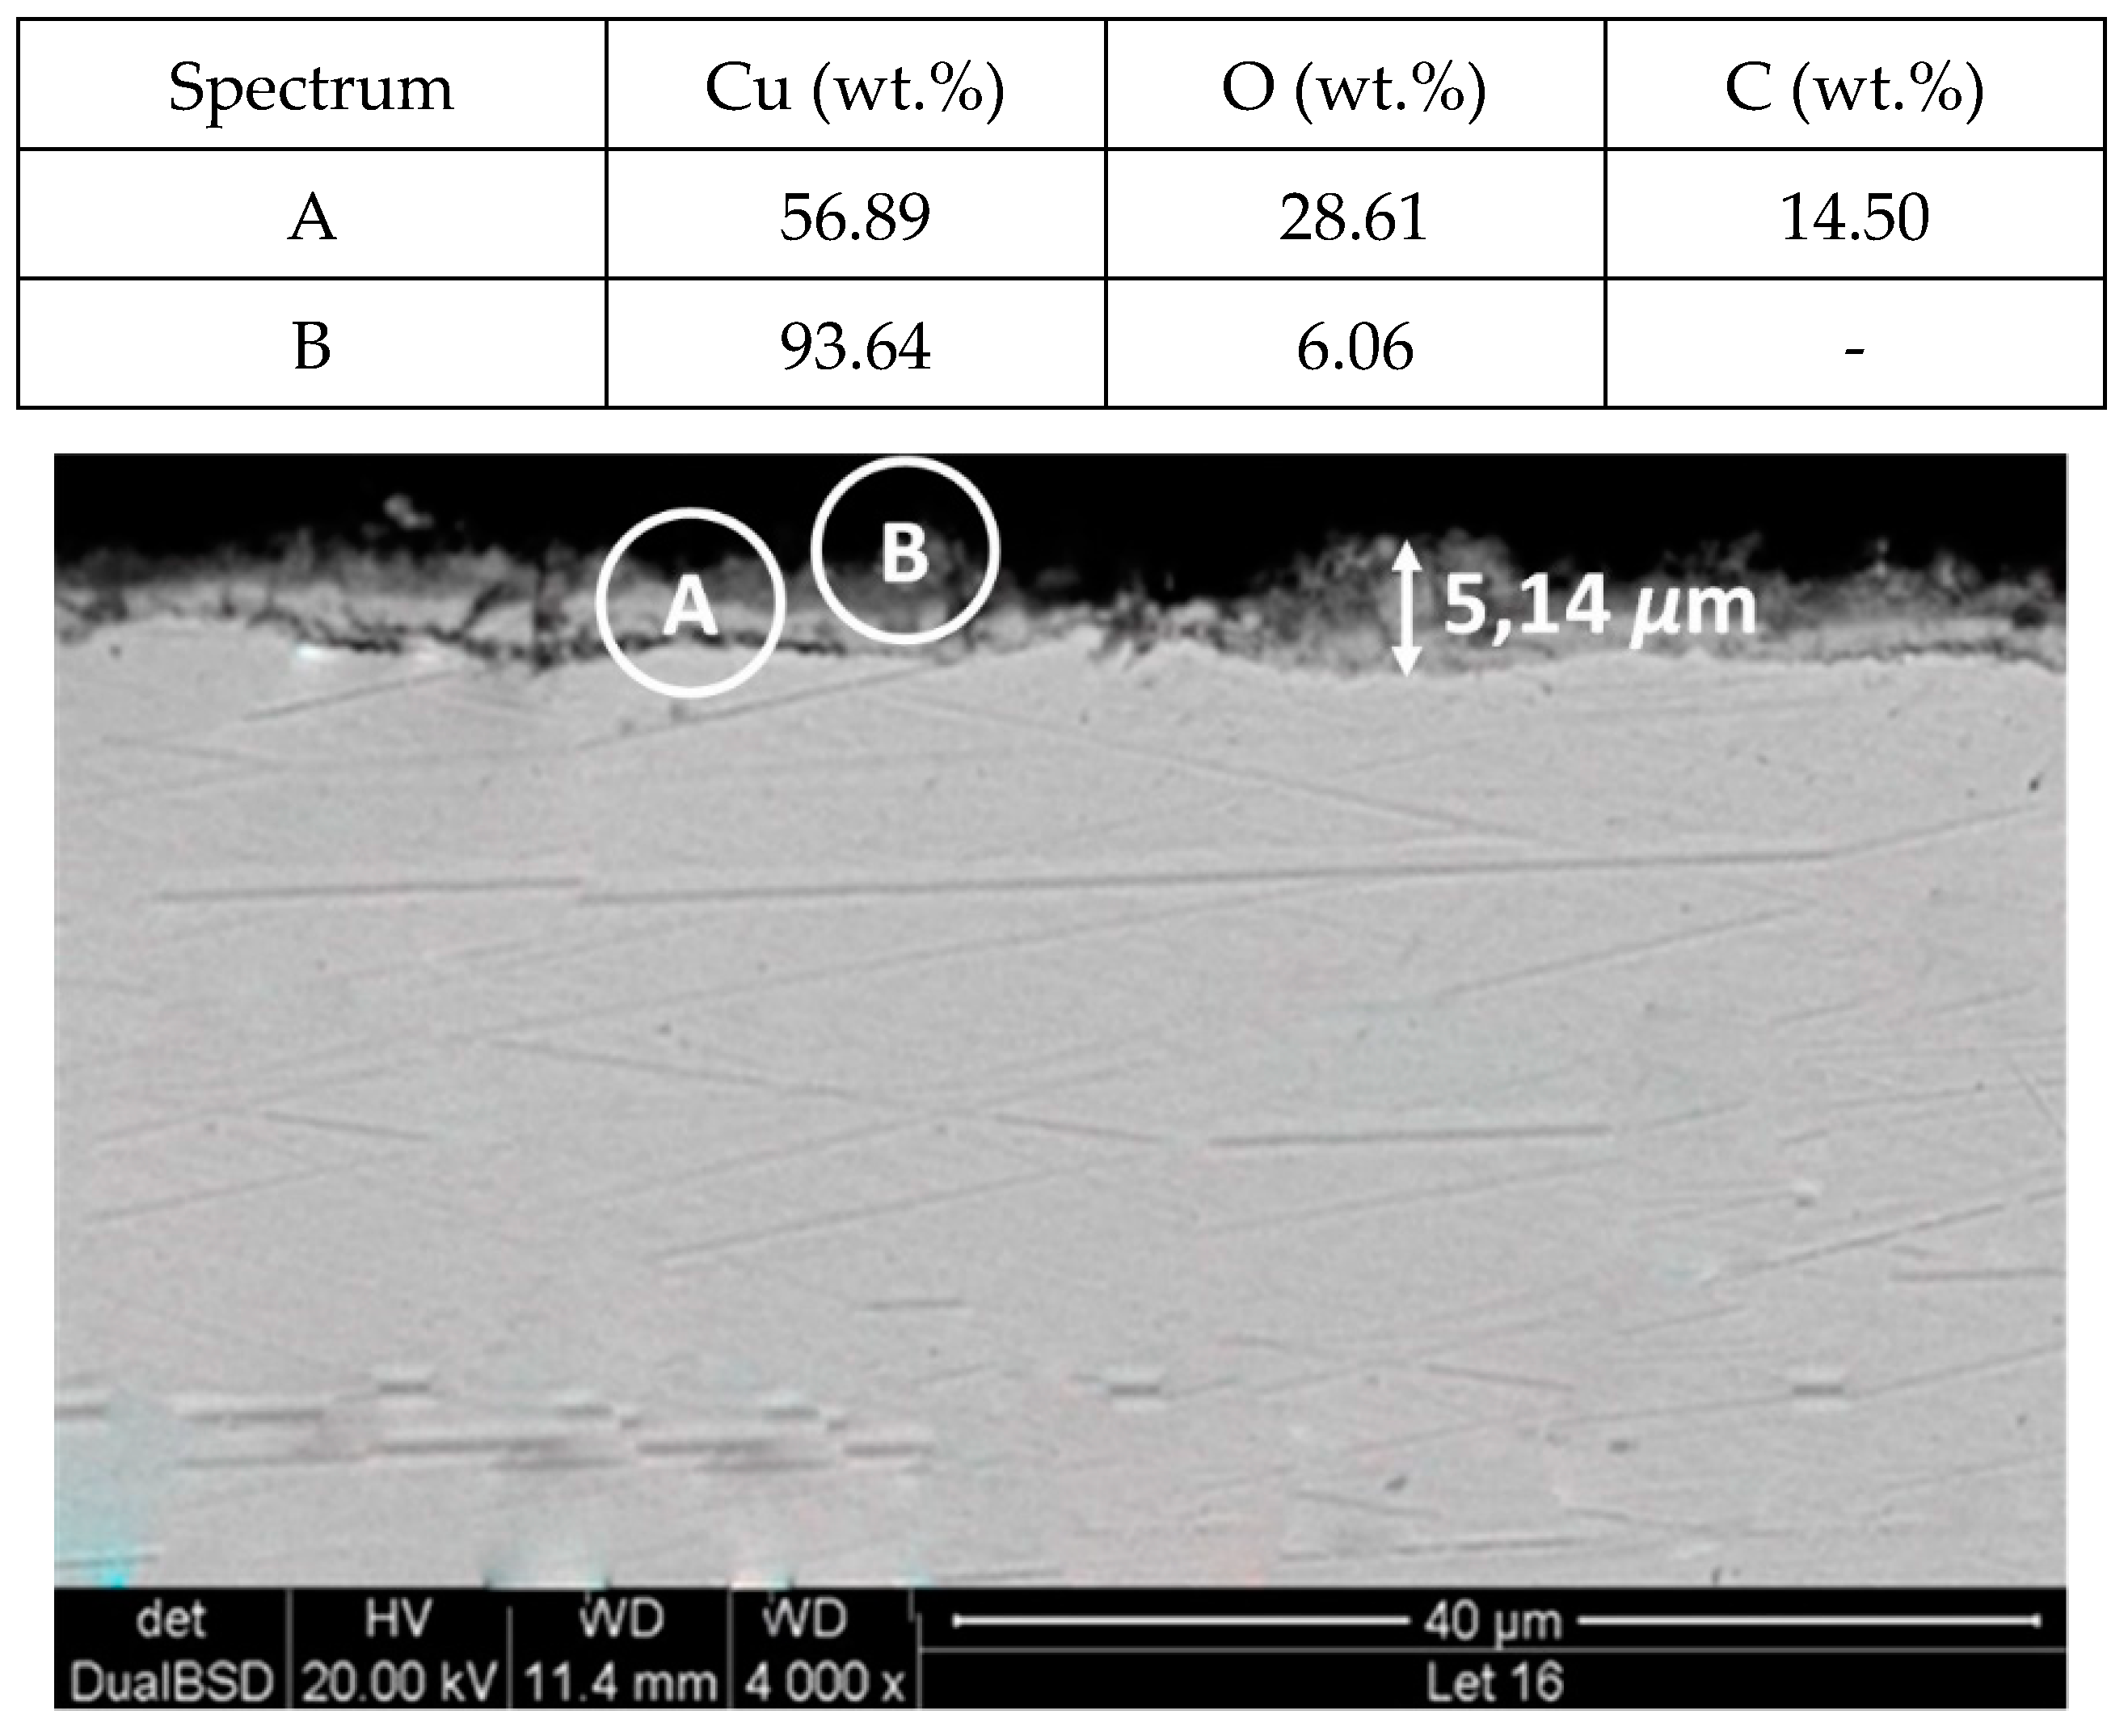
Figure 8.
Detail (lower) and EDX analysis (upper) of the copper specimen cross-section after 2000 h immersed in solar salt.
Figure 8.
Detail (lower) and EDX analysis (upper) of the copper specimen cross-section after 2000 h immersed in solar salt.
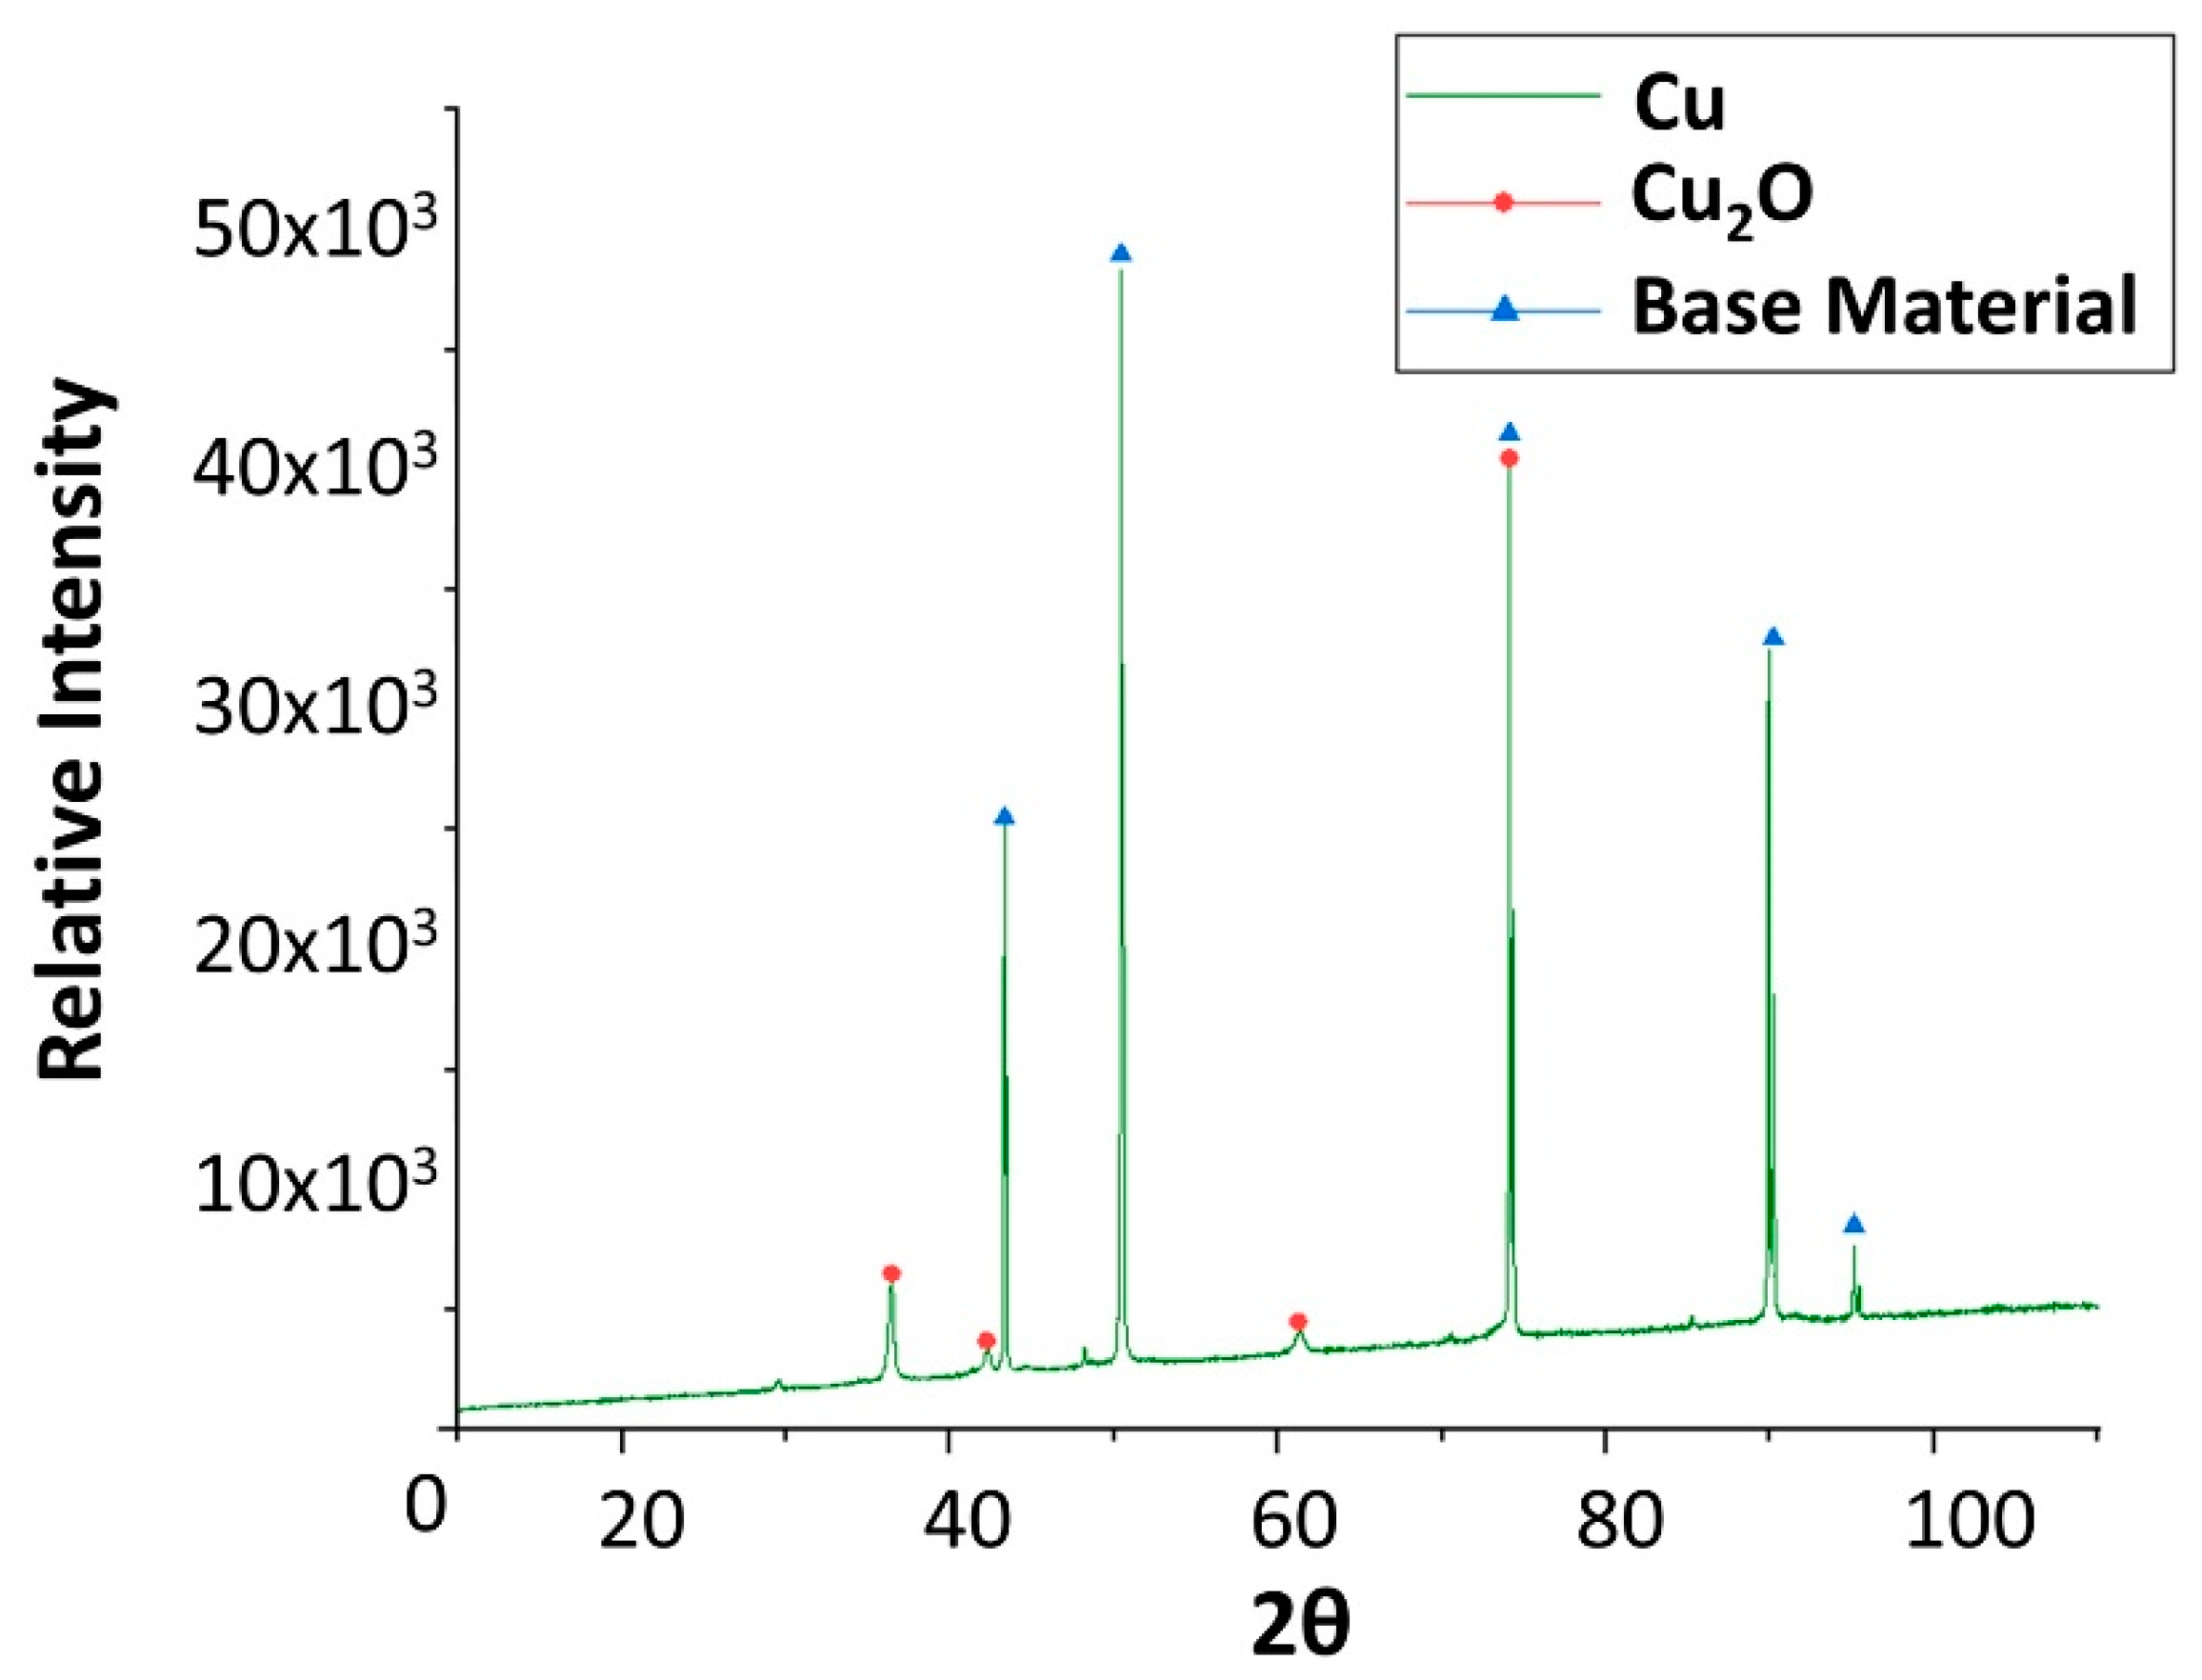
Figure 9.
X-ray diffraction analysis of the copper specimen after 4 weeks immersed in solar salt.
Figure 9.
X-ray diffraction analysis of the copper specimen after 4 weeks immersed in solar salt.
Figure 10.
Gravimetric weight loss curve obtained for copper, aluminium, and stainless and carbon steel when immersed in myo-inositol at 250 °C.
Figure 10.
Gravimetric weight loss curve obtained for copper, aluminium, and stainless and carbon steel when immersed in myo-inositol at 250 °C.
Figure 11.
Detail (lower) and EDX analysis (upper) of the aluminium specimen surface after 2000 h immersed in myo-inositol.
Figure 11.
Detail (lower) and EDX analysis (upper) of the aluminium specimen surface after 2000 h immersed in myo-inositol.
Figure 12.
Detail (lower) and EDX analysis (upper) of the aluminium specimen cross-section after 2000 h immersed in myo-inositol.
Figure 12.
Detail (lower) and EDX analysis (upper) of the aluminium specimen cross-section after 2000 h immersed in myo-inositol.
Figure 13.
Detail (lower) and EDX analysis (upper) of the stainless steel specimen surface after 2000 h immersed in myo-inositol.
Figure 13.
Detail (lower) and EDX analysis (upper) of the stainless steel specimen surface after 2000 h immersed in myo-inositol.
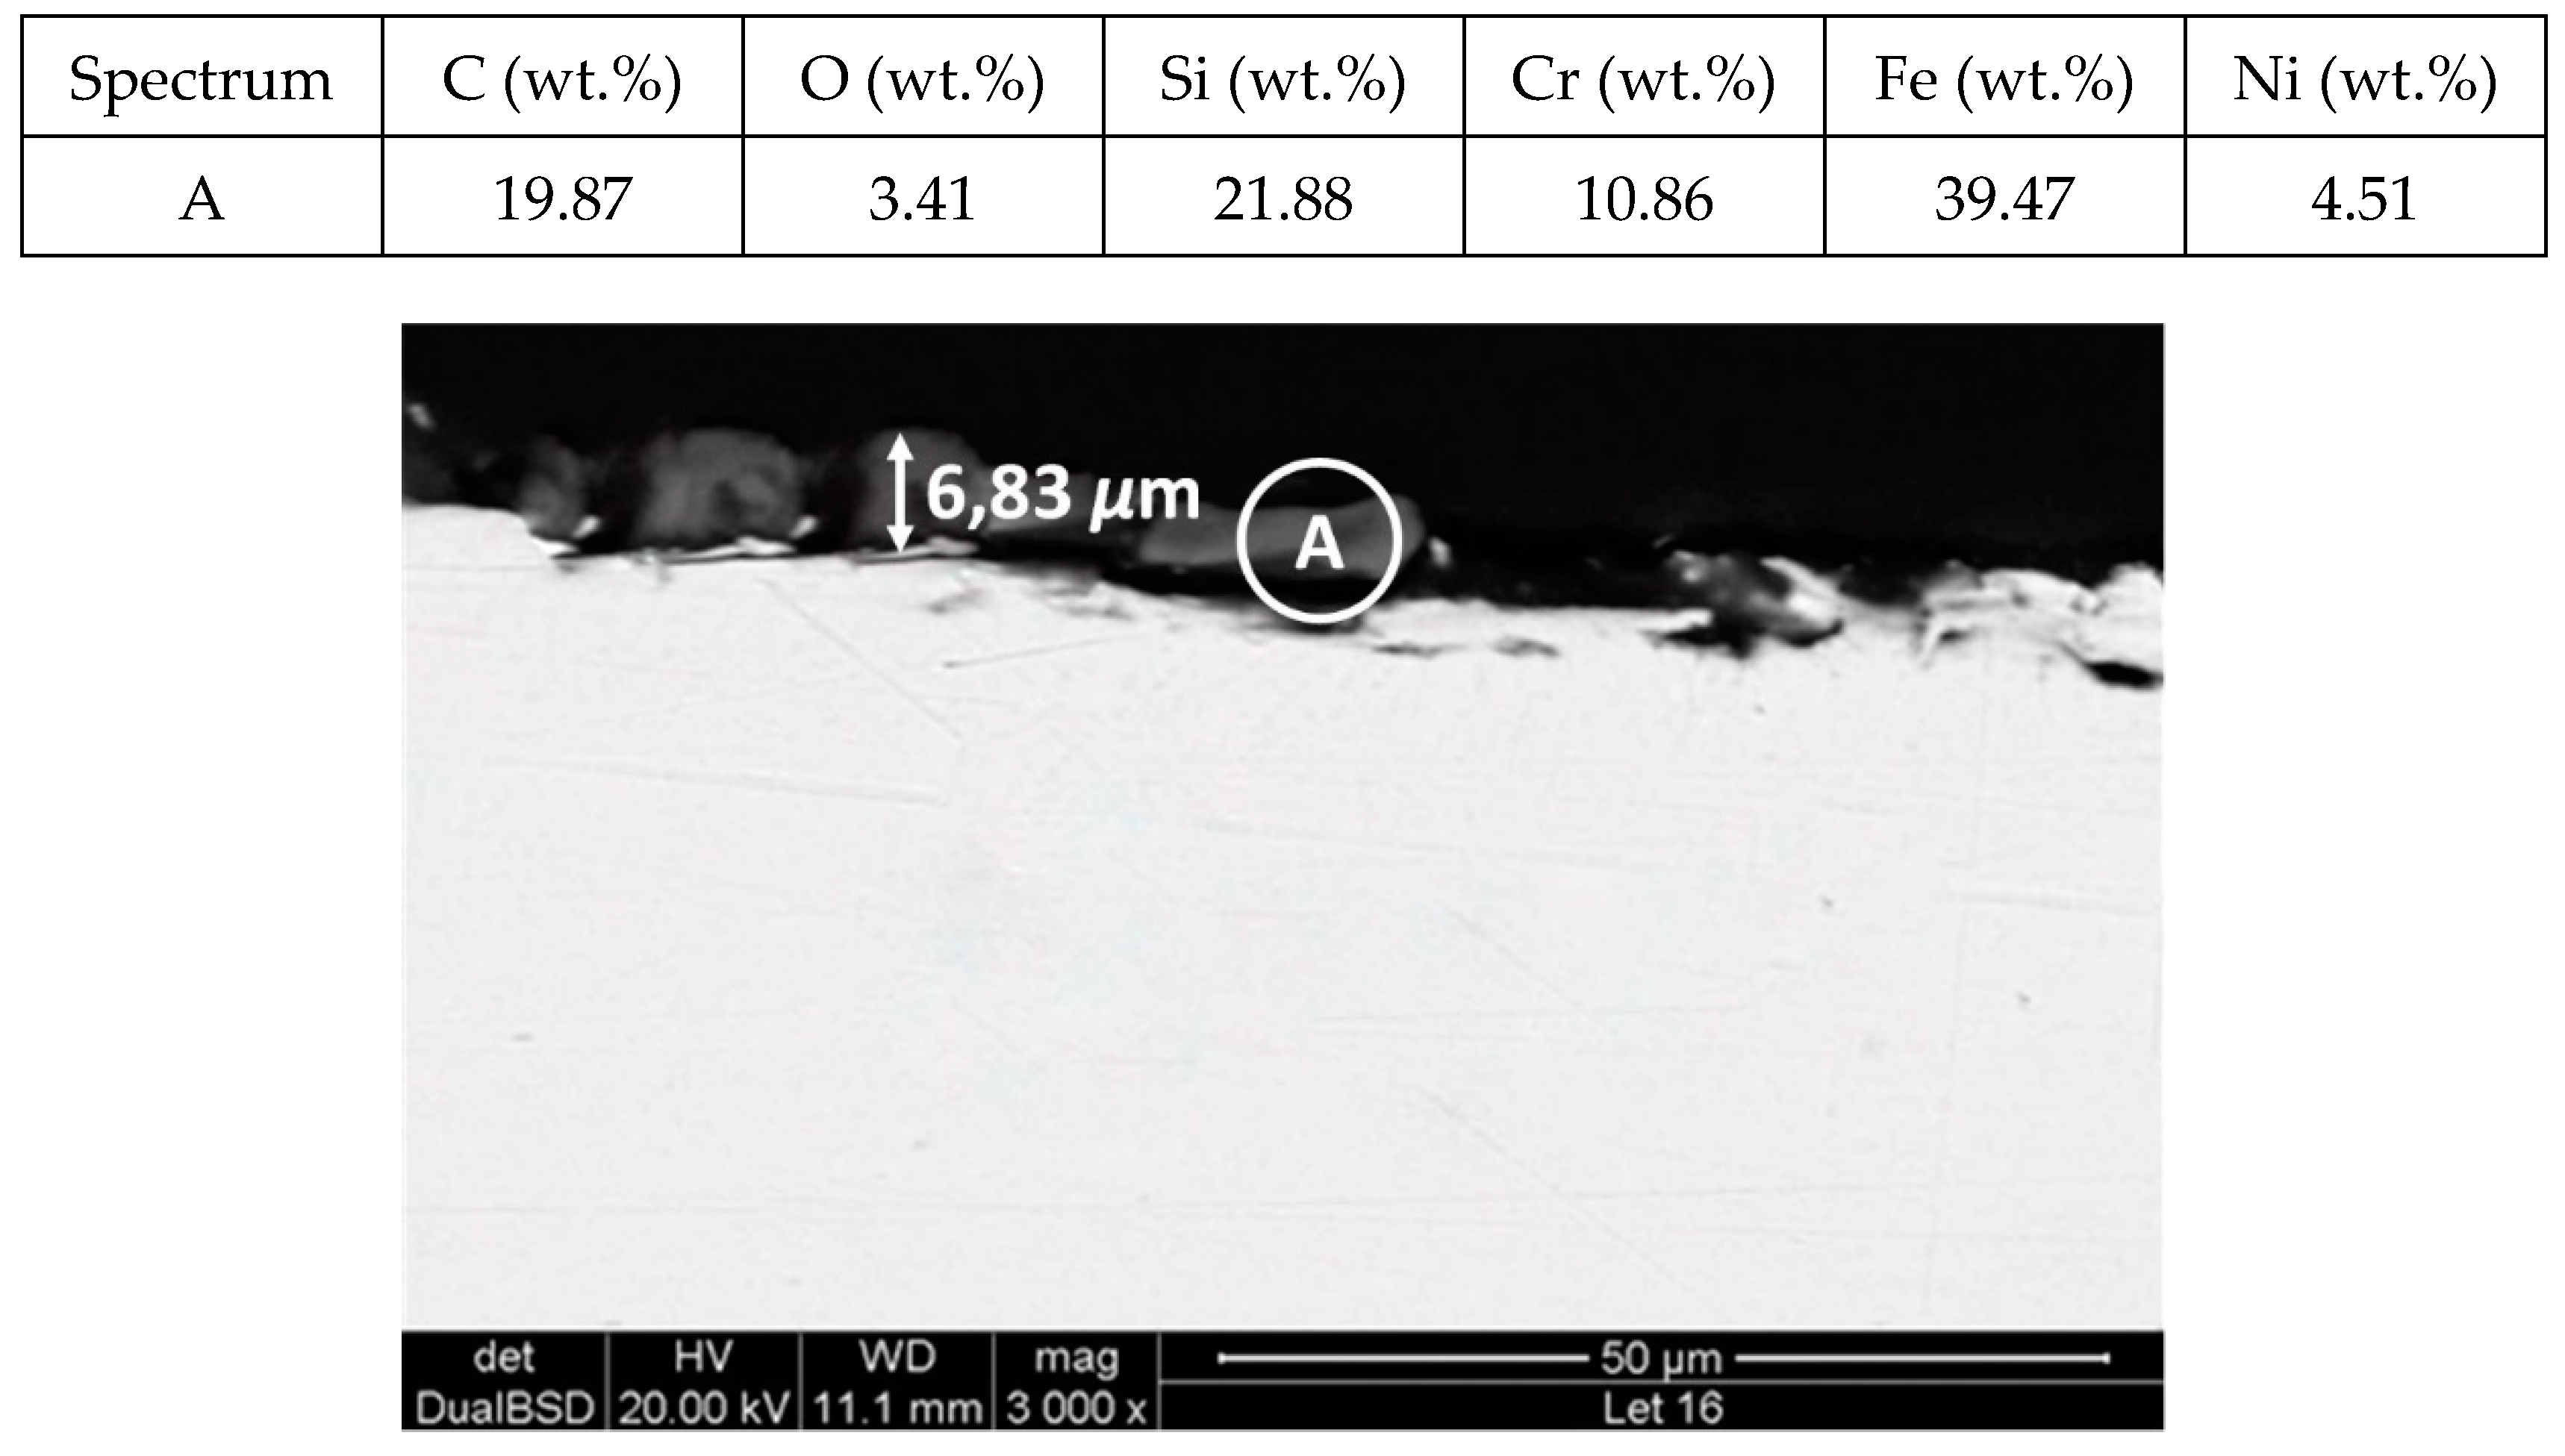
Figure 14.
Detail (lower) and EDX analysis (upper) of the stainless steel specimen cross-section after 2000 h immersed in myo-inositol.
Figure 14.
Detail (lower) and EDX analysis (upper) of the stainless steel specimen cross-section after 2000 h immersed in myo-inositol.
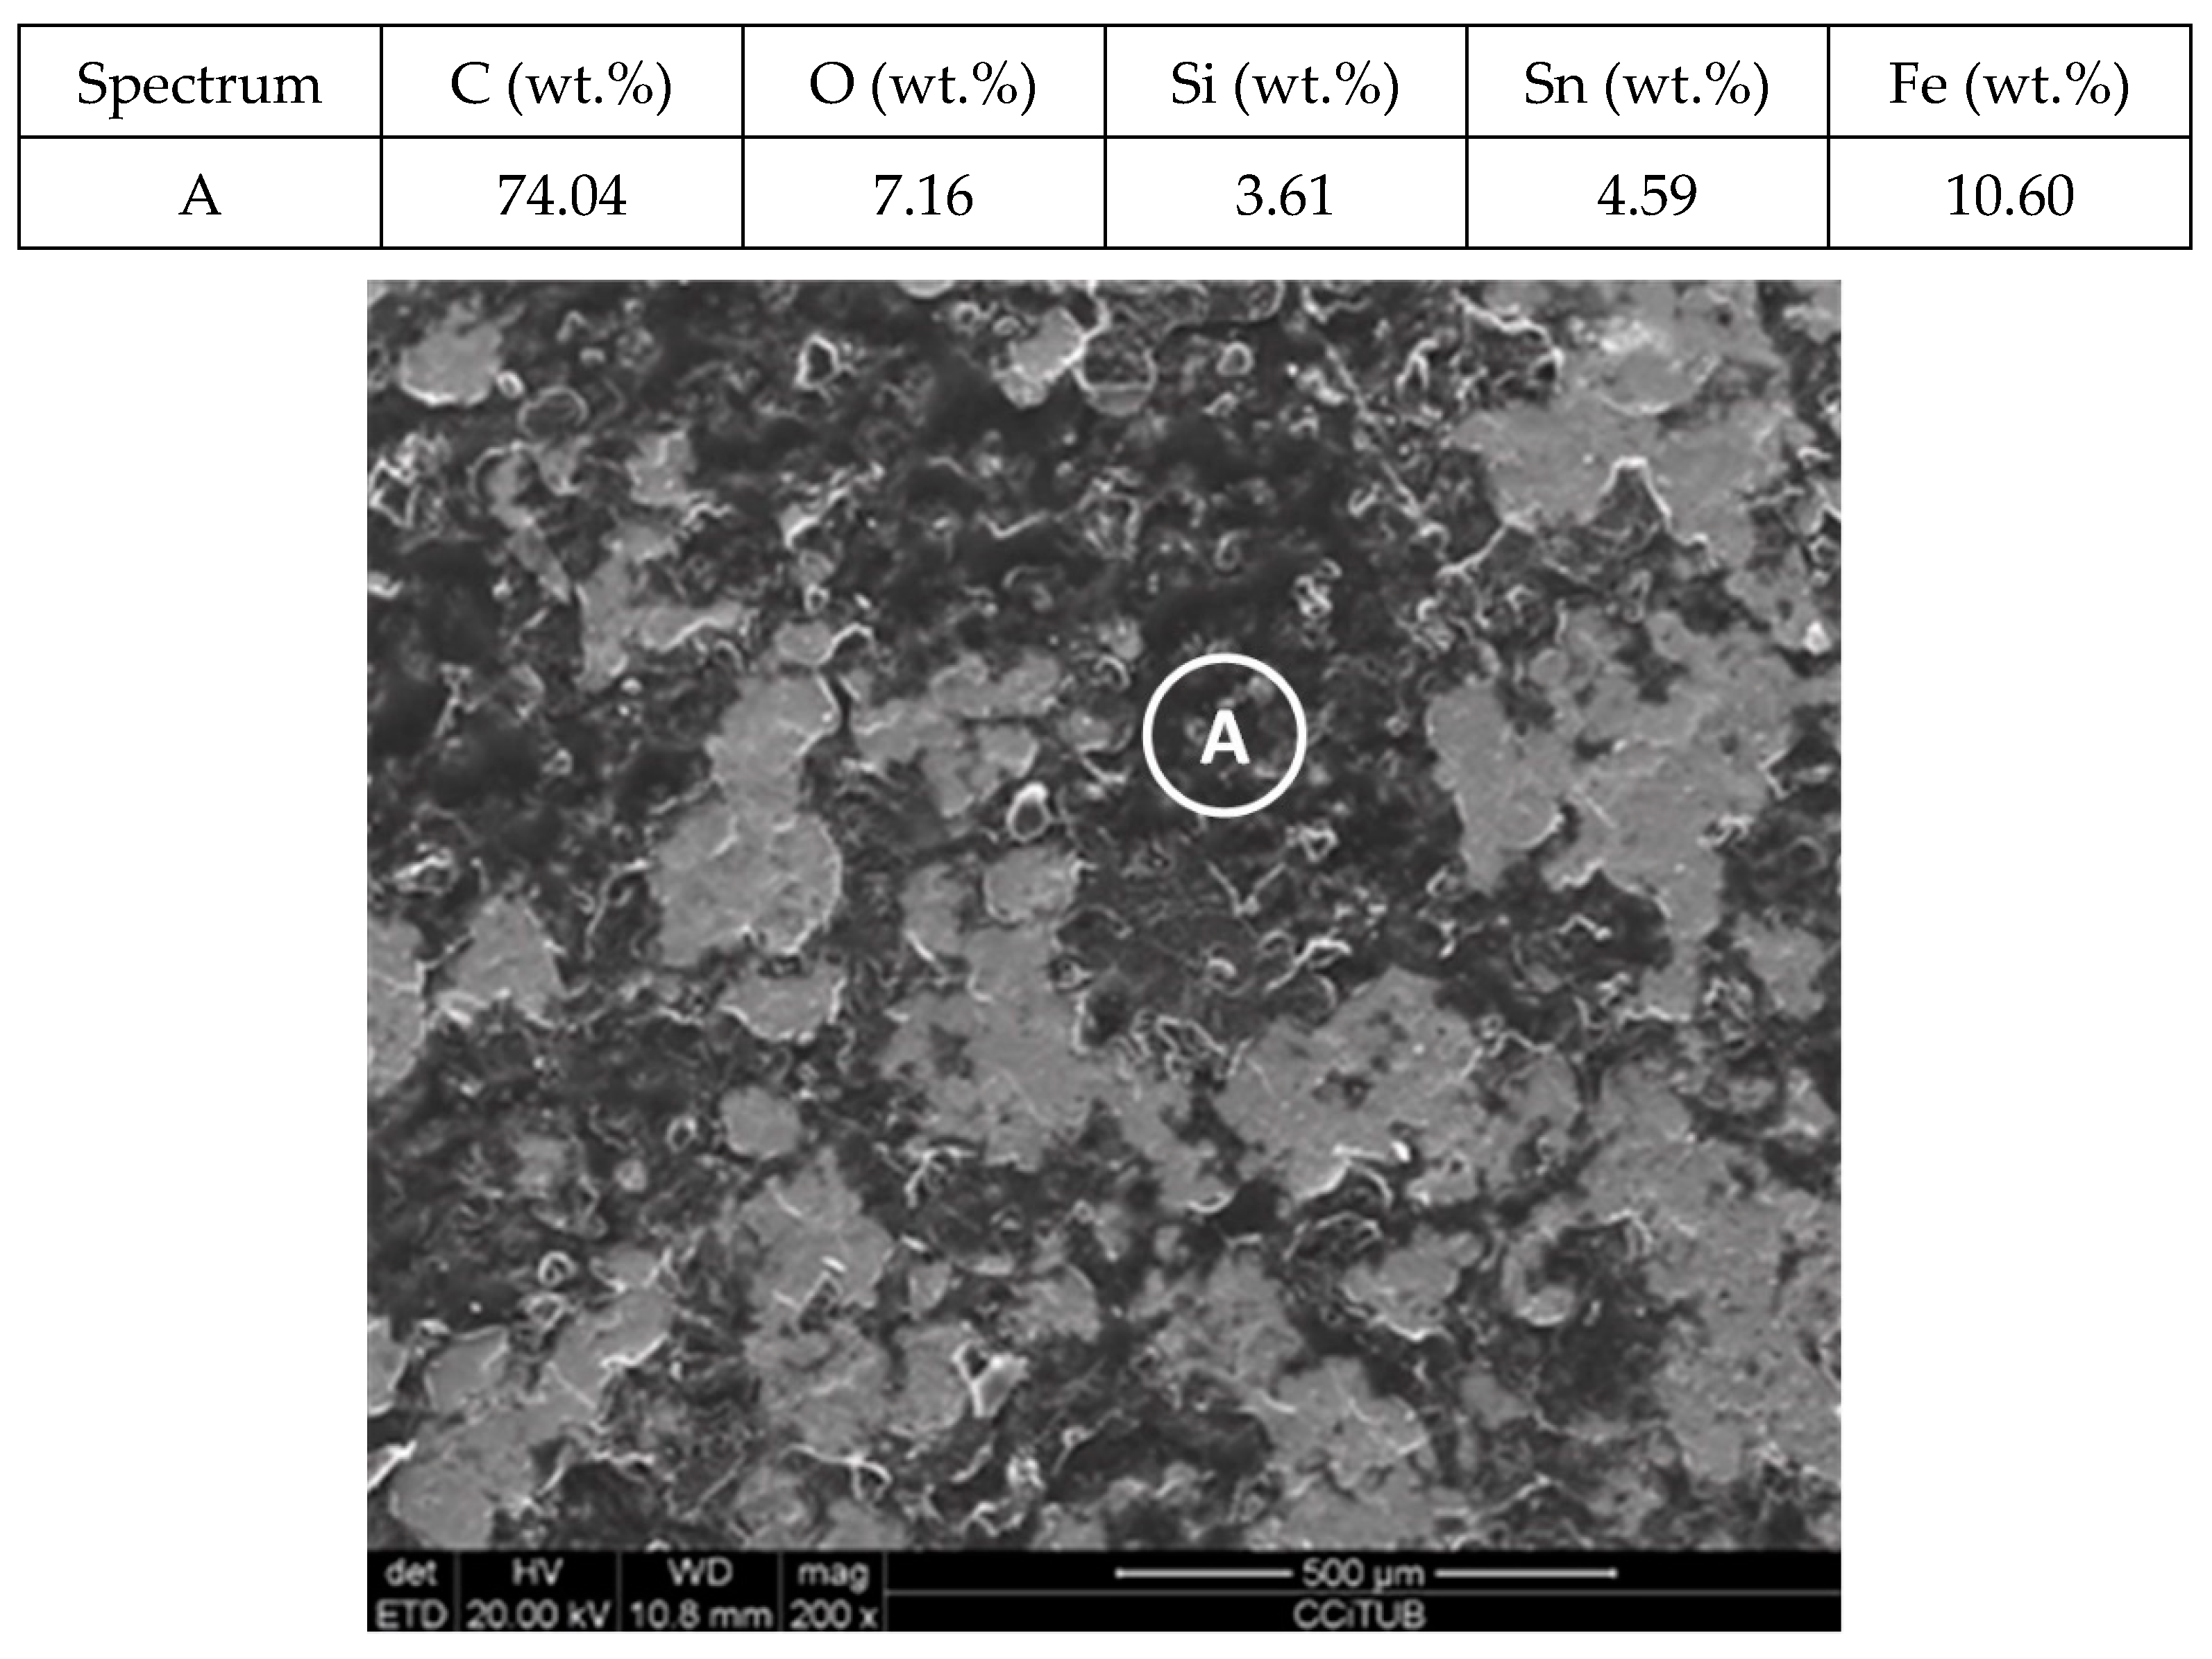
Figure 15.
Detail (lower) and EDX analysis (upper) of the carbon steel specimen surface after 2000 h immersed in myo-inositol.
Figure 15.
Detail (lower) and EDX analysis (upper) of the carbon steel specimen surface after 2000 h immersed in myo-inositol.
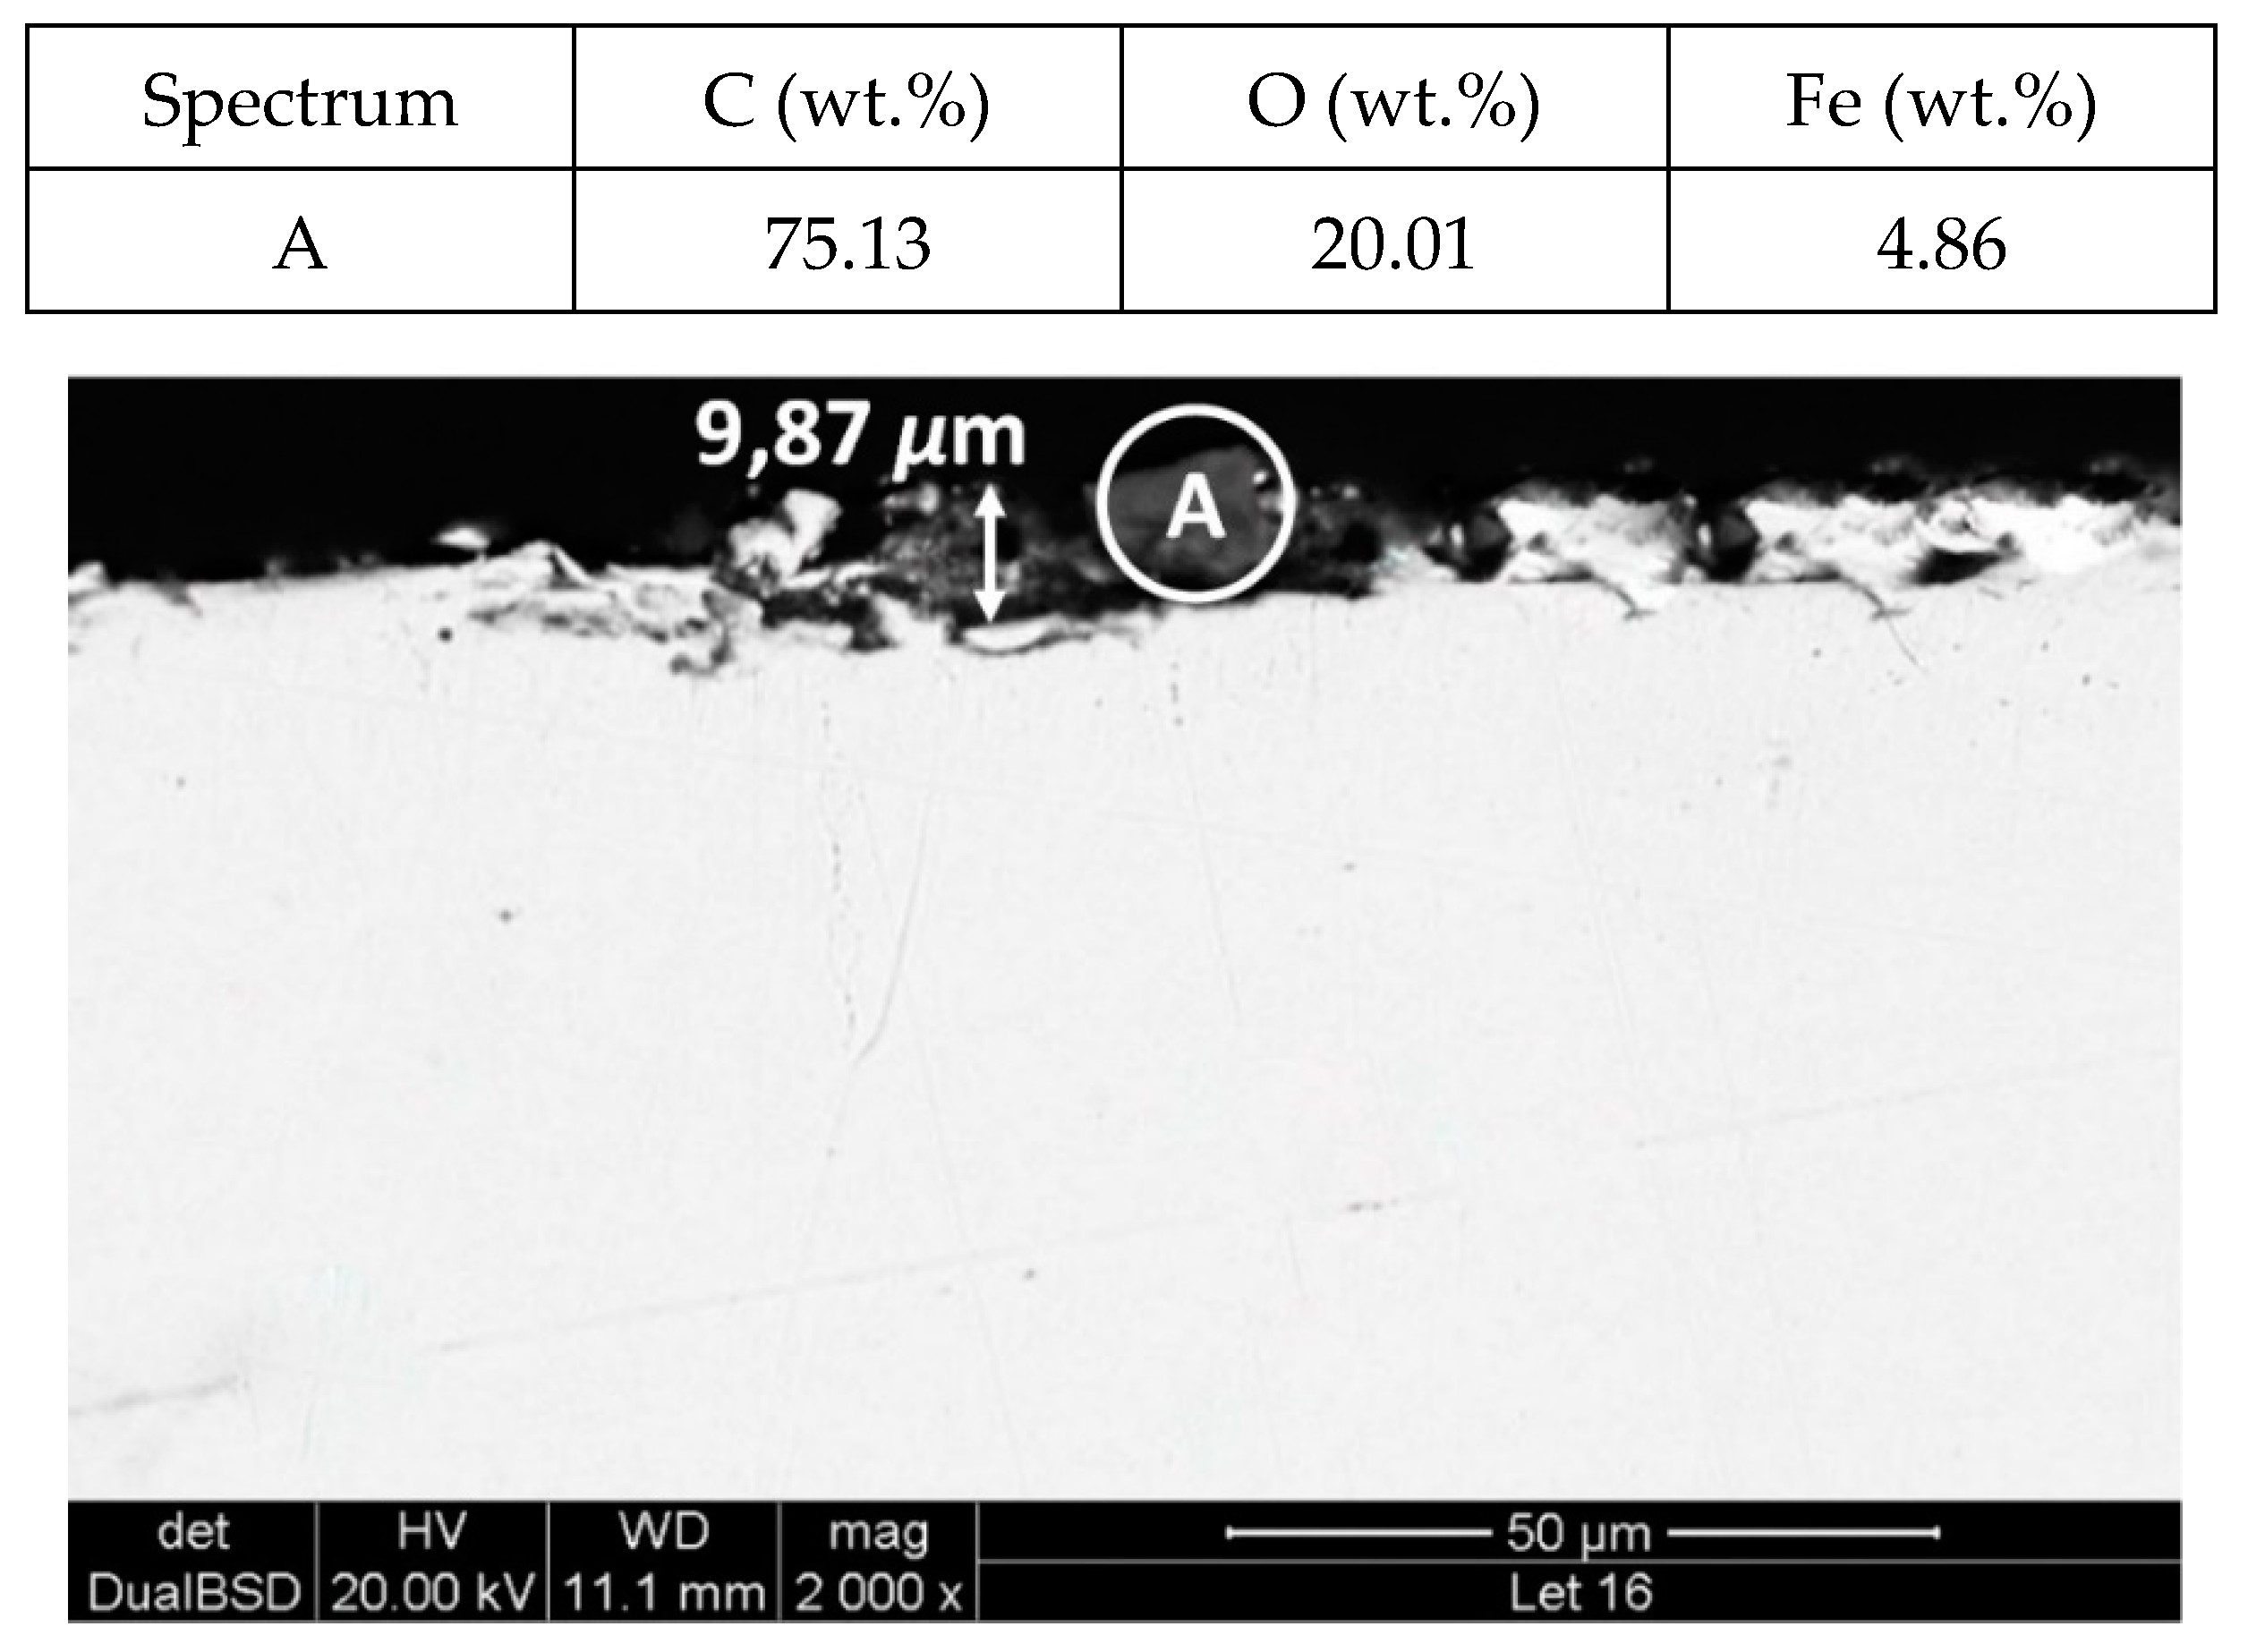
Figure 16.
Detail (lower) and EDX analysis (upper) of the carbon steel specimen cross-section after 2000 h immersed in myo-inositol.
Figure 16.
Detail (lower) and EDX analysis (upper) of the carbon steel specimen cross-section after 2000 h immersed in myo-inositol.
Figure 17.
Detail (lower) and EDX analysis (upper) of the copper specimen surface after 2000 h immersed in myo-inositol.
Figure 17.
Detail (lower) and EDX analysis (upper) of the copper specimen surface after 2000 h immersed in myo-inositol.
Figure 18.
Detail (lower) and EDX analysis (upper) of the copper specimen cross-section after 2000 h immersed in myo-inositol.
Figure 18.
Detail (lower) and EDX analysis (upper) of the copper specimen cross-section after 2000 h immersed in myo-inositol.
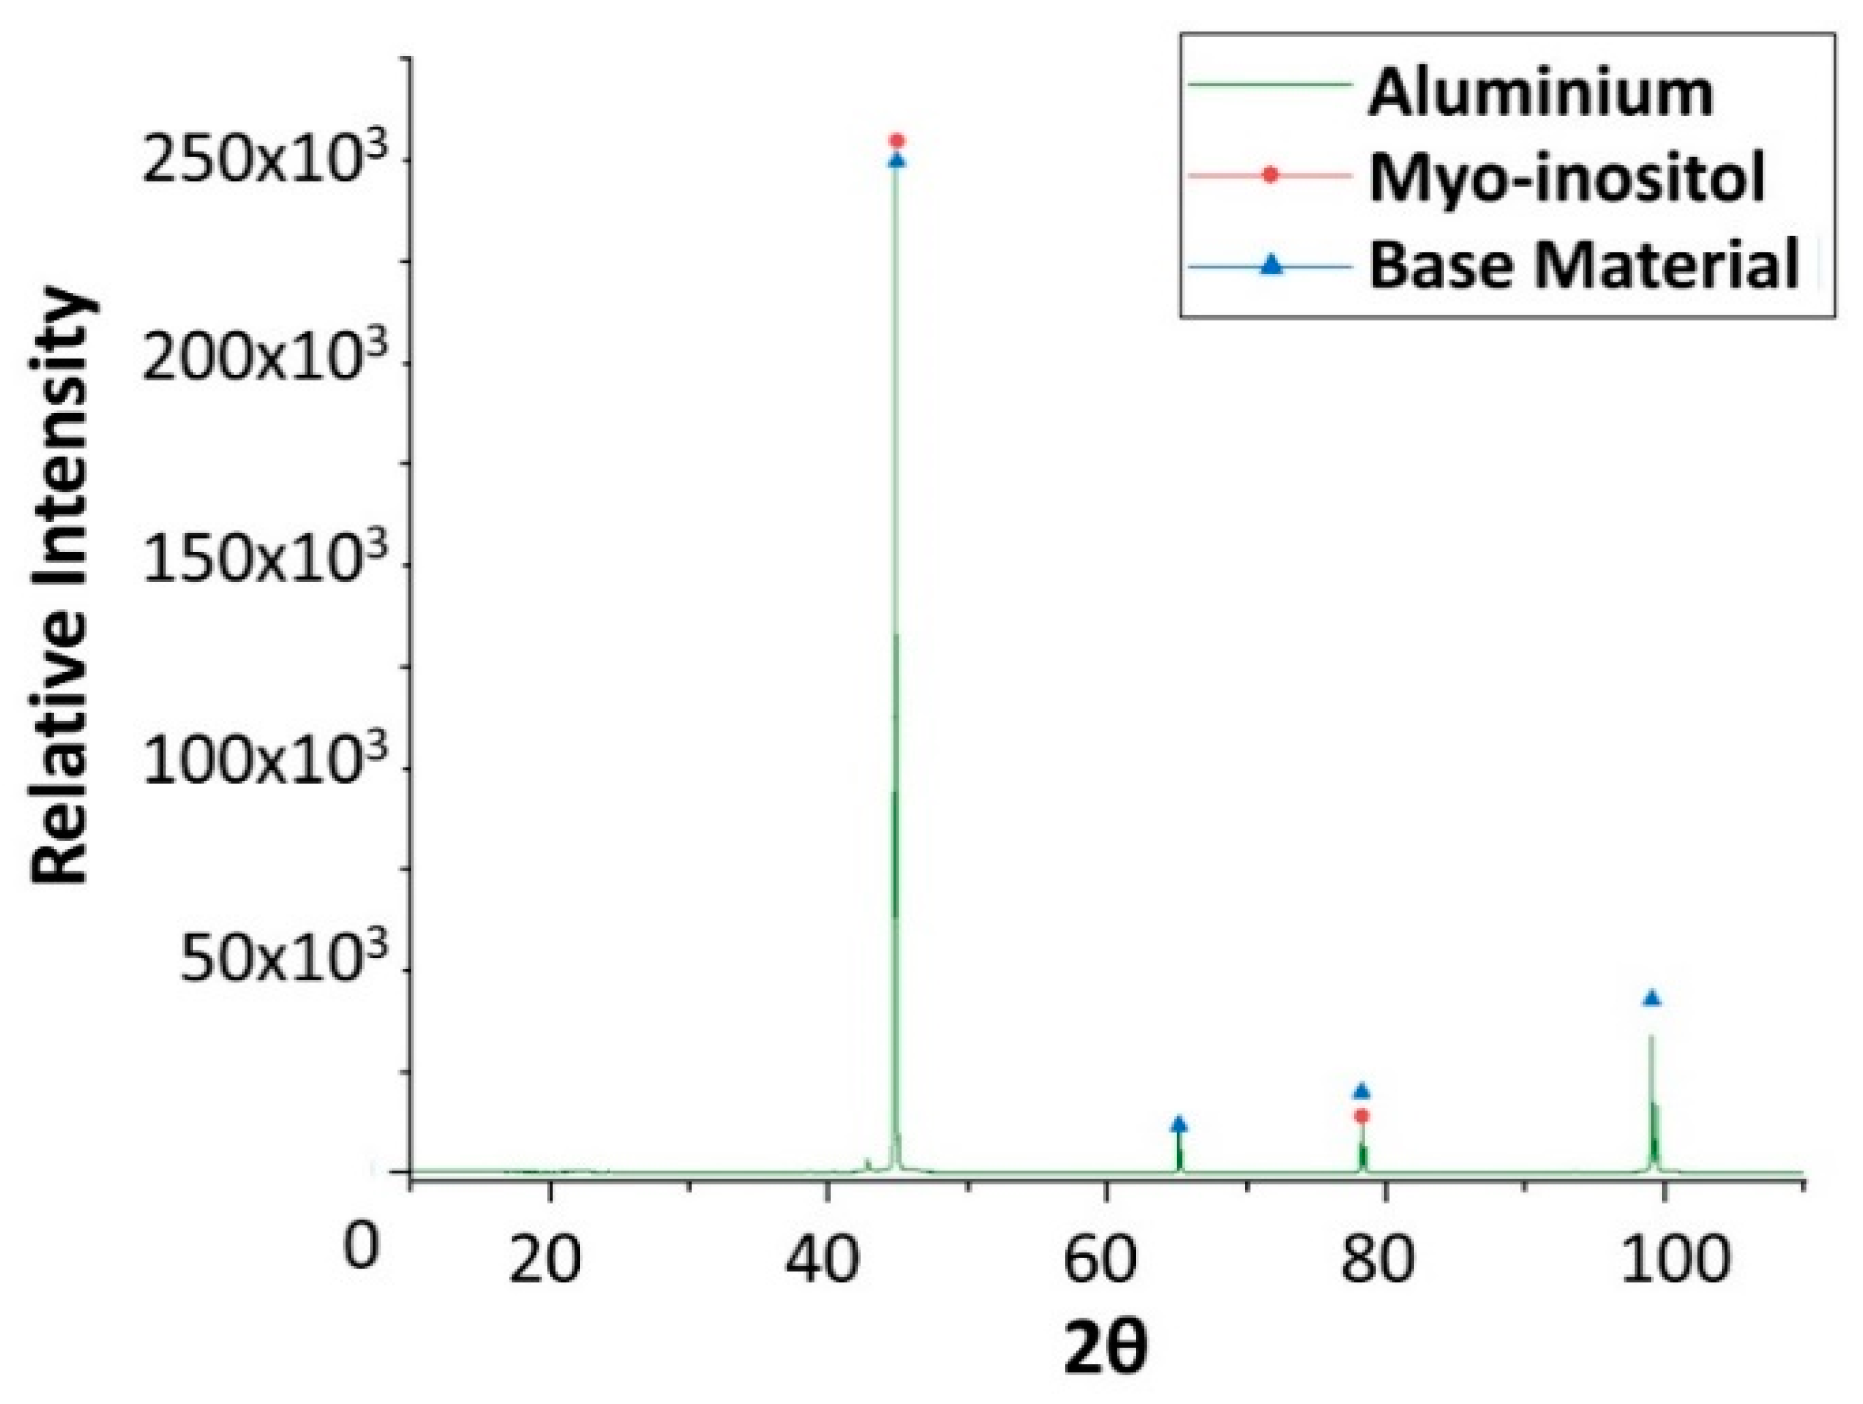
Figure 19.
X-ray diffraction analysis of the aluminium specimen after 4 weeks immersed in myo-inositol.
Figure 19.
X-ray diffraction analysis of the aluminium specimen after 4 weeks immersed in myo-inositol.
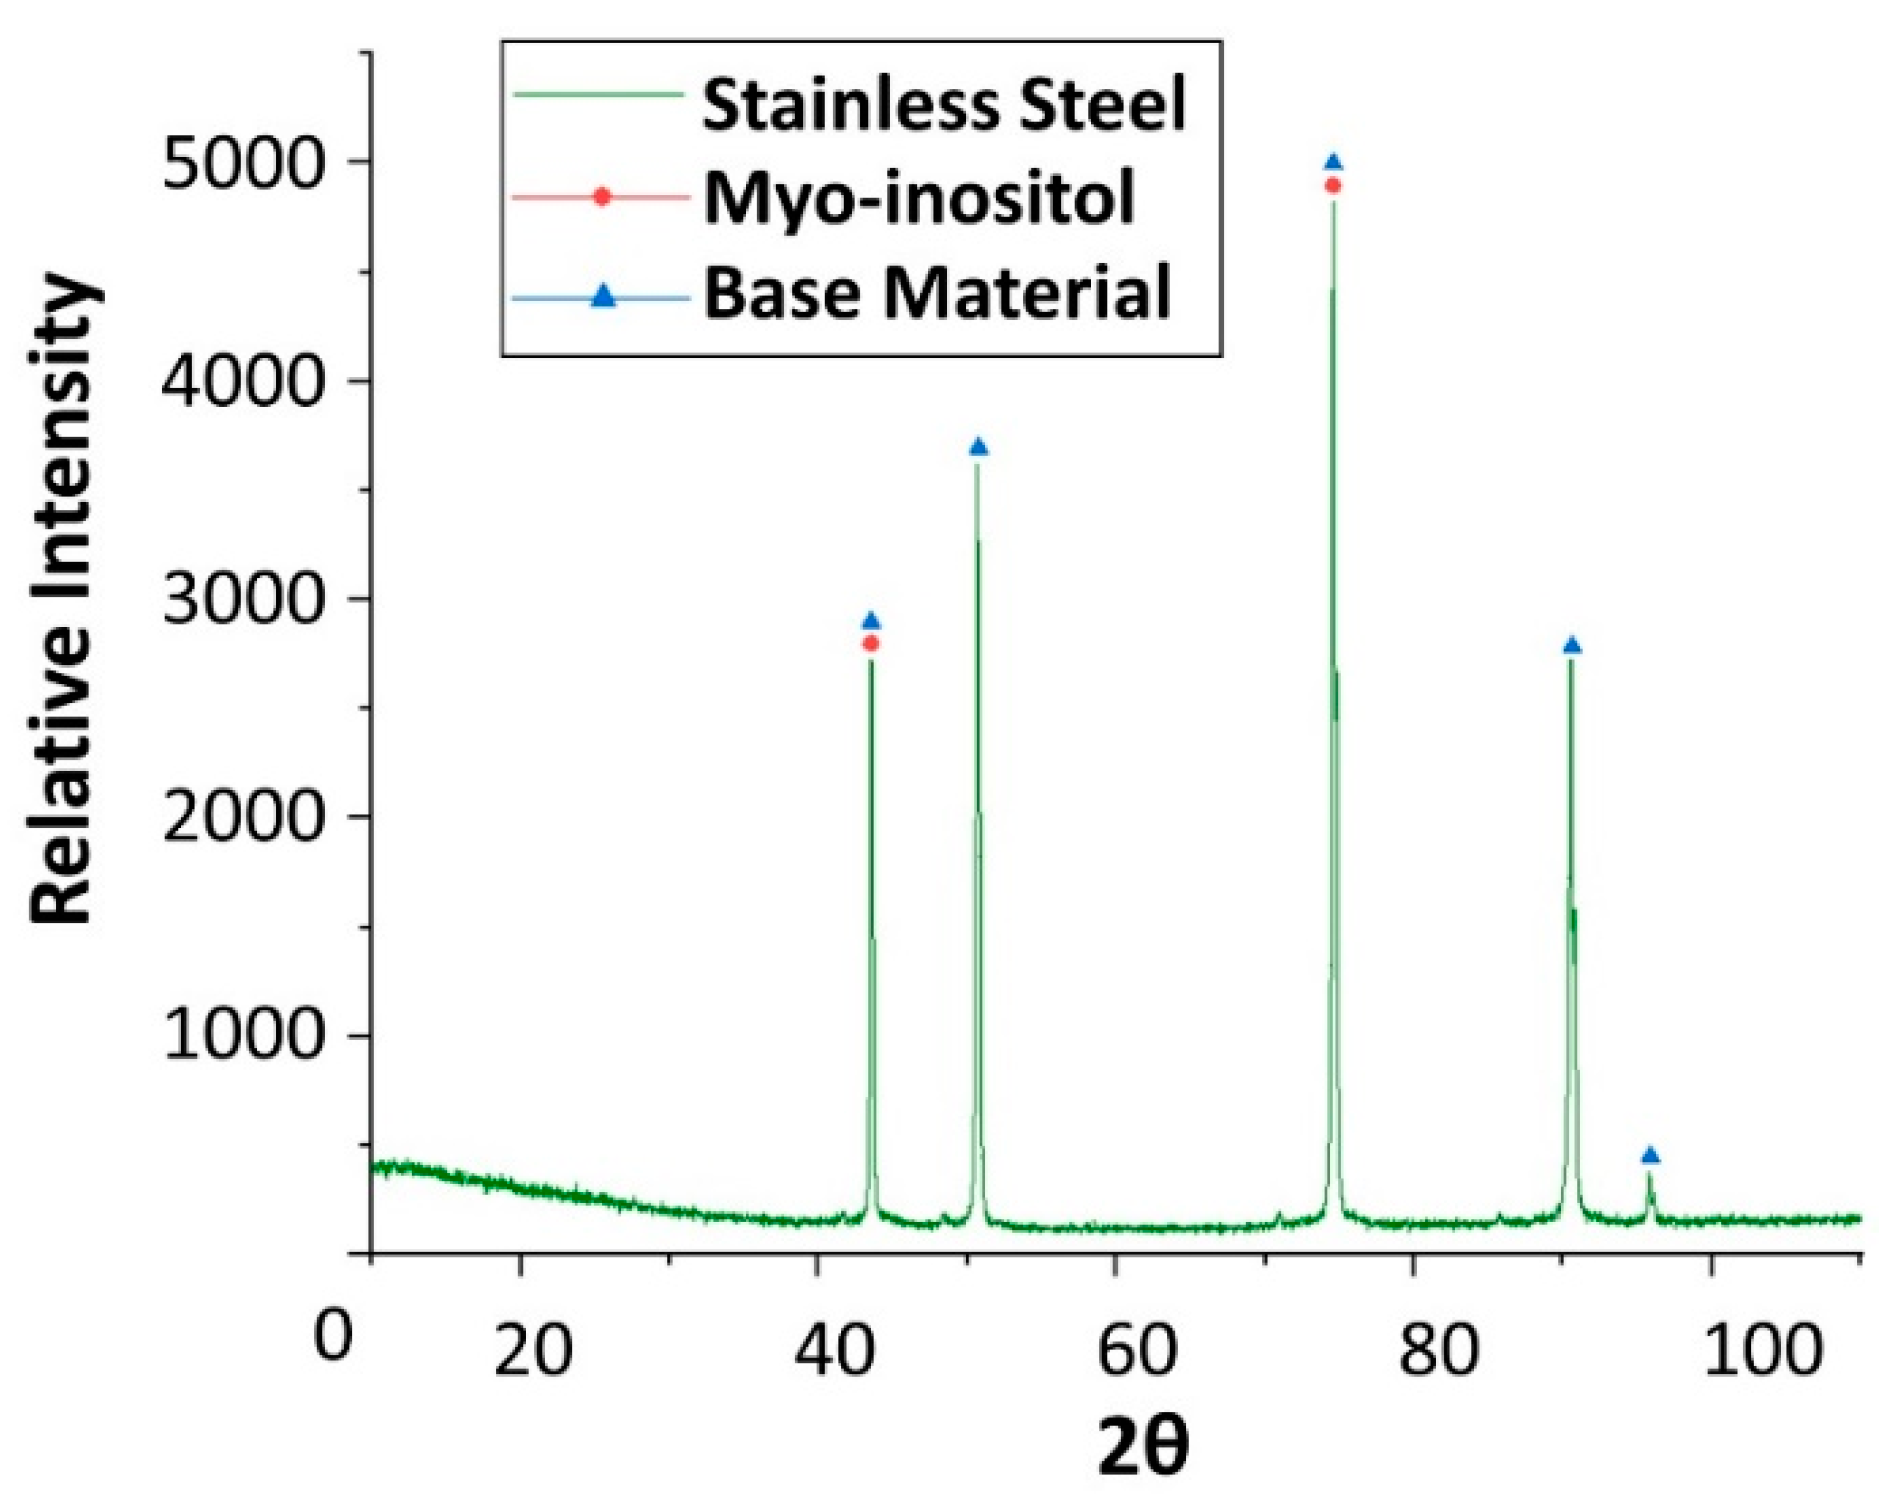
Figure 20.
X-ray diffraction analysis of the stainless steel SS304 specimen after 4 weeks immersed in myo-inositol.
Figure 20.
X-ray diffraction analysis of the stainless steel SS304 specimen after 4 weeks immersed in myo-inositol.
Figure 21.
X-ray diffraction analysis of the carbon steel AISI 1090 specimen after 4 weeks immersed in myo-inositol.
Figure 21.
X-ray diffraction analysis of the carbon steel AISI 1090 specimen after 4 weeks immersed in myo-inositol.
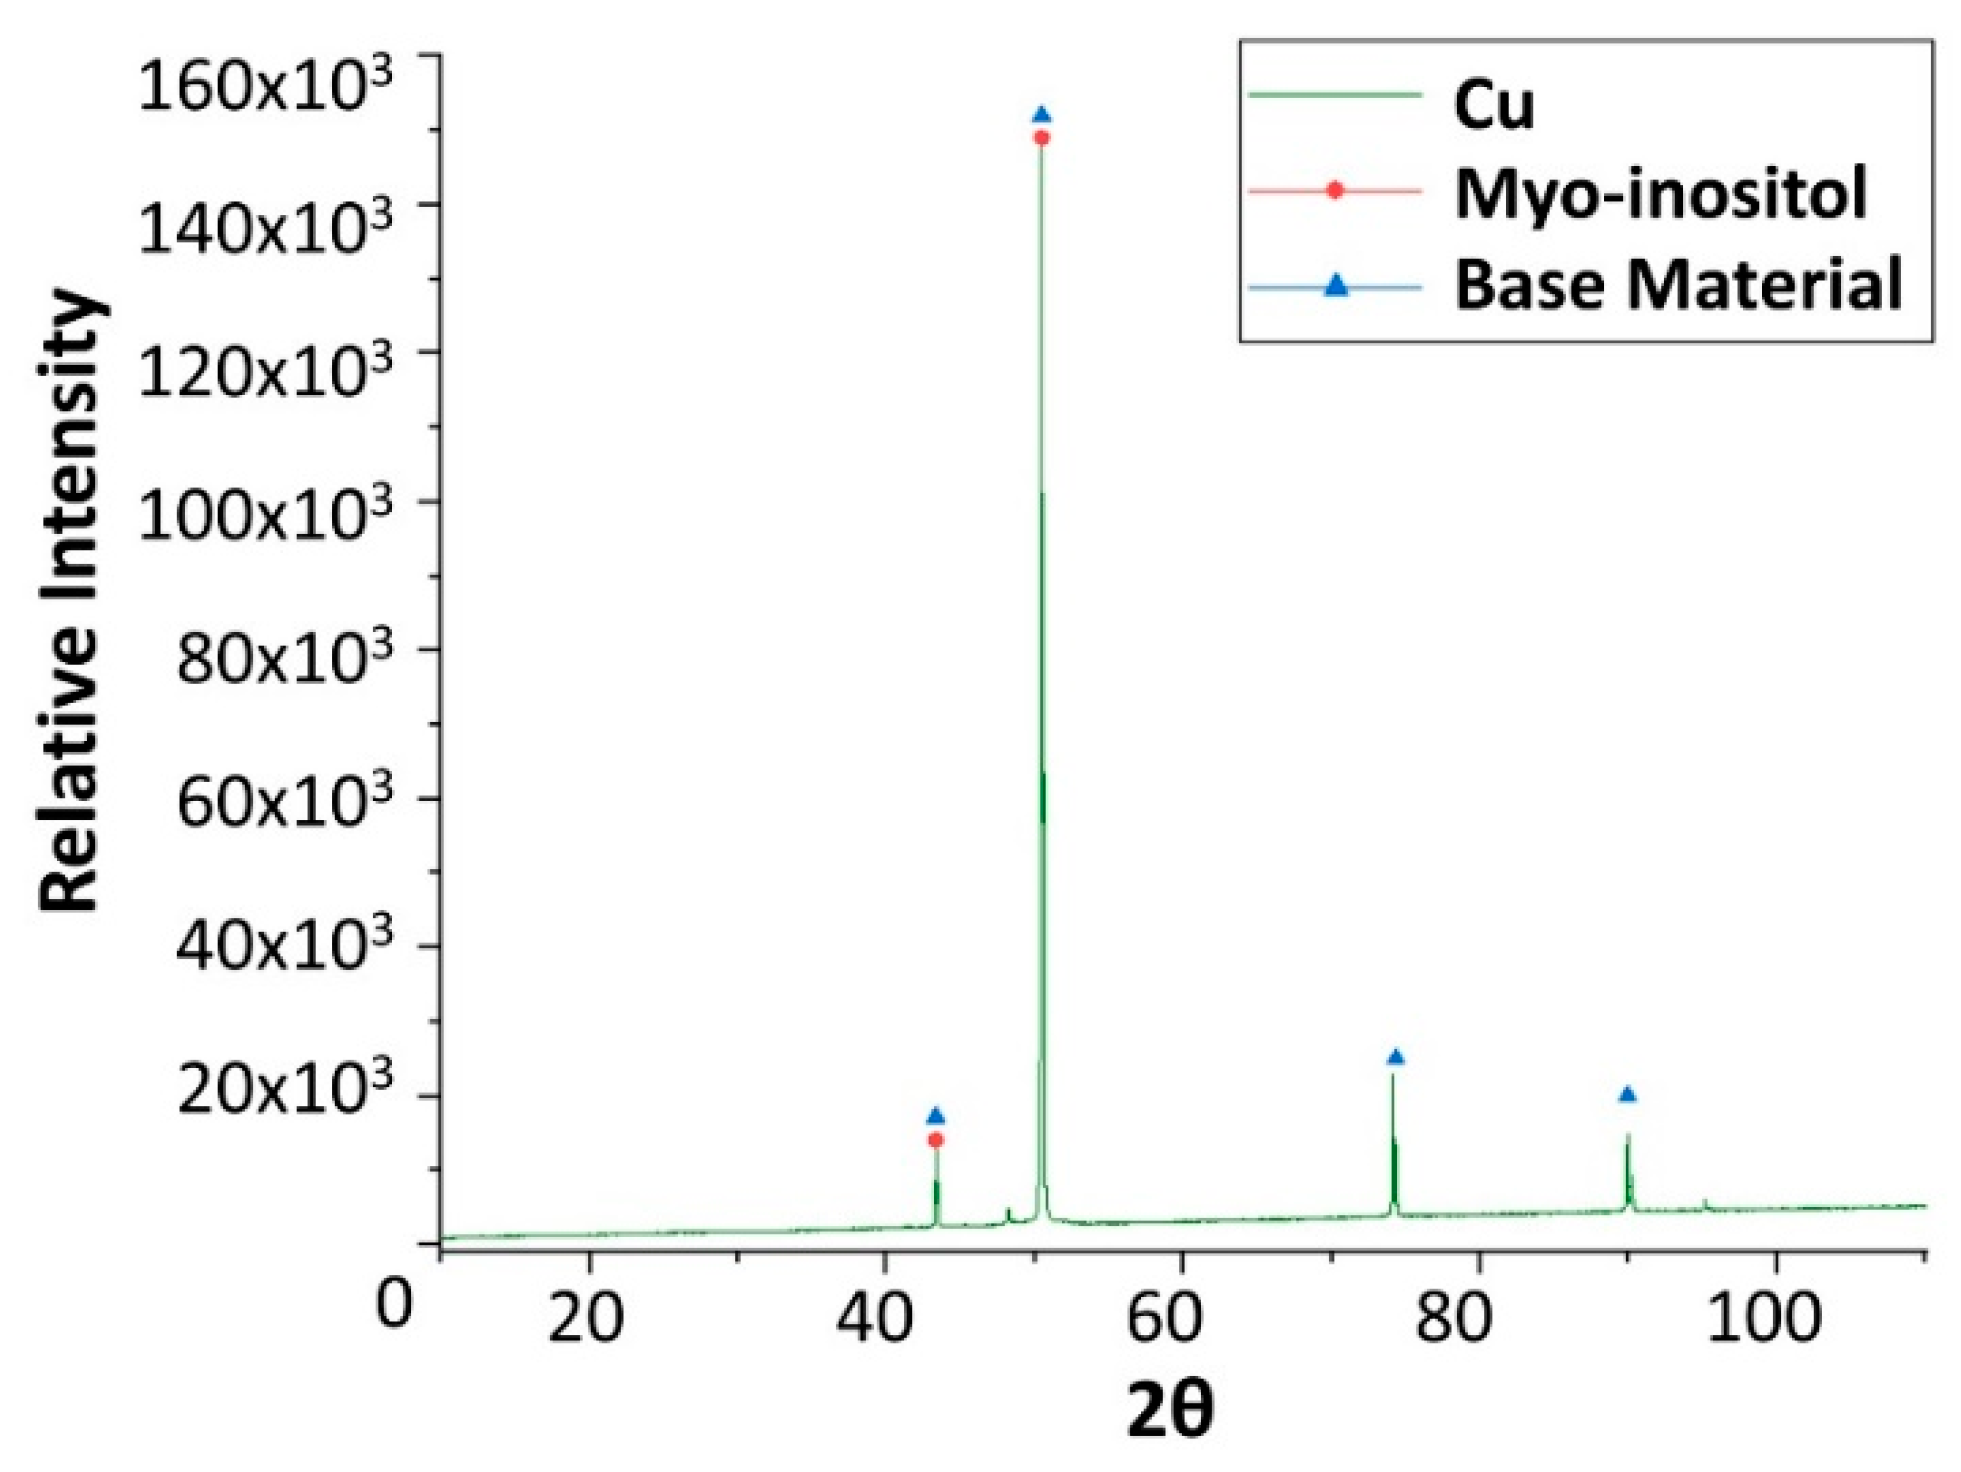
Figure 22.
X-ray diffraction analysis of the copper specimen after 4 weeks immersed in myo-inositol.
Figure 22.
X-ray diffraction analysis of the copper specimen after 4 weeks immersed in myo-inositol.
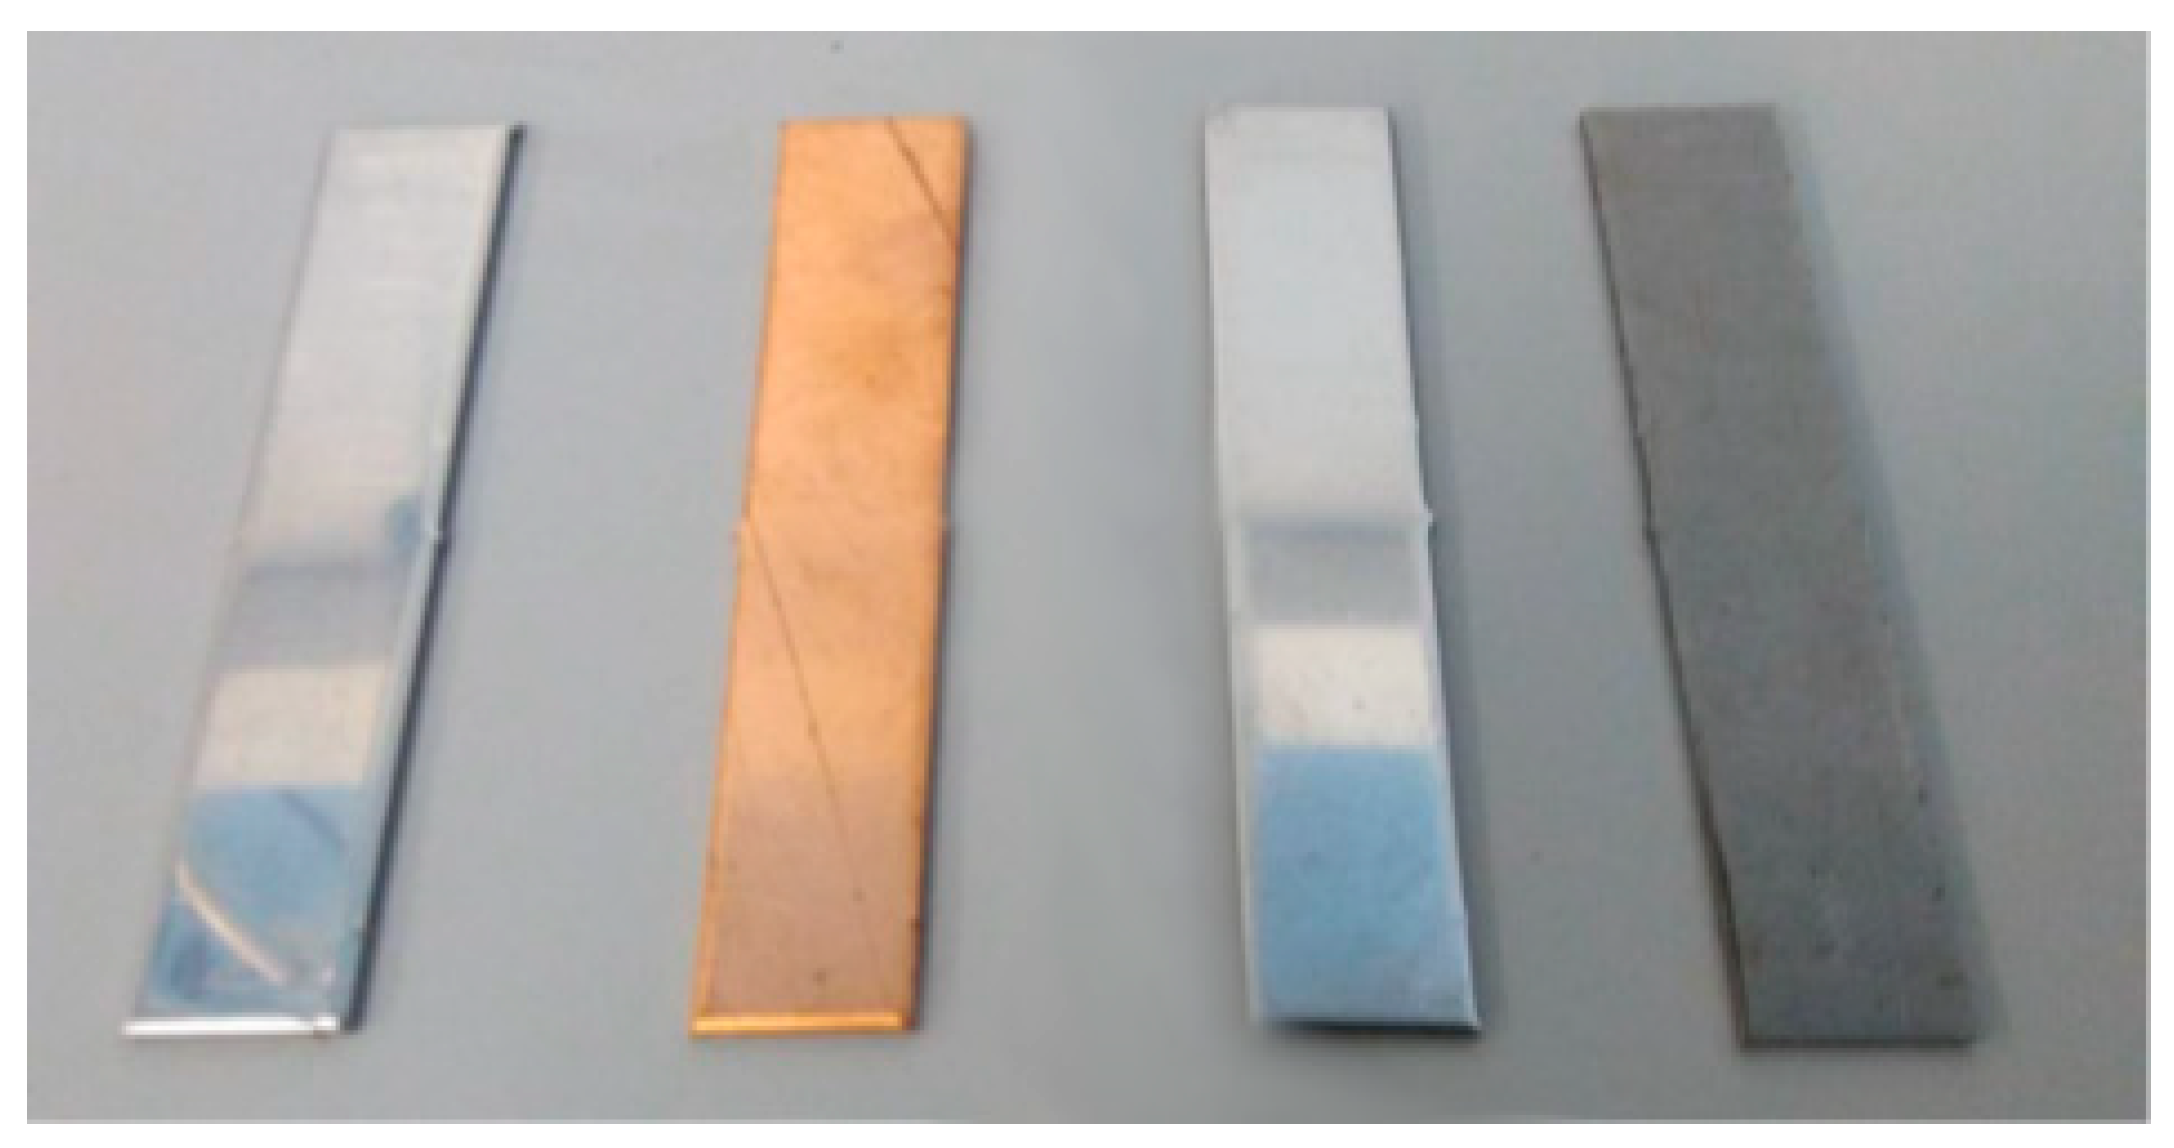
Figure 23.
Metal specimens used in the corrosion tests. From left to right: Aluminium, copper, stainless steel (AISI 304), and carbon steel (AISI 1090).
Figure 23.
Metal specimens used in the corrosion tests. From left to right: Aluminium, copper, stainless steel (AISI 304), and carbon steel (AISI 1090).
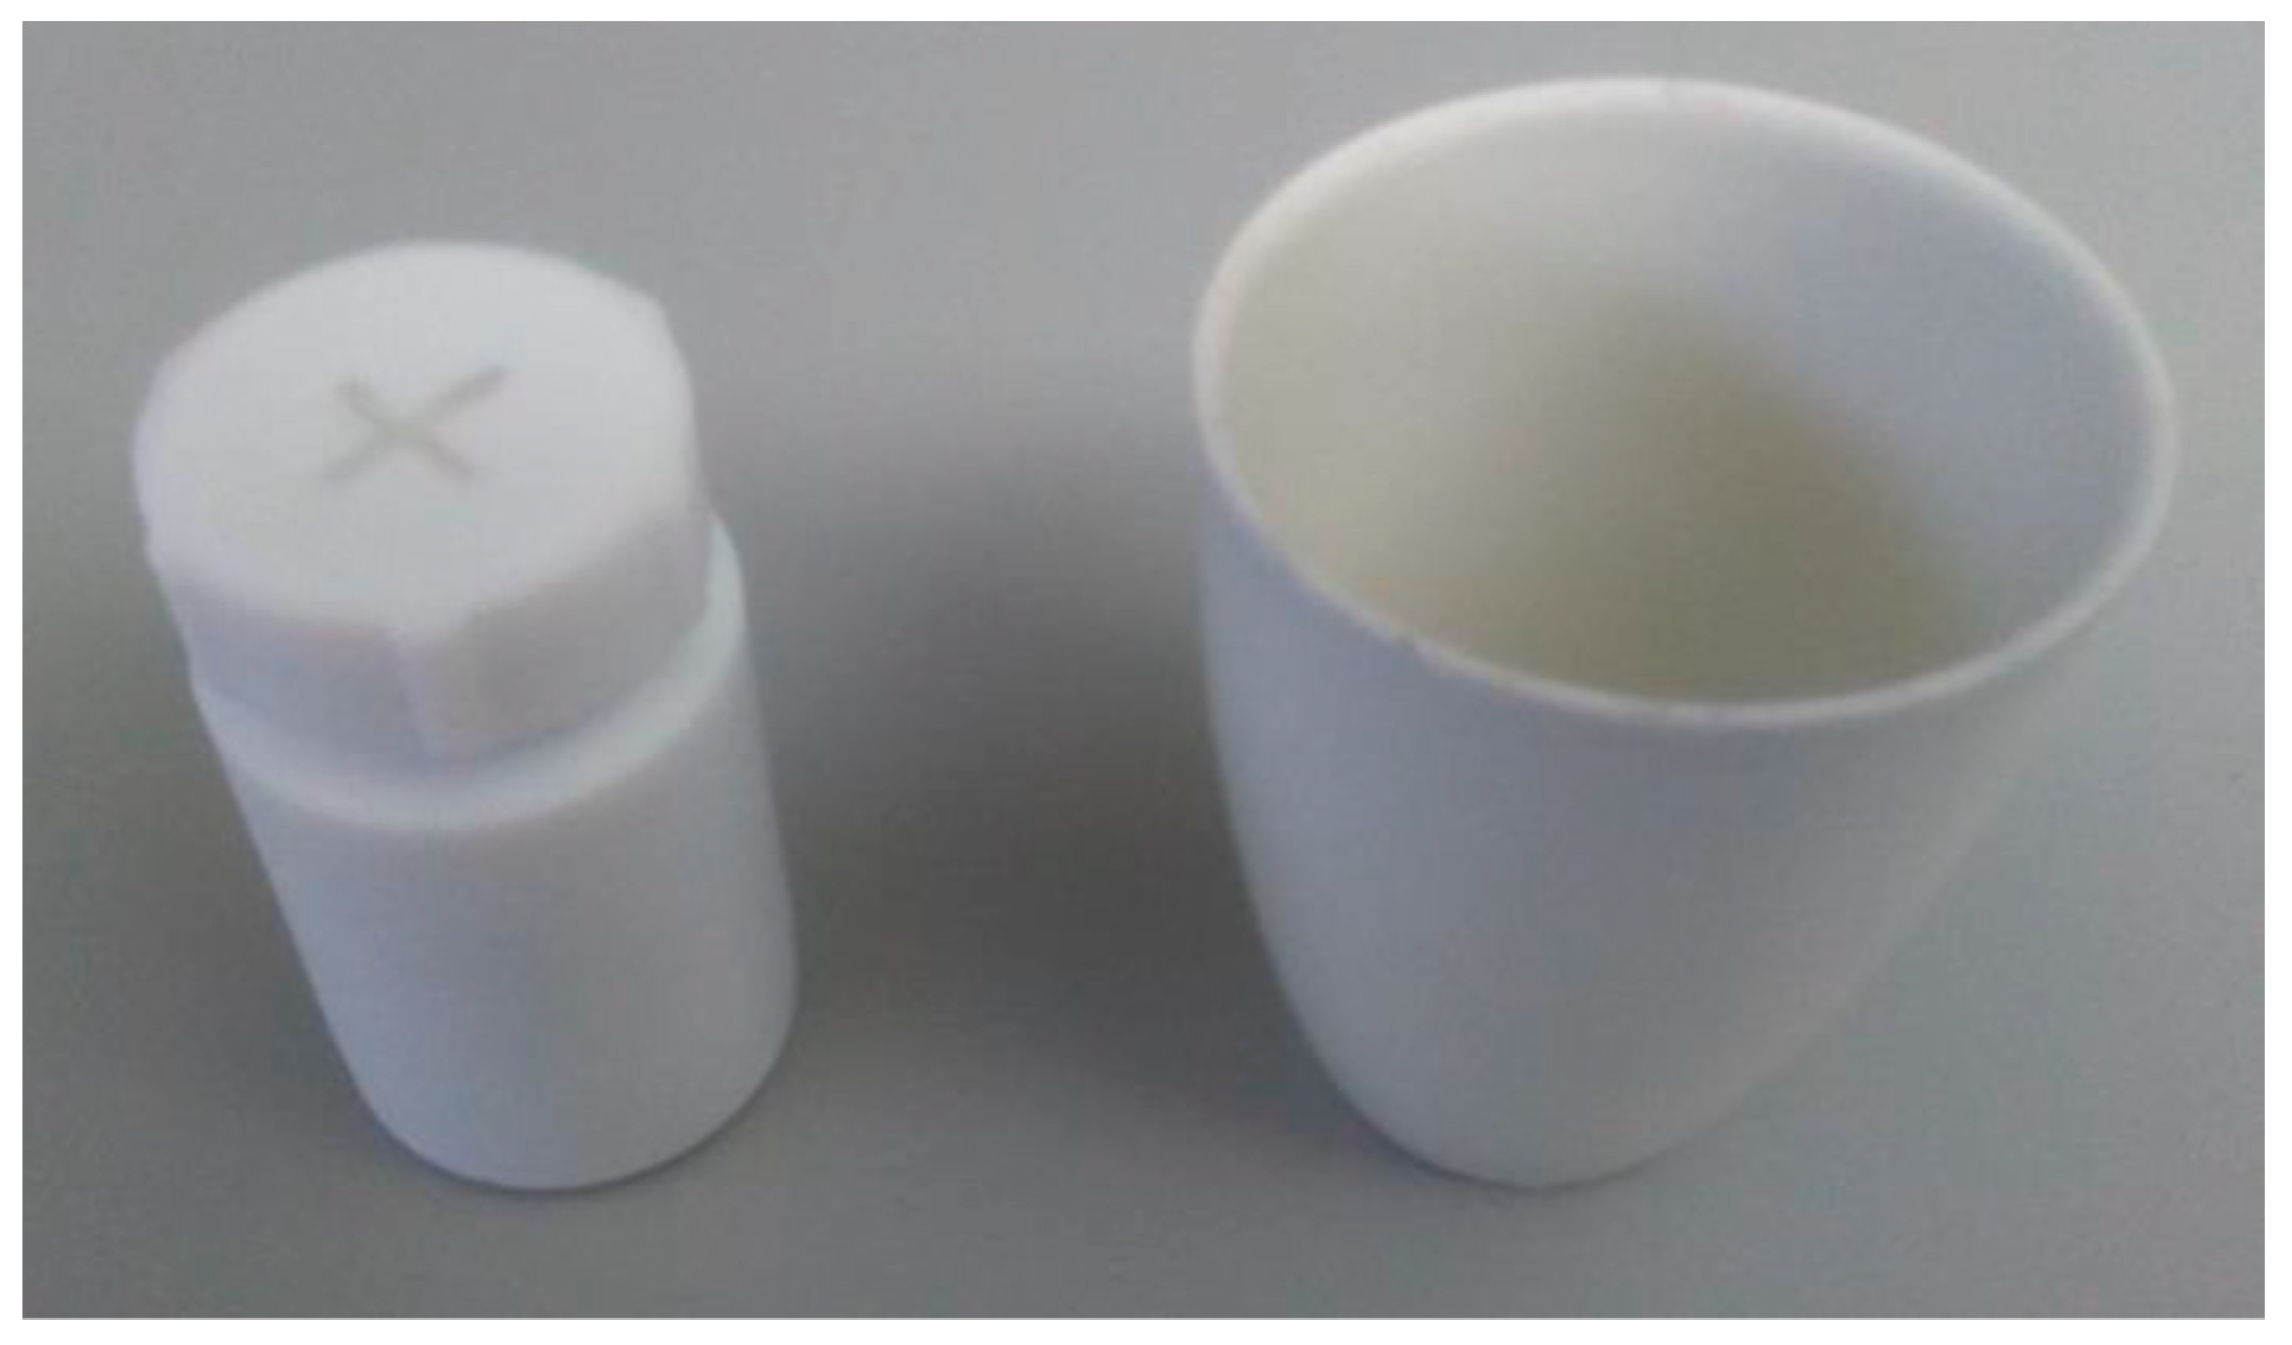
Figure 24.
Polytetrafluoroethylene (PTFE) closed crucible and porcelain crucible respectively.
Figure 24.
Polytetrafluoroethylene (PTFE) closed crucible and porcelain crucible respectively.
Table 1.
Phase change material (PCM) candidates with melting points between 210 °C and 270 °C which successfully completed thermal characterization.
Table 1.
Phase change material (PCM) candidates with melting points between 210 °C and 270 °C which successfully completed thermal characterization.
| Material | Price [€/kg] | Melting Temperature [°C] | Melting Enthalpy [J/g] | Ref. |
|---|
| Myo-inositol (C6H12O6) | 8–10 | 220 | 190–223 | [9,17] |
| Solar salt (40 wt.% KNO3/ 60 wt.% NaNO3) | 33 | 222 | 94–100 | [9,11] |
Table 2.
Corrosion rate of the different materials in solar salt and myo-inositol.
Table 2.
Corrosion rate of the different materials in solar salt and myo-inositol.
| | Solar Salt | Myo-inositol |
|---|
| Corrosion Rate [mm/year] |
|---|
| Aluminium | 0.0015 | 0.0150 |
| Stainless Steel AISI 304 | 0.0012 | 0.0182 |
| Carbon Steel (AISI 1090) | 0.0111 | 0.0178 |
| Copper | 0.0444 | 0.0116 |
Table 3.
Uncertainties of the different parameters involved in the analyses of the present study.
Table 3.
Uncertainties of the different parameters involved in the analyses of the present study.
| Parameter | Units | Sensor | Accuracy |
|---|
| Weight | g | Mettler Toledo AG135 | ±0.00001 g |
| Length | mm | Digital caliper | ±0.01 mm |
| Width | mm | Digital caliper | ±0.01 mm |
| Thickness | mm | Digital caliper | ±0.01 mm |
Table 4.
Parameters calculated from the measurements.
Table 4.
Parameters calculated from the measurements.
| | Weight Difference | Area | Mass Loss |
|---|
| [g] | [mm2] | [g/mm2] |
|---|
| Carbon Steel (AISI 1090) | 1.33 × 10⁻³ | 569.125 | 2.337 × 10⁻⁶ |
| 1.05 × 10⁻³ | 658.436 | 1.595 × 10⁻⁶ |
| 1.33 × 10⁻³ | 667.290 | 1.993 × 10⁻⁶ |
| Copper | 1.55 × 10⁻³ | 595.823 | 2.601 × 10⁻⁶ |
| 3.18 × 10⁻³ | 640.614 | 4.964 × 10⁻⁶ |
| 5.62 × 10⁻³ | 627.983 | 8.949 × 10⁻⁶ |
| Stainless steel (AISI 304) | 0.18 × 10⁻³ | 552.278 | 3.259 × 10⁻⁶ |
| 0.18 × 10⁻³ | 656.986 | 2.740 × 10⁻⁶ |
| 0.14 × 10⁻³ | 638.872 | 2.191 × 10⁻⁶ |
| Aluminium | 0.3 × 10⁻³ | 569.180 | 5.271 × 10⁻⁶ |
| 0.21 × 10⁻³ | 643.462 | 3.264 × 10⁻⁶ |
| 0.06 × 10⁻³ | 647.667 | 9.264 × 10⁻⁶ |
Table 5.
Estimated uncertainties of the calculated parameters.
Table 5.
Estimated uncertainties of the calculated parameters.
| Uncertainty | Weight Difference | Area | Mass Loss |
|---|
| Steels | [± g] | [± %] | [± mm2] | [± %] | [± g/mm2] | [± %] |
|---|
| Carbon Steel (AISI 1090) | 0.00001 | 0.752 | 0.069 | 0.012 | 1.757 × 10⁻⁸ | 0.752 |
| 0.00001 | 0.952 | 0.069 | 0.011 | 1.519 × 10⁻⁸ | 0.953 |
| 0.00001 | 0.752 | 0.069 | 0.010 | 1.499 × 10⁻⁸ | 0.752 |
| Copper | 0.00001 | 0.645 | 0.069 | 0.012 | 1.679 × 10⁻⁸ | 0.645 |
| 0.00001 | 0.314 | 0.069 | 0.011 | 1.562 × 10⁻⁸ | 0.315 |
| 0.00001 | 0.178 | 0.069 | 0.011 | 1.595 × 10⁻⁸ | 0.178 |
| Stainless steel (AISI 304) | 0.00001 | 5.556 | 0.069 | 0.013 | 1.81 × 10⁻⁸ | 5.556 |
| 0.00001 | 5.556 | 0.069 | 0.011 | 1.522 × 10⁻⁸ | 5.556 |
| 0.00001 | 7.143 | 0.069 | 0.011 | 1.565 × 10⁻⁸ | 7.143 |
| Aluminum | 0.00001 | 3.333 | 0.069 | 0.012 | 1.757 × 10⁻⁸ | 3.333 |
| 0.00001 | 4.762 | 0.069 | 0.011 | 1.554 × 10⁻⁸ | 4.762 |
| 0.00001 | 16.667 | 0.069 | 0.011 | 1.544 × 10⁻⁸ | 16.667 |
Table 6.
Chemical composition of the materials tested in molten salts.
Table 6.
Chemical composition of the materials tested in molten salts.
| Steels | Weight (%) | |
|---|
| Al | Mn | Ni | Cr | P | C | S | Fe | Cu | Mo |
|---|
| Stainless steel (AISI 304) | - | 1.7 | 8.04 | 18.28 | - | - | - | Balance | - | 0.27 |
| Carbon steel (AISI 1090) | - | 0.6–0.9 | - | - | 0.04 | 0.85–0.98 | 0.05 | Balance | - | - |
| Aluminium | 100 | - | - | - | - | - | - | - | - | - |
| Copper | - | - | - | - | - | - | - | - | 100 | - |


