Hydrophobic Amino Acid Content in Onions as Potential Fingerprints of Geographical Origin: The Case of Rossa da Inverno sel. Rojo Duro

 , , , ,
Abstract
:
1. Introduction
2. Results and Discussion
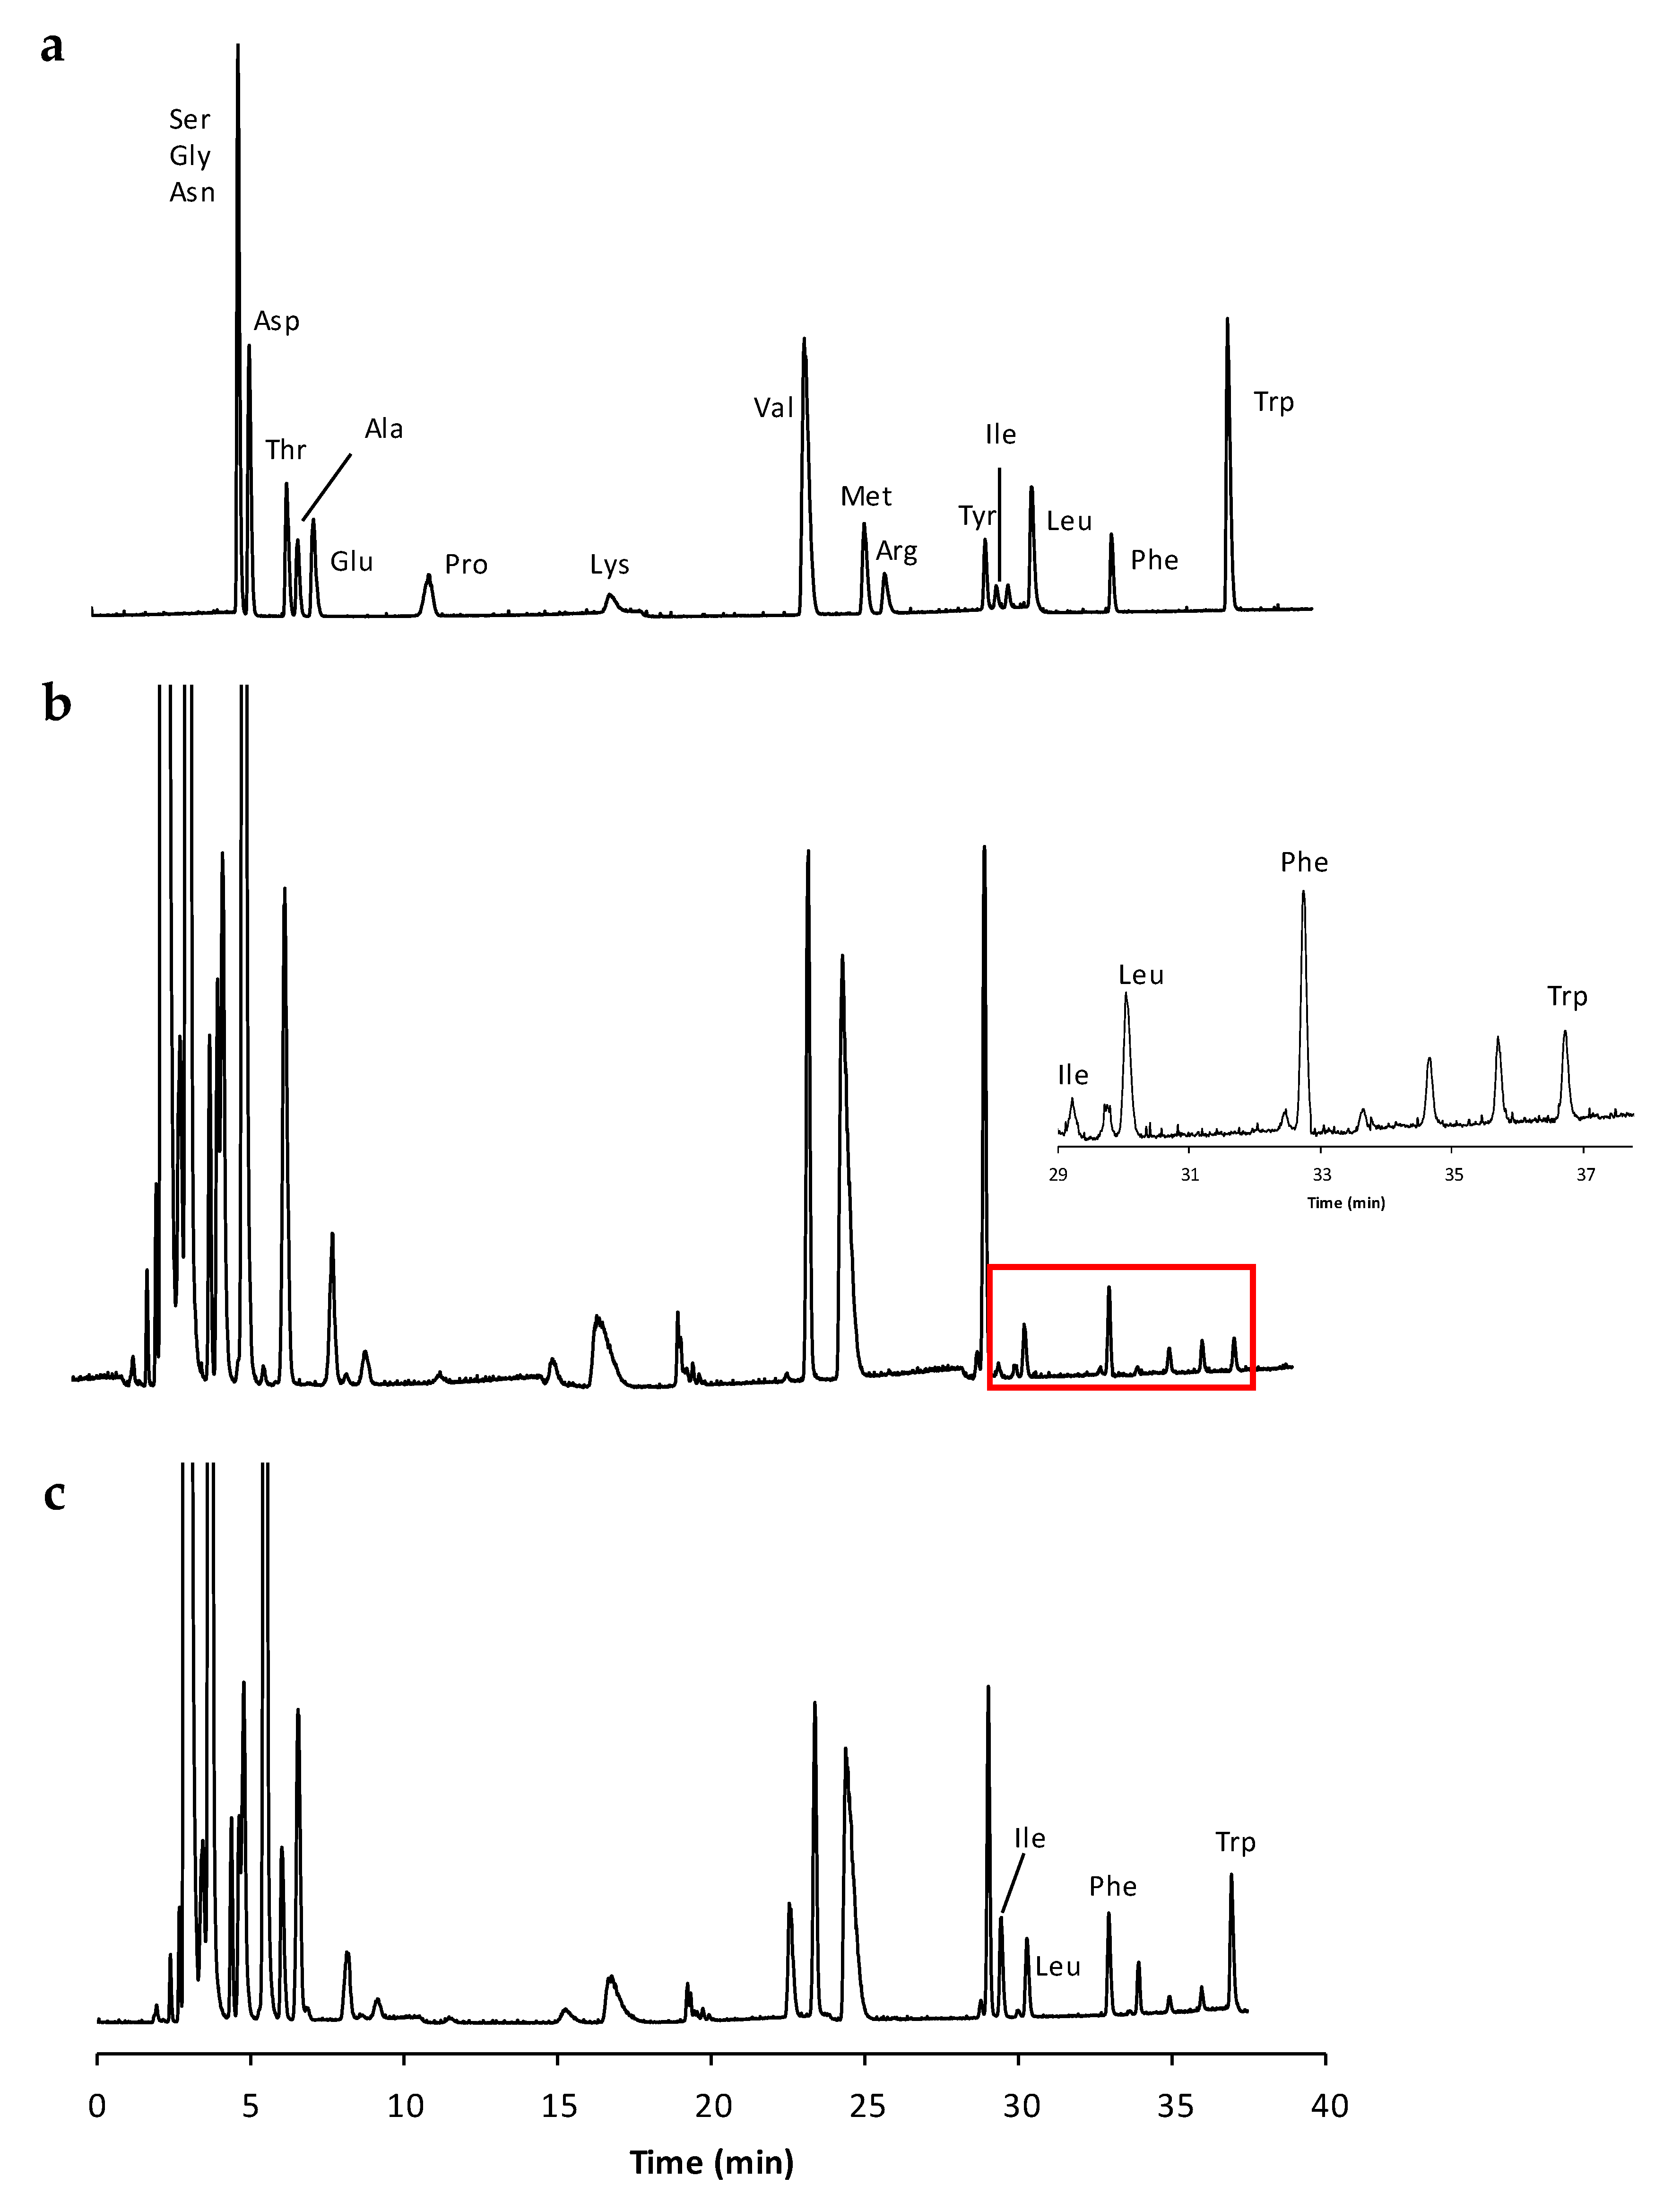
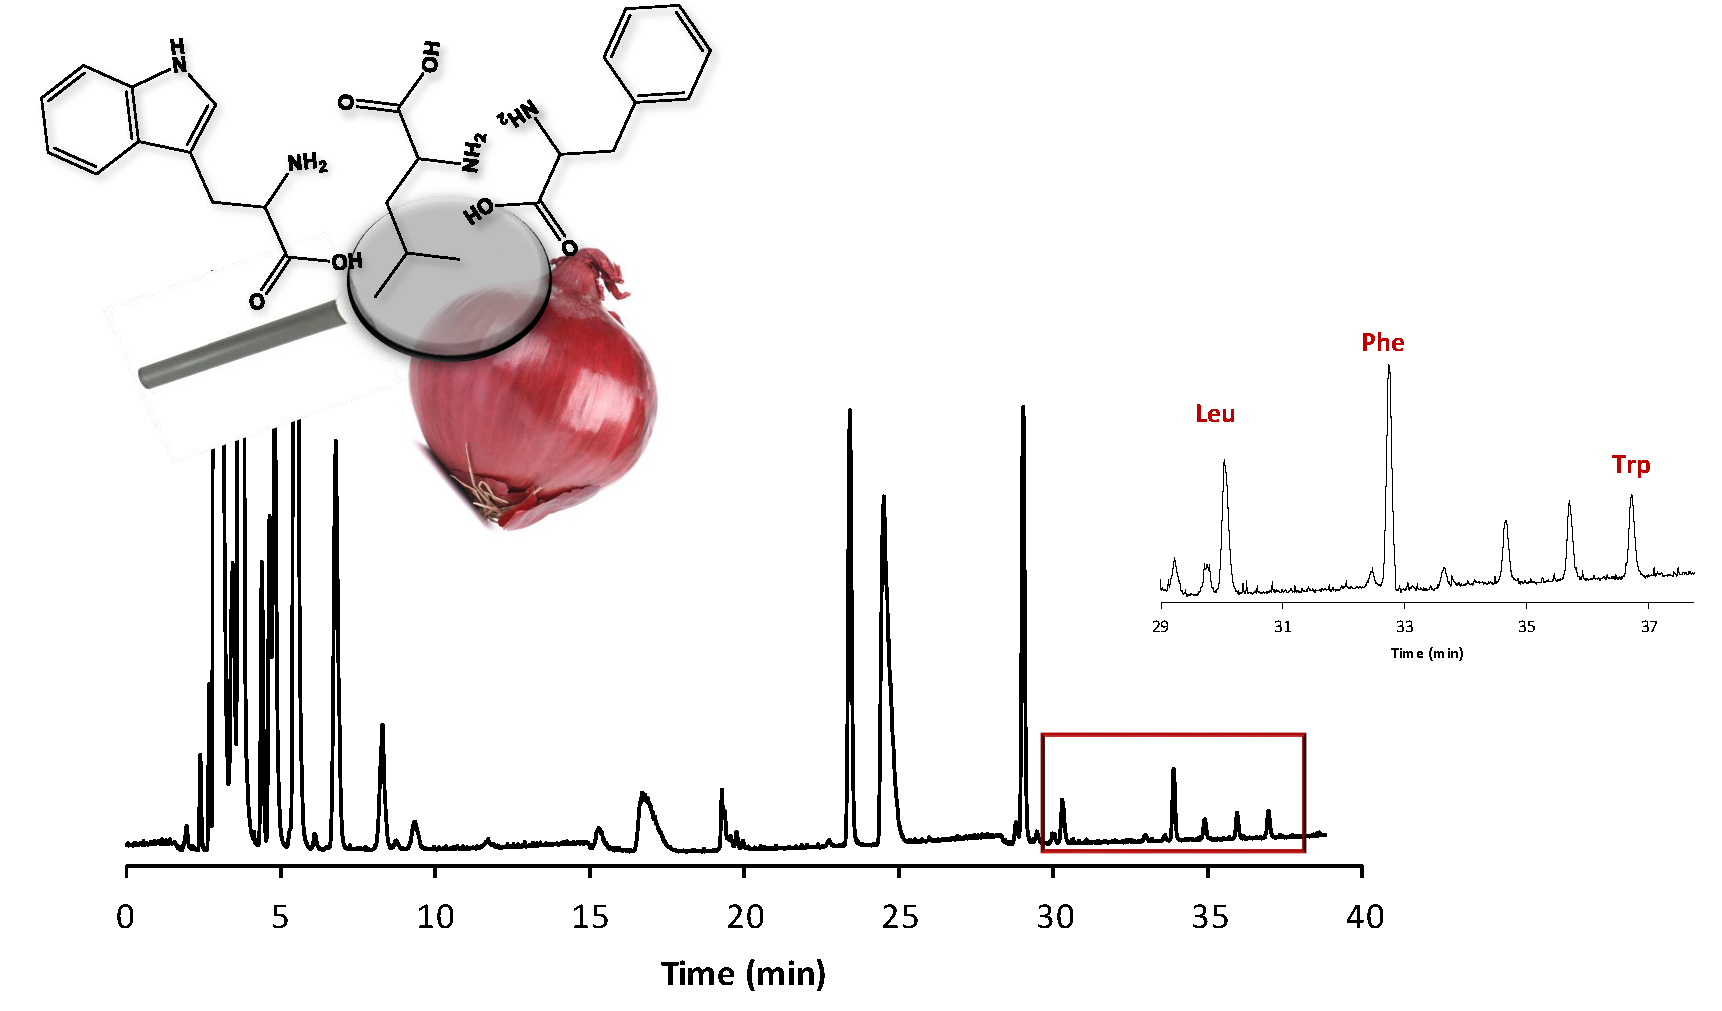
2.1. Method Validation and Amino Acid Quantification
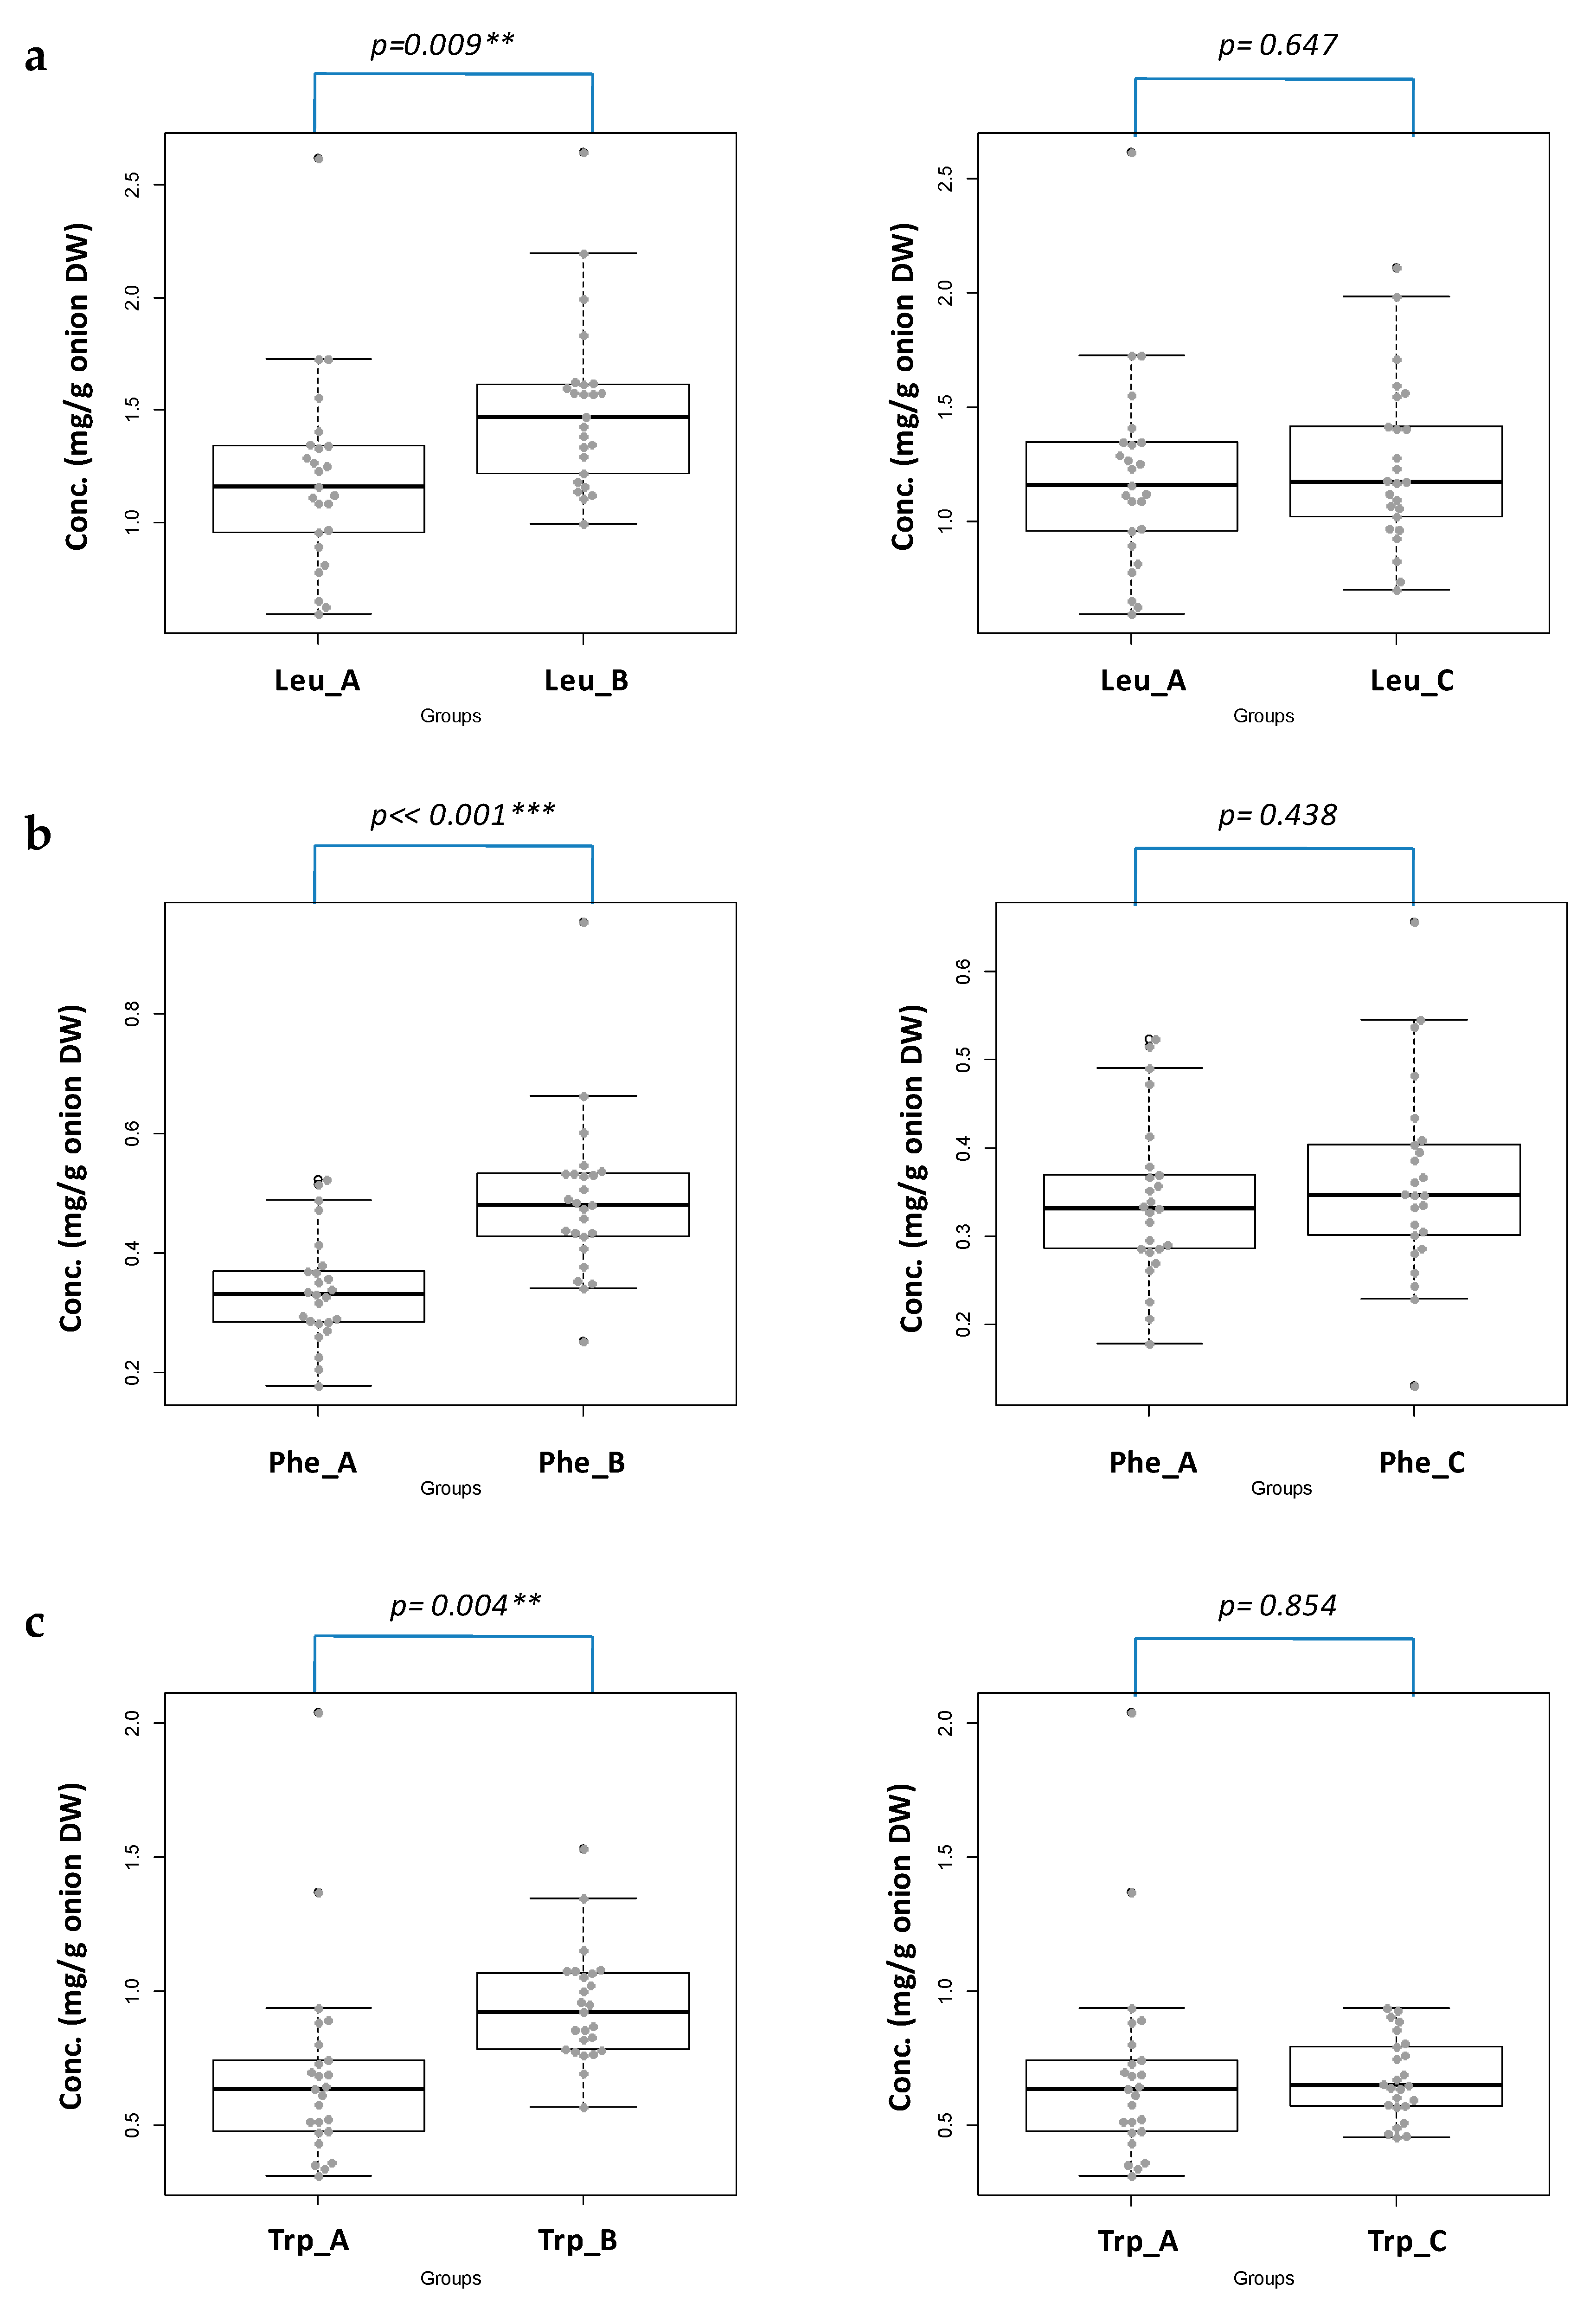
2.2. Statistical Evaluation
3. Materials and Methods
3.1. Reagents
3.2. Instrumentation
3.3. Onion Sources
3.4. Soil Sampling and Treatment
3.5. Sample Preparation and Extraction of Free Amino Acids
3.6. Amino Acid Separation and Quantitation
3.7. Method Validation
3.7.1. Selectivity
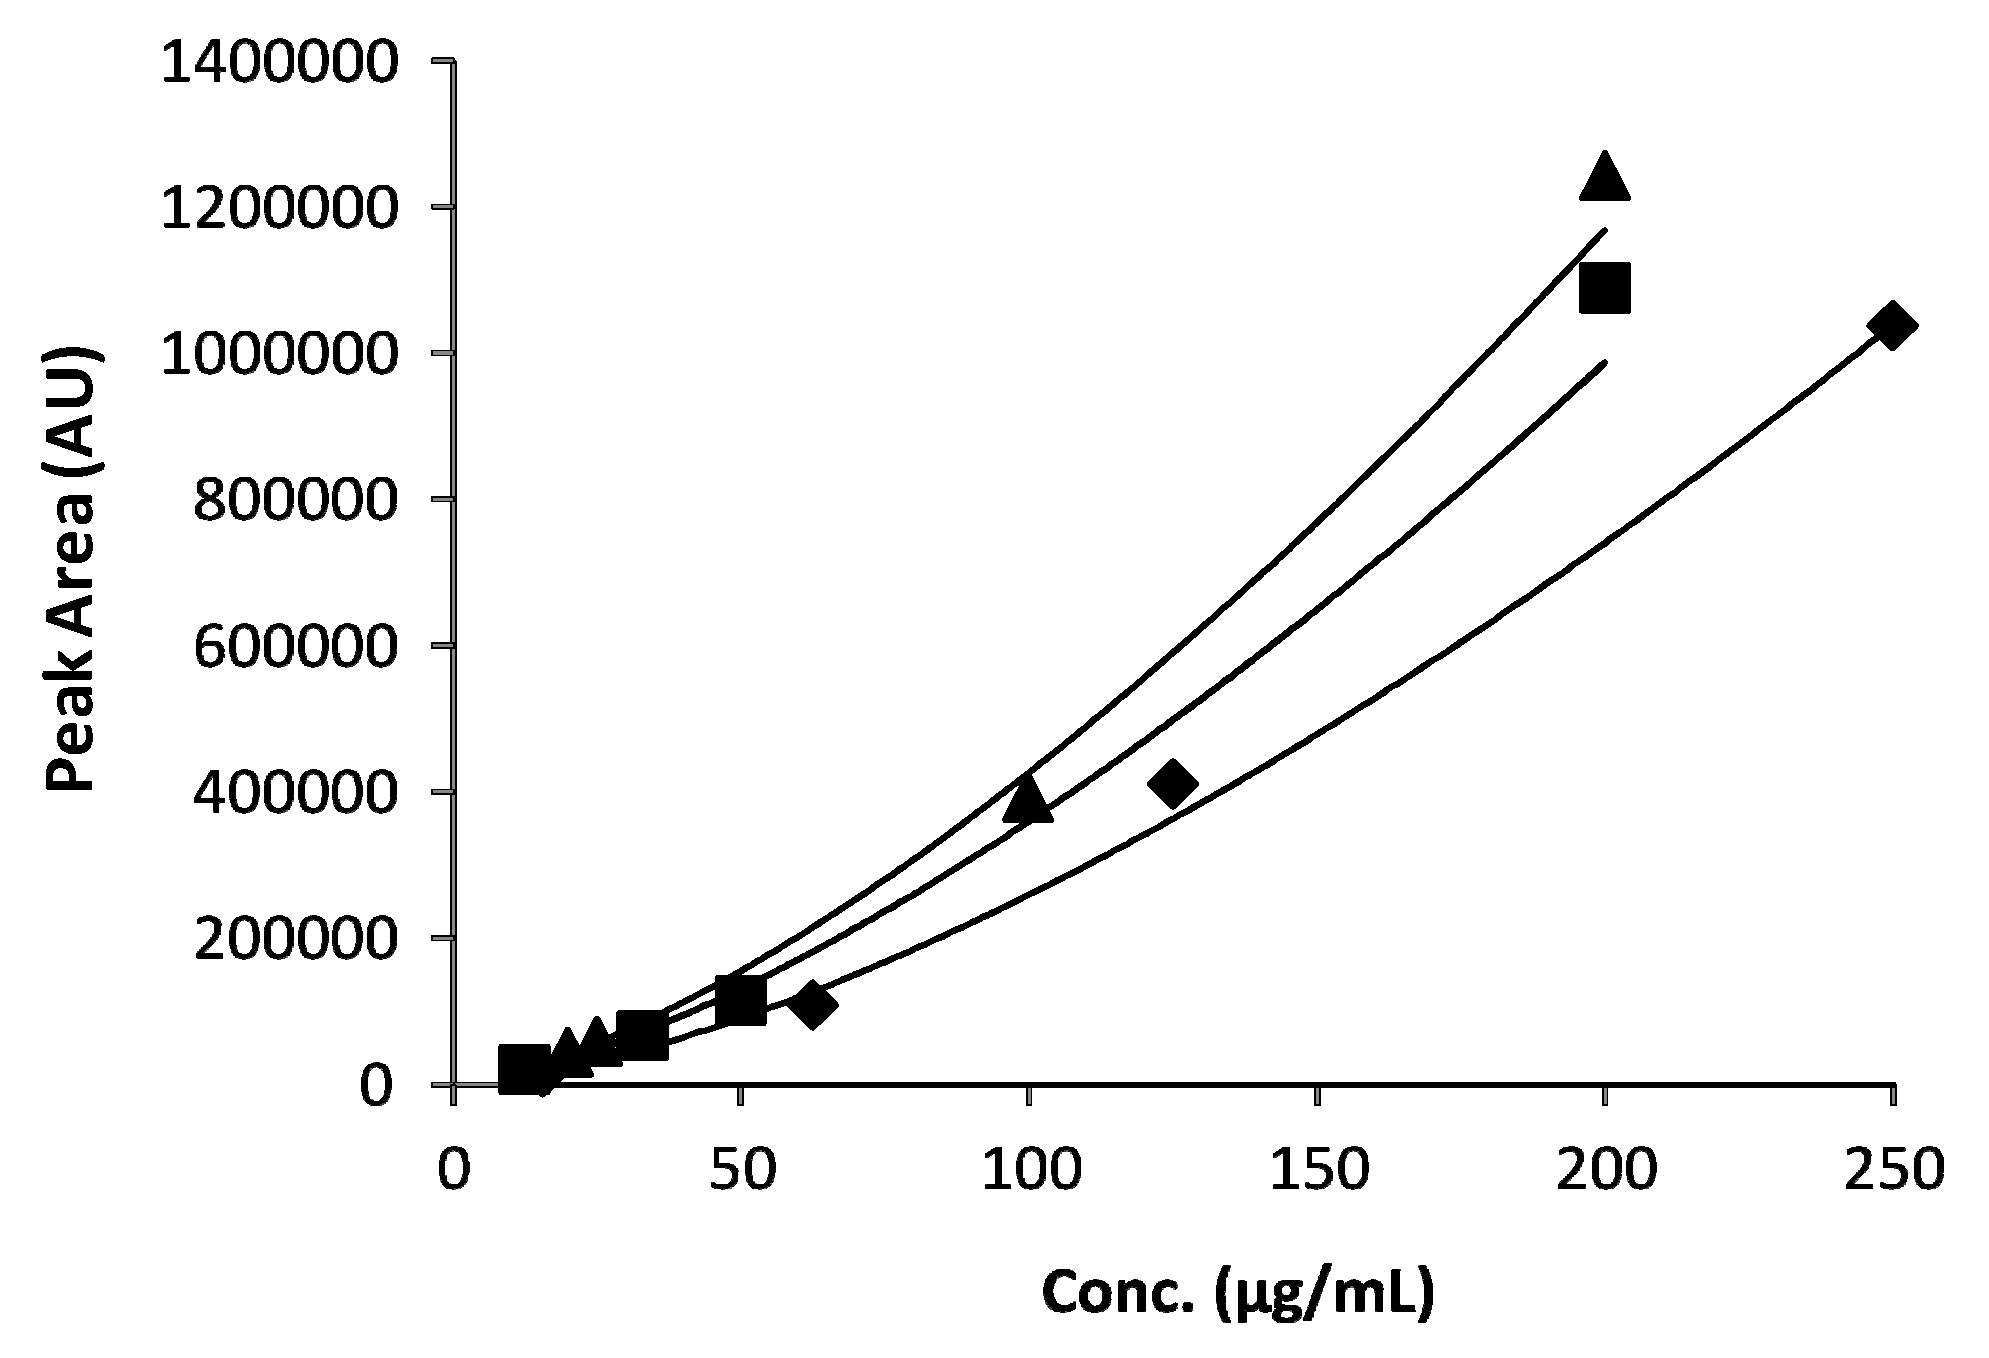
3.7.2. Linearity
3.7.3. LOD and LOQ
3.7.4. Intra-Day and Inter-Day Precision and Accuracy
3.8. Statistical Methods
4. Conclusions
Author Contributions
Funding
Acknowledgments
Conflicts of Interest
References
- Bystrická, J.; Musilová, J.; Vollmannová, A.; Timoracká, M.; Kavalcová, P. Bioactive components of onion (Allium cepa L.)—A Review. Acta Aliment. 2013, 42, 11–22. [Google Scholar] [CrossRef]
- Hansen, S.L. Content of free amino acids in onion (Allium Cepa L.) as influenced by the stage of development at harvest and long-term storage. Acta Agric. Scand. Sect. B Soil Plant. Sci. 2001, 51, 77–83. [Google Scholar] [CrossRef]
- Nishimura, T.; Kato, H. Role of Free Amino Acids and Peptides in Food Taste. Food Rev. Int. 1988, 4, 175–194. [Google Scholar] [CrossRef]
- Marinozzi, M.; Sardella, R.; Scorzoni, S.; Ianni, F.; Lisanti, A.; Natalini, B. Validated pungency assessment of three italian onion (Allium Cepa L.) cultivars. J. Int. Sci. Publ. Agric. Food 2015, 2, 532–541. [Google Scholar]
- Ianni, F.; Marinozzi, M.; Scorzoni, S.; Sardella, R.; Natalini, B. Quantitative Evaluation of the Pyruvic Acid Content in Onion Samples with a Fully Validated High-Performance Liquid Chromatography Method. Int. J. Food Prop. 2016, 19, 752–759. [Google Scholar] [CrossRef]
- Lisanti, A.; Formica, V.; Ianni, F.; Albertini, B.; Marinozzi, M.; Sardella, R.; Natalini, B. Antioxidant activity of phenolic extracts from different cultivars of Italian onion (Allium Cepa) and relative human immune cell proliferative induction. Pharm. Biol. 2016, 54, 799–806. [Google Scholar] [CrossRef] [PubMed]
- Vasconcelos, A.M.P.; Chaves das Neves, H.J. Characterization of Elementary Wines of Vitis vinifera Varieties by Pattern Recognition of Free Amino Acid Profiles. J. Agric. Food Chem. 1989, 37, 931–937. [Google Scholar] [CrossRef]
- Pirini, A.; Conte, L.S.; Francioso, O.; Lercker, G. Capillary gas chromatographic determination of free amino acids in honey as a means of determination between different botanical sources. J. High Resolut. Chromatogr. 1992, 15, 165–170. [Google Scholar] [CrossRef]
- Martín Carratalá, M.L.; Prats Moya, M.S.; Grané Teruel, N.; Berenguer Navarro, , V. Discriminating Significance of the Free Amino Acid Profile in Almond Seeds. J. Agric. Food Chem. 2002, 50, 6841–6846. [Google Scholar] [CrossRef] [PubMed]
- Iglesias, M.T.; De Lorenzo, C.; Polo, M.C.; Martín-Álvarez, P.J.; Pueyo, E. Usefulness of Amino Acid Composition to Discriminate between Honeydew and Floral Honeys. Application to Honeys from a Small Geographic Area. J. Agric. Food Chem. 2004, 52, 84–89. [Google Scholar] [CrossRef] [PubMed]
- Consonni, R.; Cagliani, L.R. Geographical Characterization of Polyfloral and Acacia Honeys by Nuclear Magnetic Resonance and Chemometrics. J. Agric. Food Chem. 2008, 56, 6873–6880. [Google Scholar] [CrossRef] [PubMed]
- Adamo, P.; Zampella, M.; Quétel, C.R.; Aversano, R.; Dal Piaz, F.; De Tommasi, N.; Frusciante, L.; Iorizzo, M.; Lepore, L.; Carputo, D. Biological and geochemical markers of the geographical origin and genetic identity of potatoes. J. Geochem. Explor. 2012, 121, 62–68. [Google Scholar] [CrossRef] [Green Version]
- Bouseta, A.; Scheirman, V.; Collin, S. Flavor and Free Amino Acid Composition of Lavender and Eucalyptus Honeys. J. Food Sci. 1996, 61, 683–687. [Google Scholar] [CrossRef]
- Kader, A.A. Perspective flavor quality of fruits and vegetables. J. Sci. Food Agric. 2008, 88, 1863–1868. [Google Scholar] [CrossRef]
- Lee, E.J.; Yoo, K.S.; Jifon, J.; Patil, B.S. Characterization of Shortday Onion Cultivars of 3 Pungency Levels with Flavor Precursor, Free Amino Acid, Sulfur, and Sugar Contents. J. Food Sci. 2009, 74, C475–C480. [Google Scholar] [CrossRef] [PubMed]
- Sardella, R.; Lisanti, A.; Marinozzi, M.; Ianni, F.; Natalini, B.; Blanch, G.P.; Ruiz del Castillo, M.L. Combined monodimensional chromatographic approaches to monitor the presence of D-amino acids in cheese. Food Control 2013, 34, 478–487. [Google Scholar] [CrossRef] [Green Version]
- Kuon, J.; Bernhard, R.A. An examination of the free amino acids of the common onion (Allium Cepa). J. Food Sci. 1963, 28, 298–304. [Google Scholar] [CrossRef]
- Rabinowitch, H.D.; Brewster, J.L. Onions and Allied Crops: Biochemistry Food Science Minor Crops, 1st ed.; CRC Press: Boca Raton, FL, USA, 1989; Volume 3, ISBN 0849363020. [Google Scholar]
- Piraud, M.; Vianey-Saban, C.; Petritis, K.; Elfakir, C.; Steghens, j.P.; Bouchu, D. Ion-pairing reversed-phase liquid chromatography/electrospray ionization mass spectrometric analysis of 76 underivatized amino acids of biological interest: A new tool for the diagnosis of inherited disorders of amino acid metabolism. Rapid Commun. Mass Spectrom. 2005, 19, 1587–1602. [Google Scholar] [CrossRef] [PubMed]
- Pareek, S.; Sagar, N.A.; Sharma, S.; Kumar, V. Onion (Allium Cepa L.). In Fruit and Vegetable Phytochemicals: Chemistry and Human Health, 2nd ed.; Yahia, E.M., Ed.; John Wiley & Sons Ltd.: Hoboken, NJ, USA, 2018; Volume 2, pp. 1145–1161. ISBN 9781119158042. [Google Scholar]
- De Jong, C.; Hughes, G.J.; Van Wieringen, E.; Wilson, K.J. Amino acid analyses by high-performance liquid chromatography: An evaluation of the usefulness of pre-column Dns derivatization. J. Chromatogr. 1982, 241, 345–359. [Google Scholar] [CrossRef]
- Ianni, F.; Sardella, R.; Lisanti, A.; Gioiello, A.; Cenci Goga, B.T.; Lindner, W.; Natalini, B. Achiral–chiral two-dimensional chromatography of free amino acidsin milk: A promising tool for detecting different levels of mastitis in cows. J. Pharm. Biomed. Anal. 2015, 116, 40–46. [Google Scholar] [CrossRef] [PubMed]
- Fabiani, A.; Versari, A.; Parpinello, G.P.; Castellari, M.; Galassi, S. High-Performance Liquid Chromatographic Analysis of Free Amino Acids in Fruit Juices Using Derivatization with 9-Fluorenylmethyl-Chloroformate. J. Chromatogr. Sci. 2002, 40, 14–18. [Google Scholar] [CrossRef] [PubMed]
- Jámbor, A.; Molnár-Perl, I. Amino acid analysis by high-performance liquid chromatography after derivatization with 9-fluorenylmethyloxycarbonyl chloride: Literature overview and further study. J. Chromatogr. A 2006, 1216, 3064–3077. [Google Scholar] [CrossRef] [PubMed]
- Sardella, R.; Gioiello, A.; Ianni, F.; Venturoni, F.; Natalini, B. HPLC/ELSD analysis of amidated bile acids: An effective and rapid way to assist continuous flow chemistry processes. Talanta 2012, 100, 364–371. [Google Scholar] [CrossRef] [PubMed]
- Dubber, M.J.; Kanfer, I. Determination of terpene trilactones in Ginkgo biloba solid oral dosage forms using HPLC with evaporative light scattering detection. J. Pharm. Biomed. Anal. 2006, 41, 135–140. [Google Scholar] [CrossRef] [PubMed]
- Yan, S.; Luo, G.; Wang, Y.; Cheng, Y. Simultaneous determination of nine components in Qingkailing injection by HPLC/ELSD/DAD and its application to the quality control. J. Pharm. Biomed. Anal. 2006, 40, 889–895. [Google Scholar] [CrossRef] [PubMed]
- Müller, A.; Ganzera, M.; Stuppner, H. Analysis of phenolic glycosides and saponins in Primula elatior and Primula veris (primula root) by liquid chromatography, evaporative light scattering detection and mass spectrometry. J. Chromatogr. A 2006, 1112, 218–223. [Google Scholar] [CrossRef] [PubMed]
- Li, W.; Fitzloff, J.F. Simultaneous determination of terpene lactones and flavonoid aglycones in Ginkgo biloba by high-performance liquid chromatography with evaporative light scattering detection. J. Pharm. Biomed. Anal. 2002, 30, 67–75. [Google Scholar] [CrossRef]
- Vervoort, N.; Daemen, D.; Török, G. Performance evaluation of evaporative light scattering detection and charged aerosol detection in reversed phase liquid chromatography. J. Chromatogr. A 2008, 1189, 92–100. [Google Scholar] [CrossRef] [PubMed]
- Tukey. J.W. Exploratory Data Analysis, 1st ed.; Addison-Wesley Publishing Company: Toronto, ON, Canada, 1977; ISBN 0-201-07616-0. [Google Scholar]
- Fish, W.W. A Reliable Methodology for Quantitative Extraction of Fruit and Vegetable Physiological Amino Acids and Their Subsequent Analysis with Commonly Available HPLC Systems. Food Nutr. Sci. 2012, 3, 863–871. [Google Scholar] [CrossRef]
- R Development Core Team. R: A Language and Environment for Statistical Computing; R Foundation for Statistical Computing: Vienna, Austria, 2008; ISBN 3-900051-07-0. Available online: http://www.R-project.org (accessed on 7 May 2018).
Sample Availability: Samples of the data set used in the experiments are available from the authors. |

| AA | Regression Eq. | R2 | Linearity Conc. Range (µg/mL) | LOD (µg/mL) | LOQ (µg/mL) |
|---|---|---|---|---|---|
| Leu | y = 1.52(±0.07)x + 2.38(±0.14) | 0.9951 | 15.6–250 | 0.15 | 0.44 |
| Phe | y = 1.45(±0.08)x + 2.65(±0.144) | 0.9940 | 12.5–200 | 1.44 | 2.95 |
| Trp | y = 1.45(±0.04)x + 2.72(±0.07) | 0.9984 | 25–200 | 0.08 | 0.23 |
| AA | Solution # | Day | Theoretical Conc. (µg/mL) | Mean Observed Conc. (µg/mL) | n a | Precision (RSD %) | Accuracy (Recovery %) |
|---|---|---|---|---|---|---|---|
| Leu | 1 | 1 | 31.20 | 27.89 | 3 | 1.05 | 89.38 |
| 2 | 28.64 | 9.50 | 91.81 | ||||
| 3 | 31.09 | 3.82 | 99.66 | ||||
| 2 | 1 | 160.00 | 161.54 | 3 | 2.83 | 100.96 | |
| 2 | 150.92 | 5.80 | 94.32 | ||||
| 3 | 171.65 | 4.69 | 107.28 | ||||
| Phe | 1 | 1 | 25.00 | 21.02 | 3 | 3.75 | 84.08 |
| 2 | 23.52 | 6.36 | 94.07 | ||||
| 3 | 23.55 | 2.12 | 94.22 | ||||
| 2 | 1 | 100.00 | 118.20 | 3 | 0.53 | 118.20 | |
| 2 | 100.79 | 9.12 | 100.79 | ||||
| 3 | 96.49 | 2.83 | 96.49 | ||||
| Trp | 1 | 1 | 33.00 | 28.43 | 3 | 3.35 | 86.15 |
| 2 | 28.87 | 2.81 | 87.48 | ||||
| 3 | 32.29 | 4.15 | 97.84 | ||||
| 2 | 1 | 143.00 | 135.64 | 3 | 4.90 | 94.85 | |
| 2 | 137.36 | 2.62 | 96.06 | ||||
| 3 | 145.90 | 3.41 | 102.03 |
| AA | Solution # | Theoretical Conc. (µg/mL) | Mean Observed Conc. (µg/mL) | n a | Precision (RSD %) | Accuracy (Recovery %) |
|---|---|---|---|---|---|---|
| Leu | 1 | 31.20 | 29.21 | 9 | 7.13 | 93.61 |
| 2 | 160.00 | 163.94 | 6.72 | 102.46 | ||
| Phe | 1 | 25.00 | 22.70 | 9 | 6.77 | 90.79 |
| 2 | 100.00 | 105.16 | 10.51 | 105.16 | ||
| Trp | 1 | 33.00 | 29.86 | 9 | 6.86 | 90.49 |
| 2 | 143.00 | 139.63 | 4.71 | 97.65 |
| Group | Mean Conc. ± SEM (mg/g Onion DW a ± SEM) | ||
|---|---|---|---|
| Leu | Phe | Trp | |
| A | 37.4 ± 13.4 (1.197 ± 0.428) | 10.6 ± 2.7 (0.339 ± 0.090) | 20.0 ± 7.4 (0.690 ± 0.366) |
| B | 49.9 ± 13.5 (1.504 ± 0.373) | 16.3 ± 5.0 (0.486 ± 0.133) | 31.4 ± 6.6 (0.945 ± 0.209) |
| C | 41.1 ± 11.3 (1.250 ± 0.357) | 11.9 ± 3.6 (0.360 ± 0.111) | 22.2 ± 4.6 (0.680 ± 0.152) |
| Preliminary stage | Soil digging (25–30 cm) |
| Complementary processes | Soil harrowing |
| Depth mineral fertilization | 50 kg/ha N-25 kg/ha P2O5-60 kg/ha K2O |
| TIMAC Agro-Timasprint-0.5 t/ha | |
| Organic-mineral fertilizer | |
| NPK (CaO-MgO-SO3) with Boron (B) | |
| 10-5-12 (8-2-24) + 0.1 + 7.5 C | |
| Seeding stage | Distance between rows = 14 cm |
| Distance between plant on the same row = 4 cm | |
| (Seeding density ~178 seeds/m2) (~4.0 kg/ha) | |
| Surface mineral fertilization | 39 kg/ha N |
| 0.15 t/ha NH4NO3 | |
| Phytosanitary measures | Metalaxil-m-Ridmil Gold® (Peronospora Schleideni) |
| Pyrimethanil-Scala® (Botrytis squamosa, Botrytis allii, Botrytis cinerea) | |
| Weed control | Mechanical or manual control |
| Harvesting stage | September 2013, first week |
© 2018 by the authors. Licensee MDPI, Basel, Switzerland. This article is an open access article distributed under the terms and conditions of the Creative Commons Attribution (CC BY) license (http://creativecommons.org/licenses/by/4.0/).
Share and Cite
Ianni, F.; Lisanti, A.; Marinozzi, M.; Camaioni, E.; Pucciarini, L.; Massoli, A.; Sardella, R.; Concezzi, L.; Natalini, B. Hydrophobic Amino Acid Content in Onions as Potential Fingerprints of Geographical Origin: The Case of Rossa da Inverno sel. Rojo Duro. Molecules 2018, 23, 1259. https://doi.org/10.3390/molecules23061259
Ianni F, Lisanti A, Marinozzi M, Camaioni E, Pucciarini L, Massoli A, Sardella R, Concezzi L, Natalini B. Hydrophobic Amino Acid Content in Onions as Potential Fingerprints of Geographical Origin: The Case of Rossa da Inverno sel. Rojo Duro. Molecules. 2018; 23(6):1259. https://doi.org/10.3390/molecules23061259
Chicago/Turabian StyleIanni, Federica, Antonella Lisanti, Maura Marinozzi, Emidio Camaioni, Lucia Pucciarini, Andrea Massoli, Roccaldo Sardella, Luciano Concezzi, and Benedetto Natalini. 2018. "Hydrophobic Amino Acid Content in Onions as Potential Fingerprints of Geographical Origin: The Case of Rossa da Inverno sel. Rojo Duro" Molecules 23, no. 6: 1259. https://doi.org/10.3390/molecules23061259