
Monoacylglycerol Analysis Using MS/MSALL Quadruple Time of Flight Mass Spectrometry

 ,
,
Abstract
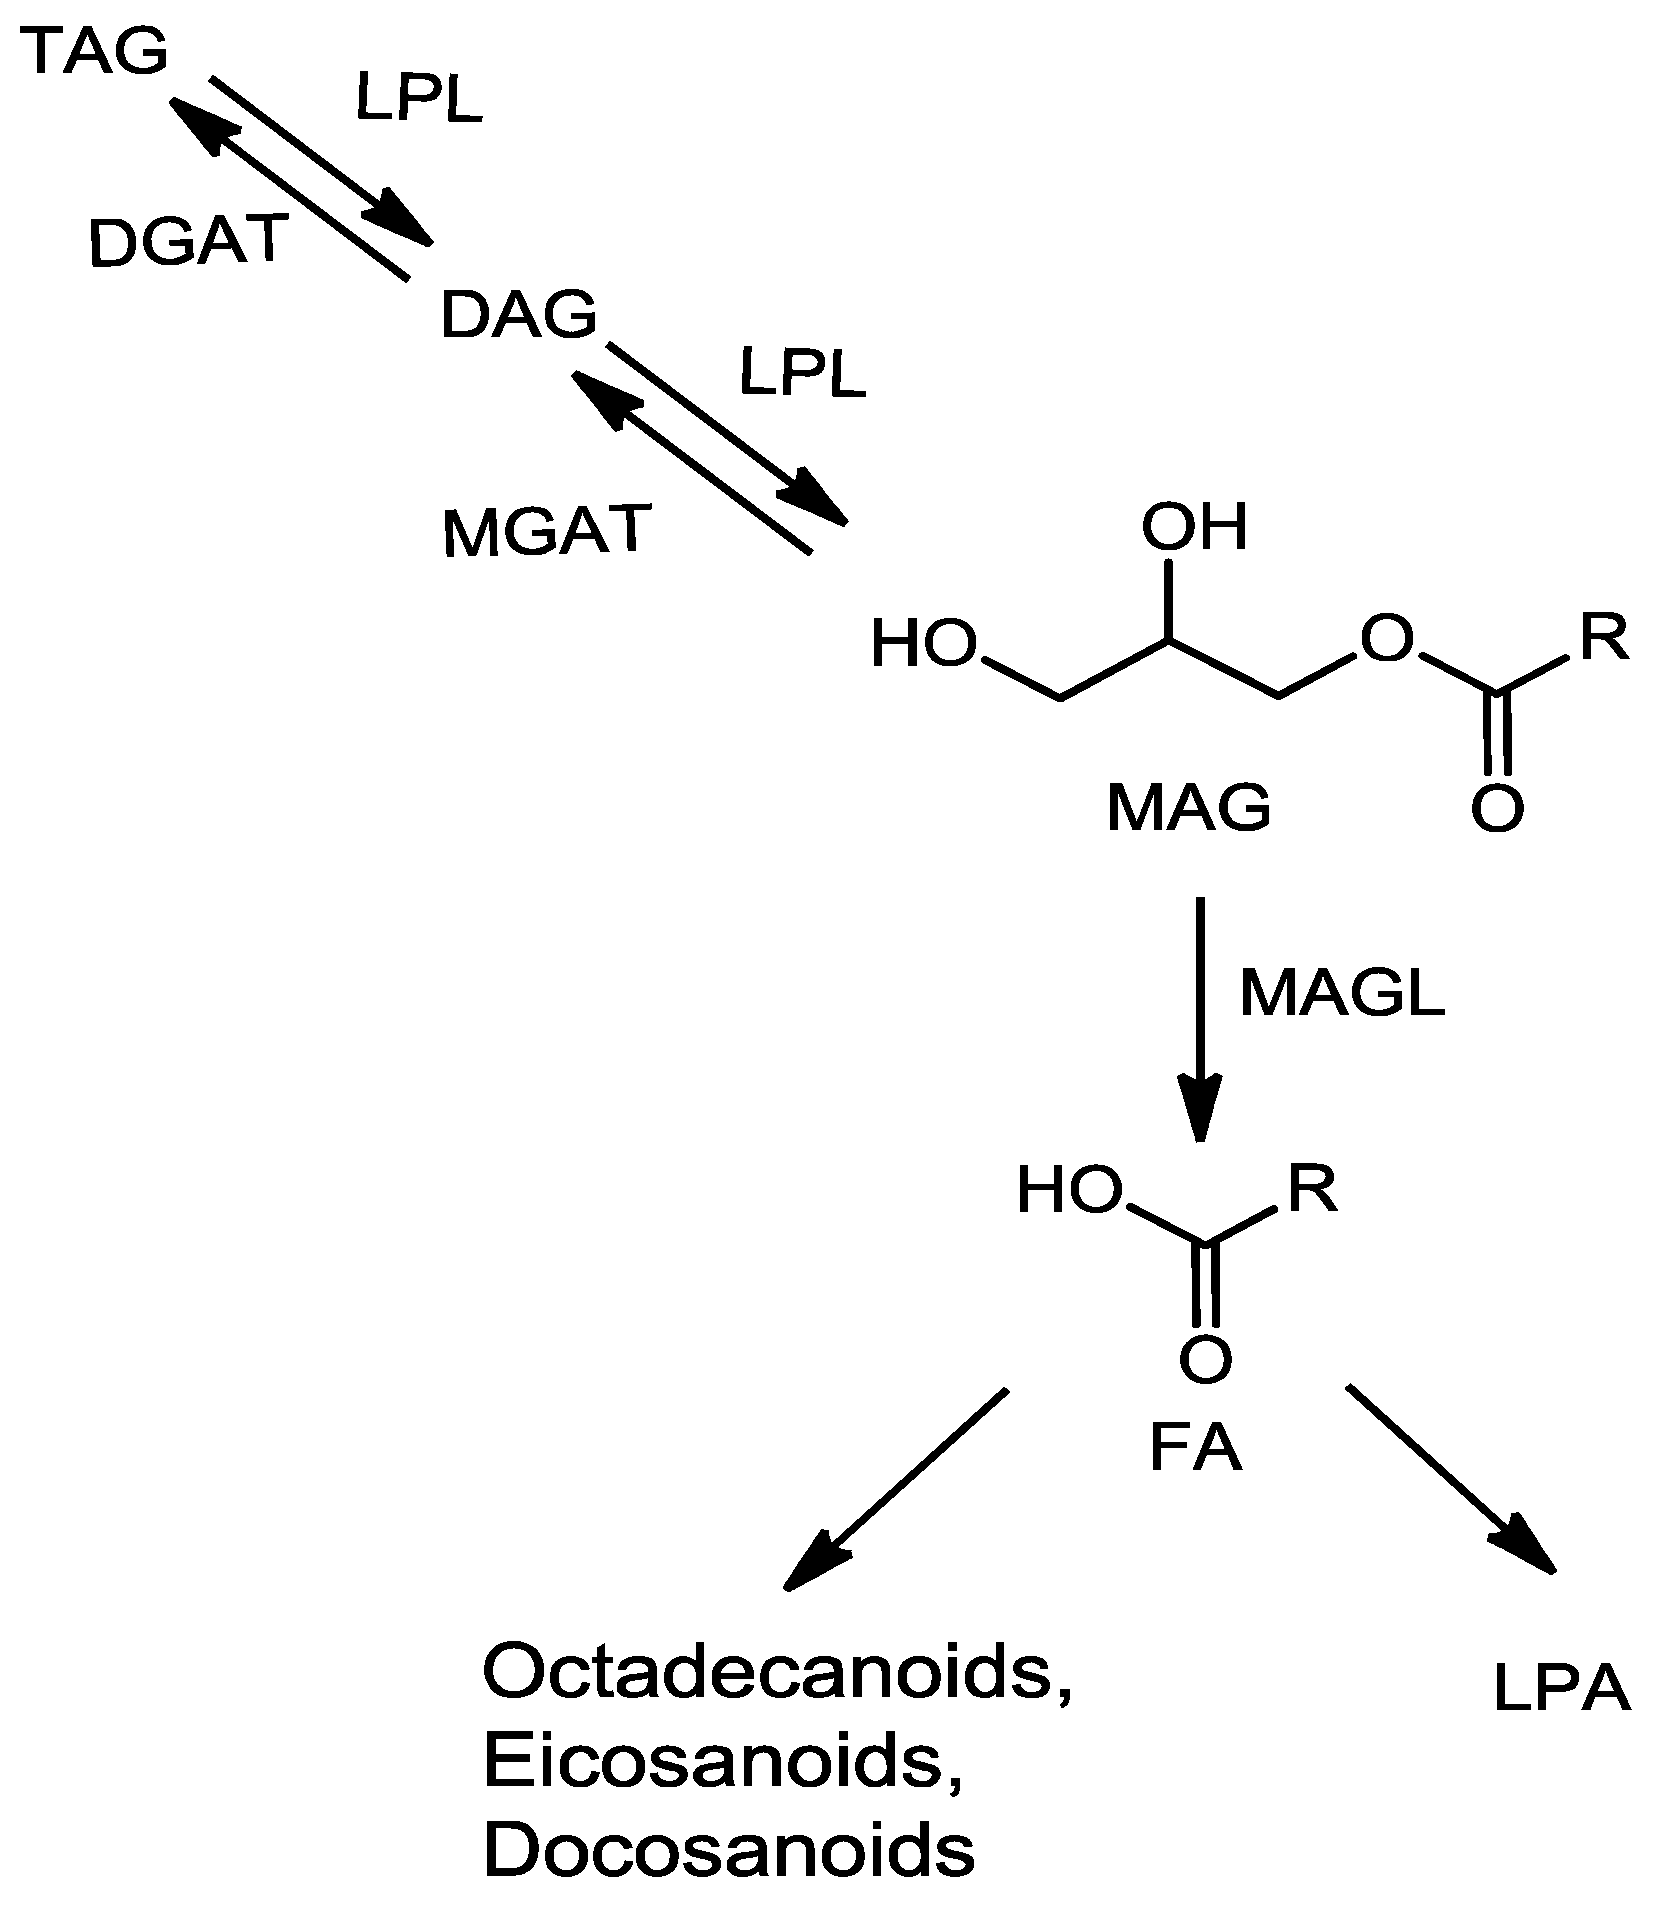
:1. Introduction
2. Results
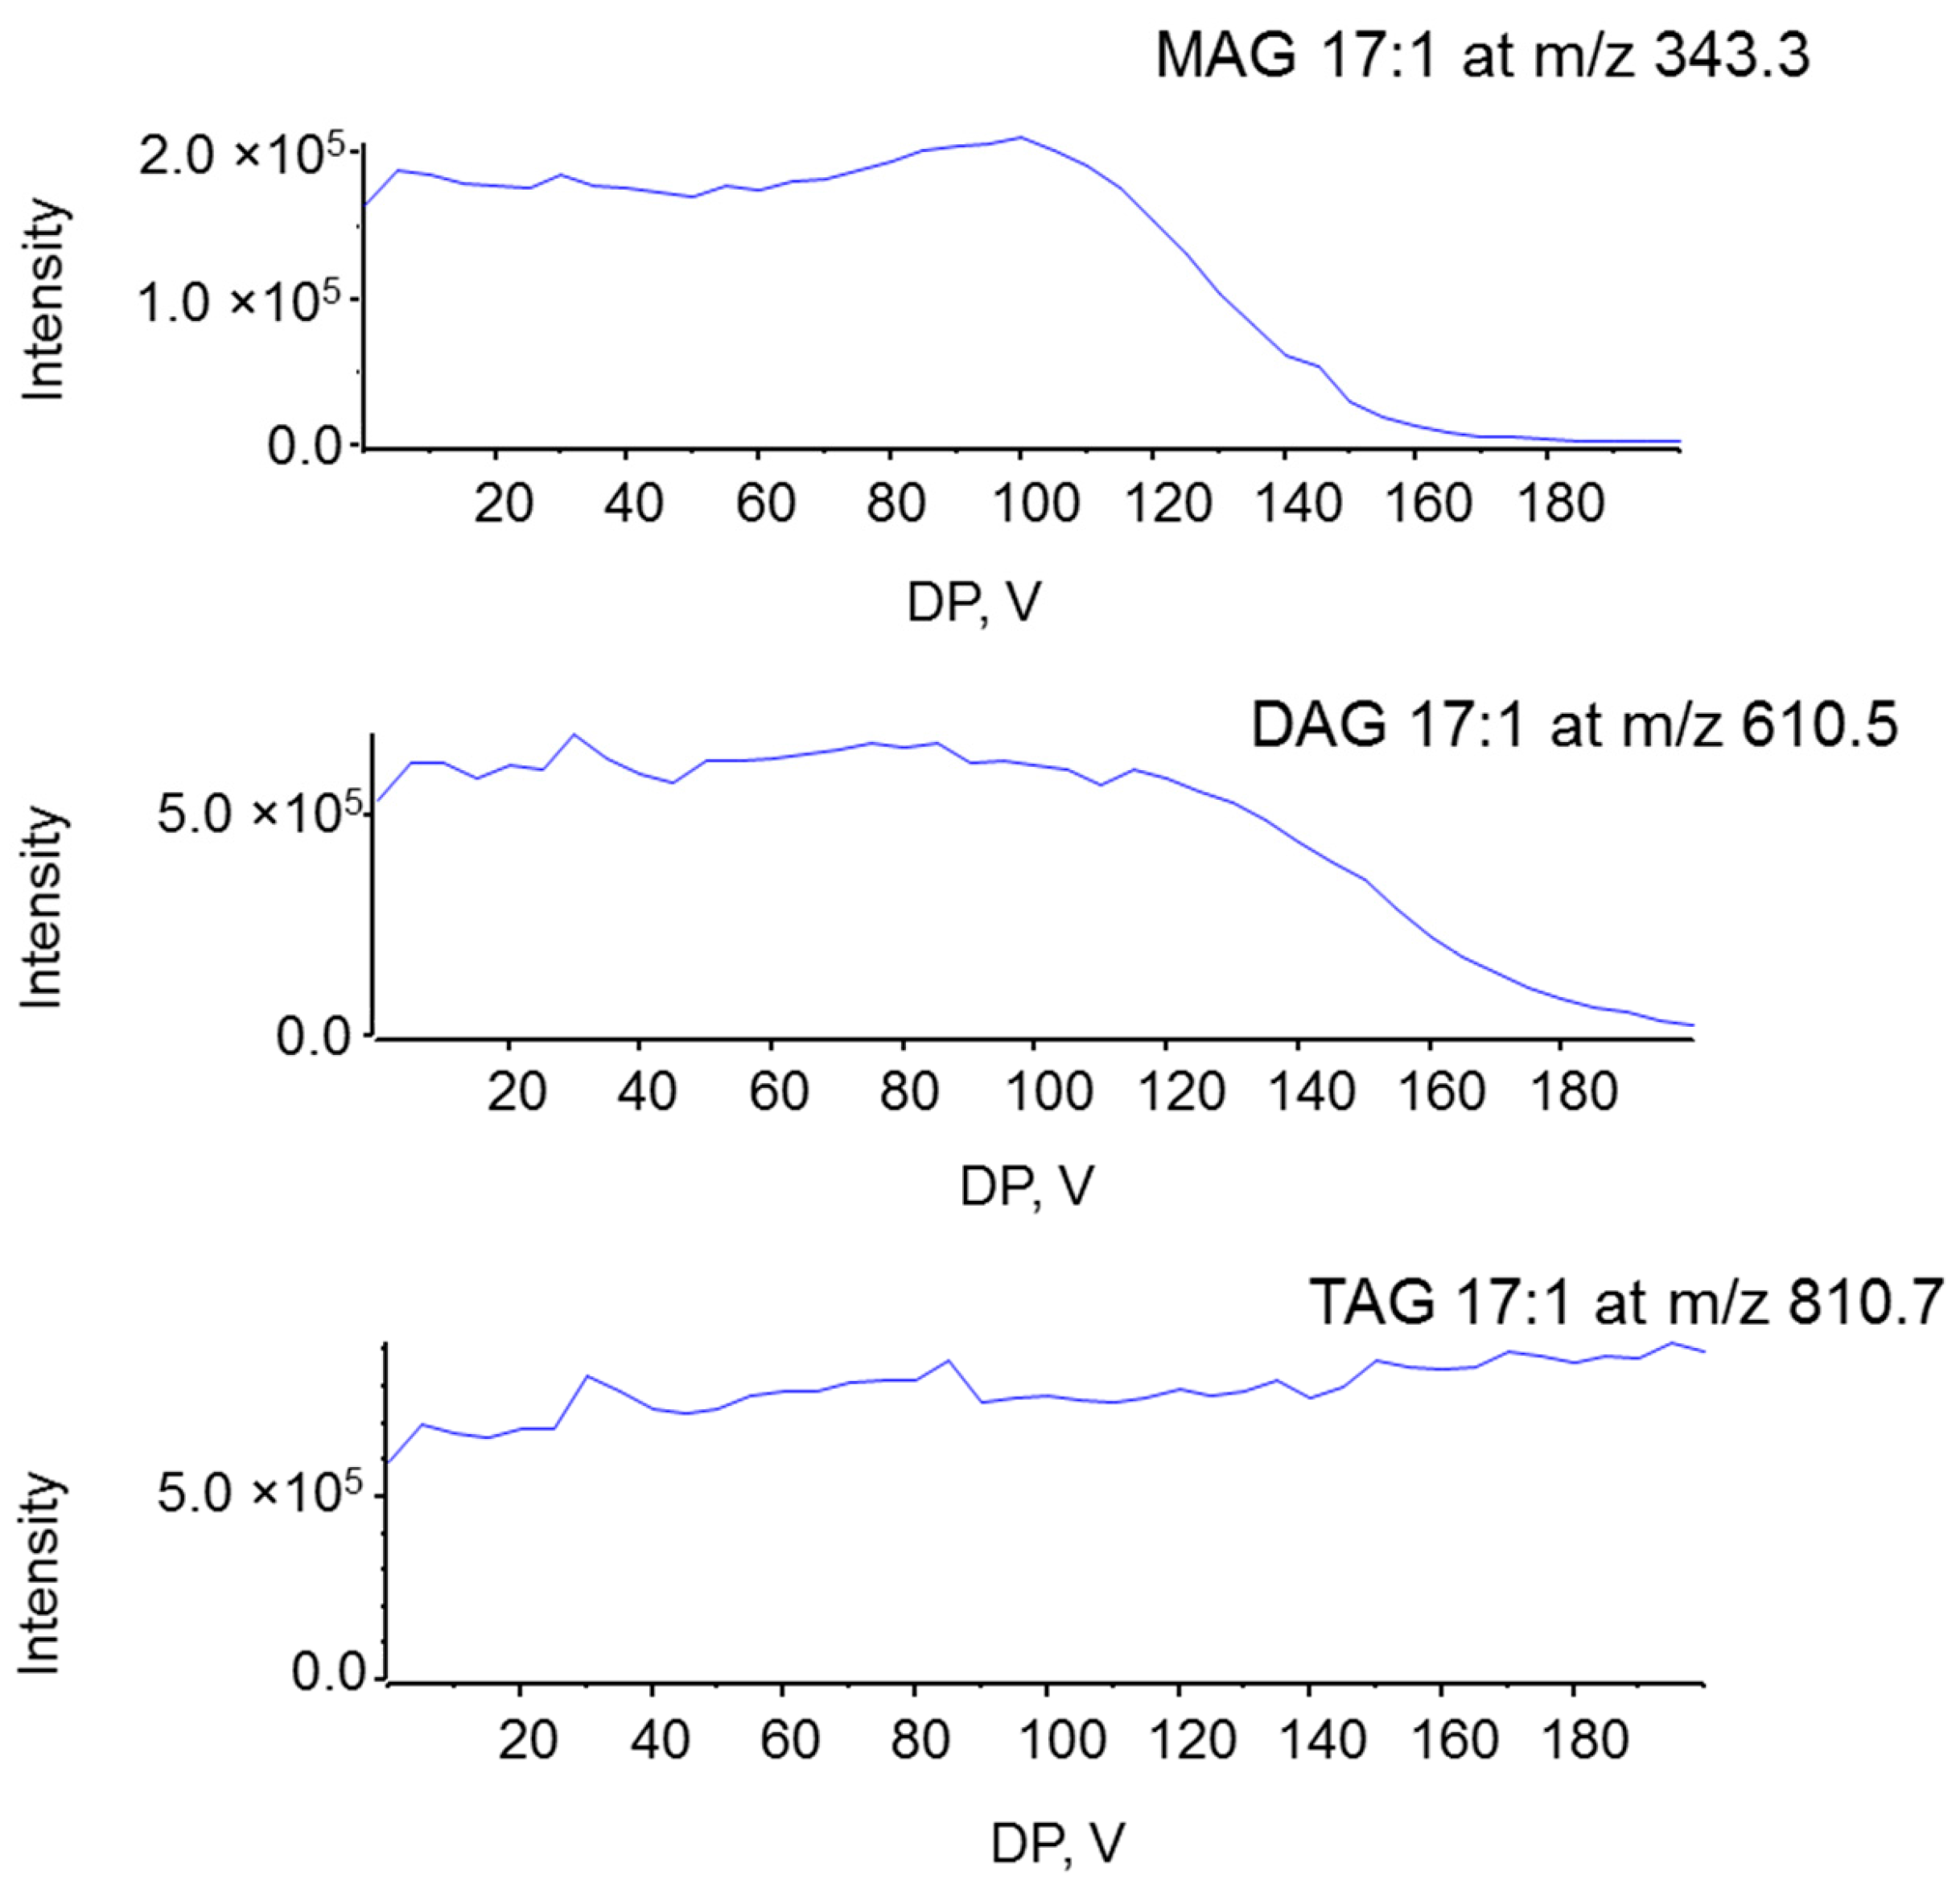
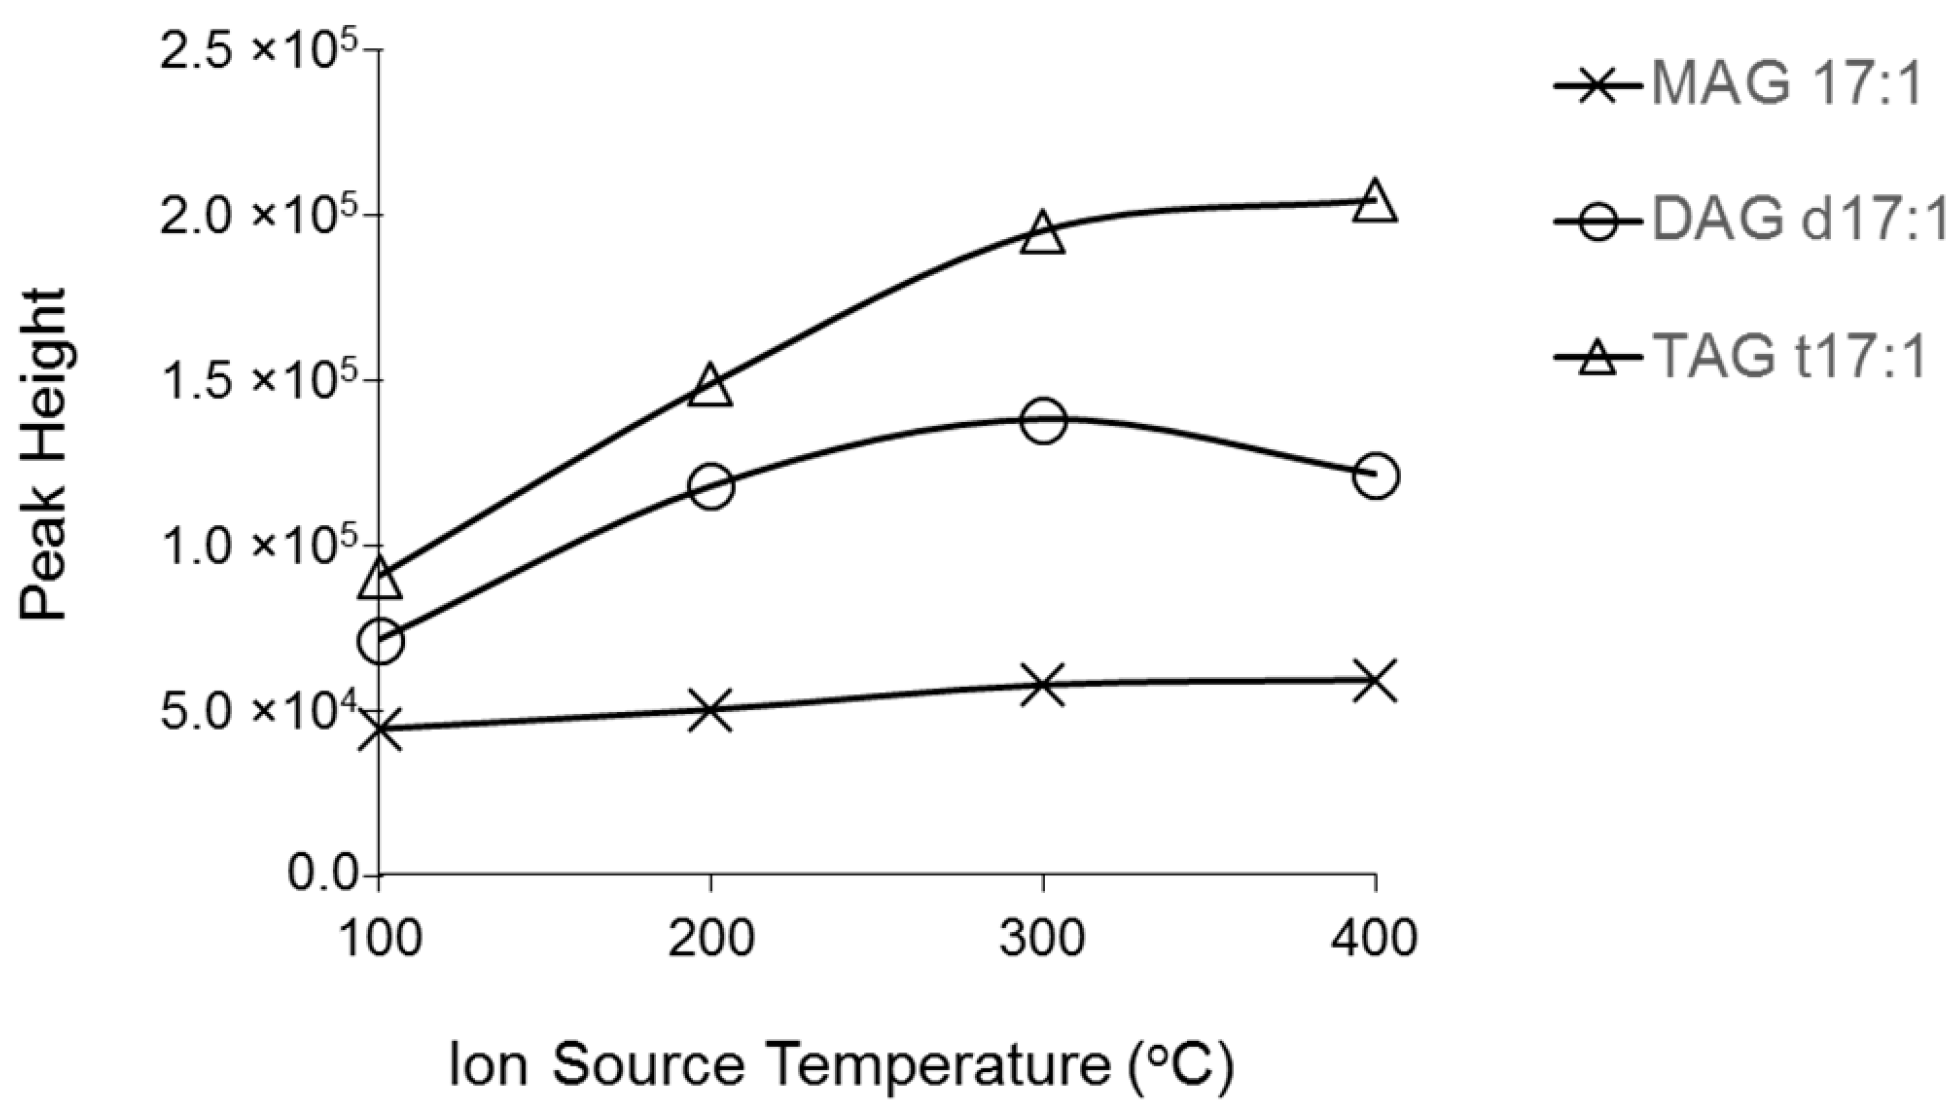
2.1. Characterization MAG, DAG, and TAG Ionization Efficiency
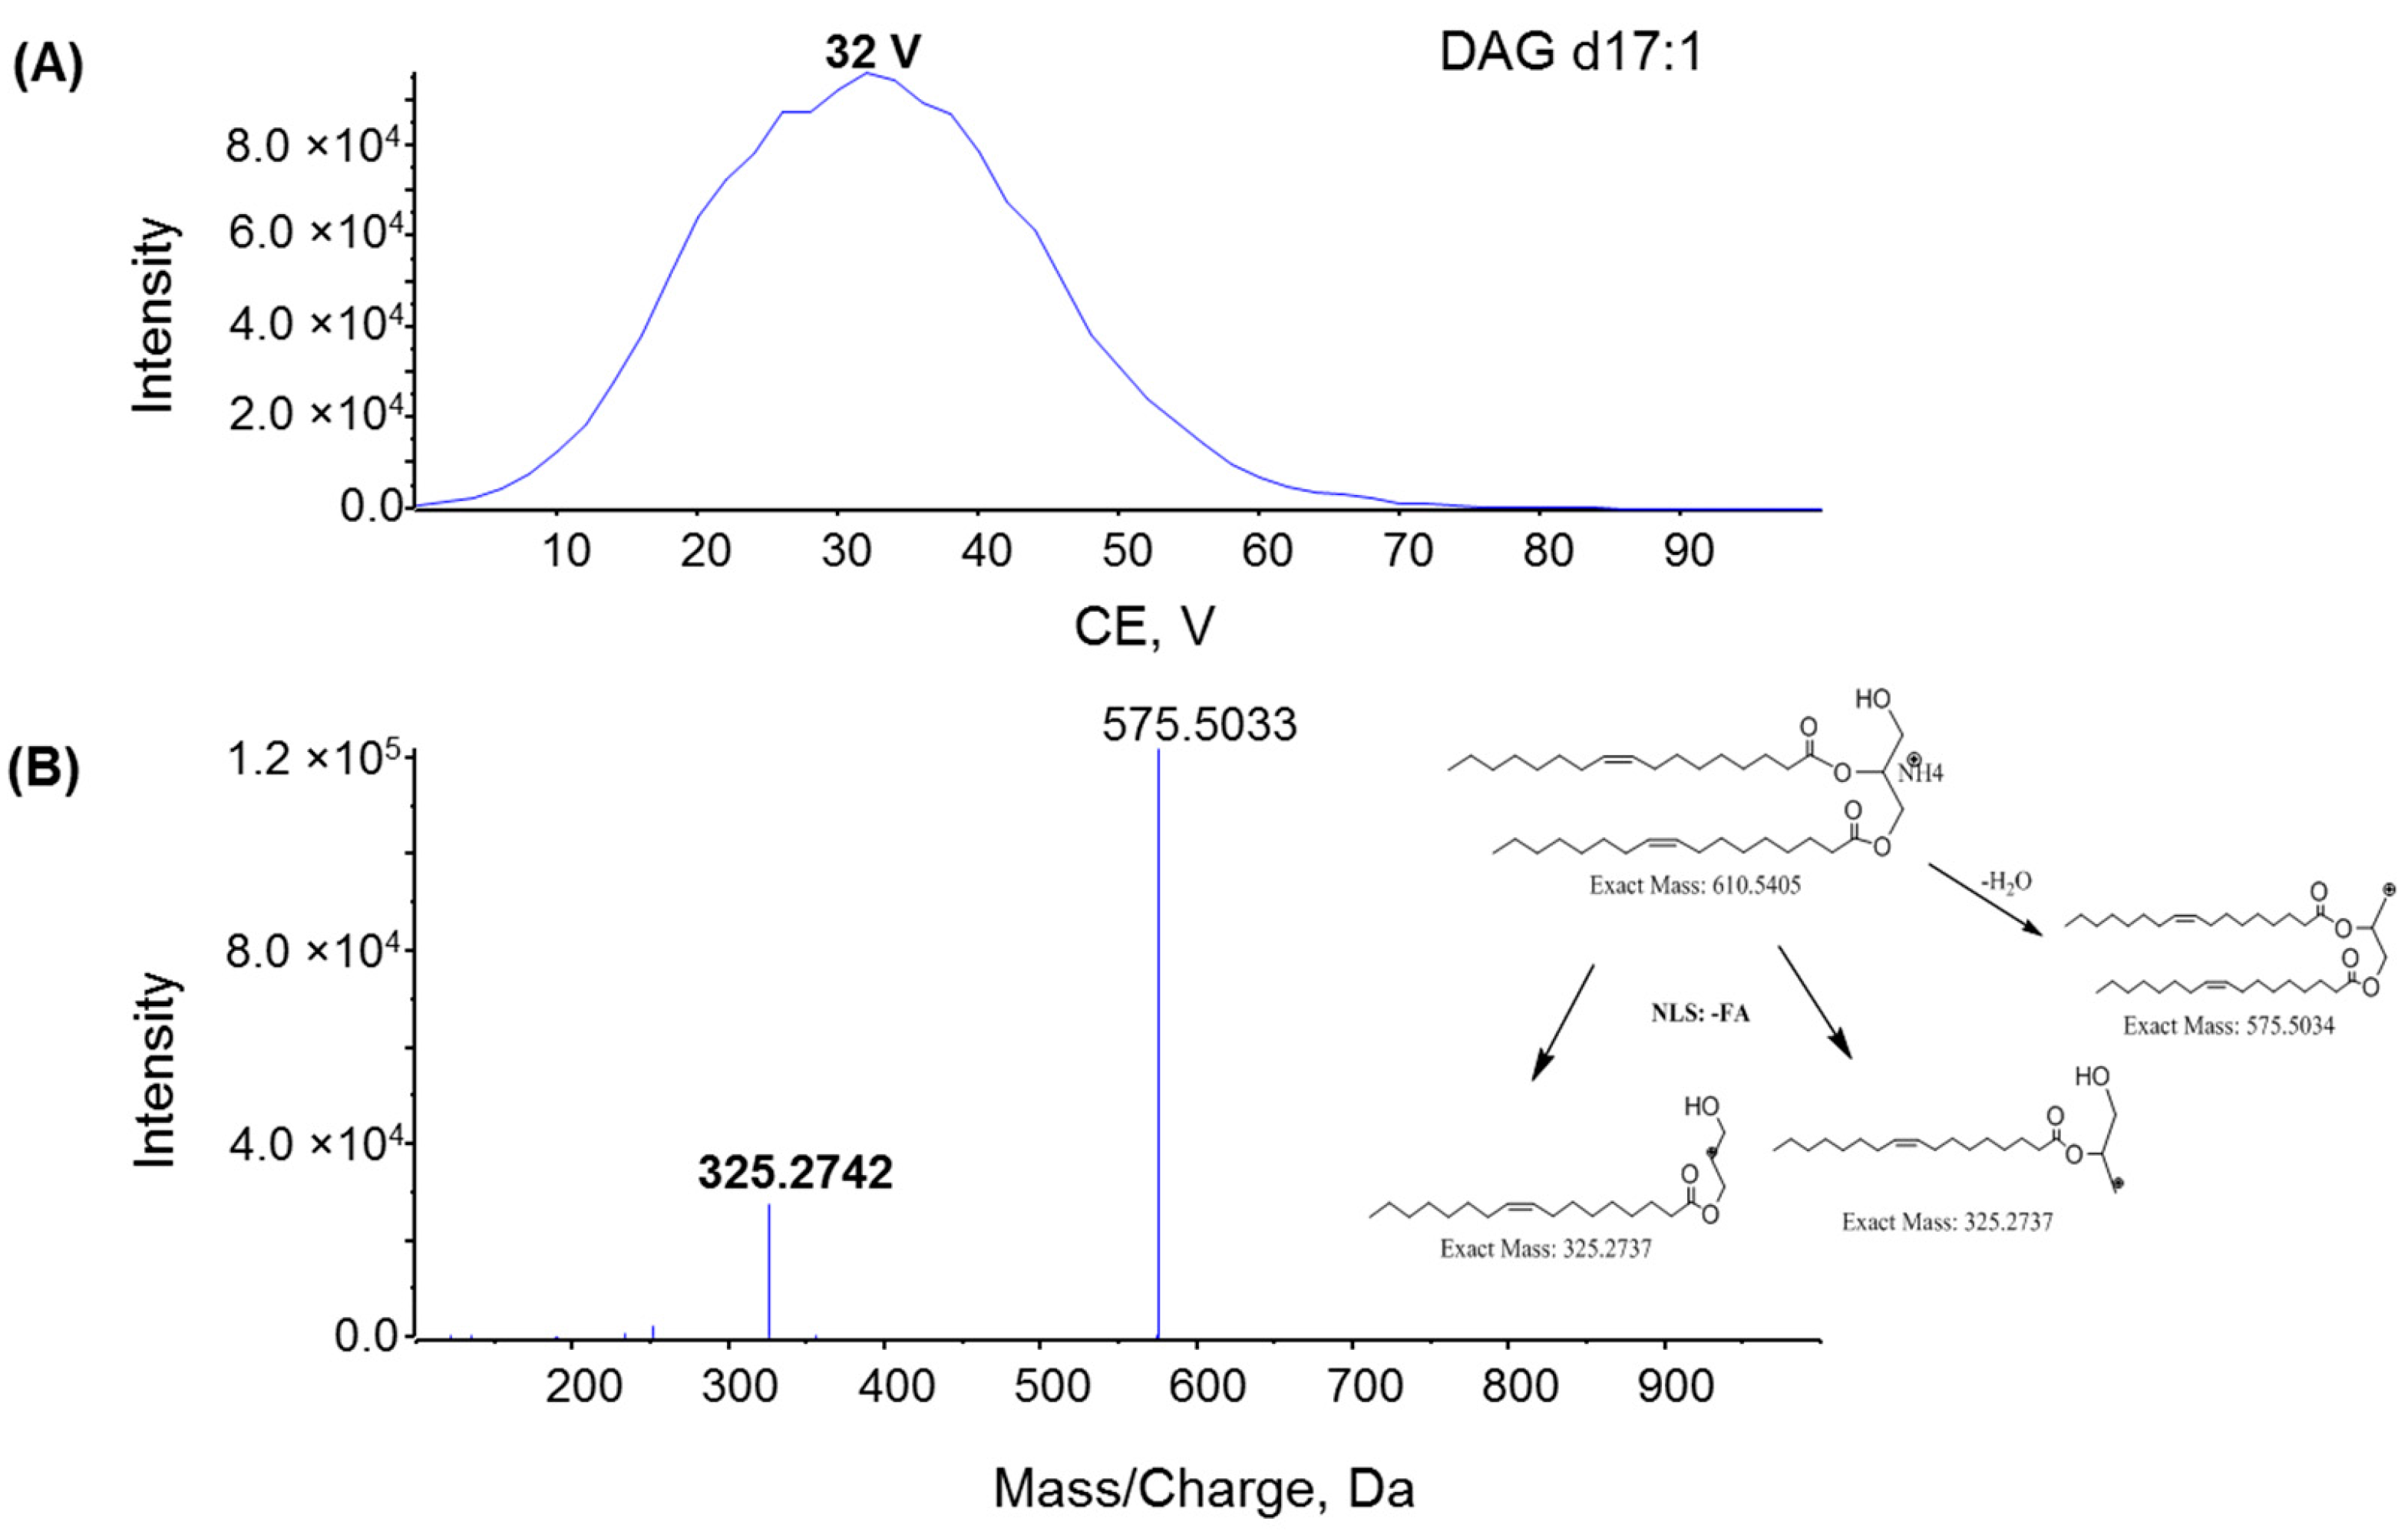
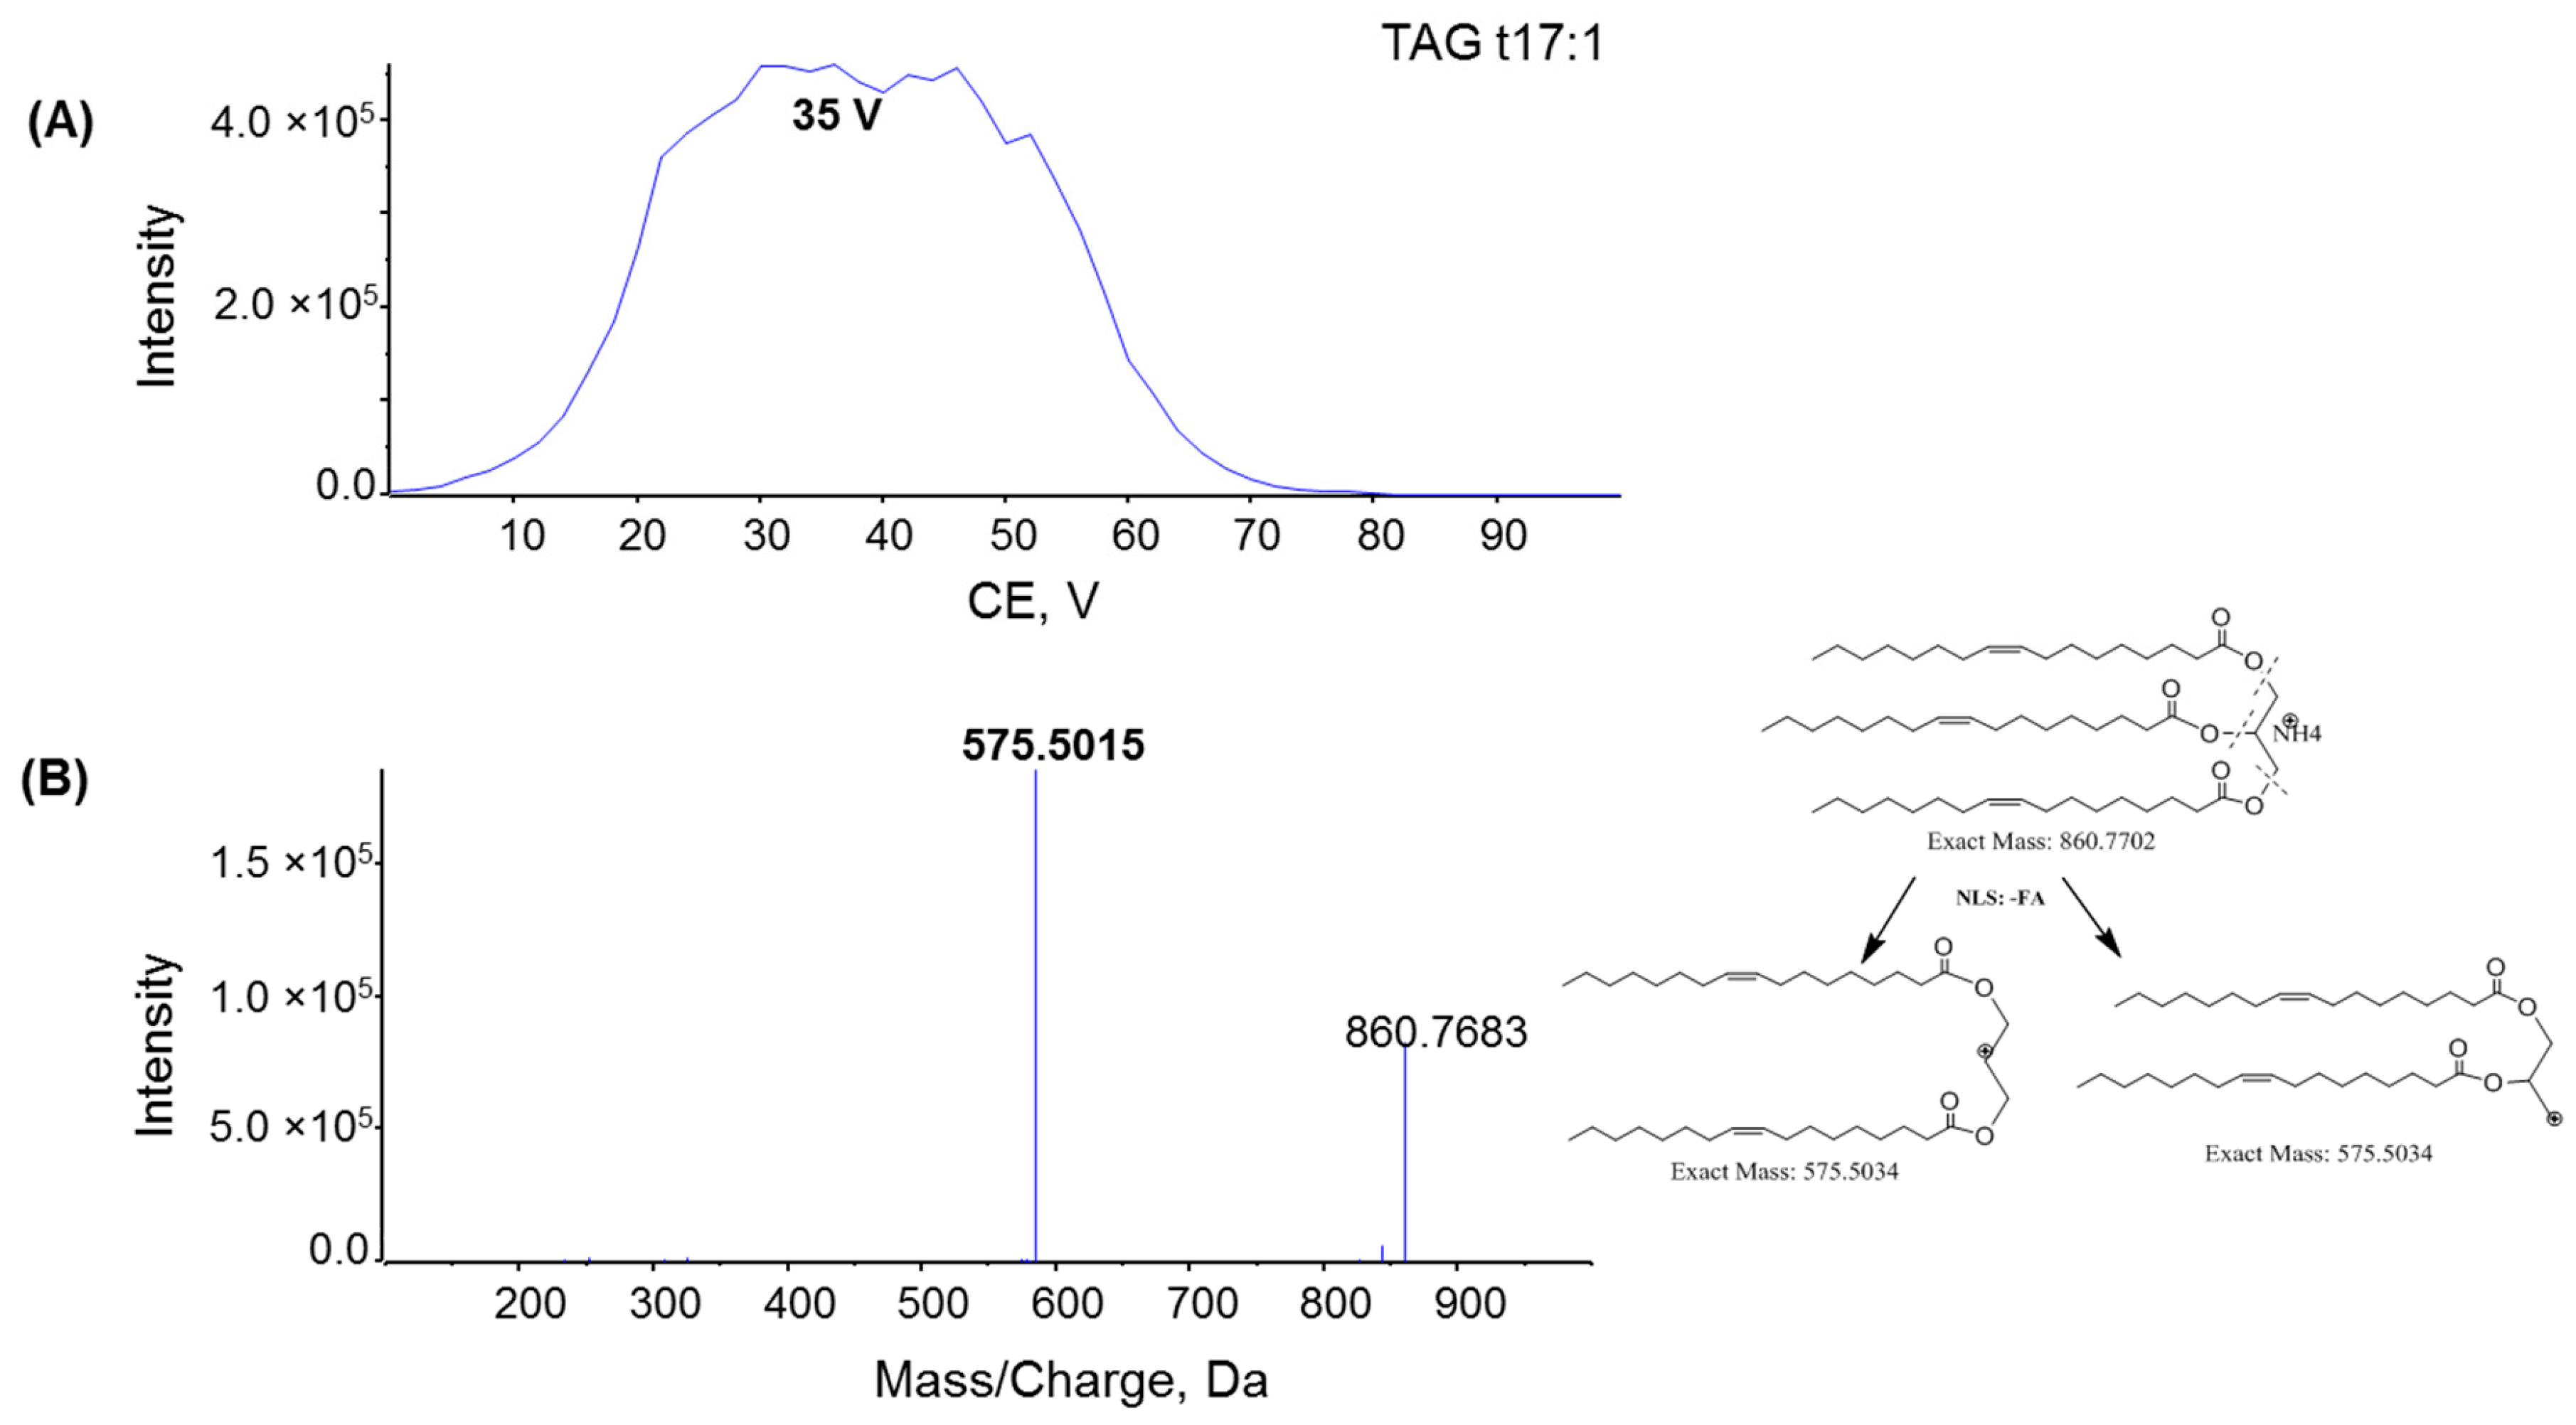
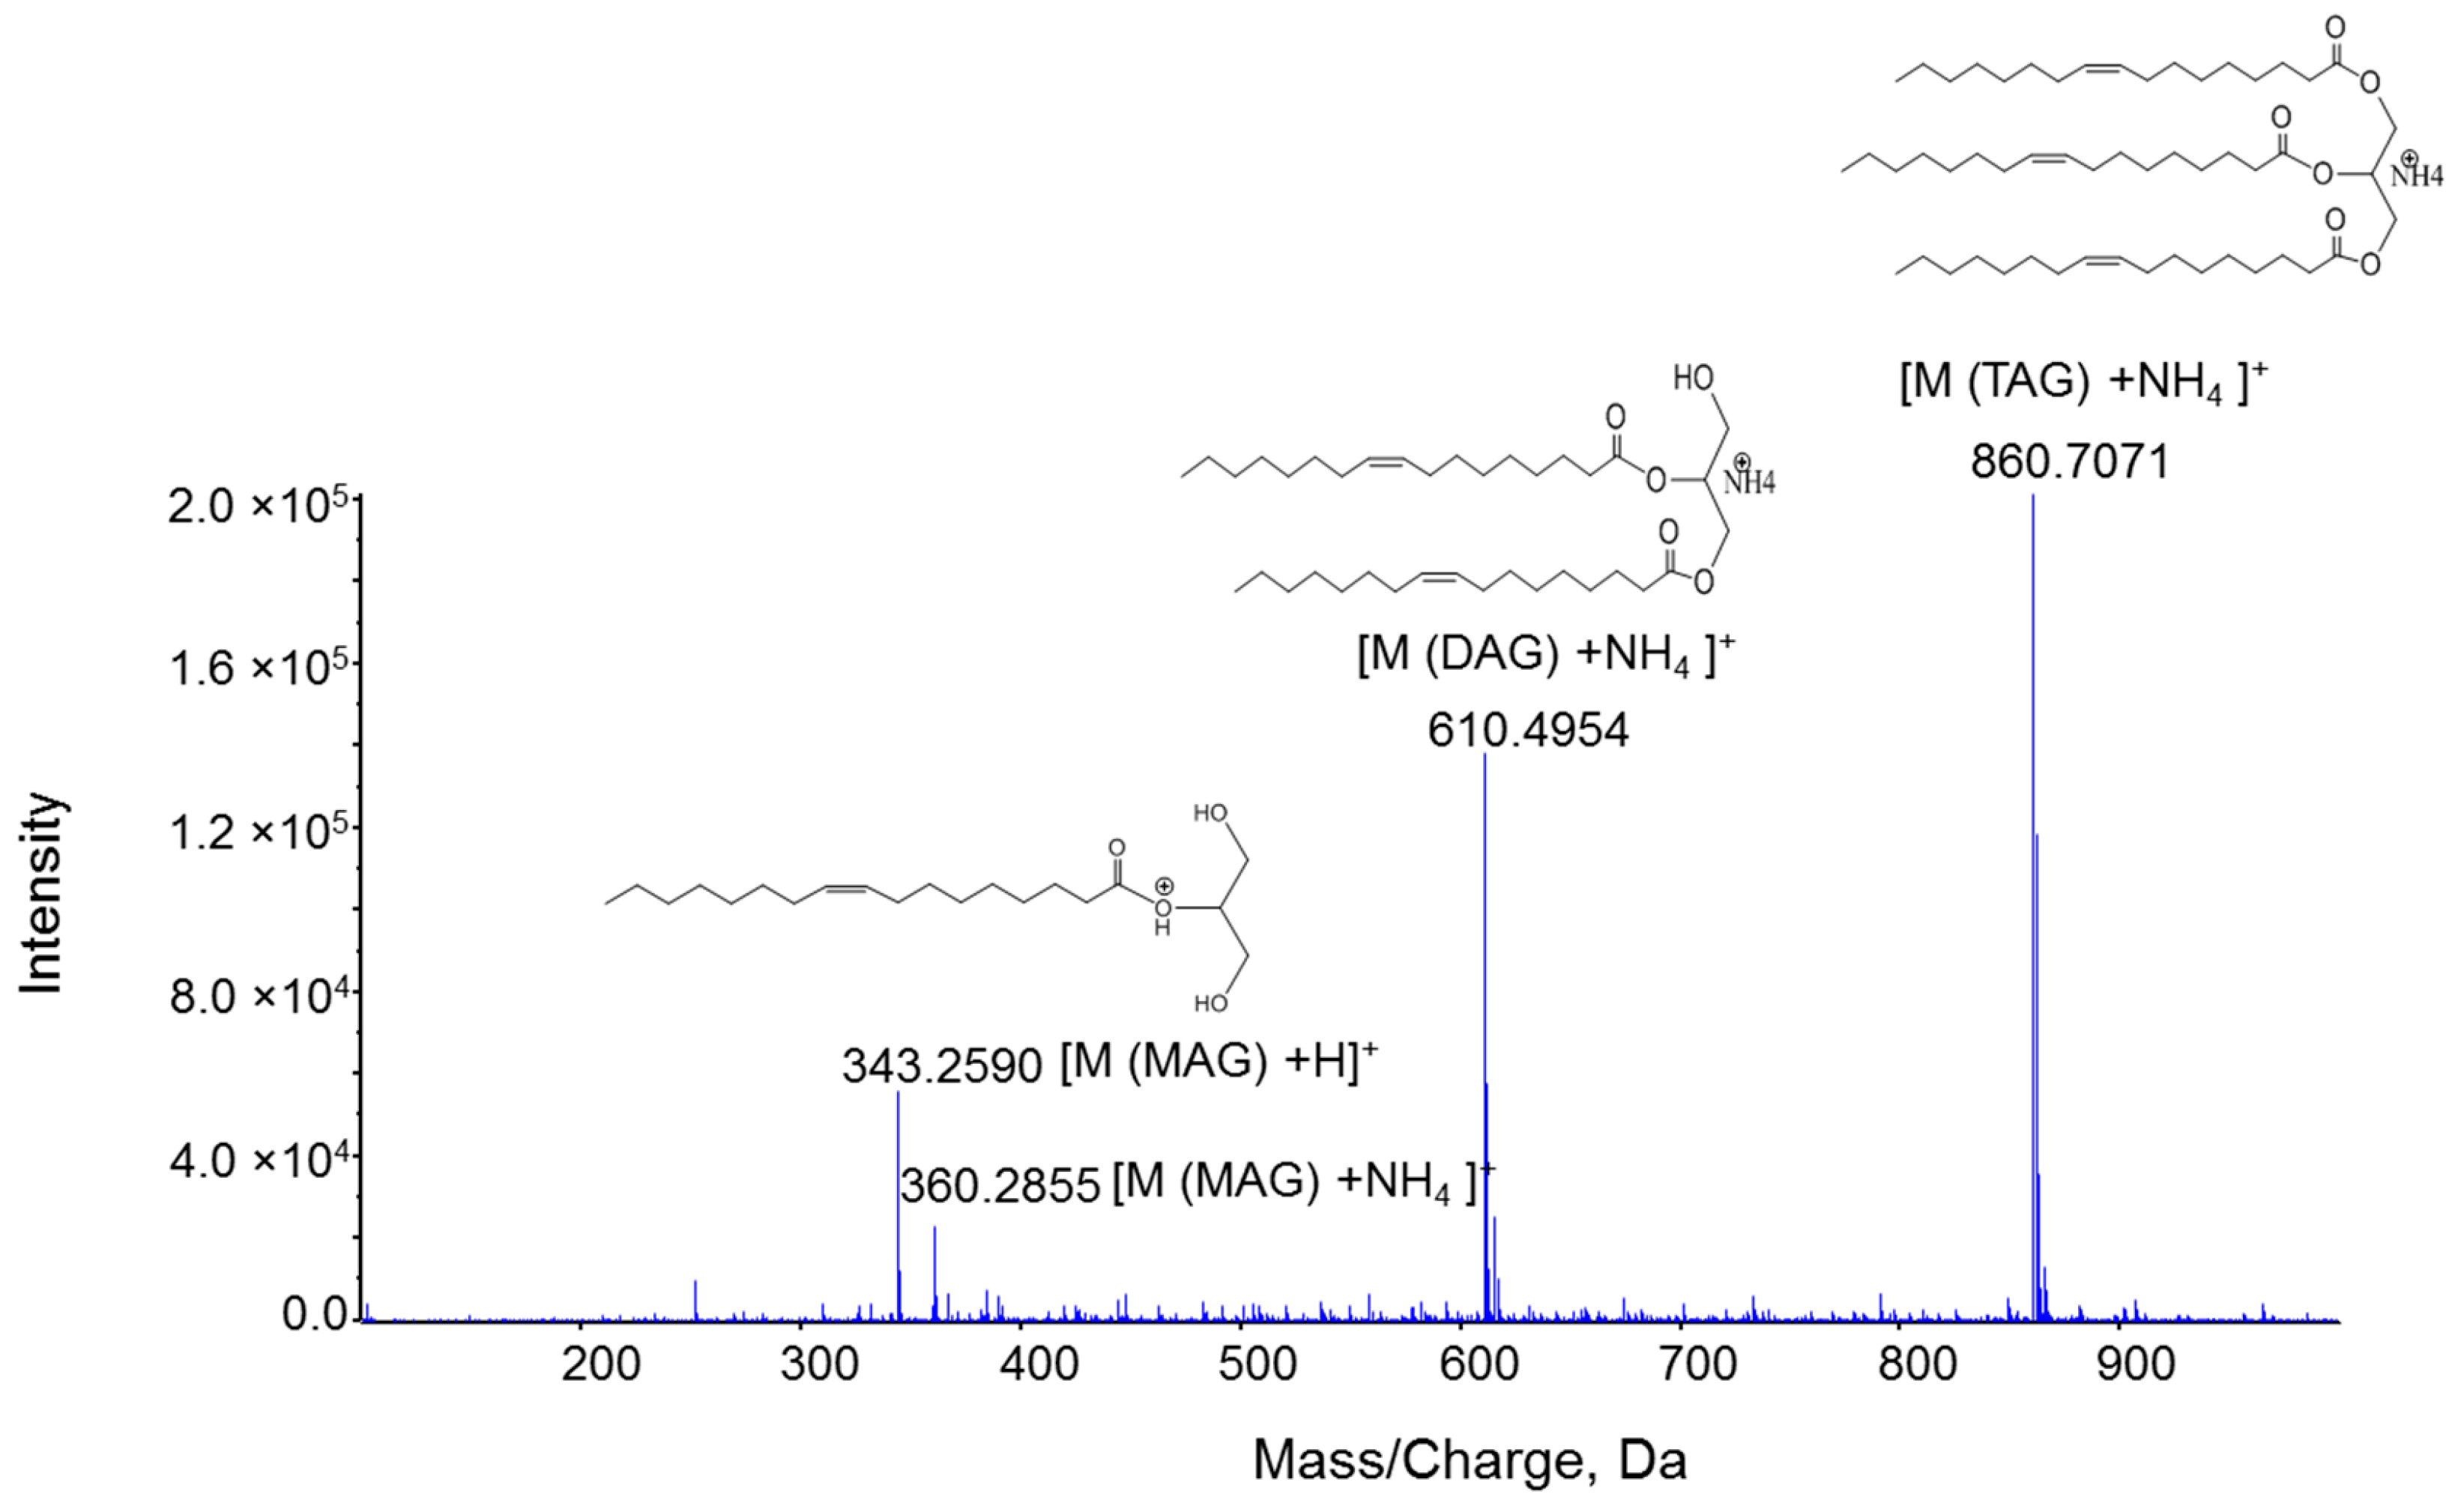
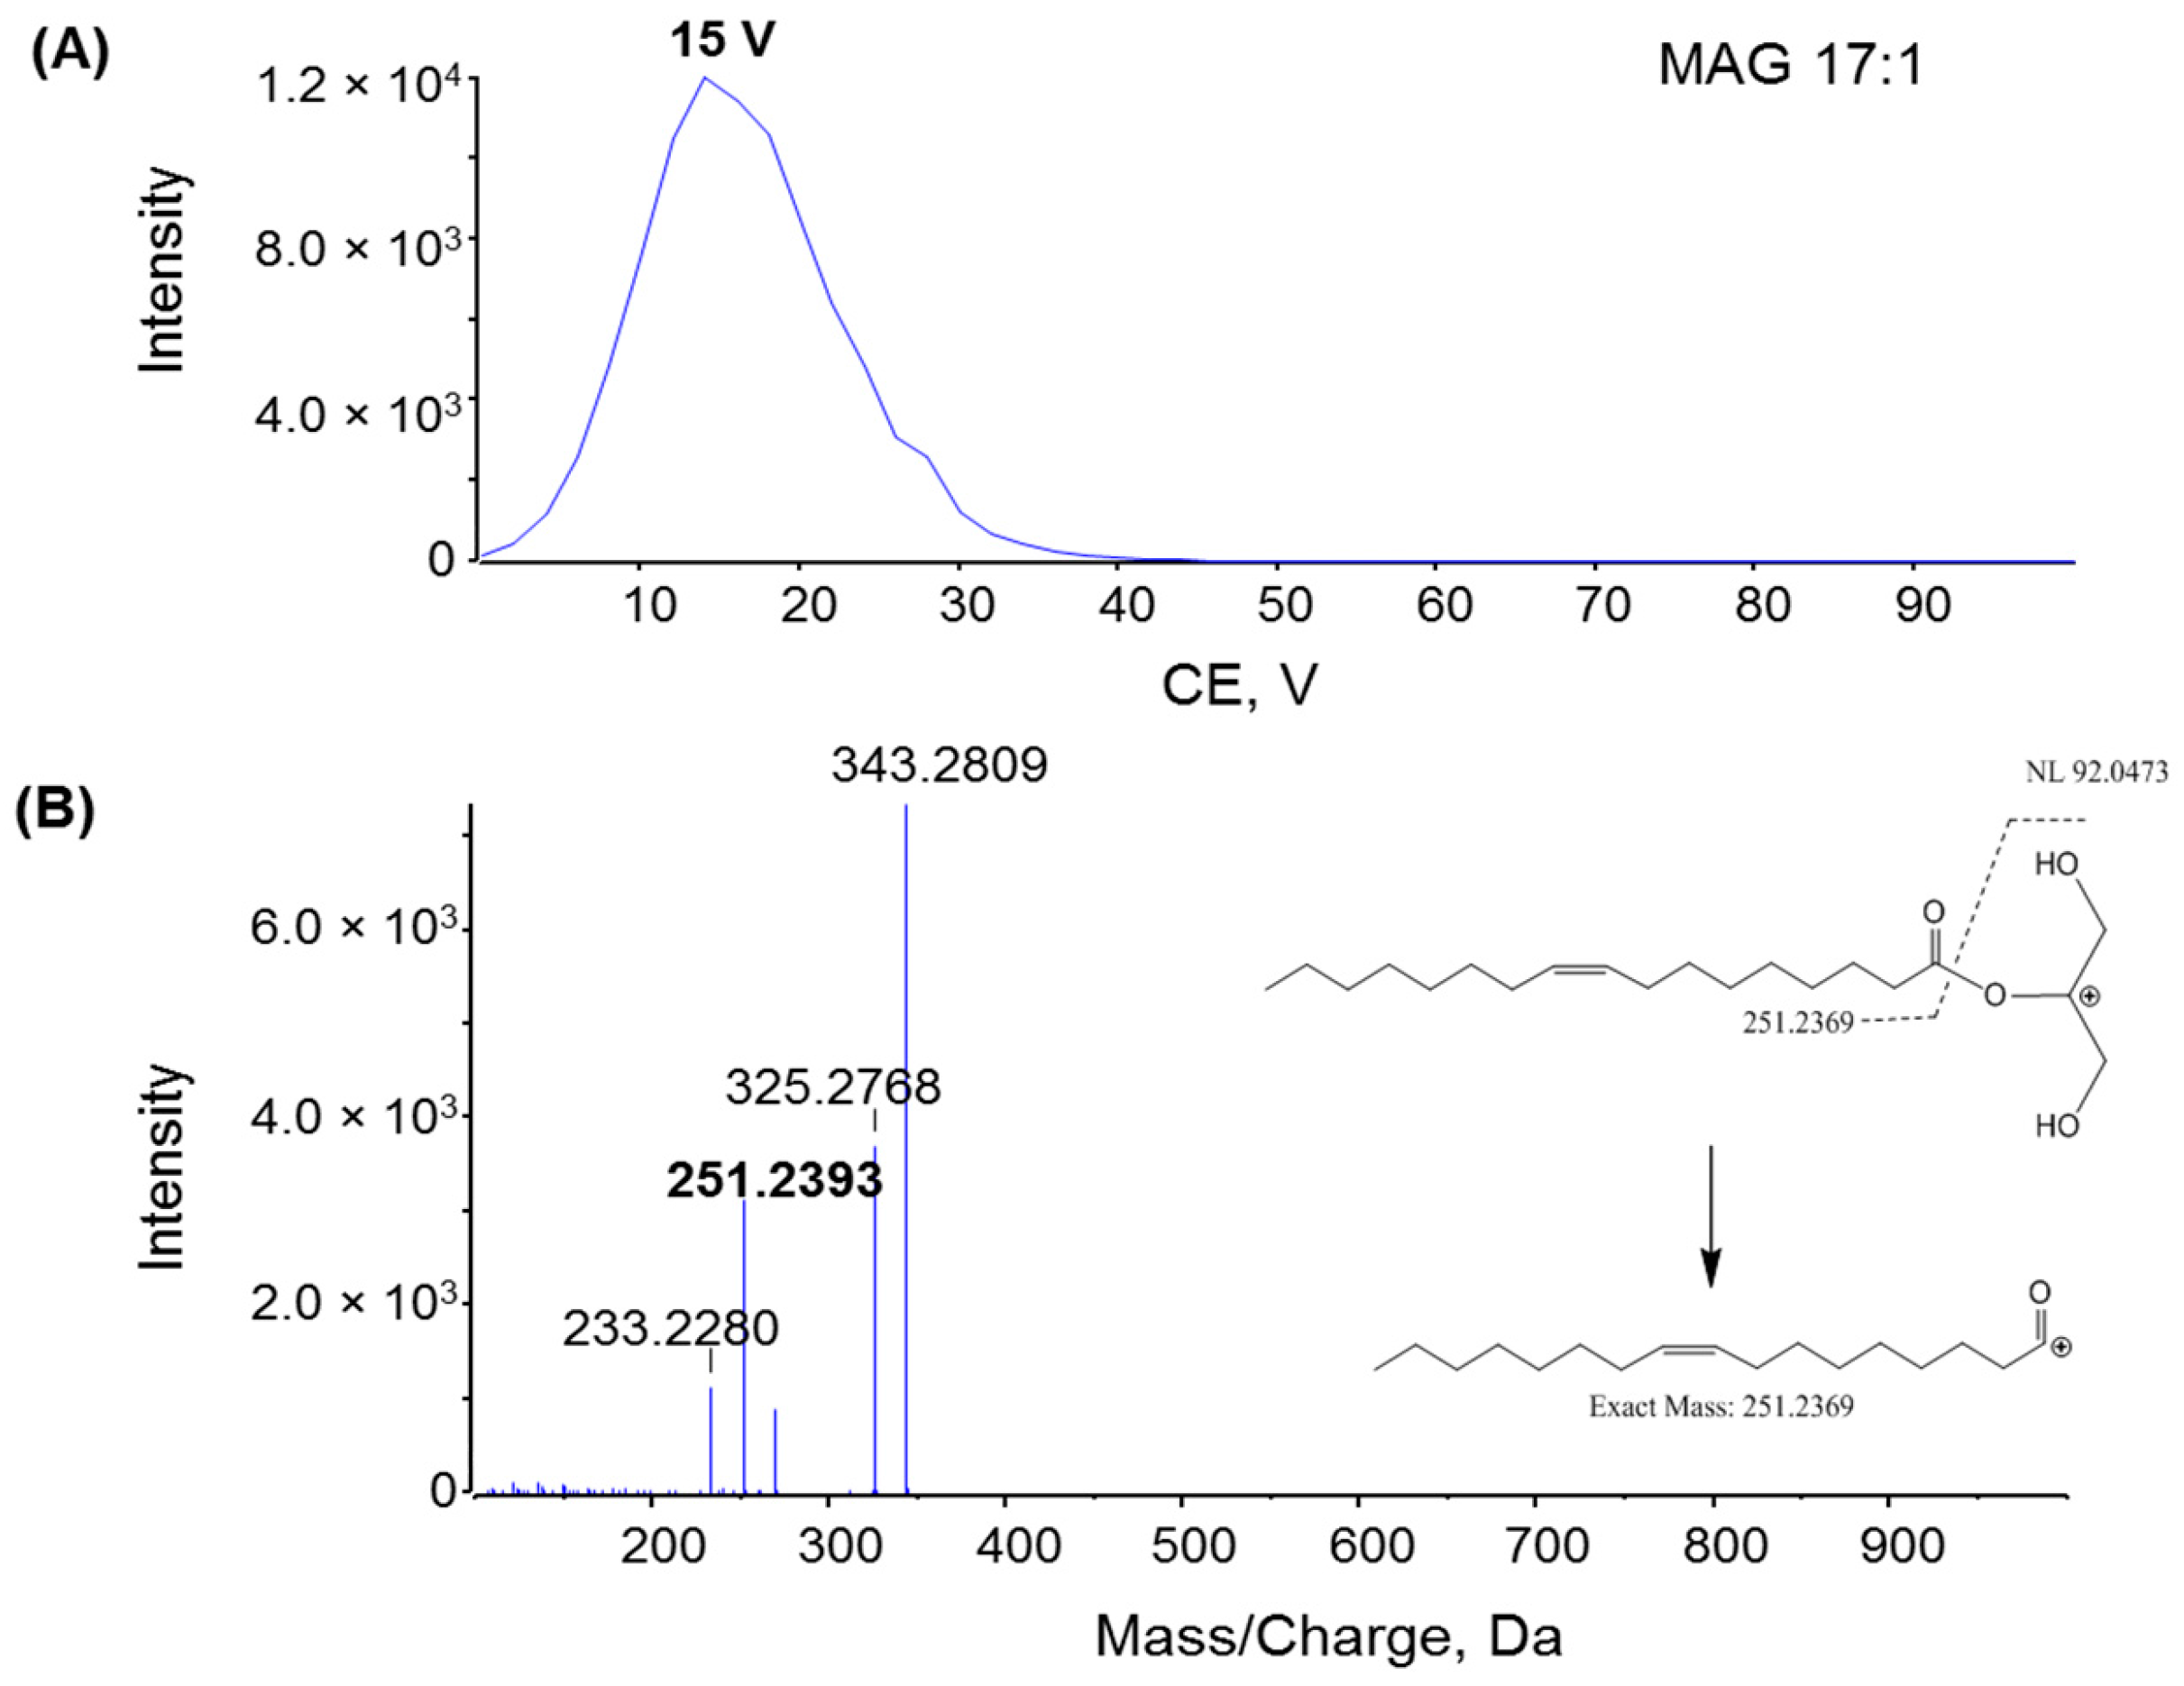
2.2. Fragmentation Mechanism of MAG, DAG, and TAG
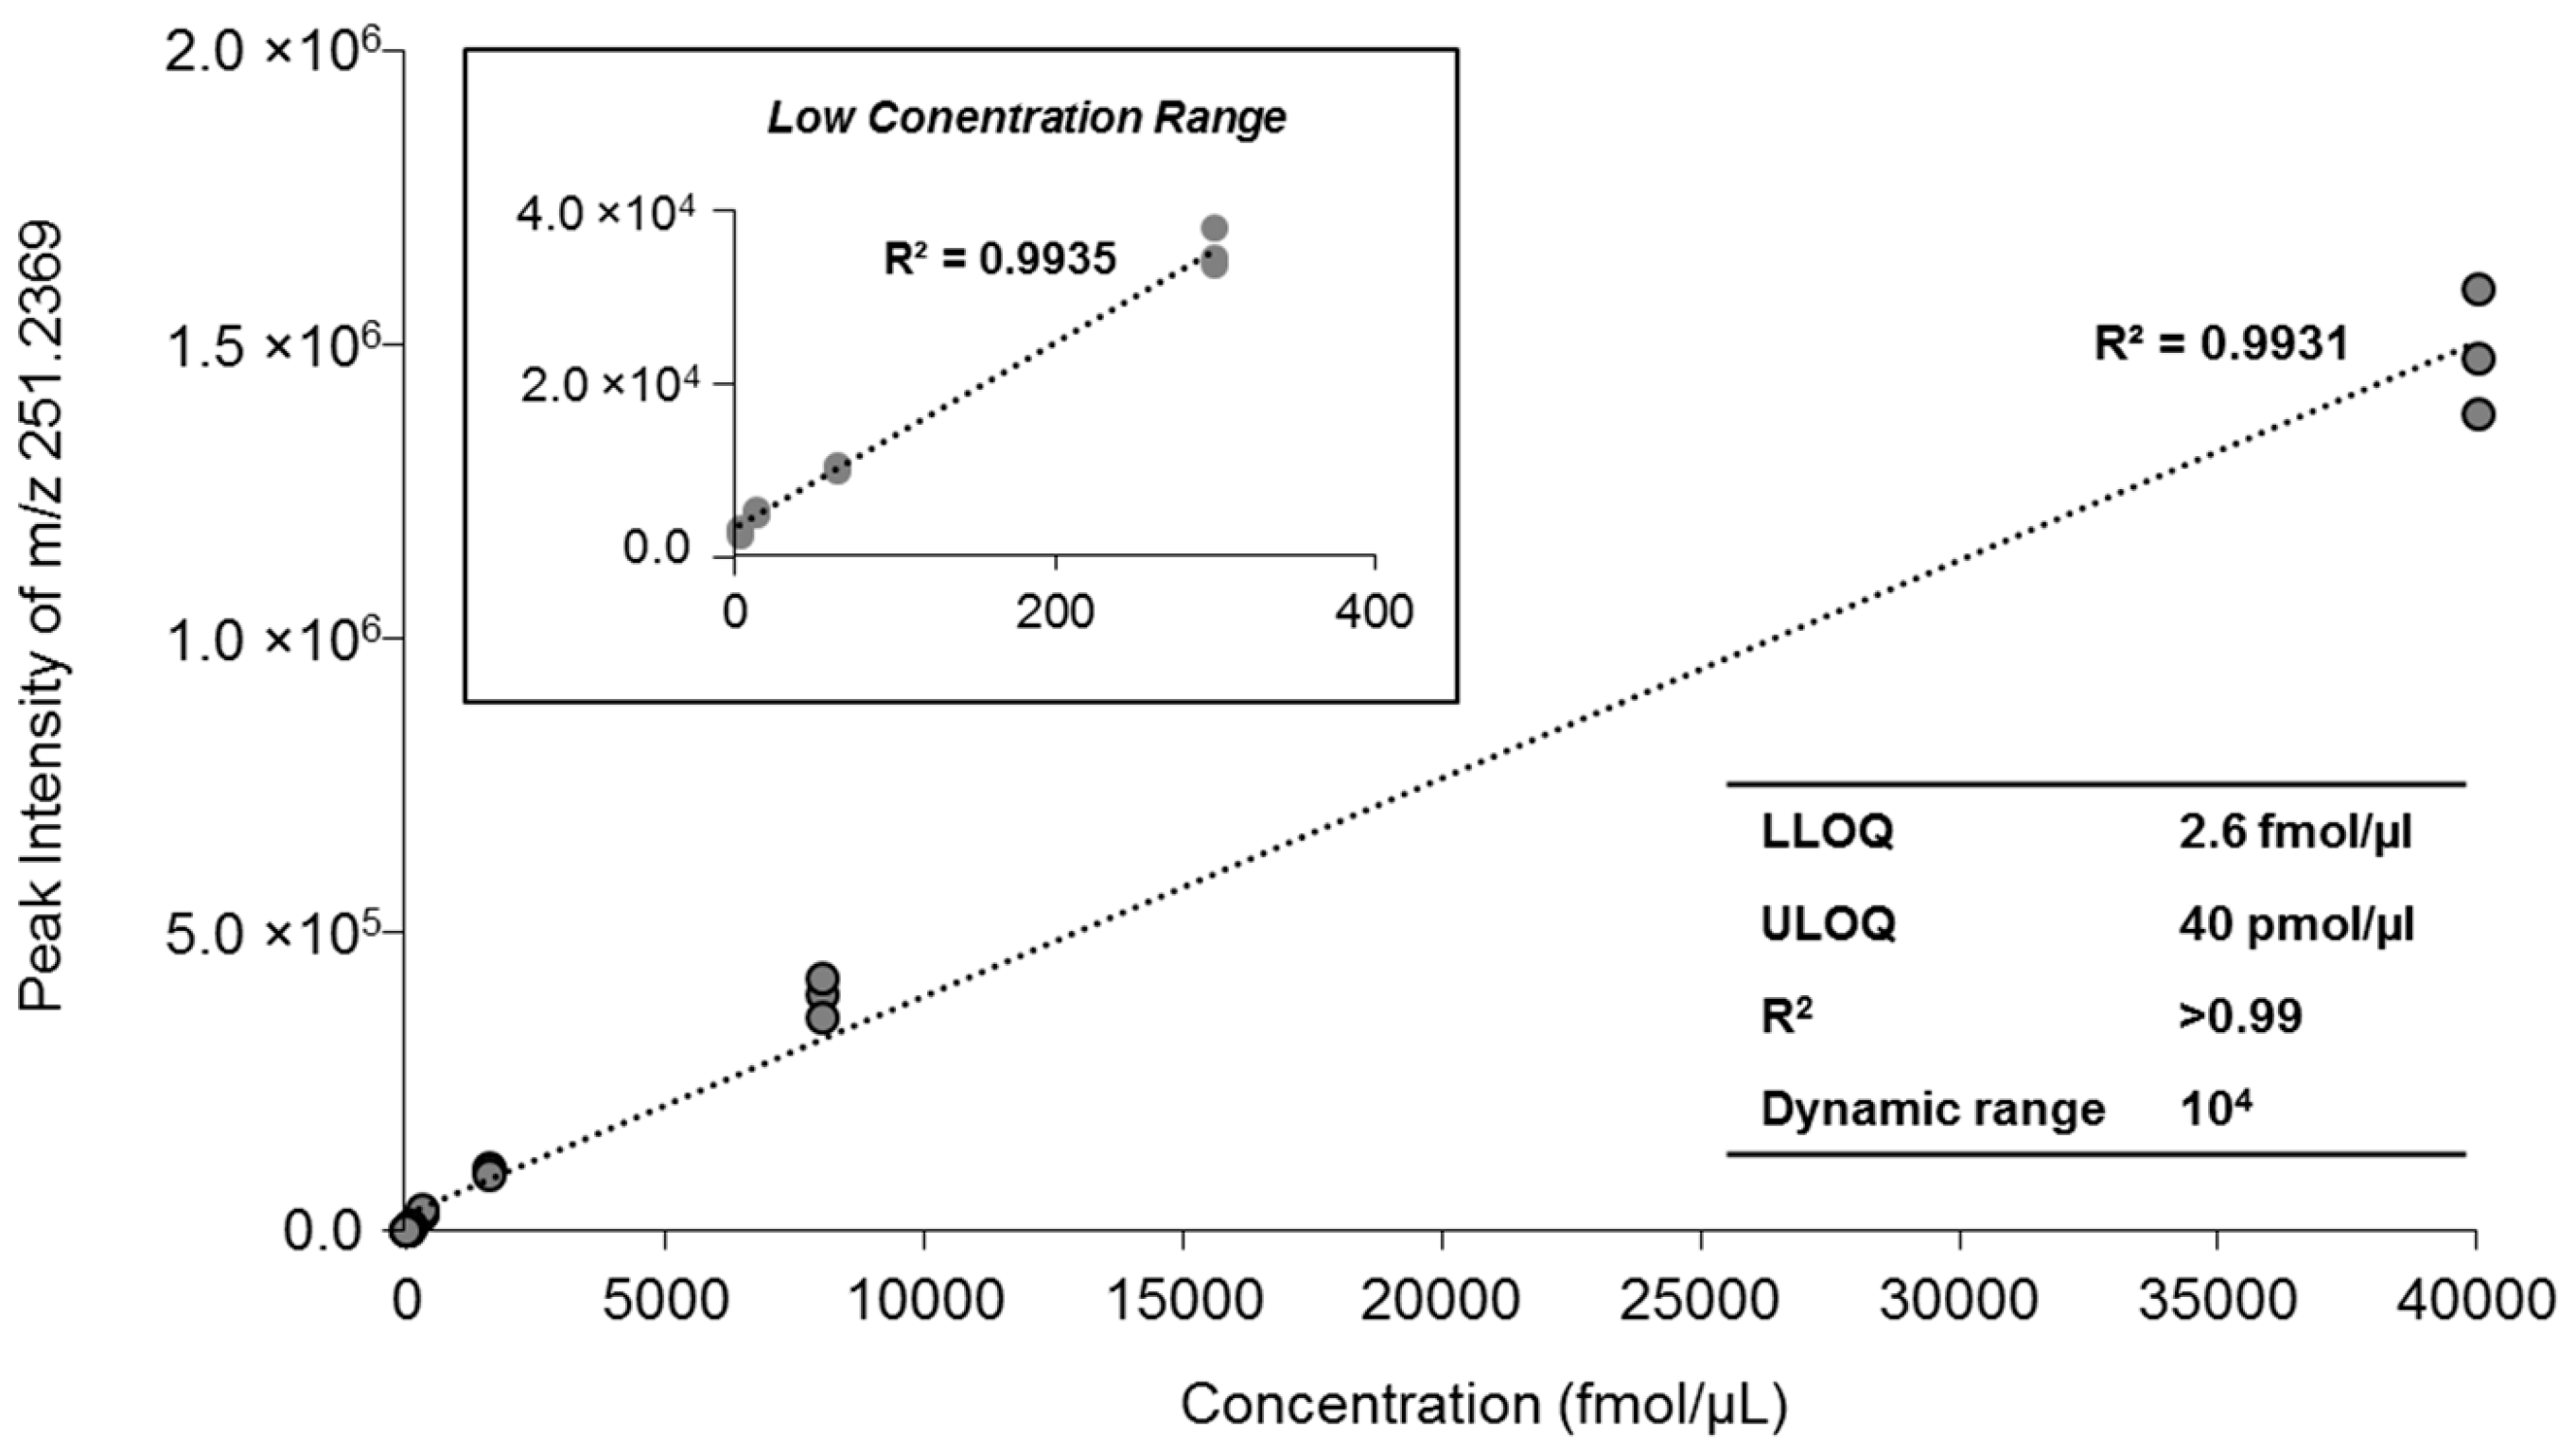
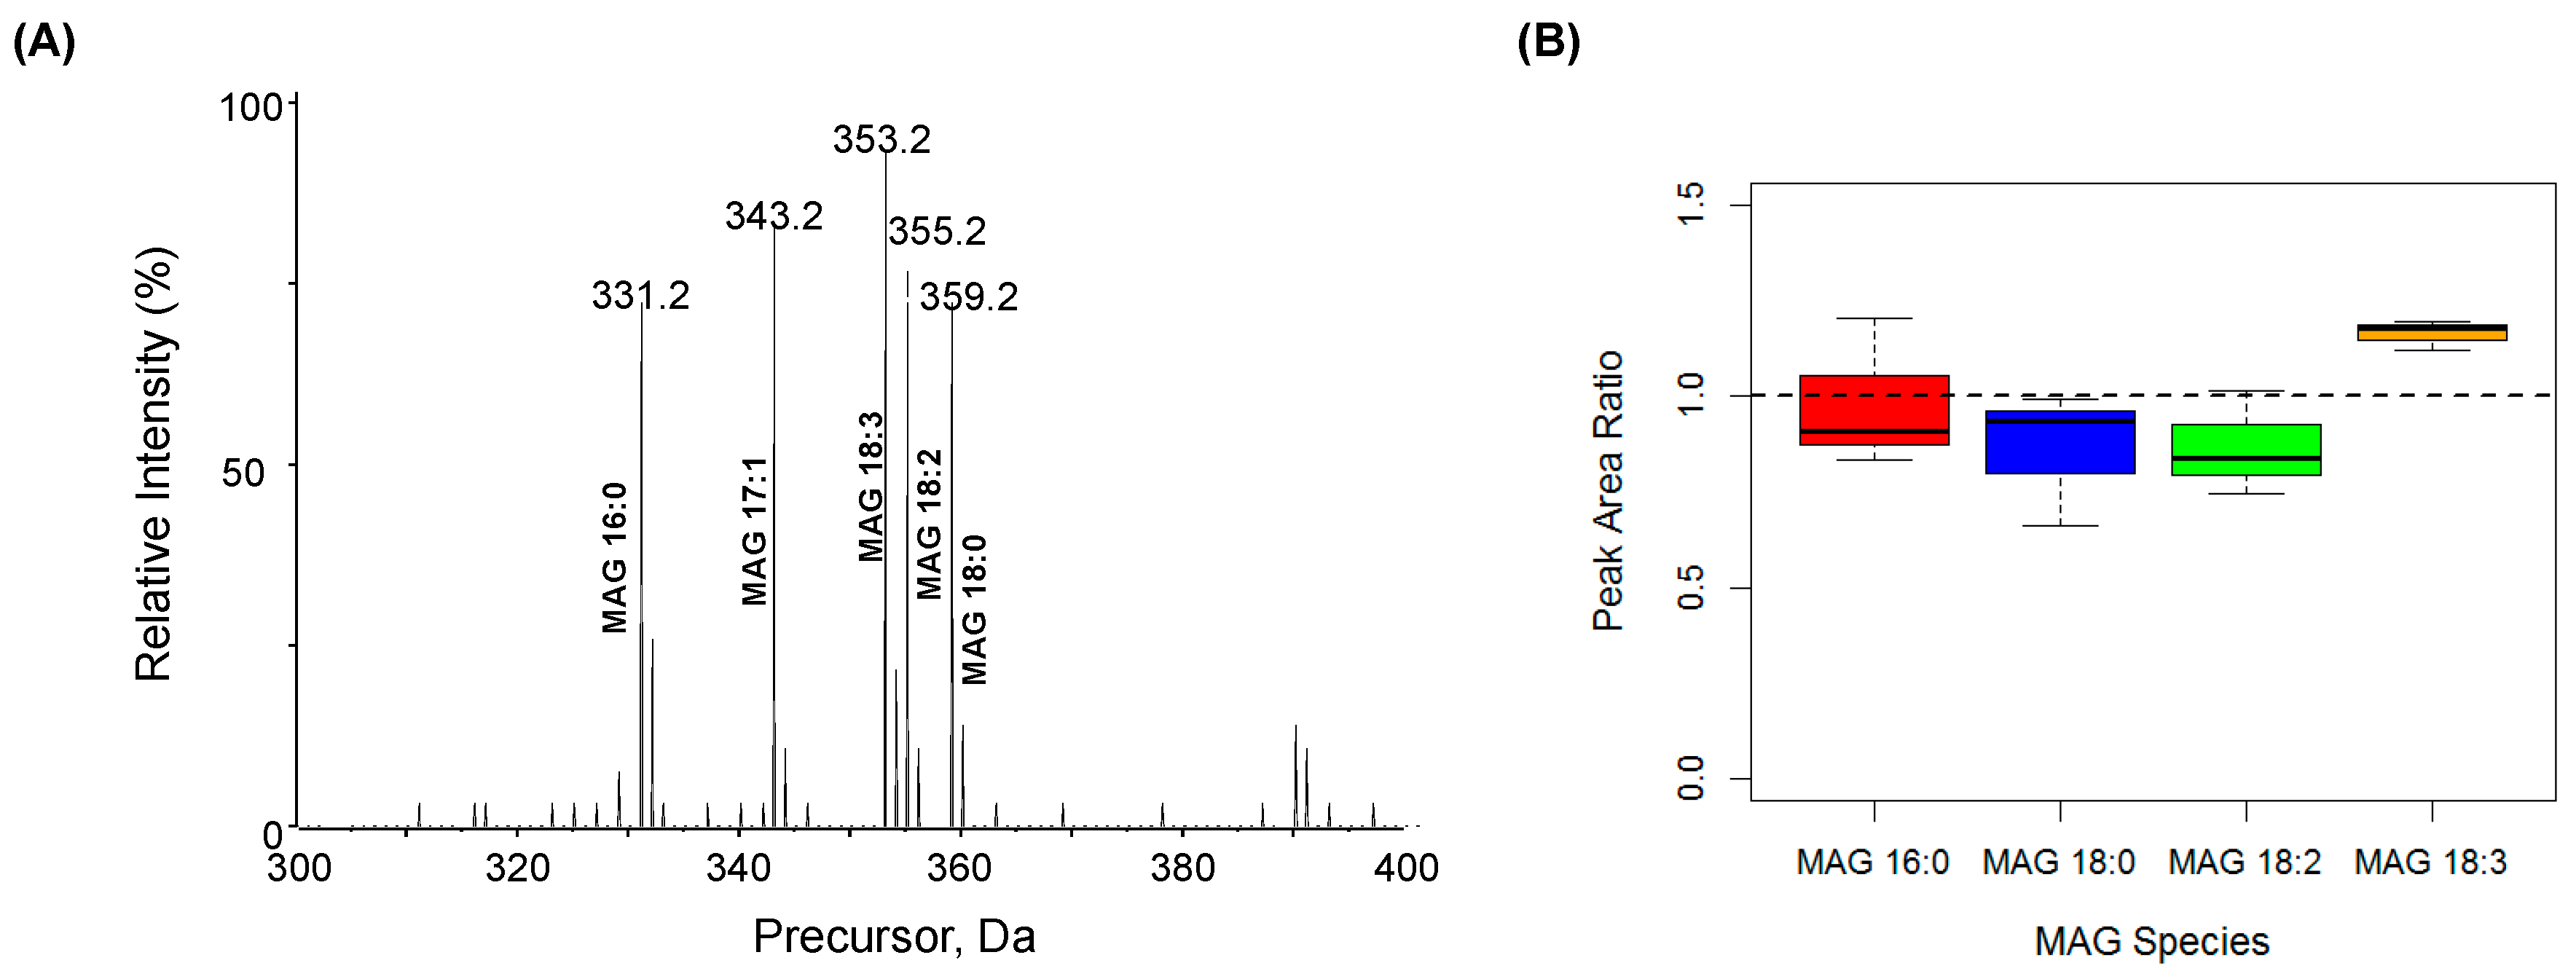
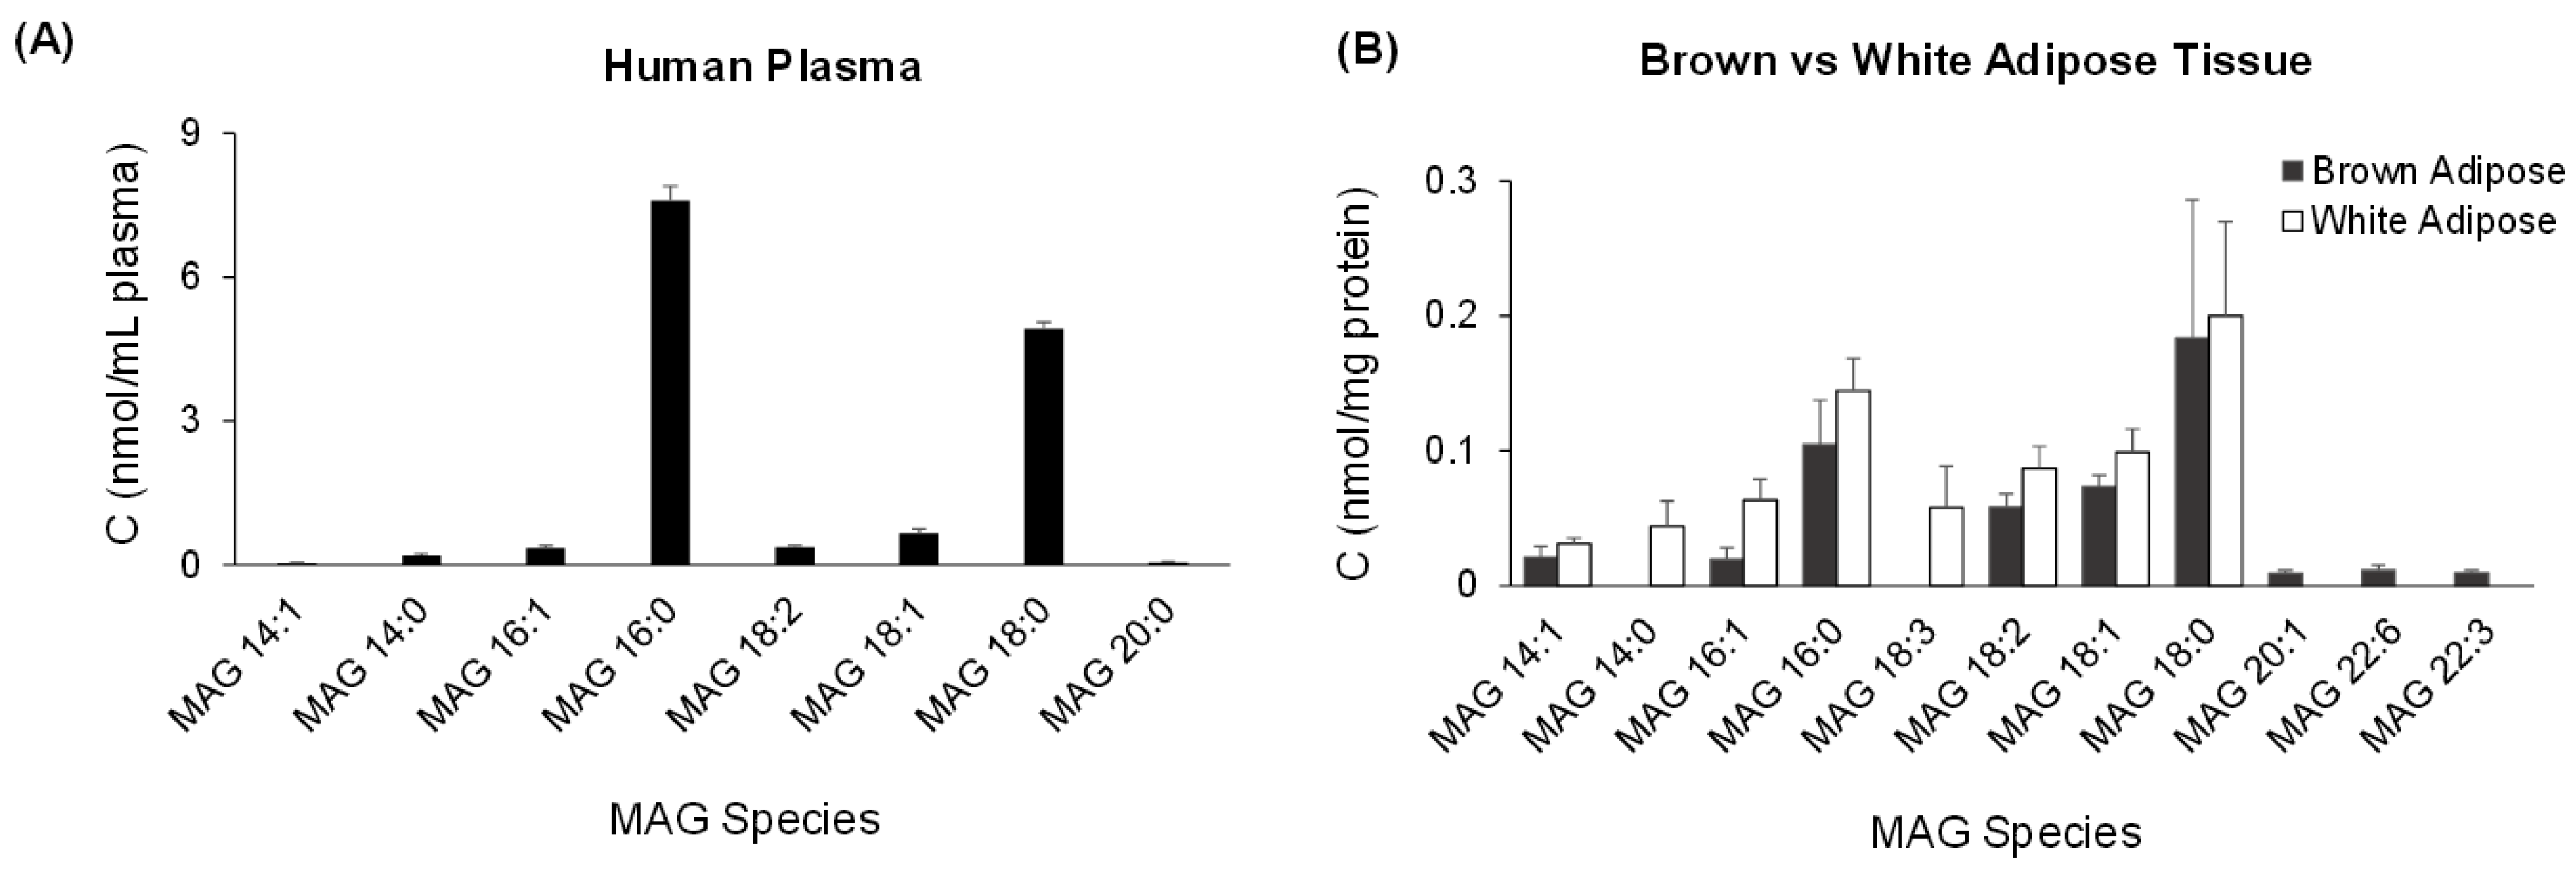
2.3. Quantification of MAG Using the MS/MSALL
3. Discussion
4. Experimental Procedures
4.1. Materials
4.2. Sample Preparation and Extraction
4.3. Direct Infusion Quadruple Time of Flight (QTOF) Mass Spectrometry
Acknowledgments
Author Contributions
Conflicts of Interest
References
- Mu, H.; Porsgaard, T. The metabolism of structured triacylglycerols. Prog. Lipid Res. 2005, 44, 430–448. [Google Scholar] [CrossRef] [PubMed]
- Mechoulam, R.; Ben, S. Identification of an endogenous 2-monoglyceride, present in canine gut, that binds to cannabinoid receptors. Biochem. Pharmacol. 1995, 50, 83–90. [Google Scholar] [CrossRef]
- Kondo, S.; Kondo, H.; Nakane, S.; Kodaka, T.; Tokumura, A. 2-Arachidonoylglycerol, an endogenous cannabinoid receptor agonist: Identification as one of the major species of monoacylglycerols in various rat tissues, and evidence for its generation through Ca2+-dependent and -independent mechanisms. FEBS Lett. 1998, 429, 152–156. [Google Scholar] [CrossRef]
- Nomura, D.K.; Long, J.Z.; Niessen, S.; Hoover, H.S.; Ng, S.W. Monoacylglycerol lipase regulates a fatty acid network that promotes cancer pathogenesis. Cell 2010, 140, 49–61. [Google Scholar] [CrossRef] [PubMed]
- Myher, J.J.; Marai, L.; Kuksis, A. Identification of monoacyl-and monoalkylglycerols by gas–liquid chromatography-mass spectrometry using polar siloxane liquid phases. J. Lipid Res. 1974, 15, 586–592. [Google Scholar] [PubMed]
- Liu, Q.-T.; Kinderlerer, J.L. Preparative thin-layer chromatographic separation and subsequent gas chromatographic-mass spectrometric analysis of monoacylglycerols derived from butter oil by fungal degradation. J. Chromatogr. A 1999, 855, 617–624. [Google Scholar] [CrossRef]
- Destaillats, F.; Cruz-Hernandez, C.; Nagy, K.; Dionisi, F. Identification of monoacylglycerol regio-isomers by gas chromatography–mass spectrometry. J. Chromatogr. A 2010, 1217, 1543–1548. [Google Scholar] [CrossRef] [PubMed]
- Sugiura, T.; Kodaka, T.; Kondo, S.; Nakane, S.; Kondo, H.; Waku, K.; Ishima, Y.; Watanabe, K.; Yamamoto, I. Is the Cannabinoid CB1 Receptor a 2-Arachidonoylglycerol Receptor? Structural Requirements for Triggering a Ca2+ Transient in NG108–15 Cells. J. Biochem. 1997, 122, 890–895. [Google Scholar] [CrossRef] [PubMed]
- Ham, B.M.; Jacob, J.T.; Keese, M.M. Identification, quantification and comparison of major non-polar lipids in normal and dry eye tear lipidomes by electrospray tandem mass spectrometry. J. Mass Spectrom. 2004, 39, 1321–1336. [Google Scholar] [CrossRef] [PubMed]
- Chu, B.S.; Nagy, K. Enrichment and quantification of monoacylglycerols and free fatty acids by solid phase extraction and liquid chromatography–mass spectrometry. J. Chromatogr. B Anal. Technol. Biomed. Life Sci. 2013, 932, 50–58. [Google Scholar] [CrossRef] [PubMed]
- Han, X.; Gross, R.W. Shotgun lipidomics: Electrospray ionization mass spectrometric analysis and quantitation of cellular lipidomes directly from crude extracts of biological samples. Mass Spectrom. Rev. 2005, 24, 367–412. [Google Scholar] [CrossRef] [PubMed]
- Han, X.; Yang, K.; Gross, R.W. Multi-dimensional mass spectrometry-based shotgun lipidomics and novel strategies for lipidomic analyses. Mass Spectrom. Rev. 2011, 31, 134–178. [Google Scholar] [CrossRef] [PubMed]
- Simons, B.; Kauhanen, D.; Sylvänne, T.; Tarasov, K.; Duchoslav, E.; Ekroos, K. Shotgun Lipidomics by Sequential Precursor Ion Fragmentation on a Hybrid Quadrupole Time-of-Flight Mass Spectrometer. Metabolites 2012, 2, 195–213. [Google Scholar] [CrossRef] [PubMed]
- Holewinski, R.J.; Parker, S.J.; Matlock, A.D.; Venkatraman, V.; van Eyk, J.E. Methods for SWATH™: Data Independent Acquisition on TripleTOF Mass Spectrometers. Methods Mol. Biol. 2016, 1410, 265–279. [Google Scholar] [CrossRef] [PubMed]
- Bilbao, A.; Varesio, E.; Luban, J. Processing strategies and software solutions for data-independent acquisition in mass spectrometry. Proteomics 2015, 15, 964–980. [Google Scholar] [CrossRef] [PubMed]
- Rockwell, H.E.; Gao, F.; Chen, E.Y.; McDaniel, J.; Sarangarajan, R.; Narain, N.R.; Kiebish, M.A. Dynamic Assessment of Functional Lipidomic Analysis in Human Urine. Lipids 2016, 51, 875–886. [Google Scholar] [CrossRef] [PubMed]
- Andrews, G.L.; Simons, B.L.; Young, J.B.; Hawkridge, A.M.; Muddiman, D.C. Performance Characteristics of a New Hybrid Quadrupole Time-of-Flight Tandem Mass Spectrometer (TripleTOF 5600). Anal. Chem. 2011, 83, 5442–5446. [Google Scholar] [CrossRef] [PubMed]
- Liaw, L.; Prudovsky, I.; Koza, R.A.; Anunciado-Koza, R.V.; Siviski, M.E.; Lindner, V.; Friesel, R.E.; Rosen, C.J.; Baker, P.R.S.; Simons, B.; et al. Lipid Profiling of In Vitro Cell Models of Adipogenic Differentiation: Relationships with Mouse Adipose Tissues. J. Cell. Biochem. 2016, 117, 2182–2193. [Google Scholar] [CrossRef] [PubMed]
- Cech, N.B.; Enke, C.G. Practical implications of some recent studies in electrospray ionization fundamentals. Mass Spectrom. Rev. 2001, 20, 362–387. [Google Scholar] [CrossRef] [PubMed]
- Murphy, R.C.; Fiedler, J.; Hevko, J. Analysis of Nonvolatile Lipids by Mass Spectrometry. Chem. Rev. 2001, 101, 479–526. [Google Scholar] [CrossRef] [PubMed]
- Wang, M.; Wang, C.; Han, R.H.; Han, X. Novel advances in shotgun lipidomics for biology and medicine. Prog. Lipid Res. 2016, 61, 83–108. [Google Scholar] [CrossRef] [PubMed]
- Taguchi, R.; Houjou, T.; Nakanishi, H.; Yamazaki, T.; Ishida, M.; Imagawa, M.; Shimizu, T. Focused lipidomics by tandem mass spectrometry. J. Chromatogr. B Anal. Technol. Biomed. Life Sci. 2005, 823, 26–36. [Google Scholar] [CrossRef] [PubMed]
- Koivusalo, M.; Haimi, P.; Heikinheimo, L.; Kostiainen, R.; Somerharju, P. Quantitative determination of phospholipid compositions by ESI-MS: Effects of acyl chain length, unsaturation, and lipid concentration on instrument response. J. Lipid Res. 2001, 42, 663–672. [Google Scholar] [PubMed]
- Han, X.; Gross, R.W. Electrospray ionization mass spectroscopic analysis of human erythrocyte plasma membrane phospholipids. Proc. Natl. Acad. Sci. USA 1994, 91, 10635–10639. [Google Scholar] [CrossRef] [PubMed]
- Han, X.; Gross, R.W. Global analyses of cellular lipidomes directly from crude extracts of biological samples by ESI mass spectrometry a bridge to lipidomics. J. Lipid Res. 2003, 44, 1071–1079. [Google Scholar] [CrossRef] [PubMed]
- Schröder, D. Ion Mobility Spectrometry–Mass Spectrometry. Theory and Applications. Herausgegeben von Charles L. Wilkins und Sarah Trimpin. Angew. Chem. 2011, 123, 10674. [Google Scholar] [CrossRef]
- Saely, C.H.; Geiger, K.; Drexel, H. Brown versus White Adipose Tissue: A Mini-Review. Gerontology 2012, 58, 15–23. [Google Scholar] [CrossRef] [PubMed]
- Buyse, J.; Decuypere, E. Adipose Tissue and Lipid Metabolism. In Sturkie’s Avian Physiology, 6th ed.; Scanes, C.G., Ed.; Elsevier: Oxford, UK, 2015; pp. 443–453. [Google Scholar]
- Virtanen, K.A.; Lidell, M.E.; Orava, J. Functional brown adipose tissue in healthy adults. N. Engl. J. Med. 2009, 360, 1518–1525. [Google Scholar] [CrossRef] [PubMed]
- Cypess, A.M.; Lehman, S.; Williams, G.; Tal, I. Identification and importance of brown adipose tissue in adult humans. N. Engl. J. Med. 2009, 360, 1509–1517. [Google Scholar] [CrossRef] [PubMed]
- Cannon, B.; Nedergaard, J. Brown adipose tissue: function and physiological significance. Physiol. Rev. 2004, 84, 277–359. [Google Scholar] [CrossRef] [PubMed]
- Scow, R.O.; Blanchette-Mackie, E.J. Transport of fatty acids and monoacylglycerols in white and brown adipose tissues. Brain Res. Bull. 1991, 27, 487–491. [Google Scholar] [CrossRef]
- Kiebish, M.A.; Bell, R.; Yang, K.; Phan, T.; Zhao, Z.; Ames, W.; Seyfried, T.N.; Gross, R.W.; Chuang, J.H.; Han, X. Dynamic simulation of cardiolipin remodeling: greasing the wheels for an interpretative approach to lipidomics. J. Lipid Res. 2010, 51, 2153–2170. [Google Scholar] [CrossRef] [PubMed]
- Bligh, E.G.; Dyer, W.J. A rapid method of total lipid extraction and purification. Can. J. Biochem. Physiol. 1959, 37, 911–917. [Google Scholar] [CrossRef] [PubMed]


| Concentration | Peak Intensity | Mean (n = 3) | CV (%) | ||
|---|---|---|---|---|---|
| Sample A | Sample B | Sample C | |||
| 40 pmol/µL | 1,360,500 | 1,454,000 | 1,568,500 | 1,461,000 | 7.13 |
| 8 pmol/µL | 397,250 | 421,500 | 356,450 | 391,733 | 8.39 |
| 1.6 pmol/µL | 105,950 | 105,590 | 94,170 | 101,903 | 6.57 |
| 0.3 pmol/µL | 33,190 | 32,400 | 36,615 | 34,068 | 6.58 |
| 64 fmol/µL | 9840 | 9464.5 | 9841.5 | 9715 | 2.24 |
| 13 fmol/µL | 4562.5 | 4839 | 5110 | 4837 | 5.66 |
| 2.6 fmol/µL | 2323 | 2807 | 3020 | 2716 | 13.2 |
| MAG Species | [M + H]+ | Diagnostic Fragment [FA + H − H2O]+ |
|---|---|---|
| MAG 14:1 | 301.3 | 209.1906 |
| MAG 14:0 | 303.3 | 211.2062 |
| MAG 16:1 | 329.3 | 237.2219 |
| MAG 16:0 | 331.3 | 239.2376 |
| IS MAG 17:1 | 343.3 | 251.2369 |
| MAG 18:3 | 353.3 | 261.2219 |
| MAG 18:2 | 355.3 | 263.2376 |
| MAG 18:1 | 357.3 | 265.2532 |
| MAG 18:0 | 359.3 | 267.2689 |
| MAG 20:4 | 379.3 | 287.2376 |
| MAG 20:3 | 381.3 | 289.2532 |
| MAG 20:2 | 383.3 | 291.2689 |
| MAG 20:1 | 385.3 | 293.2845 |
| MAG 20:0 | 387.4 | 295.3002 |
| MAG 22:6 | 403.3 | 311.2376 |
| MAG 22:5 | 405.3 | 313.2532 |
| MAG 22:4 | 407.3 | 315.2689 |
| MAG 22:3 | 409.3 | 317.2845 |
| MAG 22:2 | 411.4 | 319.3002 |
| MAG 22:1 | 413.4 | 321.3158 |
| MAG 22:0 | 415.4 | 323.3315 |
© 2016 by the authors; licensee MDPI, Basel, Switzerland. This article is an open access article distributed under the terms and conditions of the Creative Commons Attribution (CC-BY) license (http://creativecommons.org/licenses/by/4.0/).
Share and Cite
Gao, F.; McDaniel, J.; Chen, E.Y.; Rockwell, H.; Lynes, M.D.; Tseng, Y.-H.; Sarangarajan, R.; Narain, N.R.; Kiebish, M.A. Monoacylglycerol Analysis Using MS/MSALL Quadruple Time of Flight Mass Spectrometry. Metabolites 2016, 6, 25. https://doi.org/10.3390/metabo6030025
Gao F, McDaniel J, Chen EY, Rockwell H, Lynes MD, Tseng Y-H, Sarangarajan R, Narain NR, Kiebish MA. Monoacylglycerol Analysis Using MS/MSALL Quadruple Time of Flight Mass Spectrometry. Metabolites. 2016; 6(3):25. https://doi.org/10.3390/metabo6030025
Chicago/Turabian StyleGao, Fei, Justice McDaniel, Emily Y. Chen, Hannah Rockwell, Matthew D. Lynes, Yu-Hua Tseng, Rangaprasad Sarangarajan, Niven R. Narain, and Michael A. Kiebish. 2016. "Monoacylglycerol Analysis Using MS/MSALL Quadruple Time of Flight Mass Spectrometry" Metabolites 6, no. 3: 25. https://doi.org/10.3390/metabo6030025