
Evaluation of Cancer Metabolomics Using ex vivo High Resolution Magic Angle Spinning (HRMAS) Magnetic Resonance Spectroscopy (MRS)

Abstract
:1. Introduction
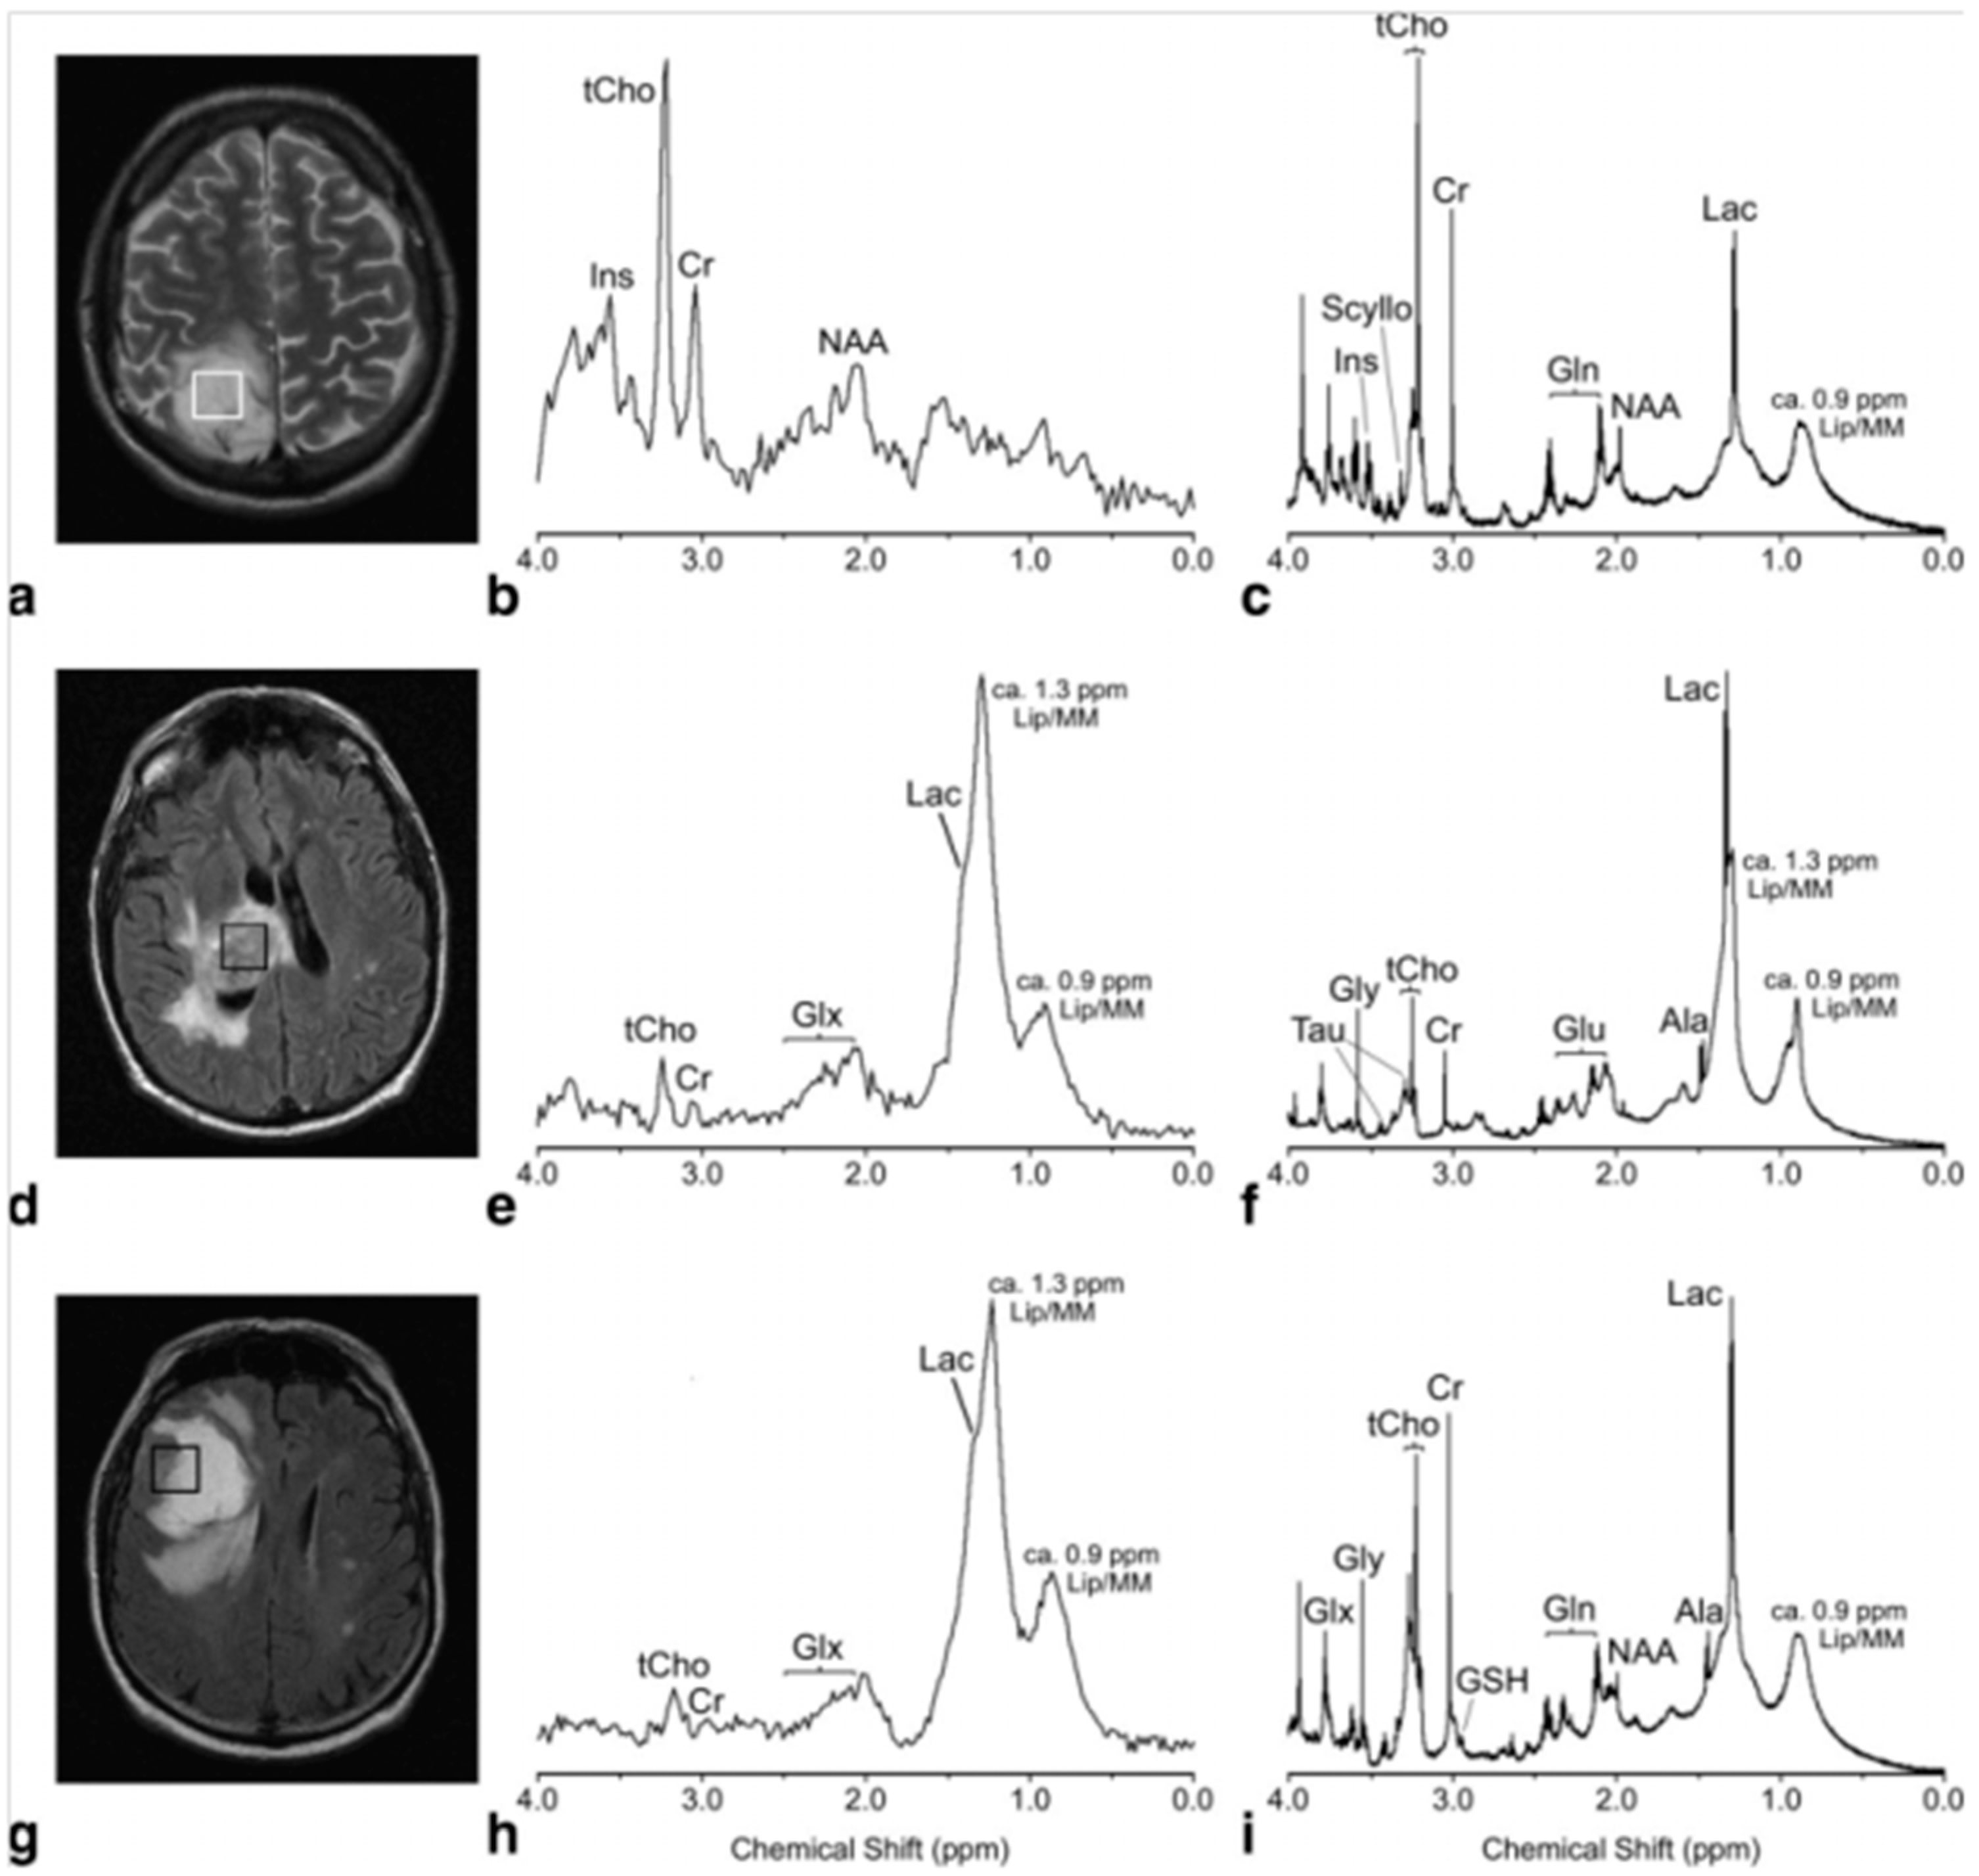
2. Brain Cancer
3. Breast Cancer
4. Prostate Cancer
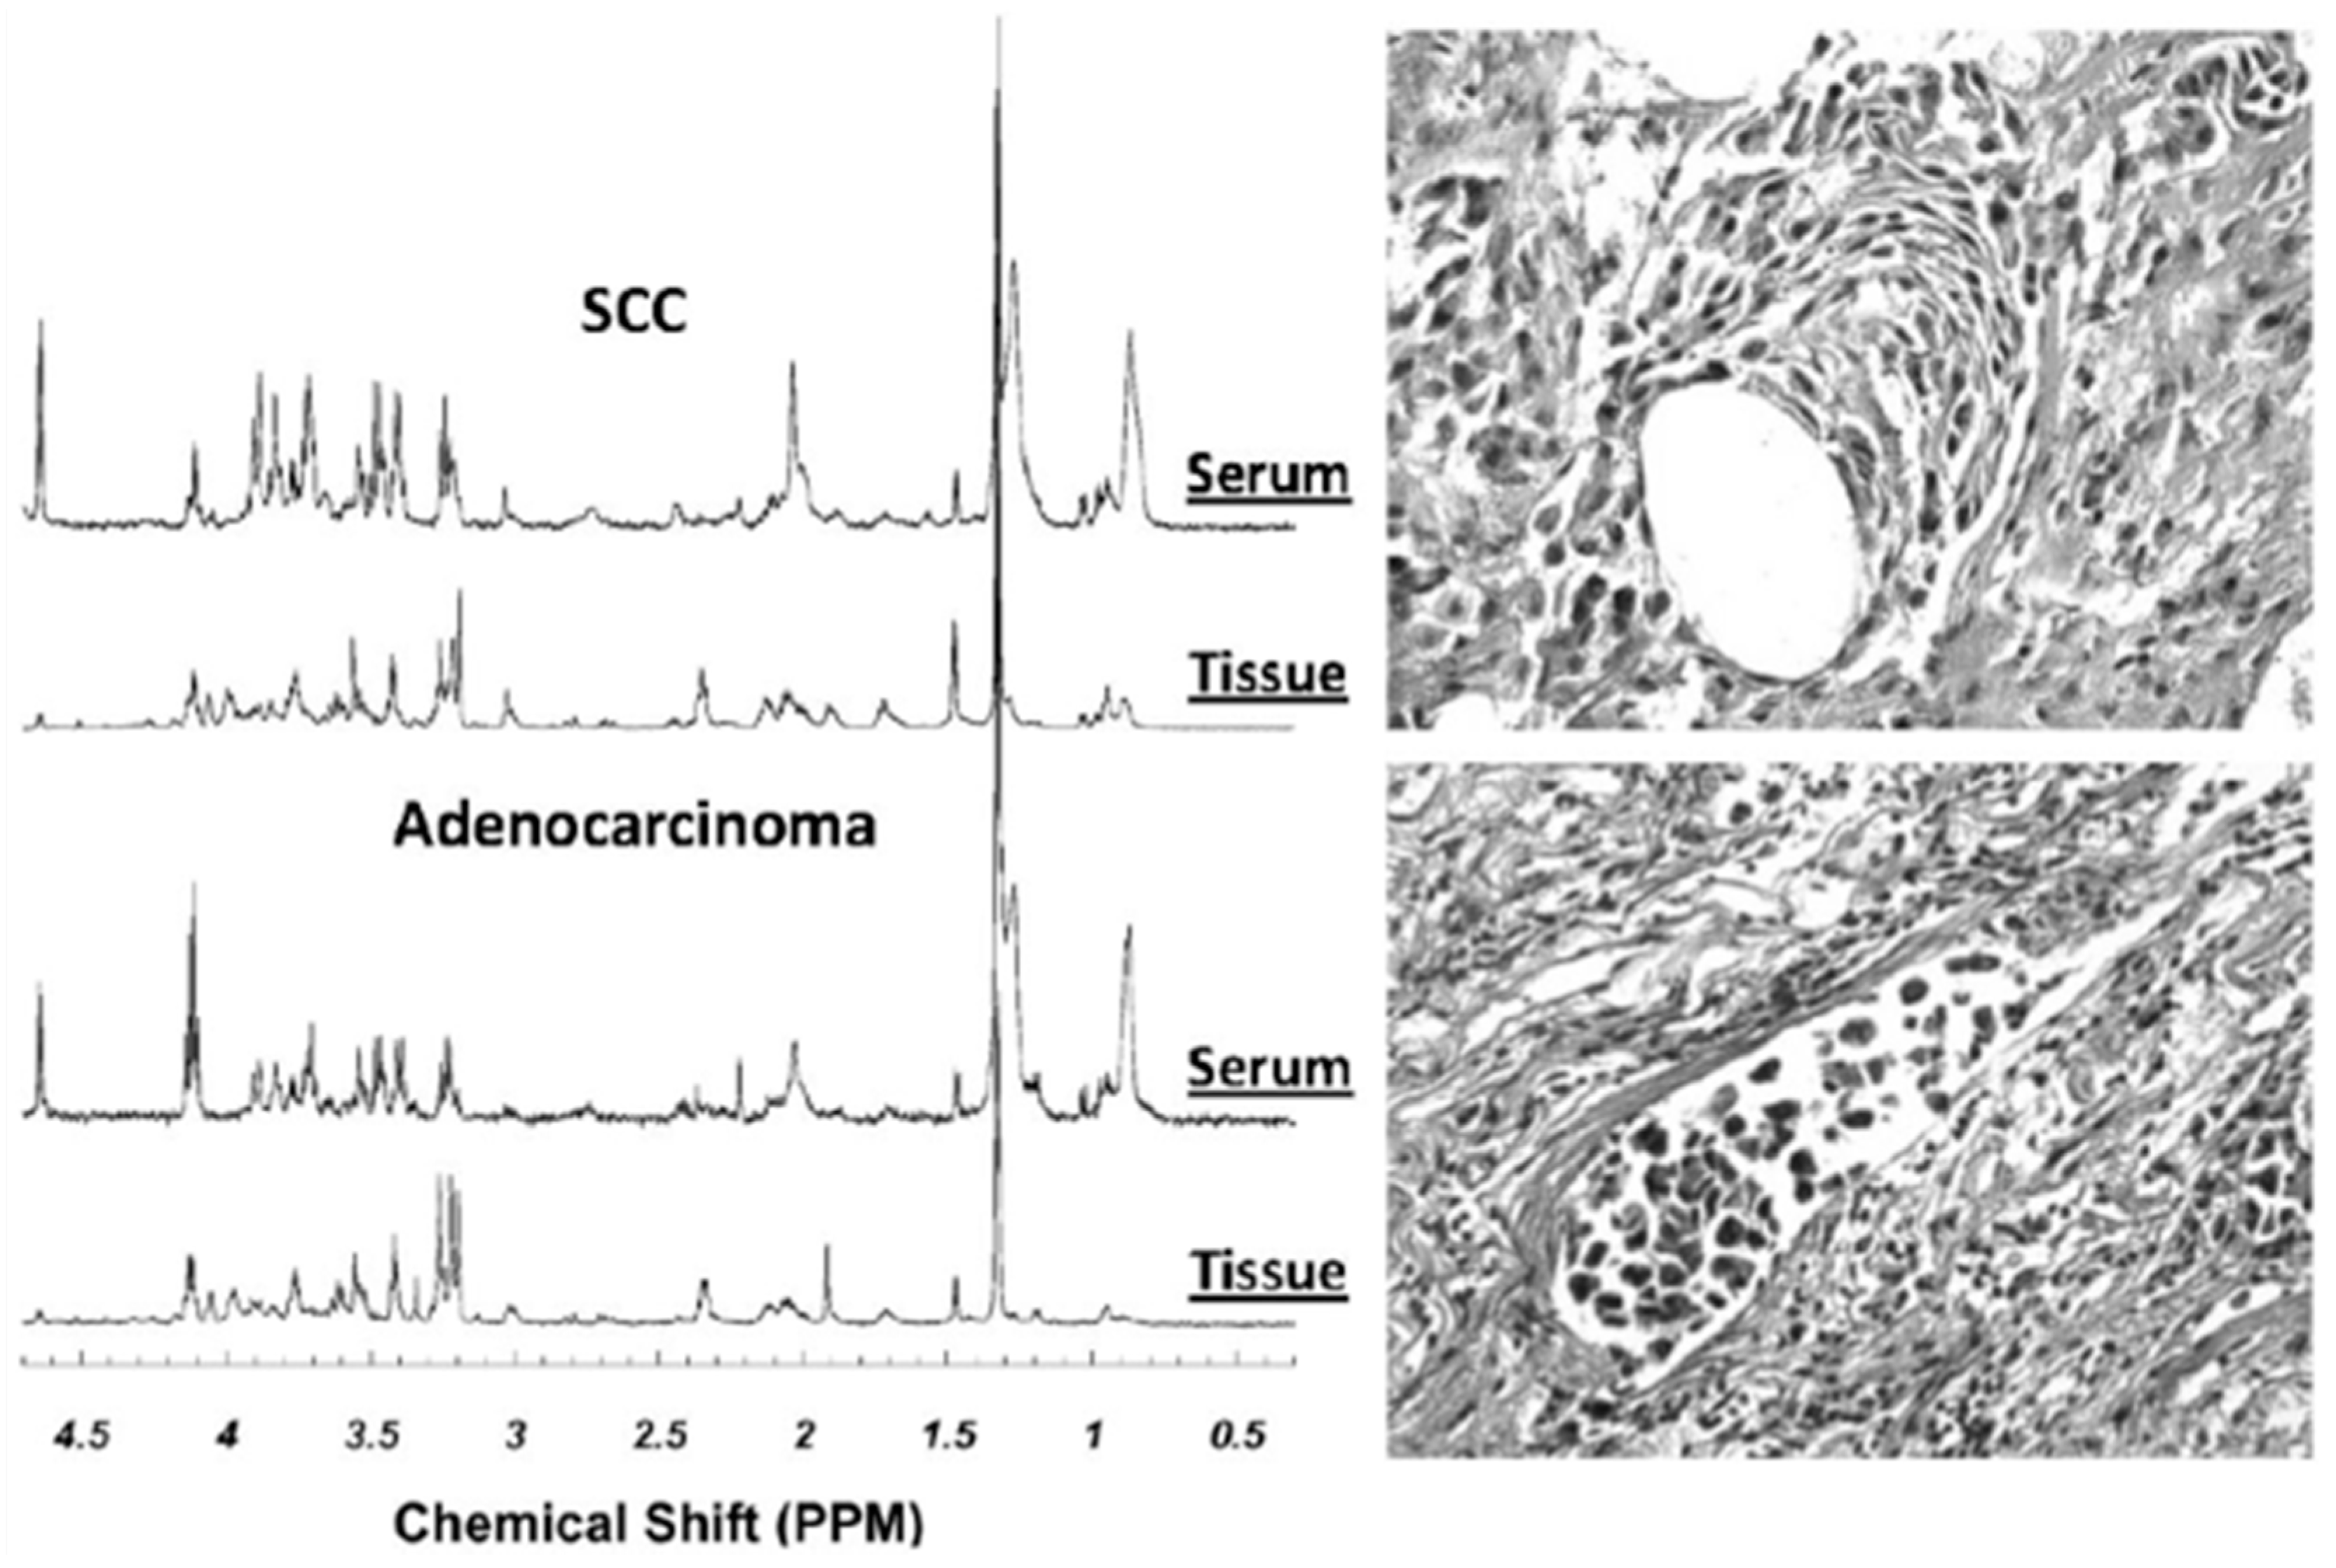
5. Lung Cancer
6. Cancers of the Gastrointestinal Tract
7. Cancers Relating to the Neuroendocrine Systems
8. Emerging Research Directions
9. Conclusions
Acknowledgments
Author Contributions
Conflicts of Interest
Abbreviations
| 2HG | 2-hydroxyglutarate |
| 5-ALA | 5-aminolevulinic acid |
| Ala | alanine |
| ANOVA | analysis of variance |
| Arg | arginine |
| Asn | asparagine |
| Asp | aspartate/aspartic acid |
| ATP | adenosine triphosphate |
| Cho | choline |
| CPMG | Carr-Purcell-Meiboom-Gill |
| Cr | creatine |
| ER | estrogen receptor |
| EOC | epithelial ovarian carcinoma |
| ERETIC | electronic reference to in vivo concentrations |
| FMW | focused microwave |
| FOBT | fecal occult blood testing |
| GABA | gamma-aminobutyric acid |
| GBM | glioblastoma multiforme |
| Gln | glutamine |
| Glu | glutamate/glutamic acid |
| Gly | glycine |
| Glx | glutamate and glutamine |
| GPC | glycerophosphocholine |
| HDAC | histone deacetylases |
| HER-2/neu | human epidermal growth factor receptor-2/neu |
| HPC | hemangiopericytomas |
| HRMAS | high resolution magic angle spinning |
| Ile | isoleucine |
| Lac | lactate |
| LDA | linear discriminant analysis |
| Leu | leucine |
| Lys | lysine |
| Man | mannitol |
| MCI | m-Ino to tCho index |
| MEN1 | multiple endocrine neoplasia syndrome, type 1 |
| Met | methionine |
| MM | macromolecule |
| MRI | magnetic resonance imaging |
| MRS | magnetic resonance spectroscopy |
| m-Ino | myo-Inositol |
| NAA | N-acetyl-aspartate |
| NMR | nuclear magnetic resonance |
| OPLS-DA | orthogonal partial least square discriminant analysis |
| PC | principal component |
| PCA | principal component analysis |
| PChol | phosphocholine |
| PCr | phosphocreatine |
| PCR | polymerase chain reaction |
| PE | phosphoethanolamine |
| Phe | phenylalanine |
| PI3K | phosphatidylinositol 3-kinase |
| PLS-DA | partial least squares discriminant analysis |
| Ppm | parts per million |
| PR | Progesterone receptor |
| PRESS | point resolved spectroscopy |
| Pro | proline |
| PSA | prostate specific antigen |
| RIN | RNA integrity number |
| s-Ino | scyllo-Inositol |
| SDHx | succinate dehydrogenase gene |
| Ser | serine |
| T | tesla |
| Tau | taurine |
| TIC | tumor-initiating cells |
| TNBC | triple negative breast cancer |
| TPBC | triple positive breast cancer |
| Tyr | tyrosine |
| Val | valine |
| WHO | World Health Organization |
References
- Ferlay, J.; Soerjomataram, I.; Dikshit, R.; Eser, S.; Mathers, C.; Rebelo, M.; Parkin, D.M.; Forman, D.; Bray, F. Cancer incidence and mortality worldwide: Sources, methods and major patterns in globocan 2012. Int. J. Cancer 2015, 136, E359–E386. [Google Scholar] [CrossRef] [PubMed]
- Cheng, L.L.; Ma, M.J.; Becerra, L.; Ptak, T.; Tracey, I.; Lackner, A.; Gonzalez, R.G. Quantitative neuropathology by high resolution magic angle spinning proton magnetic resonance spectroscopy. Proc. Natl. Acad. Sci. USA 1997, 94, 6408–6413. [Google Scholar] [CrossRef] [PubMed]
- Cheng, L.L.; Lean, C.L.; Bogdanova, A.; Wright, S.C., Jr.; Ackerman, J.L.; Brady, T.J.; Garrido, L. Enhanced resolution of proton nmr spectra of malignant lymph nodes using magic-angle spinning. Magn. Reson. Med. 1996, 36, 653–658. [Google Scholar] [CrossRef] [PubMed]
- Millis, K.K.; Maas, W.E.; Cory, D.G.; Singer, S. Gradient, high-resolution, magic-angle spinning nuclear magnetic resonance spectroscopy of human adipocyte tissue. Magn. Reson. Med. 1997, 38, 399–403. [Google Scholar] [CrossRef] [PubMed]
- Moka, D.; Vorreuther, R.; Schicha, H.; Spraul, M.; Humpfer, E.; Lipinski, M.; Foxall, P.; Nicholson, J.; Lindon, J. Magic angle spinning proton nuclear magnetic resonance spectroscopic analysis of intact kidney tissue samples. Anal. Commun. 1997, 34, 107–109. [Google Scholar] [CrossRef]
- Cheng, L.L.; Chang, I.W.; Smith, B.L.; Gonzalez, R.G. Evaluating human breast ductal carcinomas with high-resolution magic-angle spinning proton magnetic resonance spectroscopy. J. Magn. Reson. 1998, 135, 194–202. [Google Scholar] [CrossRef] [PubMed]
- Weybright, P.; Millis, K.; Campbell, N.; Cory, D.G.; Singer, S. Gradient, high-resolution, magic angle spinning 1h nuclear magnetic resonance spectroscopy of intact cells. Magn. Reson. Med. 1998, 39, 337–345. [Google Scholar] [CrossRef] [PubMed]
- Tomlins, A.; Foxall, P.; Lindon, J.; Lynch, M.; Spraul, M.; Everett, J.; Nicholson, J. High resolution magic angle spinning 1h nuclear magnetic resonance analysis of intact prostatic hyperplastic and tumor tissue. Anal. Commun. 1998, 35, 113–115. [Google Scholar] [CrossRef]
- Cheng, L.L.; Chang, I.W.; Louis, D.N.; Gonzalez, R.G. Correlation of high-resolution magic angle spinning proton magnetic resonance spectroscopy with histopathology of intact human brain tumor specimens. Cancer Res. 1998, 58, 1825–1832. [Google Scholar] [PubMed]
- DeFeo, E.M.; Cheng, L.L. Characterizing human cancer metabolomics with ex vivo 1h hrmas mrs. Technol. Cancer Res. Treat. 2010, 9, 381–391. [Google Scholar] [CrossRef] [PubMed]
- Bathen, T.F.; Sitter, B.; Sjobakk, T.E.; Tessem, M.B.; Gribbestad, I.S. Magnetic resonance metabolomics of intact tissue: A biotechnological tool in cancer diagnostics and treatment evaluation. Cancer Res. 2010, 70, 6692–6696. [Google Scholar] [CrossRef] [PubMed]
- Moestue, S.; Sitter, B.; Bathen, T.F.; Tessem, M.B.; Gribbestad, I.S. Hr mas mr spectroscopy in metabolic characterization of cancer. Curr. Top. Med. Chem. 2011, 11, 2–26. [Google Scholar] [CrossRef] [PubMed]
- Opstad, K.S.; Wright, A.J.; Bell, B.A.; Griffiths, J.R.; Howe, F.A. Correlations between in vivo (1)h mrs and ex vivo (1)h hrmas metabolite measurements in adult human gliomas. J. Magn. Reson. Imaging 2010, 31, 289–297. [Google Scholar] [CrossRef] [PubMed]
- Vettukattil, R.; Gulati, M.; Sjobakk, T.E.; Jakola, A.S.; Kvernmo, N.A.; Torp, S.H.; Bathen, T.F.; Gulati, S.; Gribbestad, I.S. Differentiating diffuse world health organization grade ii and iv astrocytomas with ex vivo magnetic resonance spectroscopy. Neurosurgery 2013, 72, 186–195. [Google Scholar] [CrossRef] [PubMed]
- Hekmatyar, S.K.; Wilson, M.; Jerome, N.; Salek, R.M.; Griffin, J.L.; Peet, A.; Kauppinen, R.A. (1)h nuclear magnetic resonance spectroscopy characterisation of metabolic phenotypes in the medulloblastoma of the smo transgenic mice. Br. J. Cancer 2010, 103, 1297–1304. [Google Scholar] [CrossRef] [PubMed]
- Elkhaled, A.; Jalbert, L.; Constantin, A.; Yoshihara, H.A.; Phillips, J.J.; Molinaro, A.M.; Chang, S.M.; Nelson, S.J. Characterization of metabolites in infiltrating gliomas using ex vivo (1)h high-resolution magic angle spinning spectroscopy. NMR Biomed. 2014, 27, 578–593. [Google Scholar] [CrossRef] [PubMed]
- Righi, V.; Tugnoli, V.; Mucci, A.; Bacci, A.; Bonora, S.; Schenetti, L. Mrs study of meningeal hemangiopericytoma and edema: A comparison with meningothelial meningioma. Oncol. Rep. 2012, 28, 1461–1467. [Google Scholar] [CrossRef] [PubMed] [Green Version]
- Pfisterer, W.K.; Nieman, R.A.; Scheck, A.C.; Coons, S.W.; Spetzler, R.F.; Preul, M.C. Using ex vivo proton magnetic resonance spectroscopy to reveal associations between biochemical and biological features of meningiomas. Neurosurg. Focus 2010, 28. [Google Scholar] [CrossRef] [PubMed]
- Wright, A.J.; Fellows, G.A.; Griffiths, J.R.; Wilson, M.; Bell, B.A.; Howe, F.A. Ex-vivo hrmas of adult brain tumours: Metabolite quantification and assignment of tumour biomarkers. Mol. Cancer 2010, 9. [Google Scholar] [CrossRef] [PubMed]
- Chen, W.; Lou, H.; Zhang, H.; Nie, X.; Lan, W.; Yang, Y.; Xiang, Y.; Qi, J.; Lei, H.; Tang, H.; et al. Grade classification of neuroepithelial tumors using high-resolution magic-angle spinning proton nuclear magnetic resonance spectroscopy and pattern recognition. Sci. China Life Sci. 2011, 54, 606–616. [Google Scholar] [CrossRef] [PubMed]
- Cuellar-Baena, S.; Morales, J.M.; Martinetto, H.; Calvar, J.; Sevlever, G.; Castellano, G.; Cerda-Nicolas, M.; Celda, B.; Monleon, D. Comparative metabolic profiling of paediatric ependymoma, medulloblastoma and pilocytic astrocytoma. Int. J. Mol. Med. 2010, 26, 941–948. [Google Scholar] [PubMed]
- Wilson, M.; Gill, S.K.; MacPherson, L.; English, M.; Arvanitis, T.N.; Peet, A.C. Noninvasive detection of glutamate predicts survival in pediatric medulloblastoma. Clin. Cancer Res. 2014, 20, 4532–4539. [Google Scholar] [CrossRef] [PubMed]
- Croitor Sava, A.; Martinez-Bisbal, M.C.; Van Huffel, S.; Cerda, J.M.; Sima, D.M.; Celda, B. Ex vivo high resolution magic angle spinning metabolic profiles describe intratumoral histopathological tissue properties in adult human gliomas. Magn. Reson. Med. 2011, 65, 320–328. [Google Scholar] [CrossRef] [PubMed]
- Srinivasan, R.; Phillips, J.J.; Vandenberg, S.R.; Polley, M.Y.; Bourne, G.; Au, A.; Pirzkall, A.; Cha, S.; Chang, S.M.; Nelson, S.J. Ex vivo mr spectroscopic measure differentiates tumor from treatment effects in gbm. Neuro-oncology 2010, 12, 1152–1161. [Google Scholar] [CrossRef] [PubMed]
- Piccirillo, S.G.; Dietz, S.; Madhu, B.; Griffiths, J.; Price, S.J.; Collins, V.P.; Watts, C. Fluorescence-guided surgical sampling of glioblastoma identifies phenotypically distinct tumour-initiating cell populations in the tumour mass and margin. Br. J. Cancer 2012, 107, 462–468. [Google Scholar] [CrossRef] [PubMed]
- Garcia-Alvarez, I.; Garrido, L.; Romero-Ramirez, L.; Nieto-Sampedro, M.; Fernandez-Mayoralas, A.; Campos-Olivas, R. The effect of antitumor glycosides on glioma cells and tissues as studied by proton hr-mas nmr spectroscopy. PLoS ONE 2013, 8, e78391. [Google Scholar]
- Dali-Youcef, N.; Froelich, S.; Moussallieh, F.M.; Chibbaro, S.; Noel, G.; Namer, I.J.; Heikkinen, S.; Auwerx, J. Gene expression mapping of histone deacetylases and co-factors, and correlation with survival time and 1h-hrmas metabolomic profile in human gliomas. Sci. Rep. 2015, 5. [Google Scholar] [CrossRef] [PubMed]
- Valverde-Saubi, D.; Candiota, A.P.; Molins, M.A.; Feliz, M.; Godino, O.; Davila, M.; Acebes, J.J.; Arus, C. Short-term temperature effect on the hrmas spectra of human brain tumor biopsies and their pattern recognition analysis. Magma 2010, 23, 203–215. [Google Scholar] [CrossRef] [PubMed]
- Esteve, V.; Celda, B.; Martinez-Bisbal, M.C. Use of 1h and 31p hrmas to evaluate the relationship between quantitative alterations in metabolite concentrations and tissue features in human brain tumour biopsies. Anal. Bioanal. Chem. 2012, 403, 2611–2625. [Google Scholar] [CrossRef] [PubMed]
- Constantin, A.; Elkhaled, A.; Jalbert, L.; Srinivasan, R.; Cha, S.; Chang, S.M.; Bajcsy, R.; Nelson, S.J. Identifying malignant transformations in recurrent low grade gliomas using high resolution magic angle spinning spectroscopy. Artif. Intell. Med. 2012, 55, 61–70. [Google Scholar] [CrossRef] [PubMed]
- Li, M.; Song, Y.; Cho, N.; Chang, J.M.; Koo, H.R.; Yi, A.; Kim, H.; Park, S.; Moon, W.K. An hr-mas mr metabolomics study on breast tissues obtained with core needle biopsy. PLoS ONE 2011, 6, e25563. [Google Scholar] [CrossRef] [PubMed]
- Cao, M.D.; Lamichhane, S.; Lundgren, S.; Bofin, A.; Fjosne, H.; Giskeodegard, G.F.; Bathen, T.F. Metabolic characterization of triple negative breast cancer. BMC Cancer 2014, 14, 941. [Google Scholar] [CrossRef] [PubMed]
- Sitter, B.; Bathen, T.F.; Singstad, T.E.; Fjosne, H.E.; Lundgren, S.; Halgunset, J.; Gribbestad, I.S. Quantification of metabolites in breast cancer patients with different clinical prognosis using hr mas mr spectroscopy. NMR Biomed. 2010, 23, 424–431. [Google Scholar] [CrossRef] [PubMed]
- Moestue, S.A.; Dam, C.G.; Gorad, S.S.; Kristian, A.; Bofin, A.; Maelandsmo, G.M.; Engebraten, O.; Gribbestad, I.S.; Bjorkoy, G. Metabolic biomarkers for response to pi3k inhibition in basal-like breast cancer. Breast Cancer Res. 2013, 15. [Google Scholar] [CrossRef] [PubMed] [Green Version]
- Esmaeili, M.; Bathen, T.F.; Engebraten, O.; Maelandsmo, G.M.; Gribbestad, I.S.; Moestue, S.A. Quantitative (31)p hr-mas mr spectroscopy for detection of response to pi3k/mtor inhibition in breast cancer xenografts. Magn. Reson. Med. 2014, 71, 1973–1981. [Google Scholar] [CrossRef] [PubMed]
- van Asten, J.J.; Vettukattil, R.; Buckle, T.; Rottenberg, S.; van Leeuwen, F.; Bathen, T.F.; Heerschap, A. Increased levels of choline metabolites are an early marker of docetaxel treatment response in brca1-mutated mouse mammary tumors: An assessment by ex vivo proton magnetic resonance spectroscopy. J. Transl. Med. 2015, 13. [Google Scholar] [CrossRef] [PubMed] [Green Version]
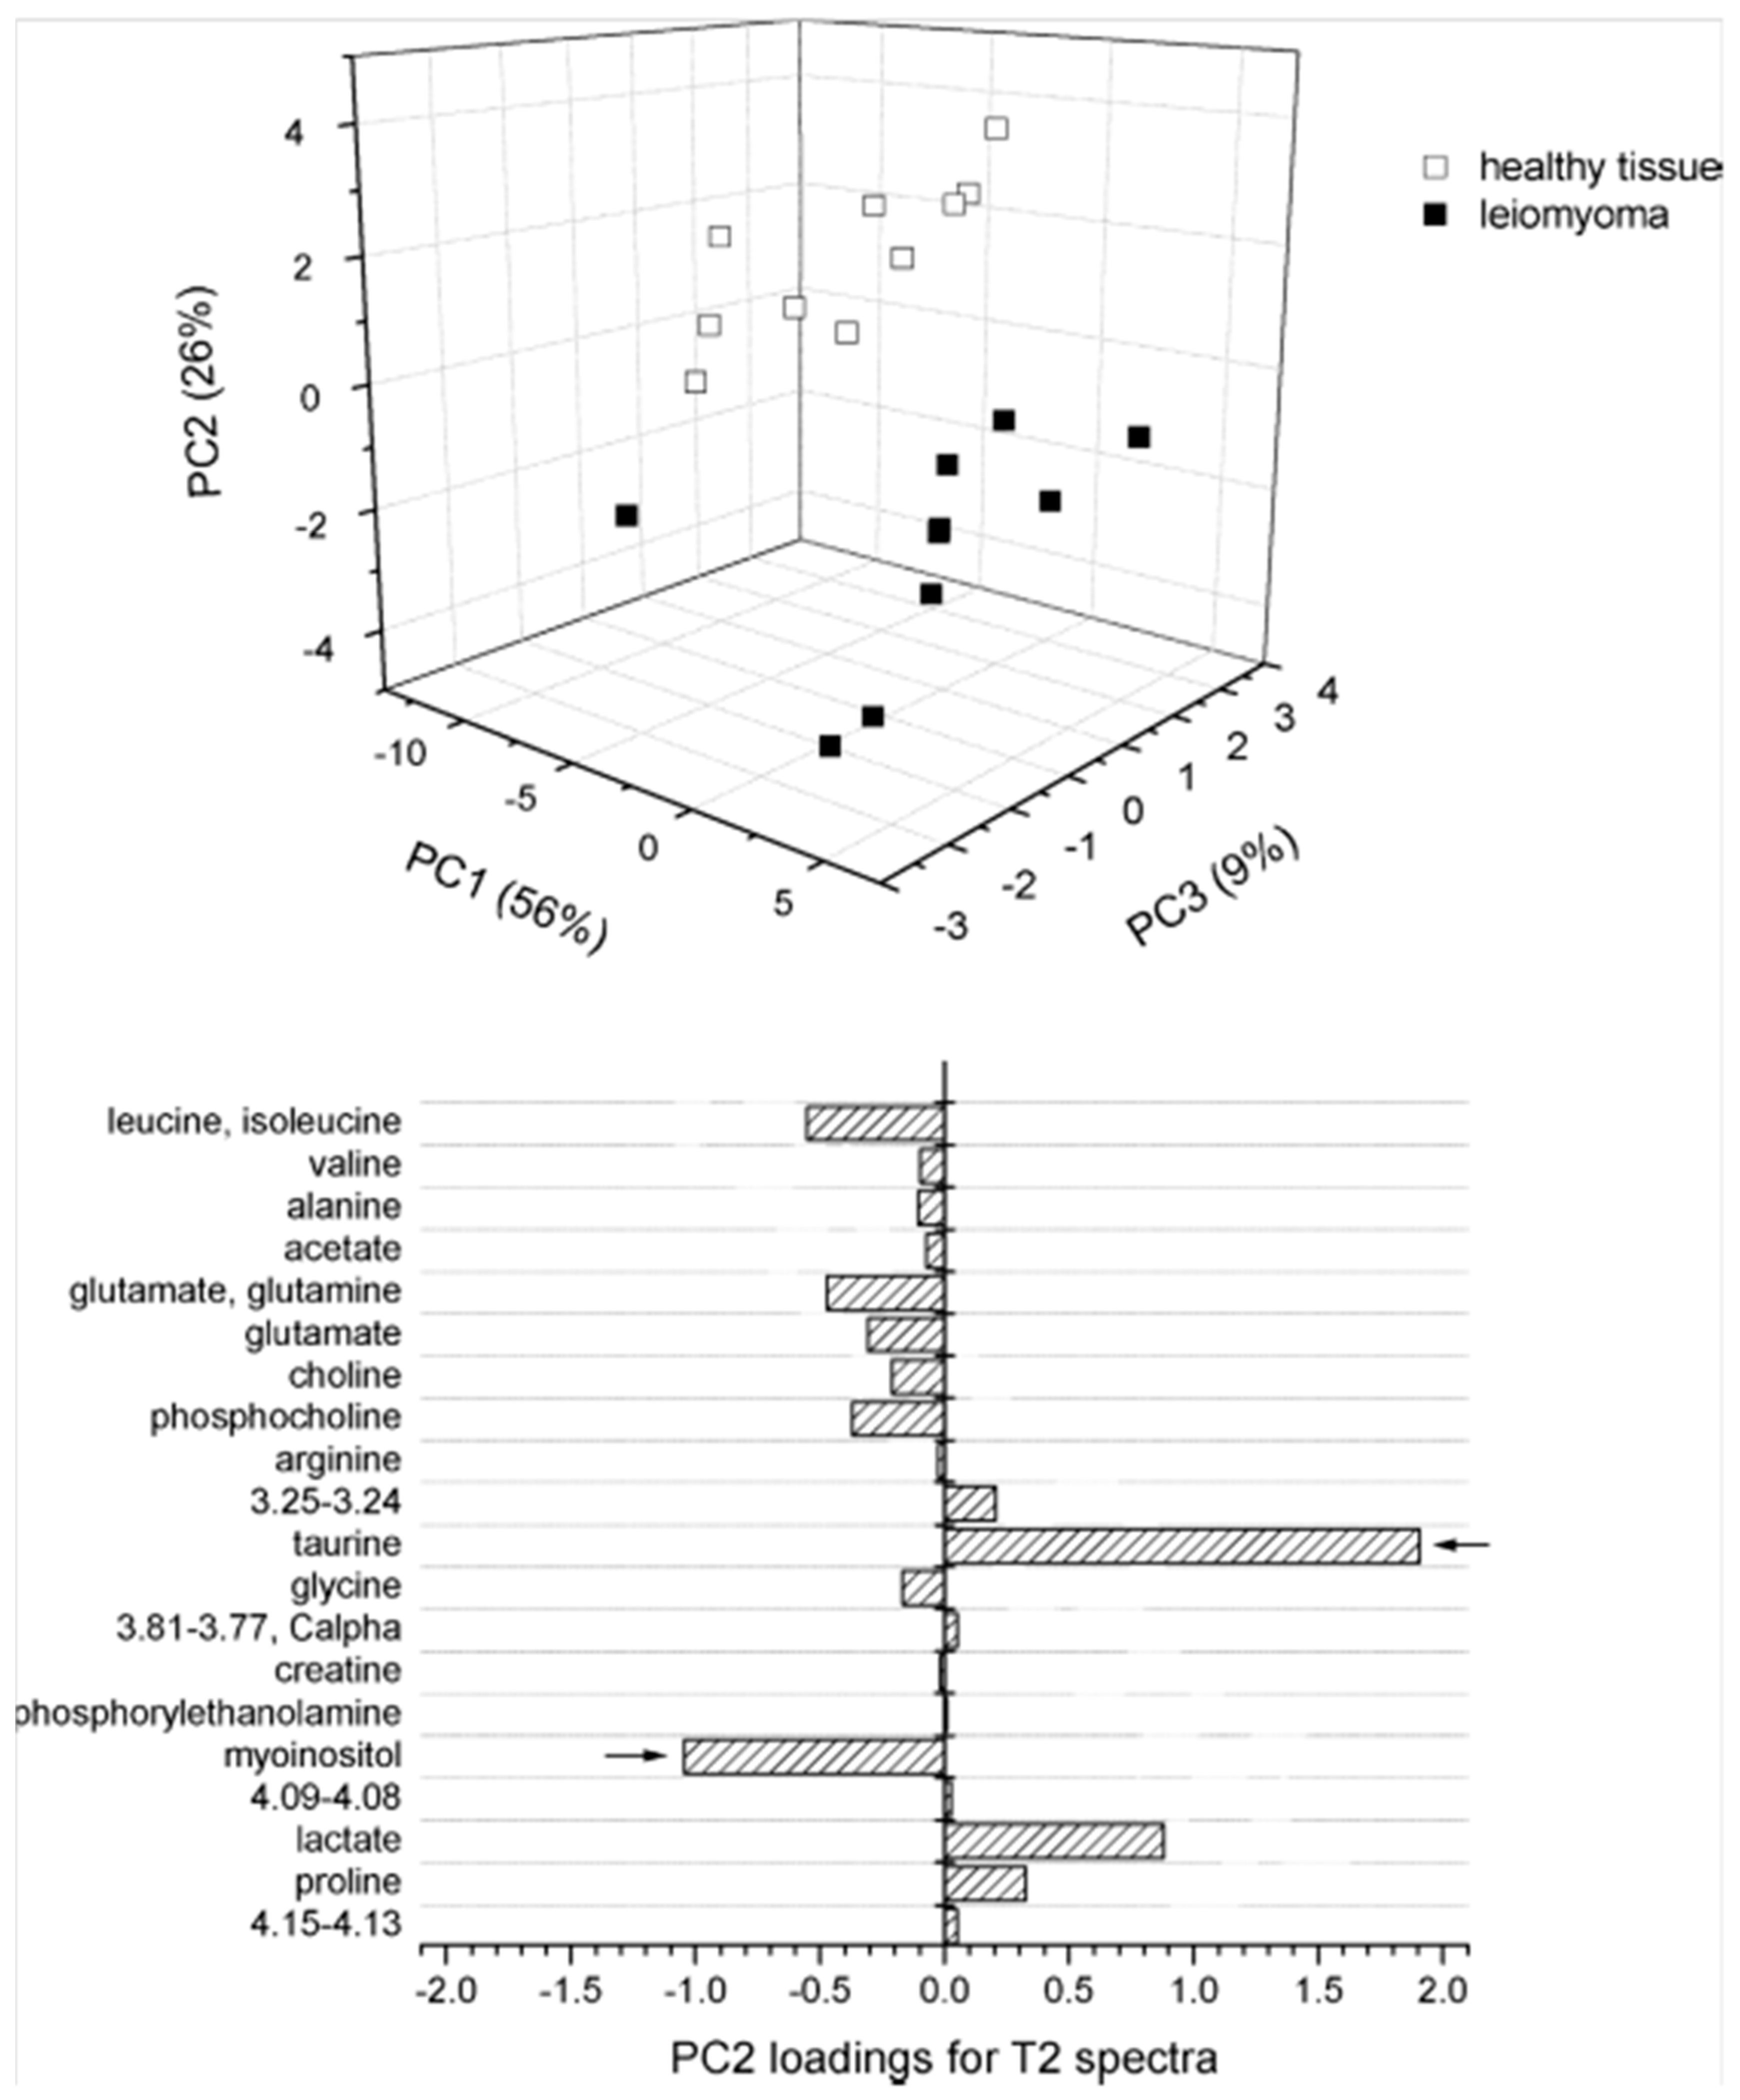
- Mazzei, P.; Piccolo, A.; Nugnes, L.; Mascolo, M.; De Rosa, G.; Staibano, S. Metabolic profile of intact tissue from uterine leiomyomas using high-resolution magic-angle-spinning (1)h nmr spectroscopy. NMR Biomed. 2010, 23, 1137–1145. [Google Scholar] [CrossRef] [PubMed]
- Canese, R.; Pisanu, M.E.; Mezzanzanica, D.; Ricci, A.; Paris, L.; Bagnoli, M.; Valeri, B.; Spada, M.; Venditti, M.; Cesolini, A.; et al. Characterisation of in vivo ovarian cancer models by quantitative 1h magnetic resonance spectroscopy and diffusion-weighted imaging. NMR Biomed. 2012, 25, 632–642. [Google Scholar] [CrossRef] [PubMed]
- Stenman, K.; Stattin, P.; Stenlund, H.; Riklund, K.; Grobner, G.; Bergh, A. H hrmas nmr derived bio-markers related to tumor grade, tumor cell fraction, and cell proliferation in prostate tissue samples. Biomark. Insights 2011, 6, 39–47. [Google Scholar] [CrossRef] [PubMed]
- Maxeiner, A.; Adkins, C.B.; Zhang, Y.; Taupitz, M.; Halpern, E.F.; McDougal, W.S.; Wu, C.L.; Cheng, L.L. Retrospective analysis of prostate cancer recurrence potential with tissue metabolomic profiles. Prostate 2010, 70, 710–717. [Google Scholar] [CrossRef] [PubMed]
- Bayet-Robert, M.; Loiseau, D.; Rio, P.; Demidem, A.; Barthomeuf, C.; Stepien, G.; Morvan, D. Quantitative two-dimensional hrmas 1h-nmr spectroscopy-based metabolite profiling of human cancer cell lines and response to chemotherapy. Magn. Reson. Med. 2010, 63, 1172–1183. [Google Scholar] [CrossRef] [PubMed]
- Chen, W.; Zu, Y.; Huang, Q.; Chen, F.; Wang, G.; Lan, W.; Bai, C.; Lu, S.; Yue, Y.; Deng, F. Study on metabonomic characteristics of human lung cancer using high resolution magic-angle spinning 1h nmr spectroscopy and multivariate data analysis. Magn. Reson. Med. 2011, 66, 1531–1540. [Google Scholar] [CrossRef] [PubMed]
- Duarte, I.F.; Rocha, C.M.; Barros, A.S.; Gil, A.M.; Goodfellow, B.J.; Carreira, I.M.; Bernardo, J.; Gomes, A.; Sousa, V.; Carvalho, L. Can nuclear magnetic resonance (nmr) spectroscopy reveal different metabolic signatures for lung tumours? Virchows Arch. 2010, 457, 715–725. [Google Scholar] [CrossRef] [PubMed]
- Rocha, C.M.; Barros, A.S.; Gil, A.M.; Goodfellow, B.J.; Humpfer, E.; Spraul, M.; Carreira, I.M.; Melo, J.B.; Bernardo, J.; Gomes, A.; et al. Metabolic profiling of human lung cancer tissue by 1h high resolution magic angle spinning (hrmas) nmr spectroscopy. J. Proteome Res. 2010, 9, 319–332. [Google Scholar] [CrossRef] [PubMed]
- Jordan, K.W.; Adkins, C.B.; Su, L.; Halpern, E.F.; Mark, E.J.; Christiani, D.C.; Cheng, L.L. Comparison of squamous cell carcinoma and adenocarcinoma of the lung by metabolomic analysis of tissue-serum pairs. Lung Cancer 2010, 68, 44–50. [Google Scholar] [CrossRef] [PubMed]
- Jimenez, B.; Mirnezami, R.; Kinross, J.; Cloarec, O.; Keun, H.C.; Holmes, E.; Goldin, R.D.; Ziprin, P.; Darzi, A.; Nicholson, J.K. 1h hr-mas nmr spectroscopy of tumor-induced local metabolic “field-effects” enables colorectal cancer staging and prognostication. J. Proteome Res. 2013, 12, 959–968. [Google Scholar] [CrossRef] [PubMed]
- Mirnezami, R.; Jimenez, B.; Li, J.V.; Kinross, J.M.; Veselkov, K.; Goldin, R.D.; Holmes, E.; Nicholson, J.K.; Darzi, A. Rapid diagnosis and staging of colorectal cancer via high-resolution magic angle spinning nuclear magnetic resonance (hr-mas nmr) spectroscopy of intact tissue biopsies. Ann. Surg. 2014, 259, 1138–1149. [Google Scholar] [CrossRef] [PubMed]
- Yakoub, D.; Keun, H.C.; Goldin, R.; Hanna, G.B. Metabolic profiling detects field effects in nondysplastic tissue from esophageal cancer patients. Cancer Res. 2010, 70, 9129–9136. [Google Scholar] [CrossRef] [PubMed]
- Yang, Y.; Wang, L.; Wang, S.; Liang, S.; Chen, A.; Tang, H.; Chen, L.; Deng, F. Study of metabonomic profiles of human esophageal carcinoma by use of high-resolution magic-angle spinning 1h nmr spectroscopy and multivariate data analysis. Anal. Bioanal. Chem. 2013, 405, 3381–3389. [Google Scholar] [CrossRef] [PubMed]
- He, X.H.; Li, W.T.; Gu, Y.J.; Yang, B.F.; Deng, H.W.; Yu, Y.H.; Peng, W.J. Metabonomic studies of pancreatic cancer response to radiotherapy in a mouse xenograft model using magnetic resonance spectroscopy and principal components analysis. World J. Gastroenterol. 2013, 19, 4200–4208. [Google Scholar] [CrossRef] [PubMed]
- Yang, J.; Song, K.D.; Kim, J.H.; Im, G.H.; Yoon, S.; Namgung, M.; Hwang, J.H.; Lee, J.H.; Choi, D. Characterization of brivanib therapy response in hepatocellular carcinoma xenografts using (1)h hr-mas spectroscopy and histopathology. Mol. Med. Rep. 2013, 8, 1425–1431. [Google Scholar] [PubMed]
- Torregrossa, L.; Shintu, L.; Nambiath Chandran, J.; Tintaru, A.; Ugolini, C.; Magalhaes, A.; Basolo, F.; Miccoli, P.; Caldarelli, S. Toward the reliable diagnosis of indeterminate thyroid lesions: A hrmas nmr-based metabolomics case of study. J. Proteome Res. 2012, 11, 3317–3325. [Google Scholar] [CrossRef] [PubMed]
- Miccoli, P.; Torregrossa, L.; Shintu, L.; Magalhaes, A.; Chandran, J.; Tintaru, A.; Ugolini, C.; Minuto, M.N.; Miccoli, M.; Basolo, F.; et al. Metabolomics approach to thyroid nodules: A high-resolution magic-angle spinning nuclear magnetic resonance-based study. Surgery 2012, 152, 1118–1124. [Google Scholar] [CrossRef] [PubMed]
- Imperiale, A.; Elbayed, K.; Moussallieh, F.M.; Reix, N.; Piotto, M.; Bellocq, J.P.; Goichot, B.; Bachellier, P.; Namer, I.J. Metabolomic profile of the adrenal gland: From physiology to pathological conditions. Endocr. Relat. Cancer 2013, 20, 705–716. [Google Scholar] [CrossRef] [PubMed]
- Imperiale, A.; Moussallieh, F.M.; Roche, P.; Battini, S.; Cicek, A.E.; Sebag, F.; Brunaud, L.; Barlier, A.; Elbayed, K.; Loundou, A.; et al. Metabolome profiling by hrmas nmr spectroscopy of pheochromocytomas and paragangliomas detects sdh deficiency: Clinical and pathophysiological implications. Neoplasia 2015, 17, 55–65. [Google Scholar] [CrossRef] [PubMed]
- Blaise, B.J.; Lopez, C.; Vercherat, C.; Lacheretz-Bernigaud, A.; Bayet-Robert, M.; Rezig, L.; Scoazec, J.Y.; Calender, A.; Emsley, L.; Elena-Herrmann, B.; et al. Metabolic expressivity of human genetic variants: Nmr metabotyping of men1 pathogenic mutants. J. Pharm. Biomed. Anal. 2014, 93, 118–124. [Google Scholar] [CrossRef] [PubMed]
- Santos, C.F.; Kurhanewicz, J.; Tabatabai, Z.L.; Simko, J.P.; Keshari, K.R.; Gbegnon, A.; Santos, R.D.; Federman, S.; Shinohara, K.; Carroll, P.R.; et al. Metabolic, pathologic, and genetic analysis of prostate tissues: Quantitative evaluation of histopathologic and mrna integrity after hr-mas spectroscopy. NMR Biomed. 2010, 23, 391–398. [Google Scholar] [CrossRef] [PubMed]
- Bertilsson, H.; Angelsen, A.; Viset, T.; Skogseth, H.; Tessem, M.B.; Halgunset, J. A new method to provide a fresh frozen prostate slice suitable for gene expression study and mr spectroscopy. Prostate 2011, 71, 461–469. [Google Scholar] [CrossRef] [PubMed]
- Metsis, V.; Huang, H.; Andronesi, O.C.; Makedon, F.; Tzika, A. Heterogeneous data fusion for brain tumor classification. Oncol. Rep. 2012, 28, 1413–1416. [Google Scholar] [CrossRef] [PubMed]


| Cancer | Reference | Observed Metabolic Changes |
|---|---|---|
| Brain | [14] | Astrocytoma, grade II: glyerophosphocholine (GPC)↑, myo-Inositol (m-Ino)↑ Glioblastoma Multiforme (GBM): phosphocholine (PChol)↑, glycine↑, lipids↑ |
| [16] | Glioma, grades II–IV: progressive reduction in m-Ino to total choline (tCho) index | |
| [17] | Hemangiopericytoma (HPC) compared with meningioma: m-Ino↑, glucose↑, gluthatione↑, creatine (Cr)↓, glutamine↓, alanine (Ala)↓, glycine (Gly)↓, choline (Cho)↓, PChol↓, GPC↓ | |
| [18] | Meningioma, grades I–III: progressive Ala↓and Cr↓ | |
| [19] | Biomarkers of GBM vs. metastasis: Cr, Gly, glutamine (Gln), hypotaurine (hypo-Tau) | |
| [20] | Astrocytoma, grade I–II vs. grade III: N-acetyl-aspartate (NAA)↑, Cr↑, GPC↑, m-Ino↑, lactate (Lac)↓, PChol↓ Astrocytoma, grade I–II vs. grade IV: Lac↑, Cr↑, Cho↑, GPC↑, Gly↓, PChol↓ Astrocytoma, grade III vs. grade IV: Lac↑, Cr↑, Cho↑, GPC↑, m-Ino↓, PChol↓ | |
| [21] | Ependymoma: m-Ino↑ Medulloblastoma: taurine (Tau)↑, GPC↑, PChol↑, Cho↑ Pilocytic astrocytoma: fatty acids↑ | |
| Lung | [44] | Lac↑, PChol↑, GPC↑, acetate↓, m-Ino↓, inosine/adenosine↓, glucose↓ |
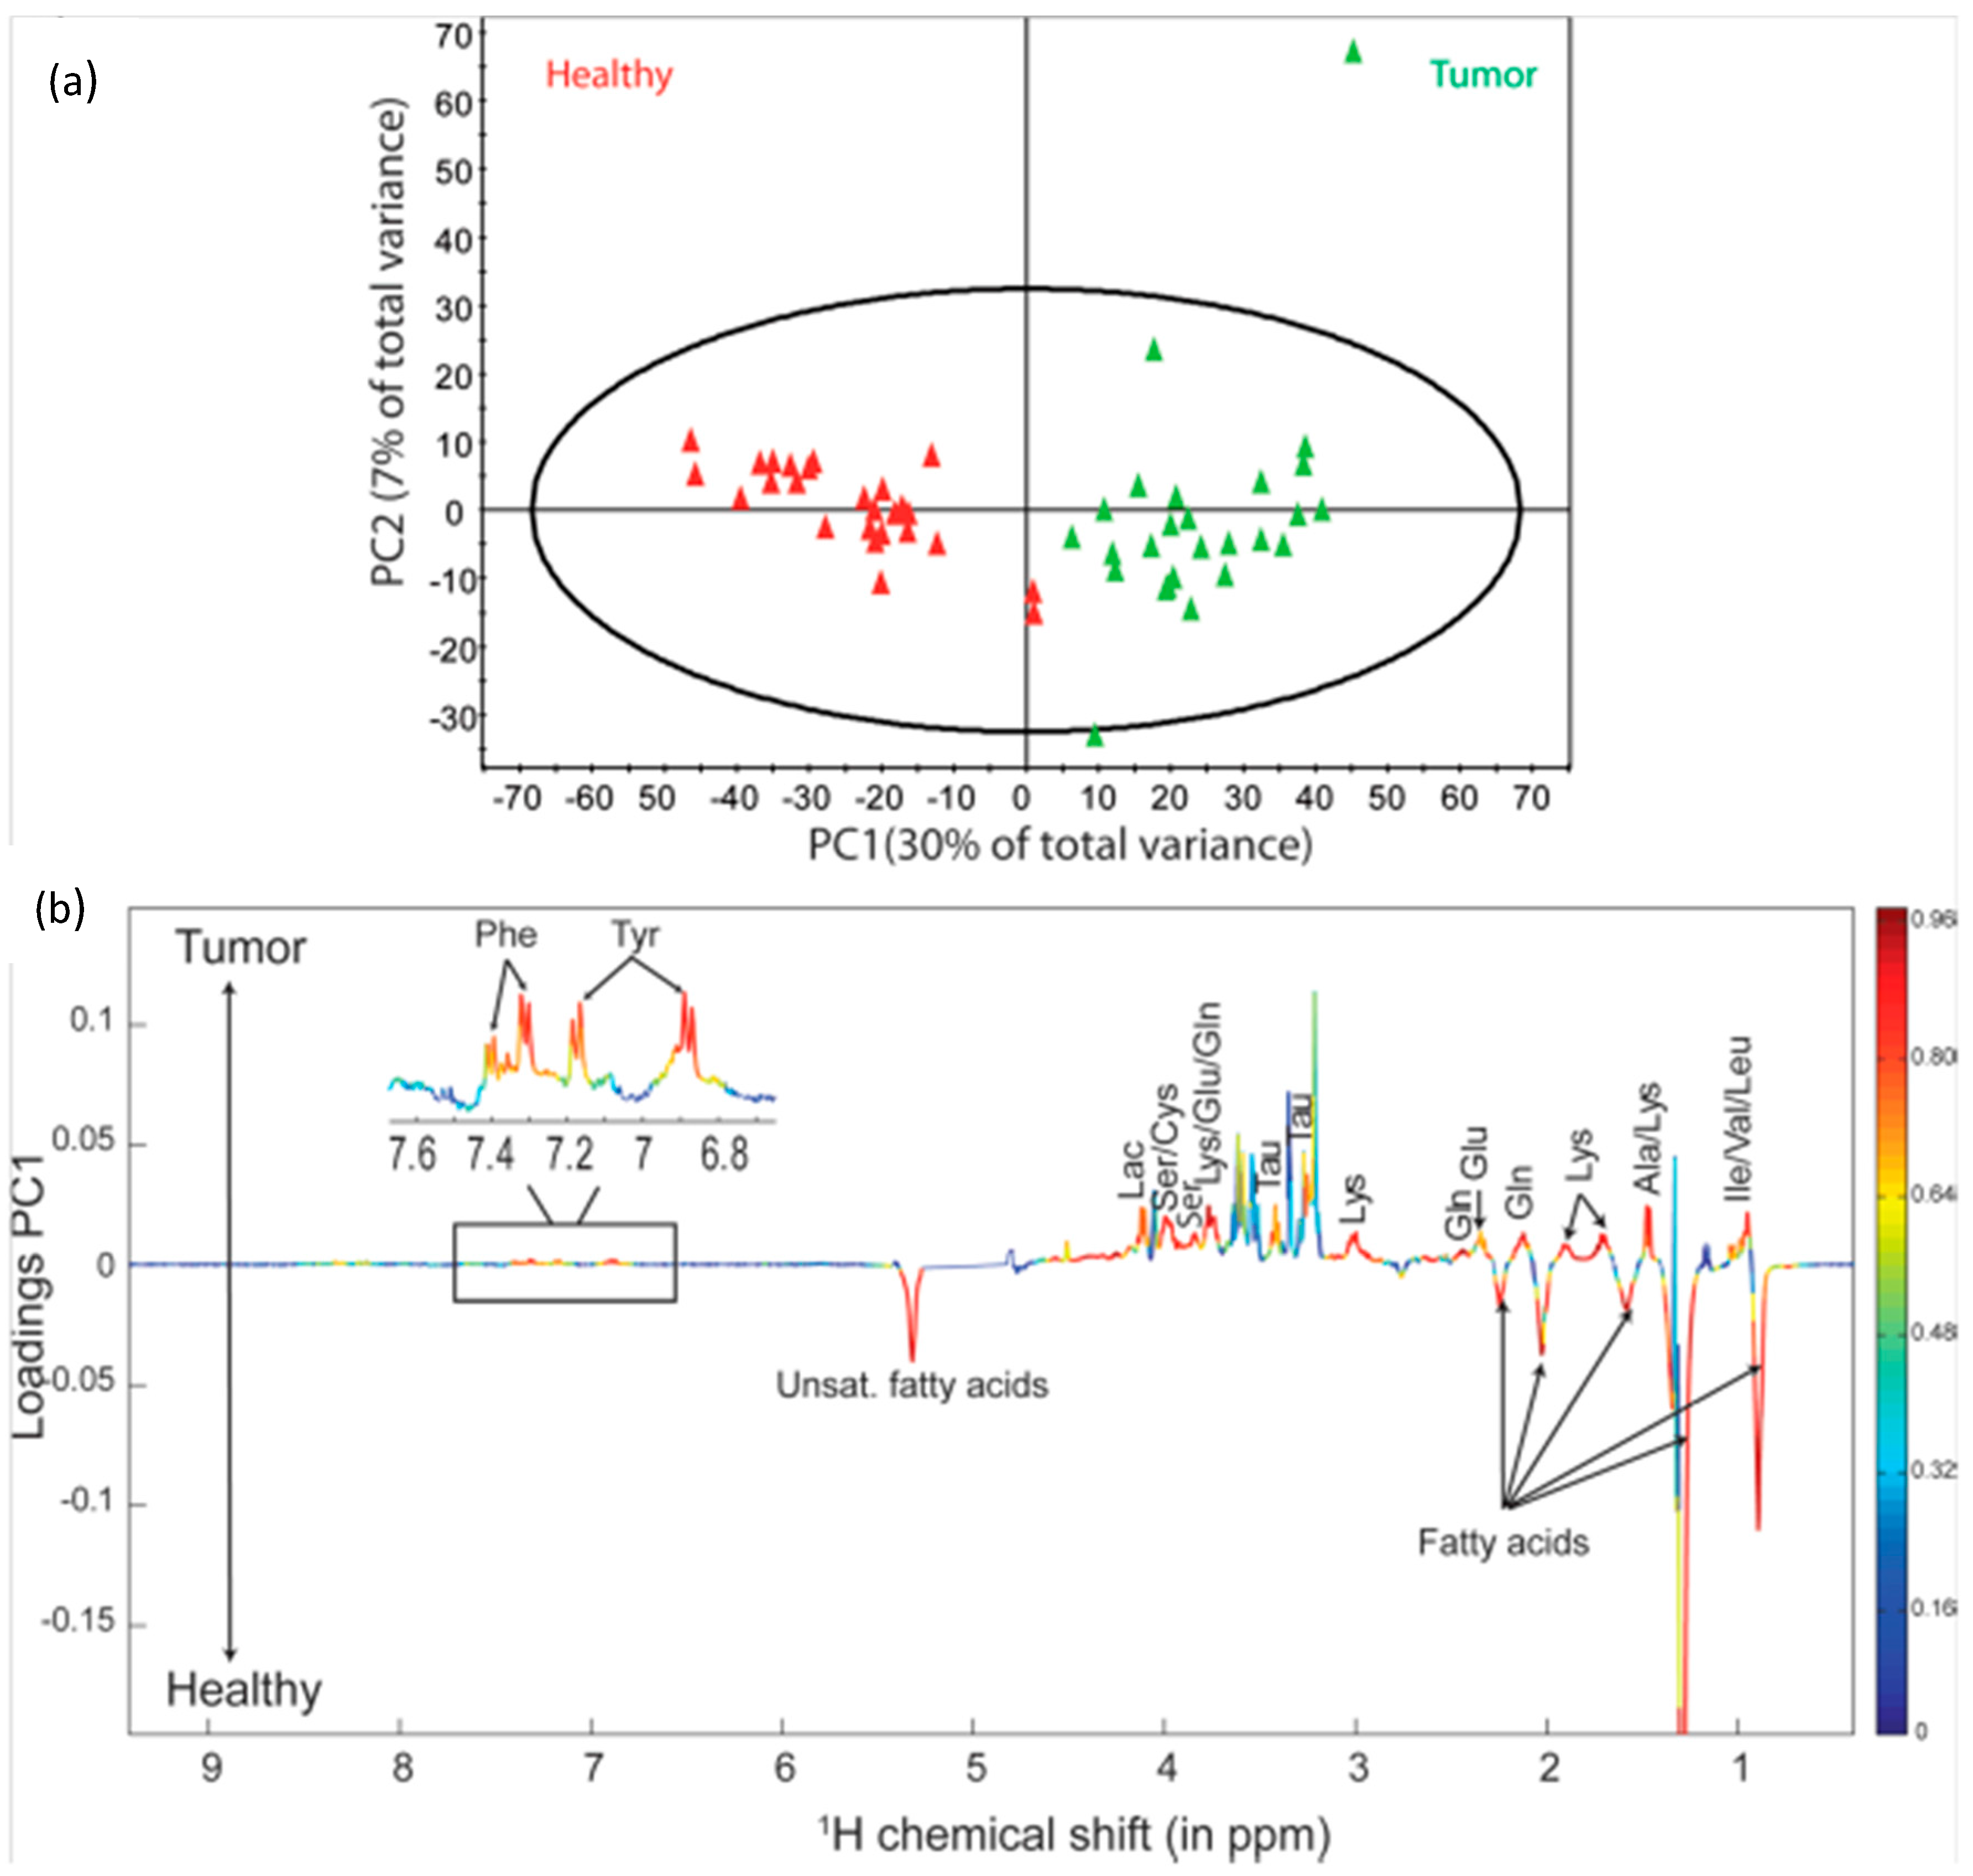
| Thyroid | [52,53] | Lac↑, phenylalanine (Phe)↑, tyrosine (Tyr)↑, serine (Ser)↑, lysine (Lys)↑, Tau↑, Gln↑, glutamate (Glu)↑, Ala↑, isoleucine (Ile)↑, leucine (Leu)↑, valine (Val)↑, lipids↓, Cho↓, PCho↓, m-Ino↓, s-Ino↓ |
| Adrenal | [54] | Adrenal cortical carcinoma: tCho↑, Lac↑, glutathione↑, m-Ino↑, glycine↑, Cr↑, Glu↑, Gln↑, scyllo-Inositol (s-Ino)↑, NAA↓, Ile↓ Adenoma: succinic acid↑, Val↓, Ala↓, Asp↓, gamma-aminobutyric acid (GABA)↓, Ile↓, acetate↓, Lys↓ Pheochromocytoma: Tau↑, Ala↑, aspartate↑, GABA↑, glutathione↑, noradrenaline↑, ascorbic acid↑, tCho↑ |
| [55] | Succinate dehydrogenase gene (SDHx) Pheochromocytoma/ paraganglioma: succinate↑, m-Ino↑, Met↑, glutamine↑, Tau↑, adenosine triphosphate (ATP)↑ | |
| [56] | Multiple endocrine neoplasia syndrome, type 1 (MEN1): PChol↓, Cho↓, Tau↓, Cr↓, aspartate↓, glutathione↓, ƴ-amino-N-butyrate↓, inosine↓ | |
| Colorectal | [46,47] | Tau↑, isoglutamine↑, Cho↑, Lac↑, Phe↑, Tyr↑, lipids↓, triglycerides↓ |
| Esophageal | [48] | PChol, glutamate, m-Ino, adenosine-containing compounds, inosine |
| Prostate | [39] | Ratios correlating with tumor fraction: GPC+PChol/Cr, m-Ino/s-Ino, Cho/Cr, s-Ino/Cr Ratio correlating with malignancy and Ki67: GPC+PChol/Cr |
| Breast | [31] | Tau↑, tCho↑ |
| [32] | Triple negative breast cancer (TNBC) as compared with triple positive breast cancer (TPBC): Cho↑, GPC↑, Cr↓ Estrogen receptor negative (ERneg) and progesterone receptor negative (PRneg): glycine↑, Cho↑, Lac↑ | |
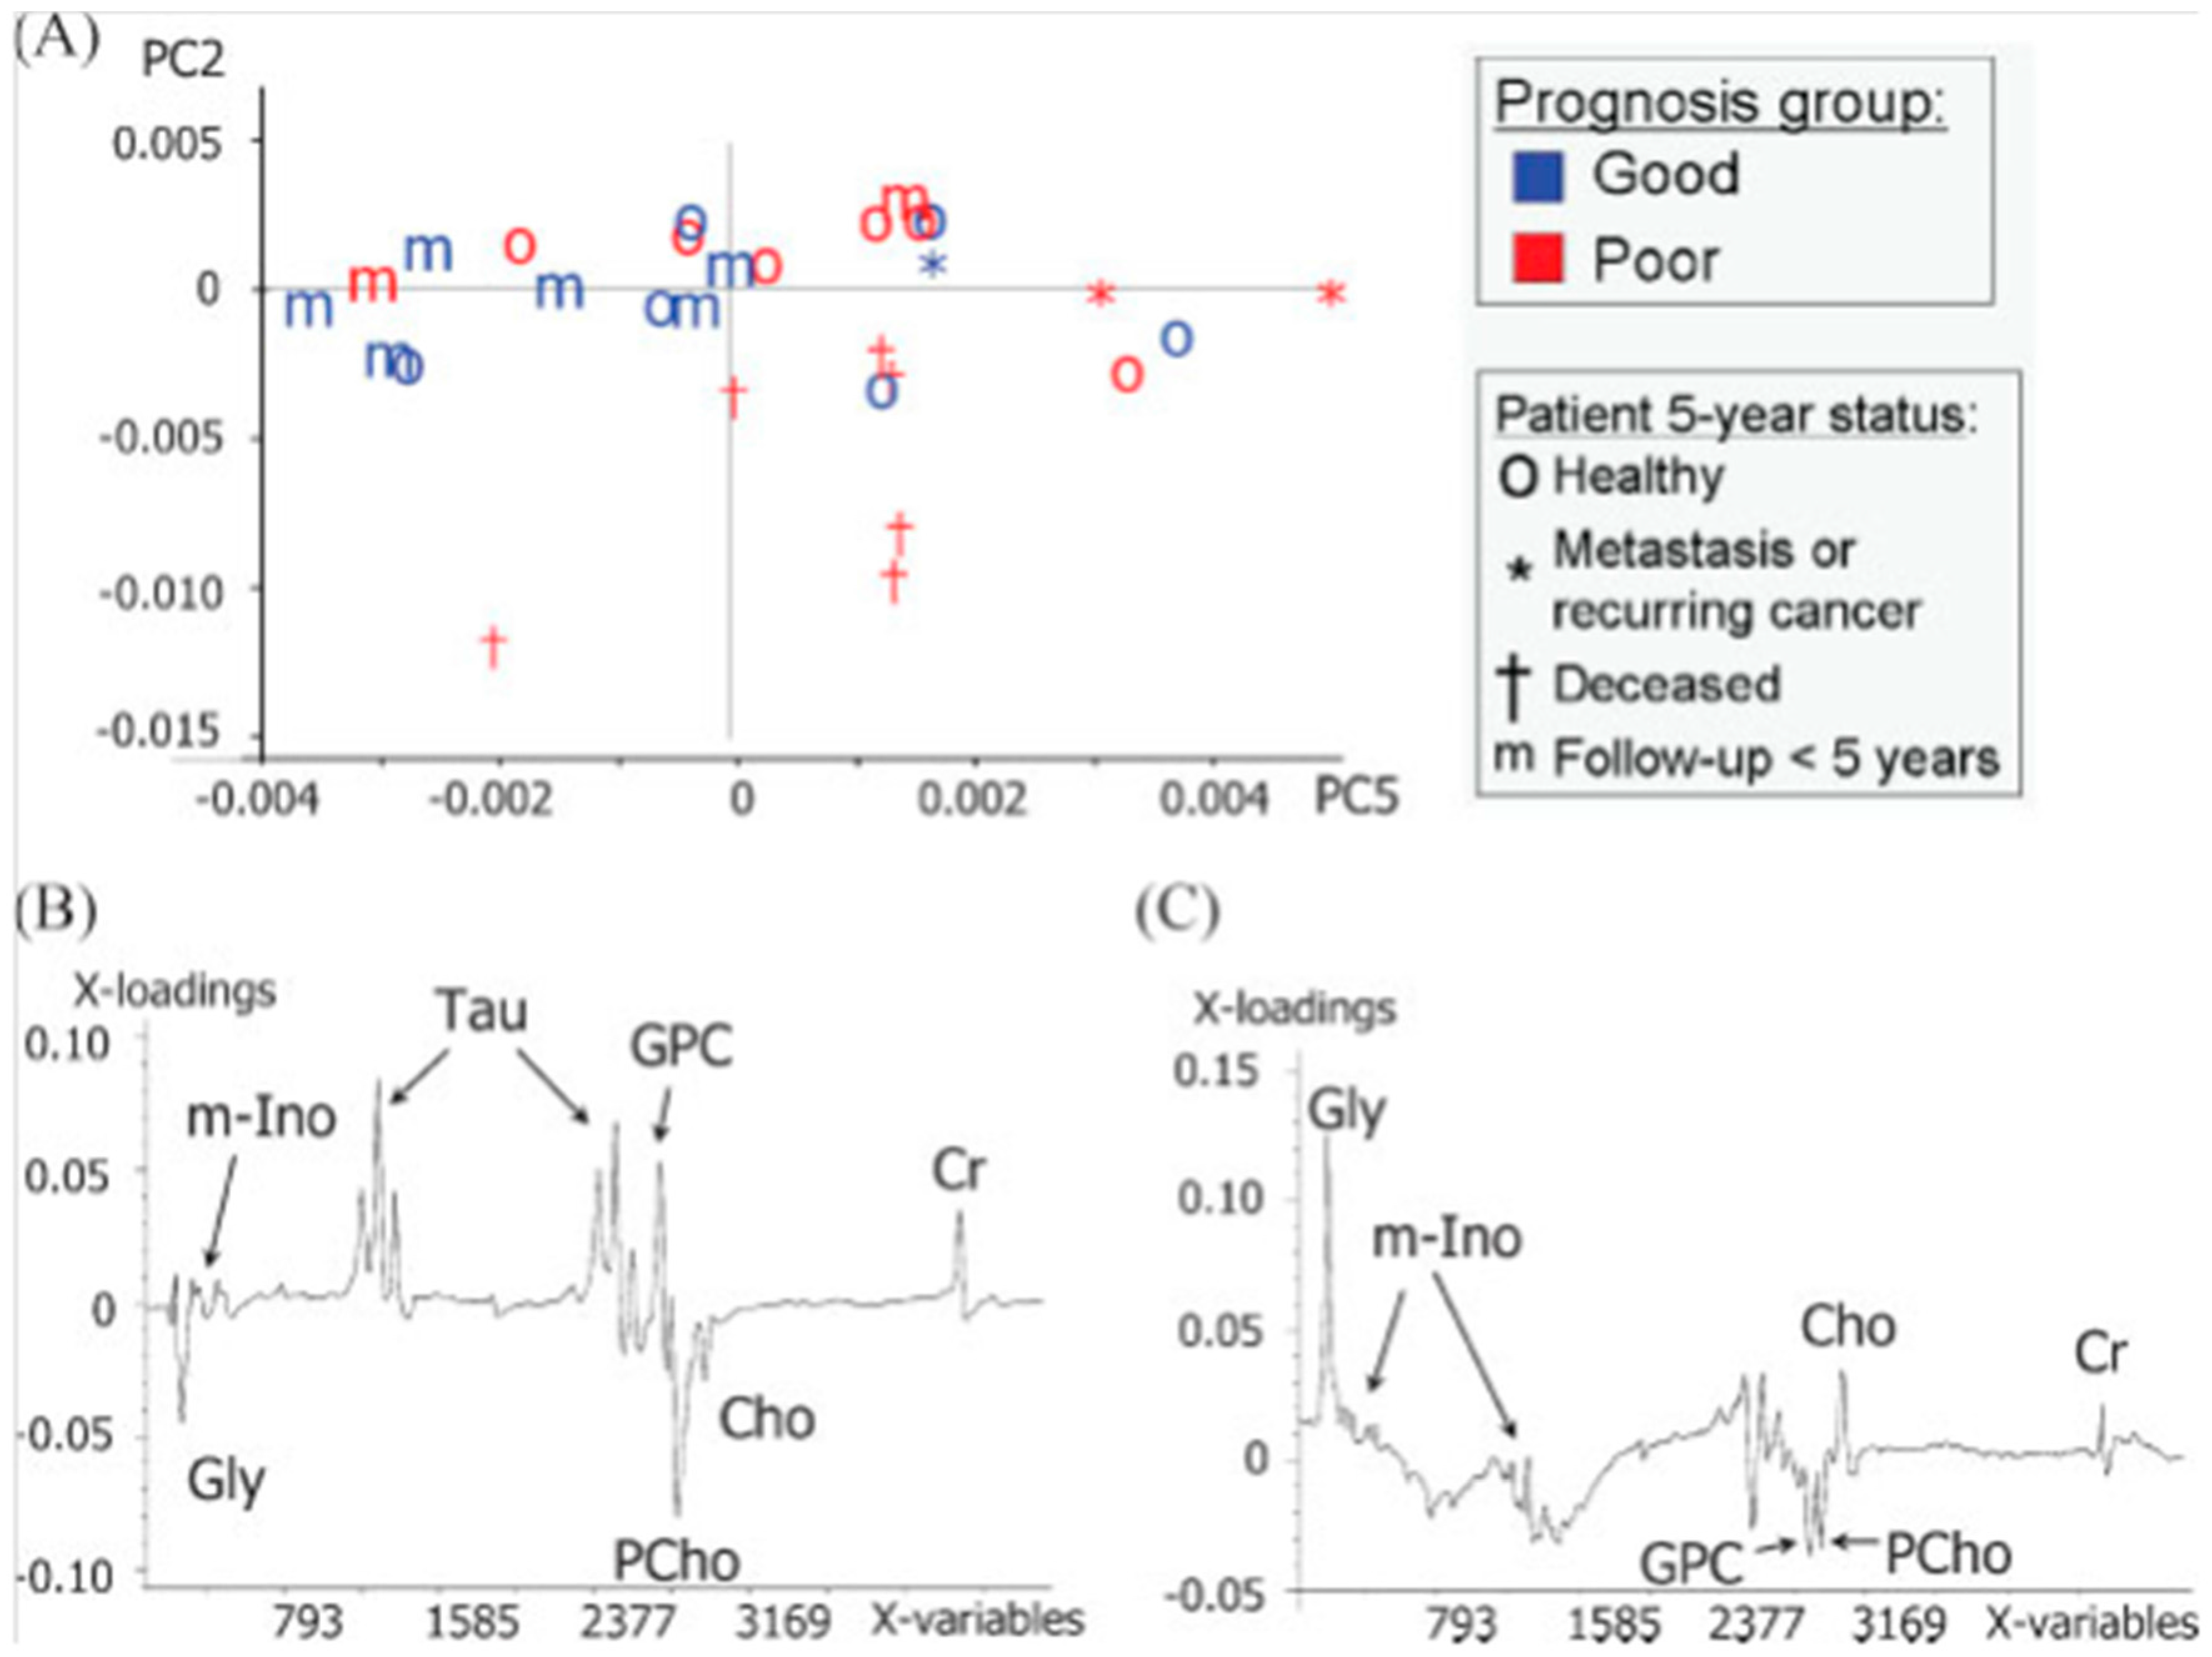
| [33] | 5-year survival: Tau↑,GPC↑, Cr↑, glycine↓, PChol↓ | |
| Uterine | [37] | Leiomyoma: glutamate↑, glutamine↑, Tau↓ |
© 2016 by the authors; licensee MDPI, Basel, Switzerland. This article is an open access article distributed under the terms and conditions of the Creative Commons by Attribution (CC-BY) license (http://creativecommons.org/licenses/by/4.0/).
Share and Cite
Fuss, T.L.; Cheng, L.L. Evaluation of Cancer Metabolomics Using ex vivo High Resolution Magic Angle Spinning (HRMAS) Magnetic Resonance Spectroscopy (MRS). Metabolites 2016, 6, 11. https://doi.org/10.3390/metabo6010011
Fuss TL, Cheng LL. Evaluation of Cancer Metabolomics Using ex vivo High Resolution Magic Angle Spinning (HRMAS) Magnetic Resonance Spectroscopy (MRS). Metabolites. 2016; 6(1):11. https://doi.org/10.3390/metabo6010011
Chicago/Turabian StyleFuss, Taylor L., and Leo L. Cheng. 2016. "Evaluation of Cancer Metabolomics Using ex vivo High Resolution Magic Angle Spinning (HRMAS) Magnetic Resonance Spectroscopy (MRS)" Metabolites 6, no. 1: 11. https://doi.org/10.3390/metabo6010011