Multi-Omic Profiling of Melophlus Sponges Reveals Diverse Metabolomic and Microbiome Architectures that Are Non-overlapping with Ecological Neighbors

 , and
, and 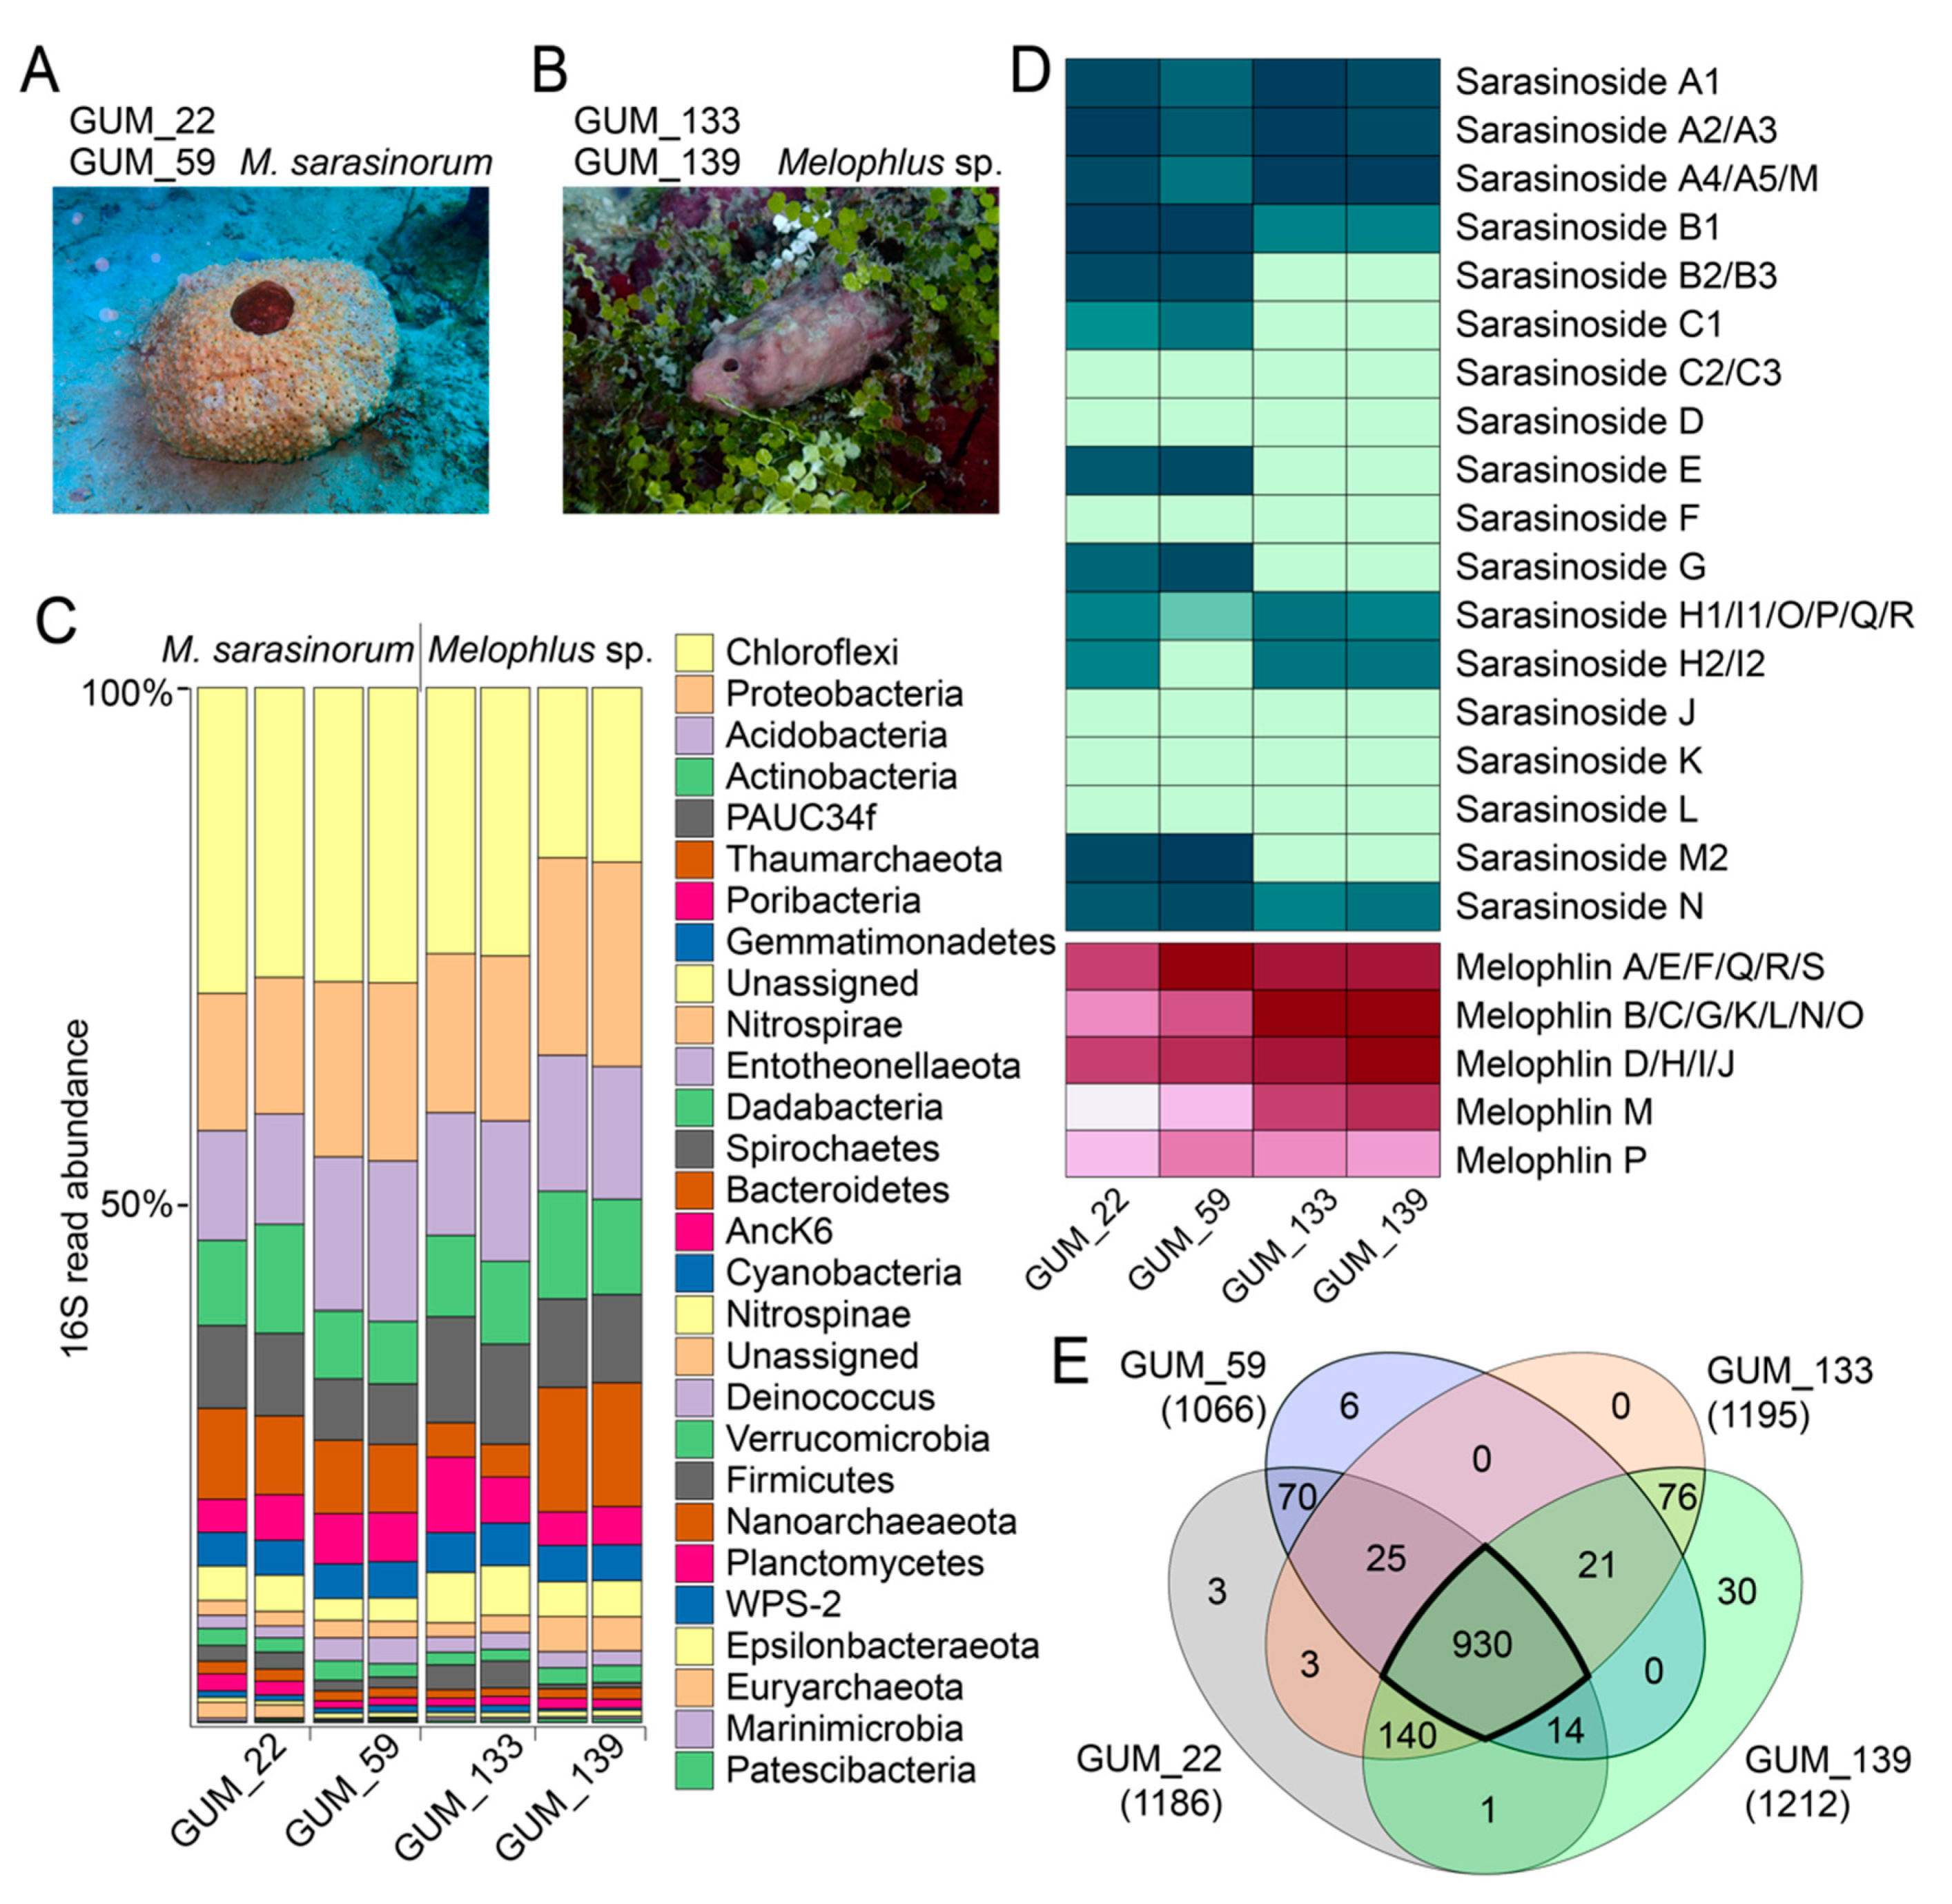
Abstract
:1. Introduction
2. Results
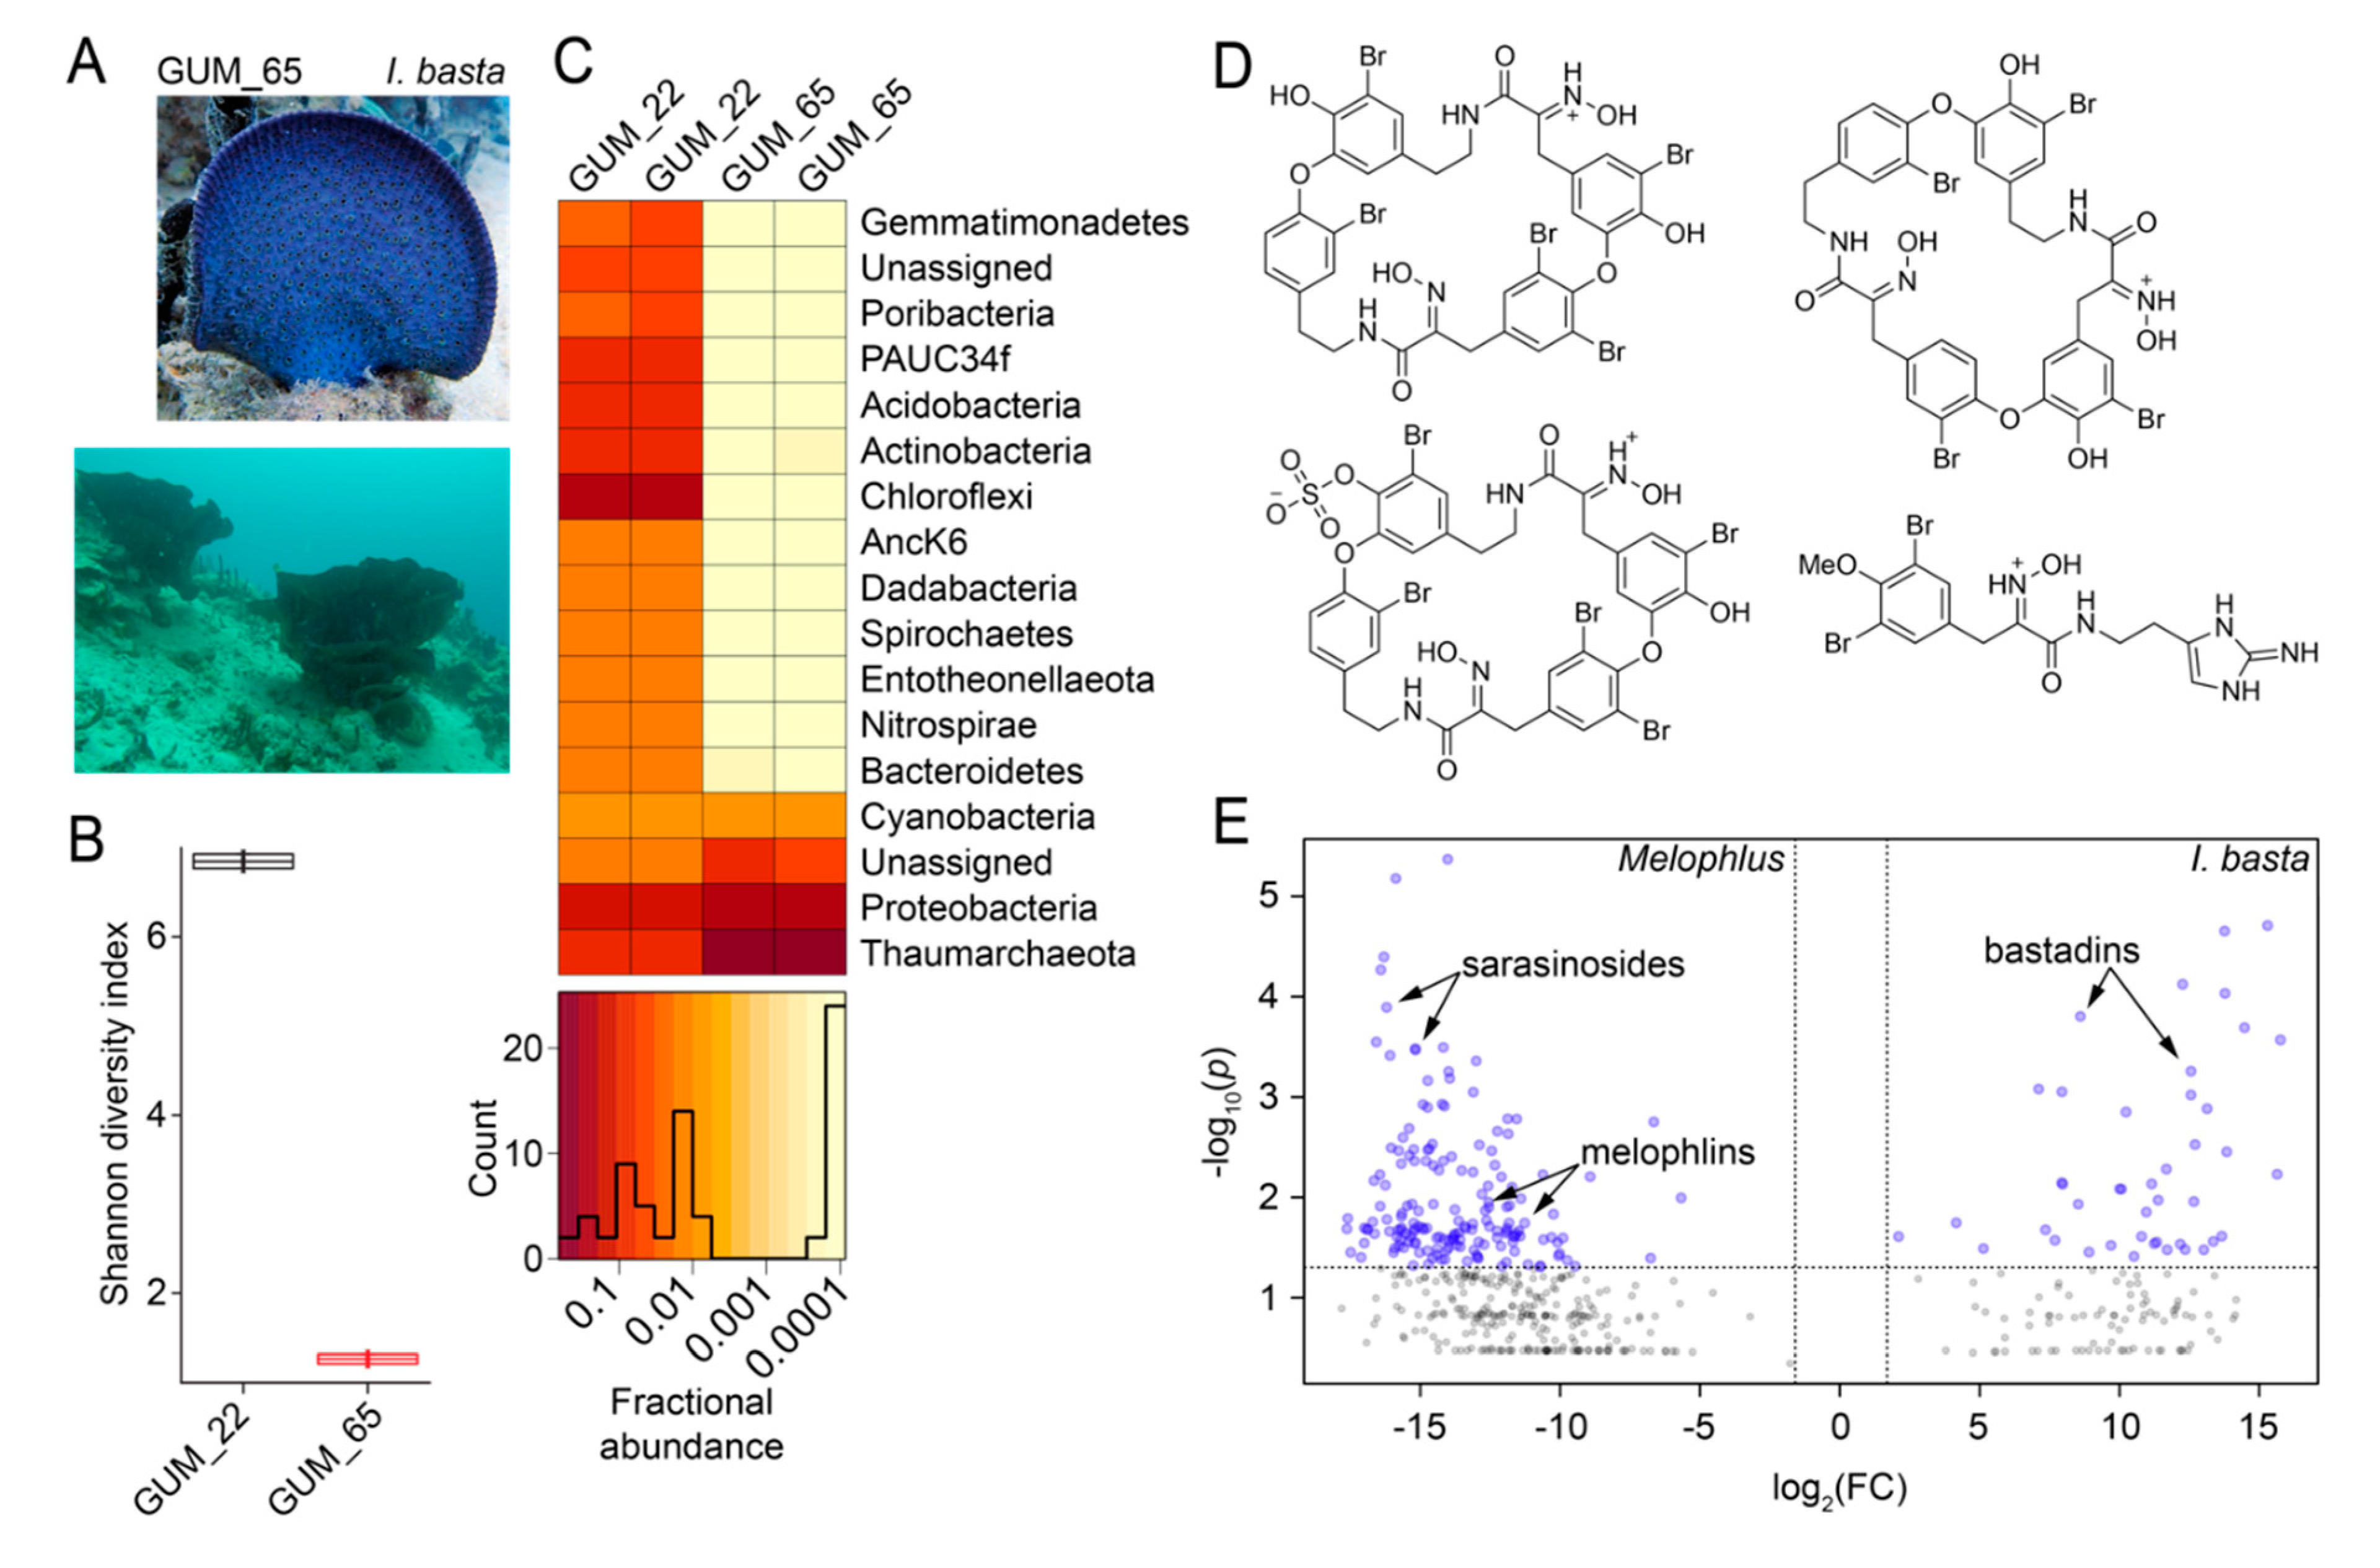
2.1. Sponge Phylogeny and Microbiome
2.2. Overall Metabolomic Description
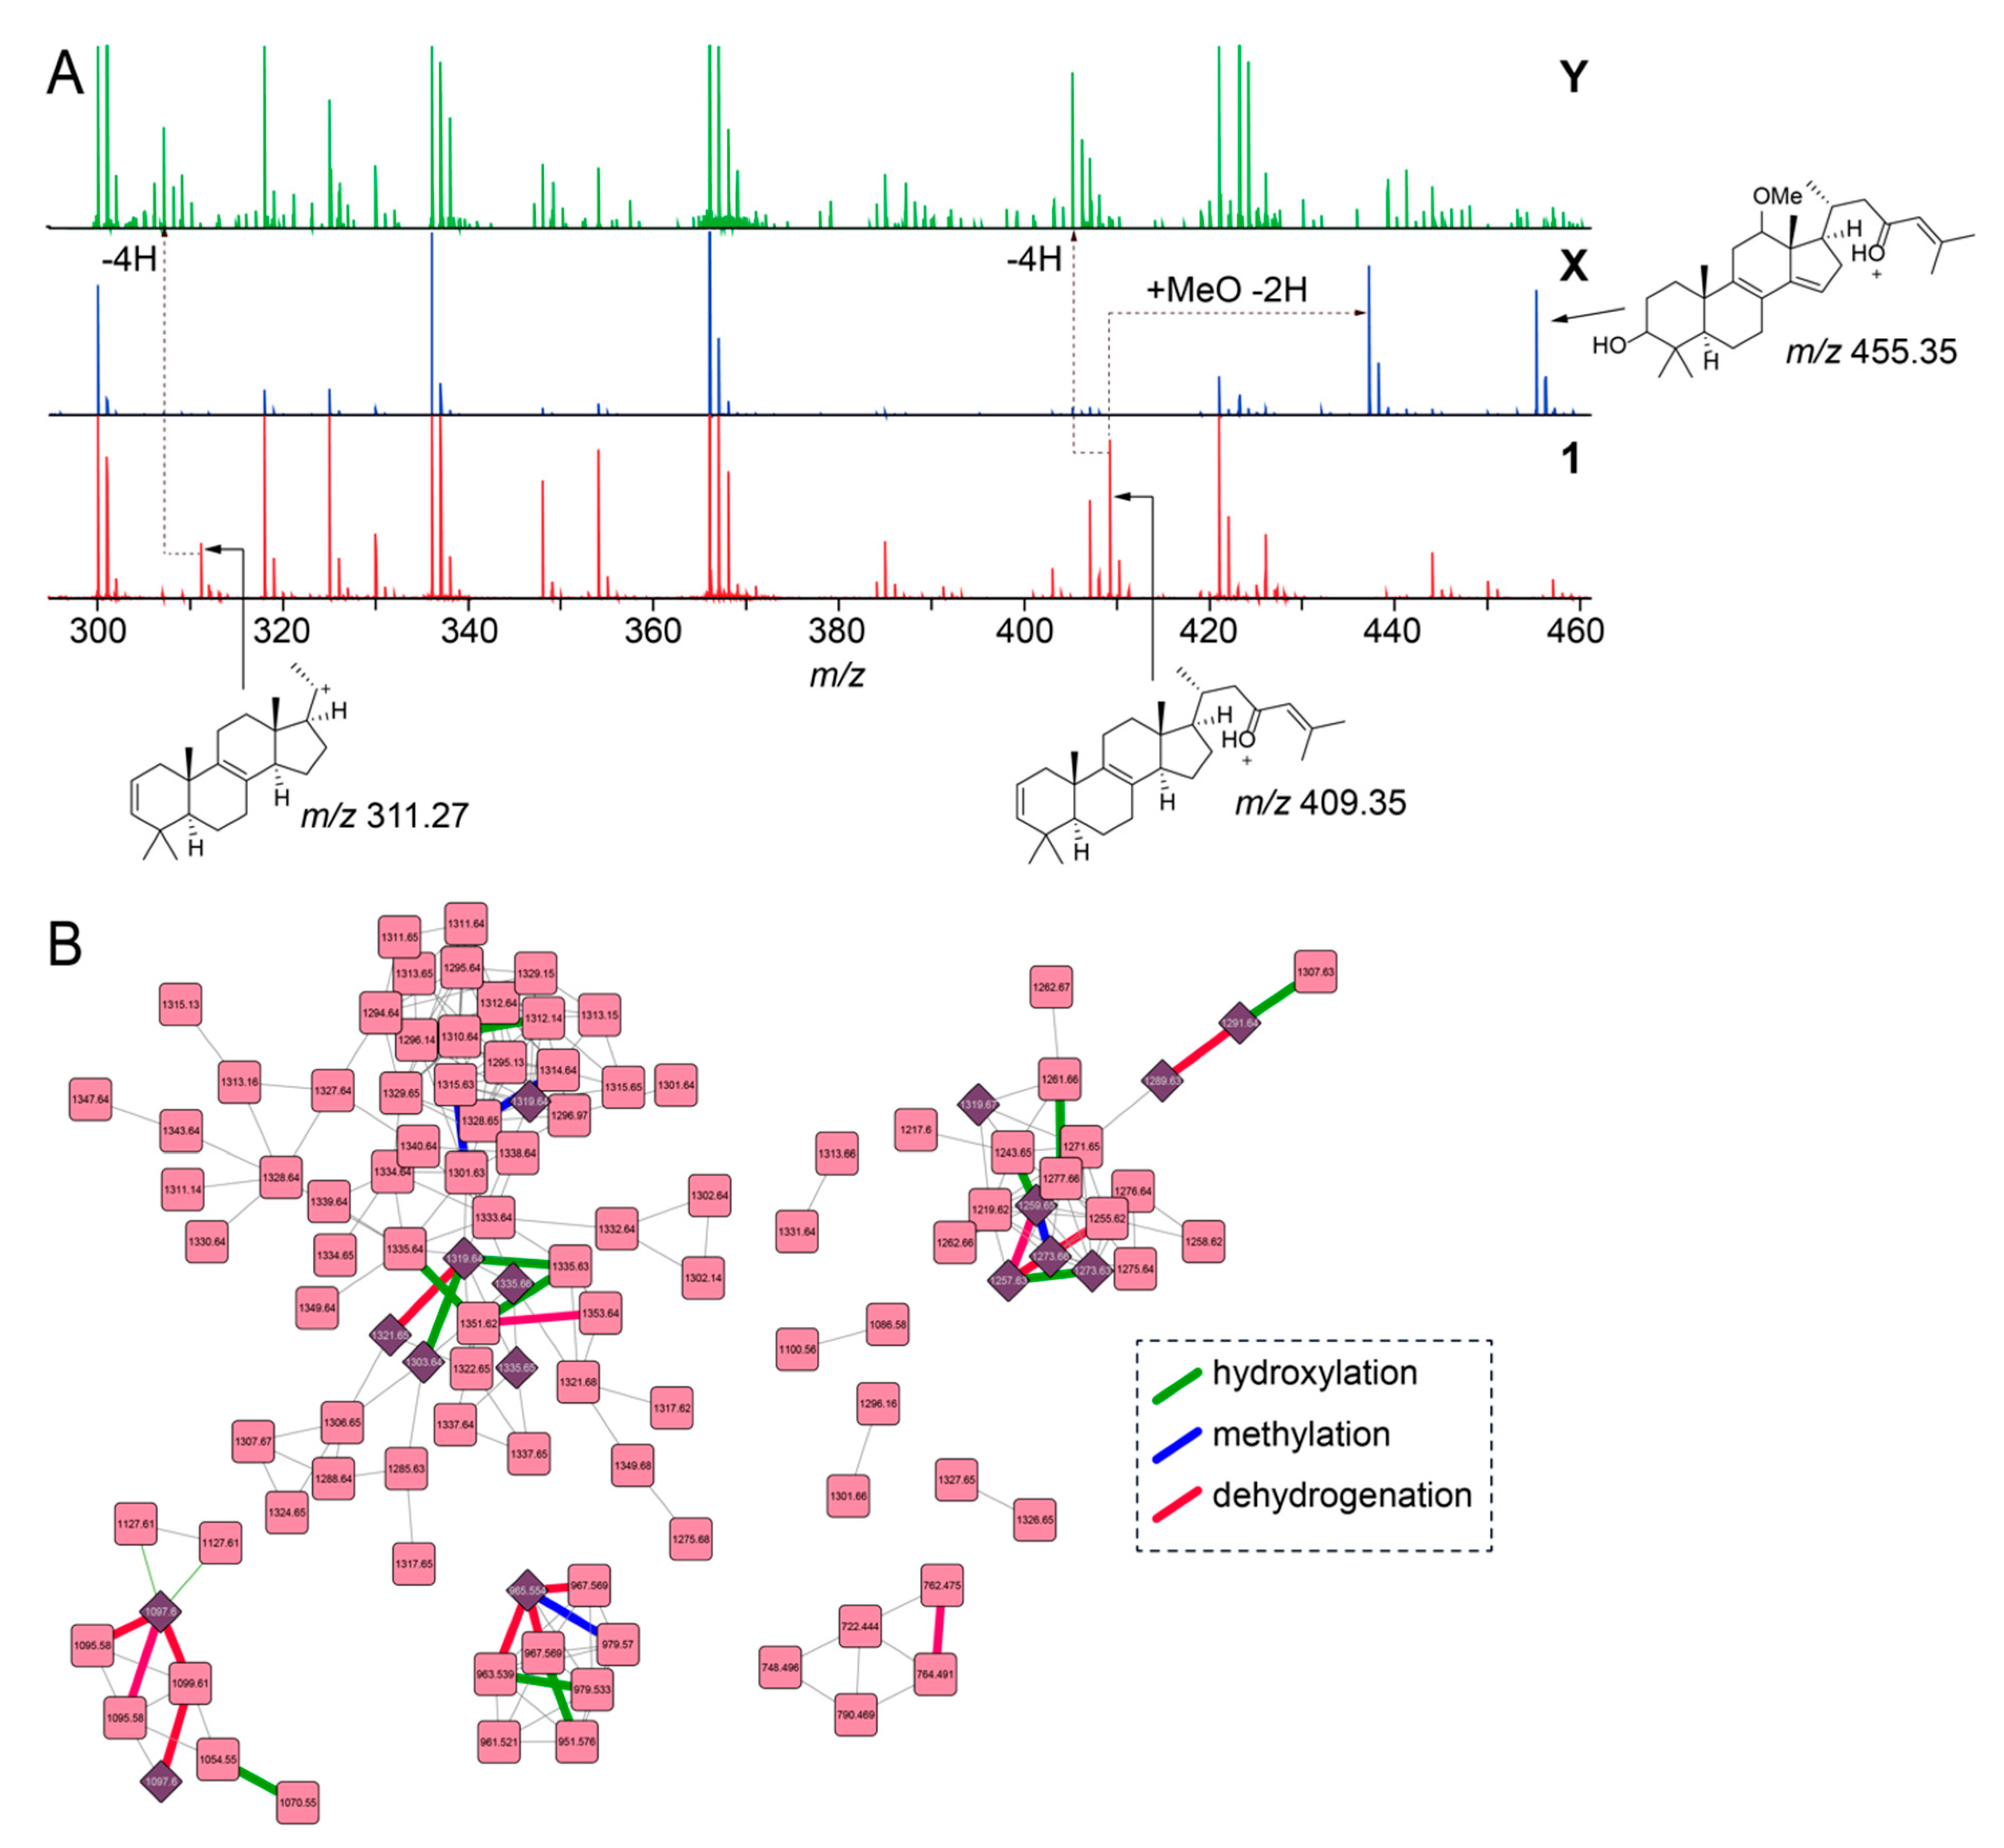
2.3. Sarasinoside Chemical Diversity
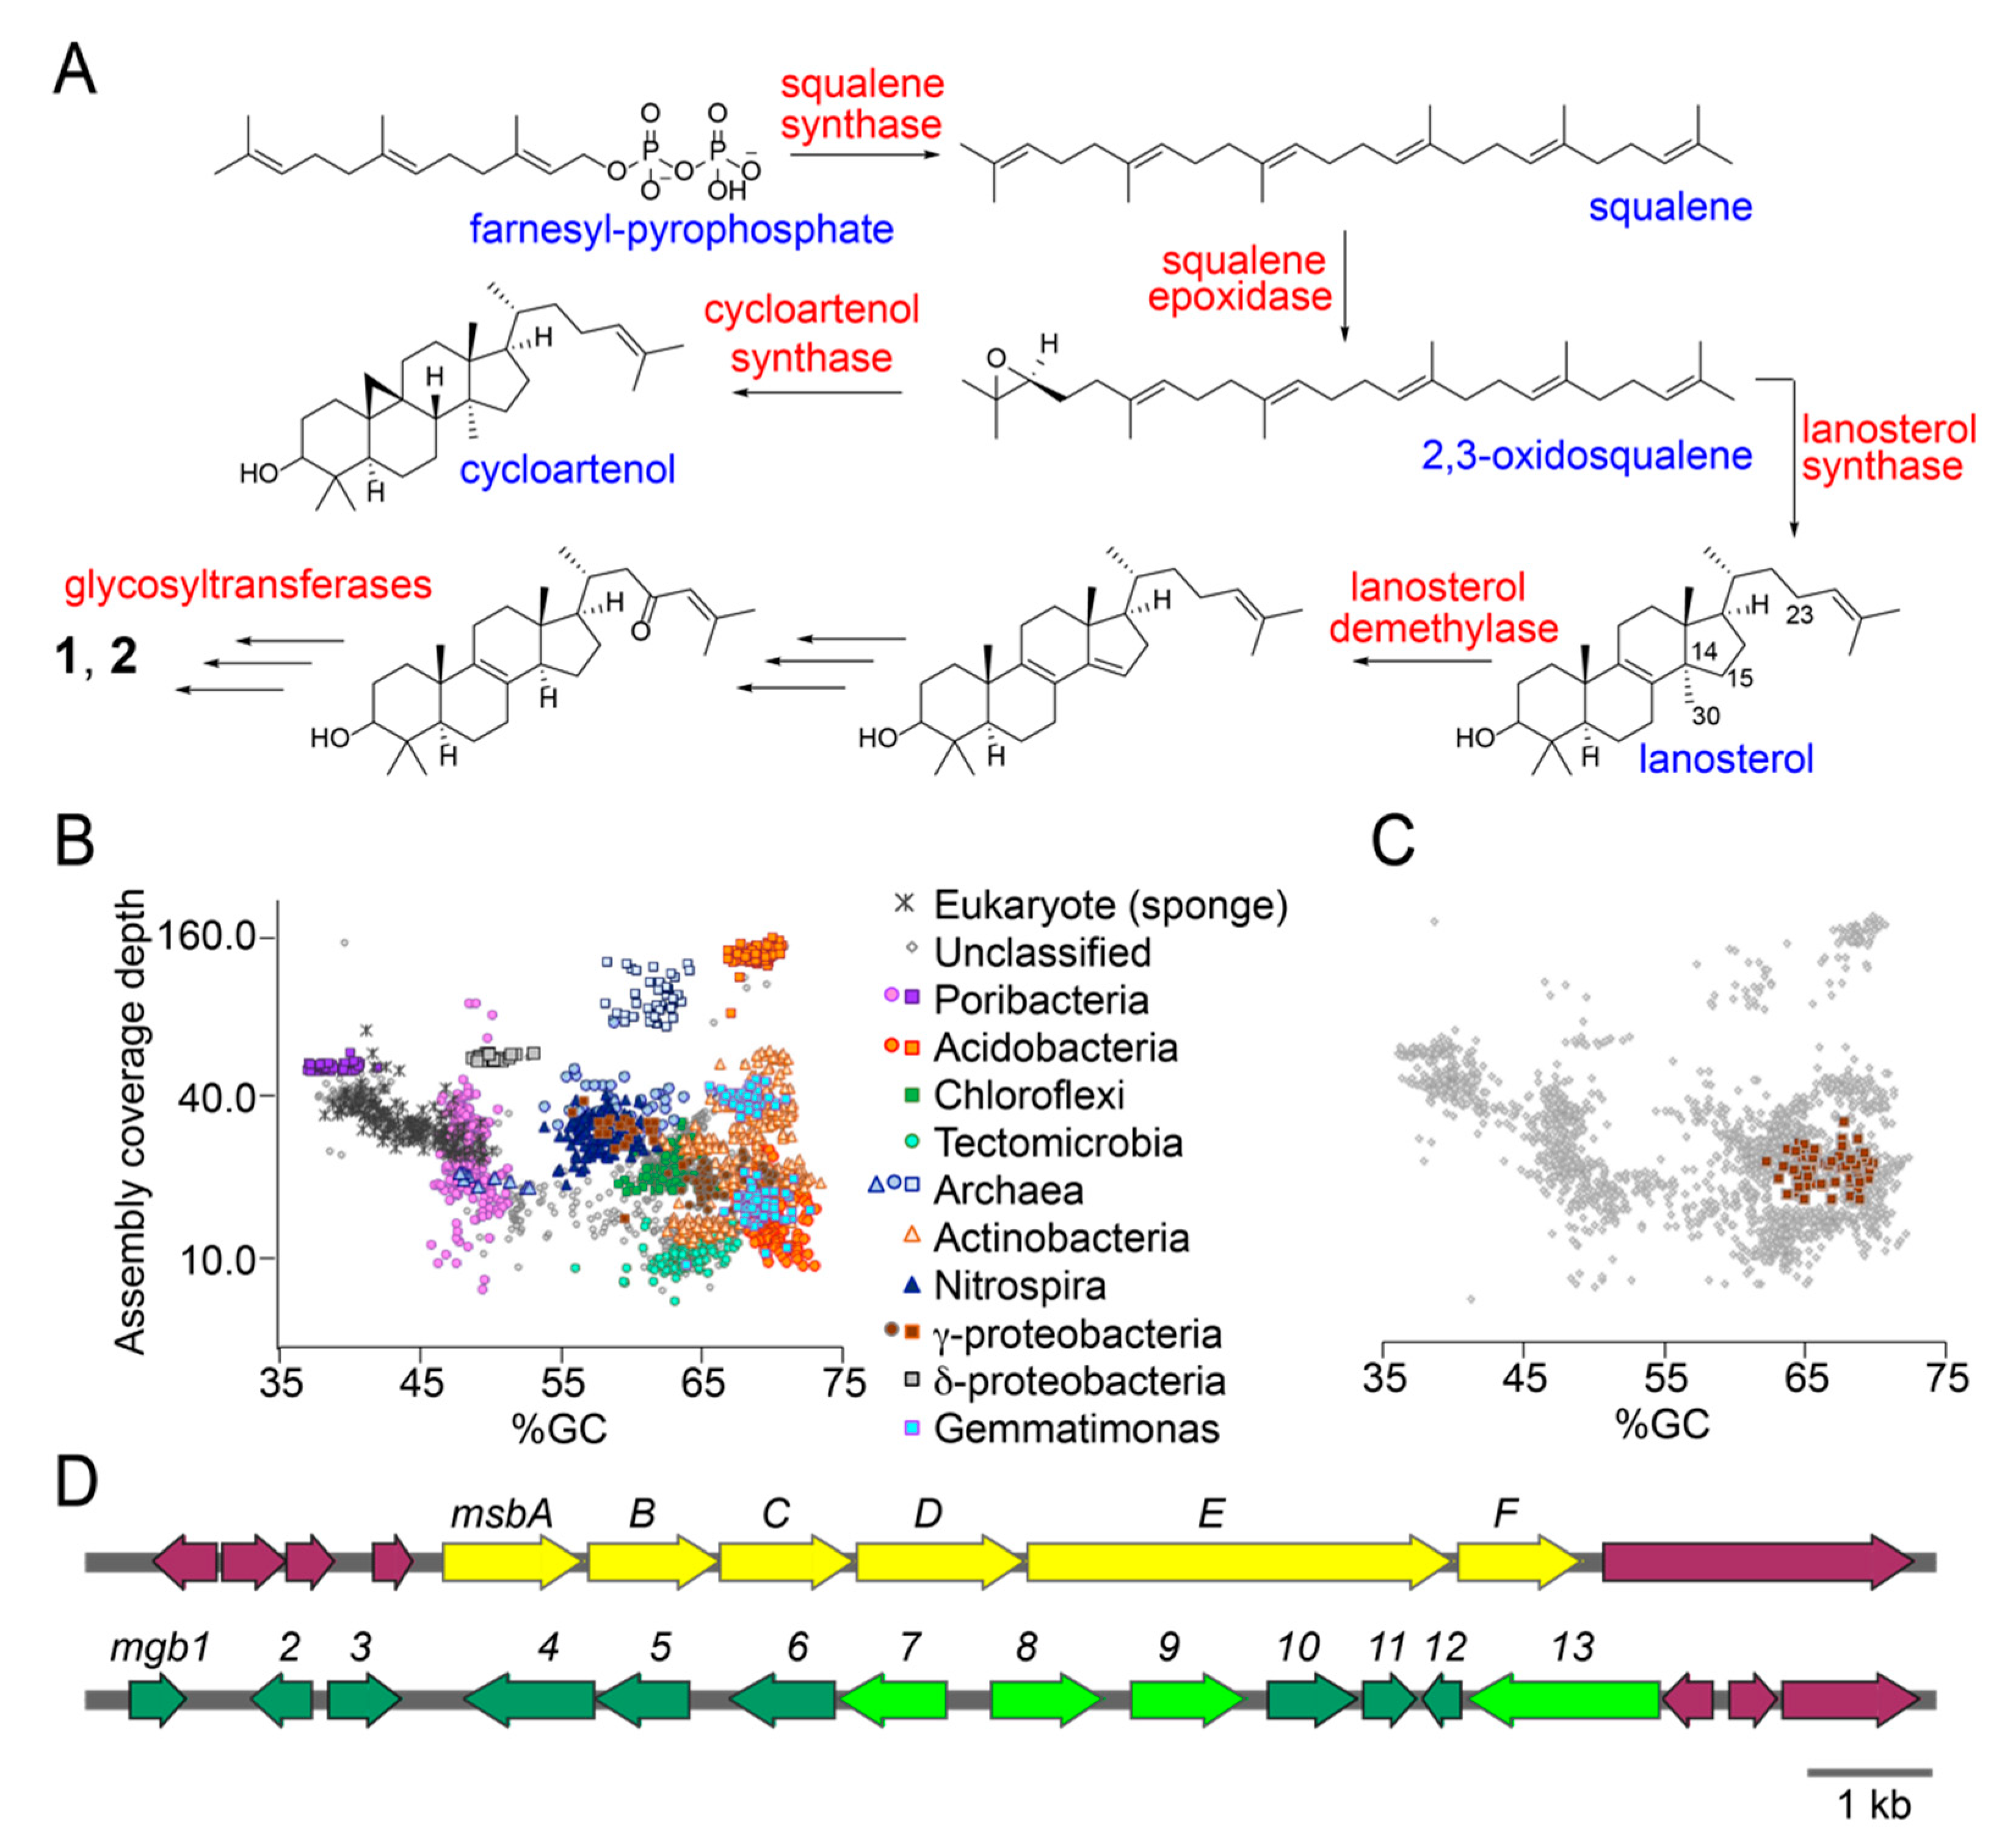
2.4. Putative Sterol Biosynthetic Gene Clusters in the Sponge Microbiome
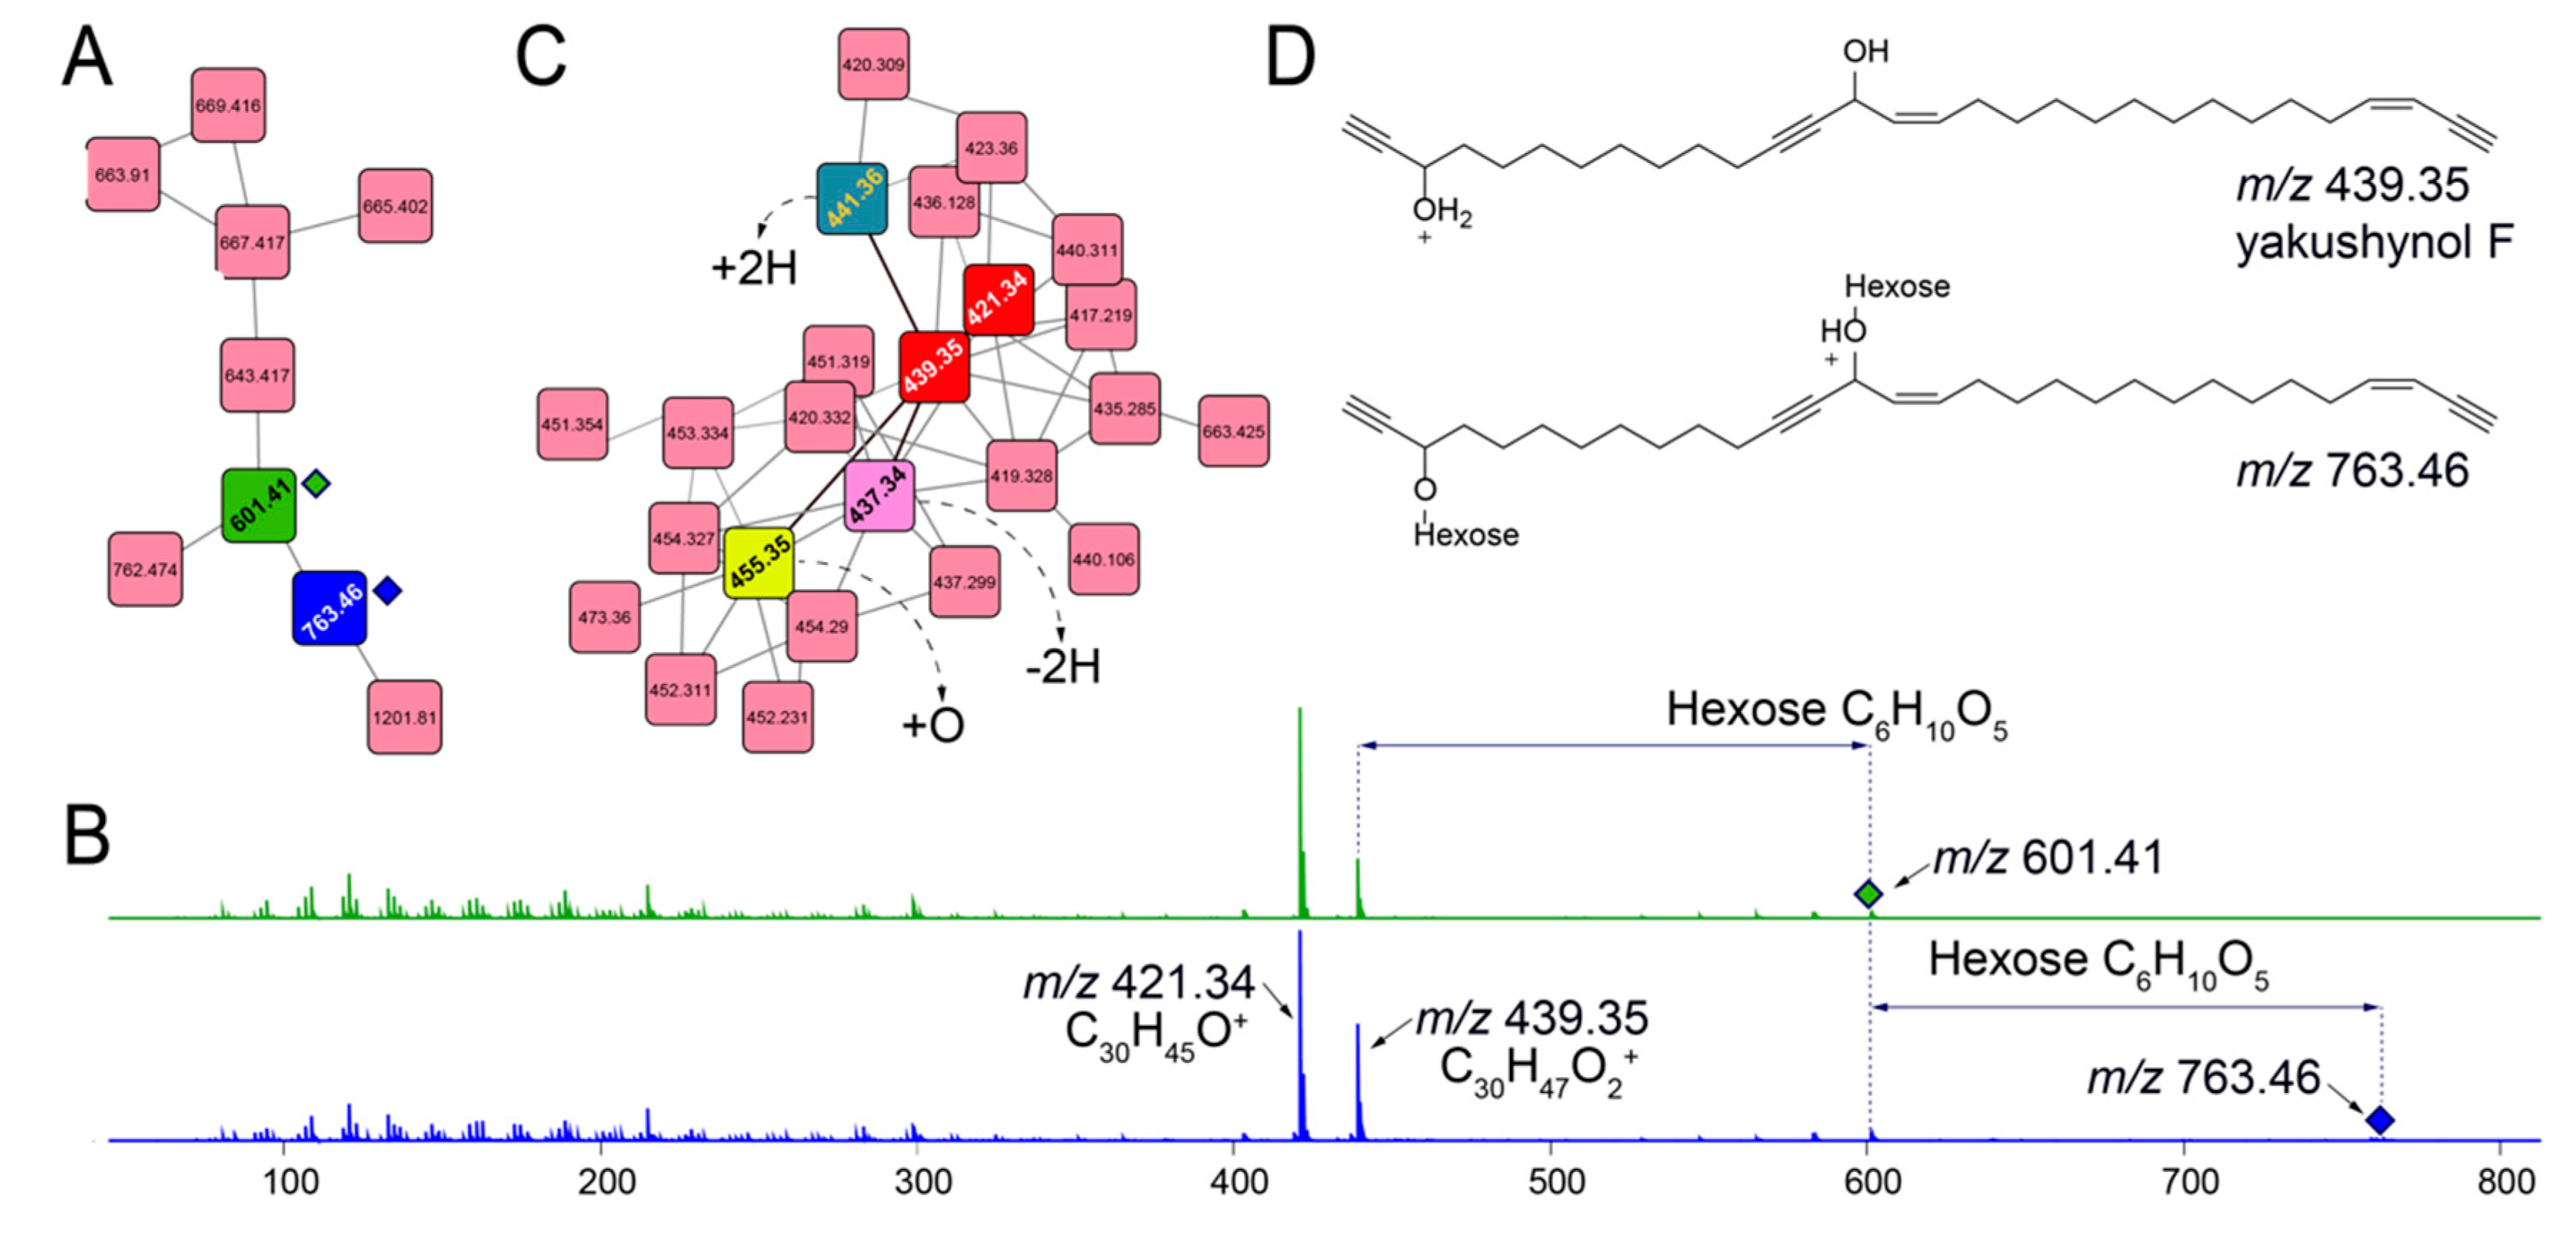
2.5. Mining for Other Glycosylated Molecules
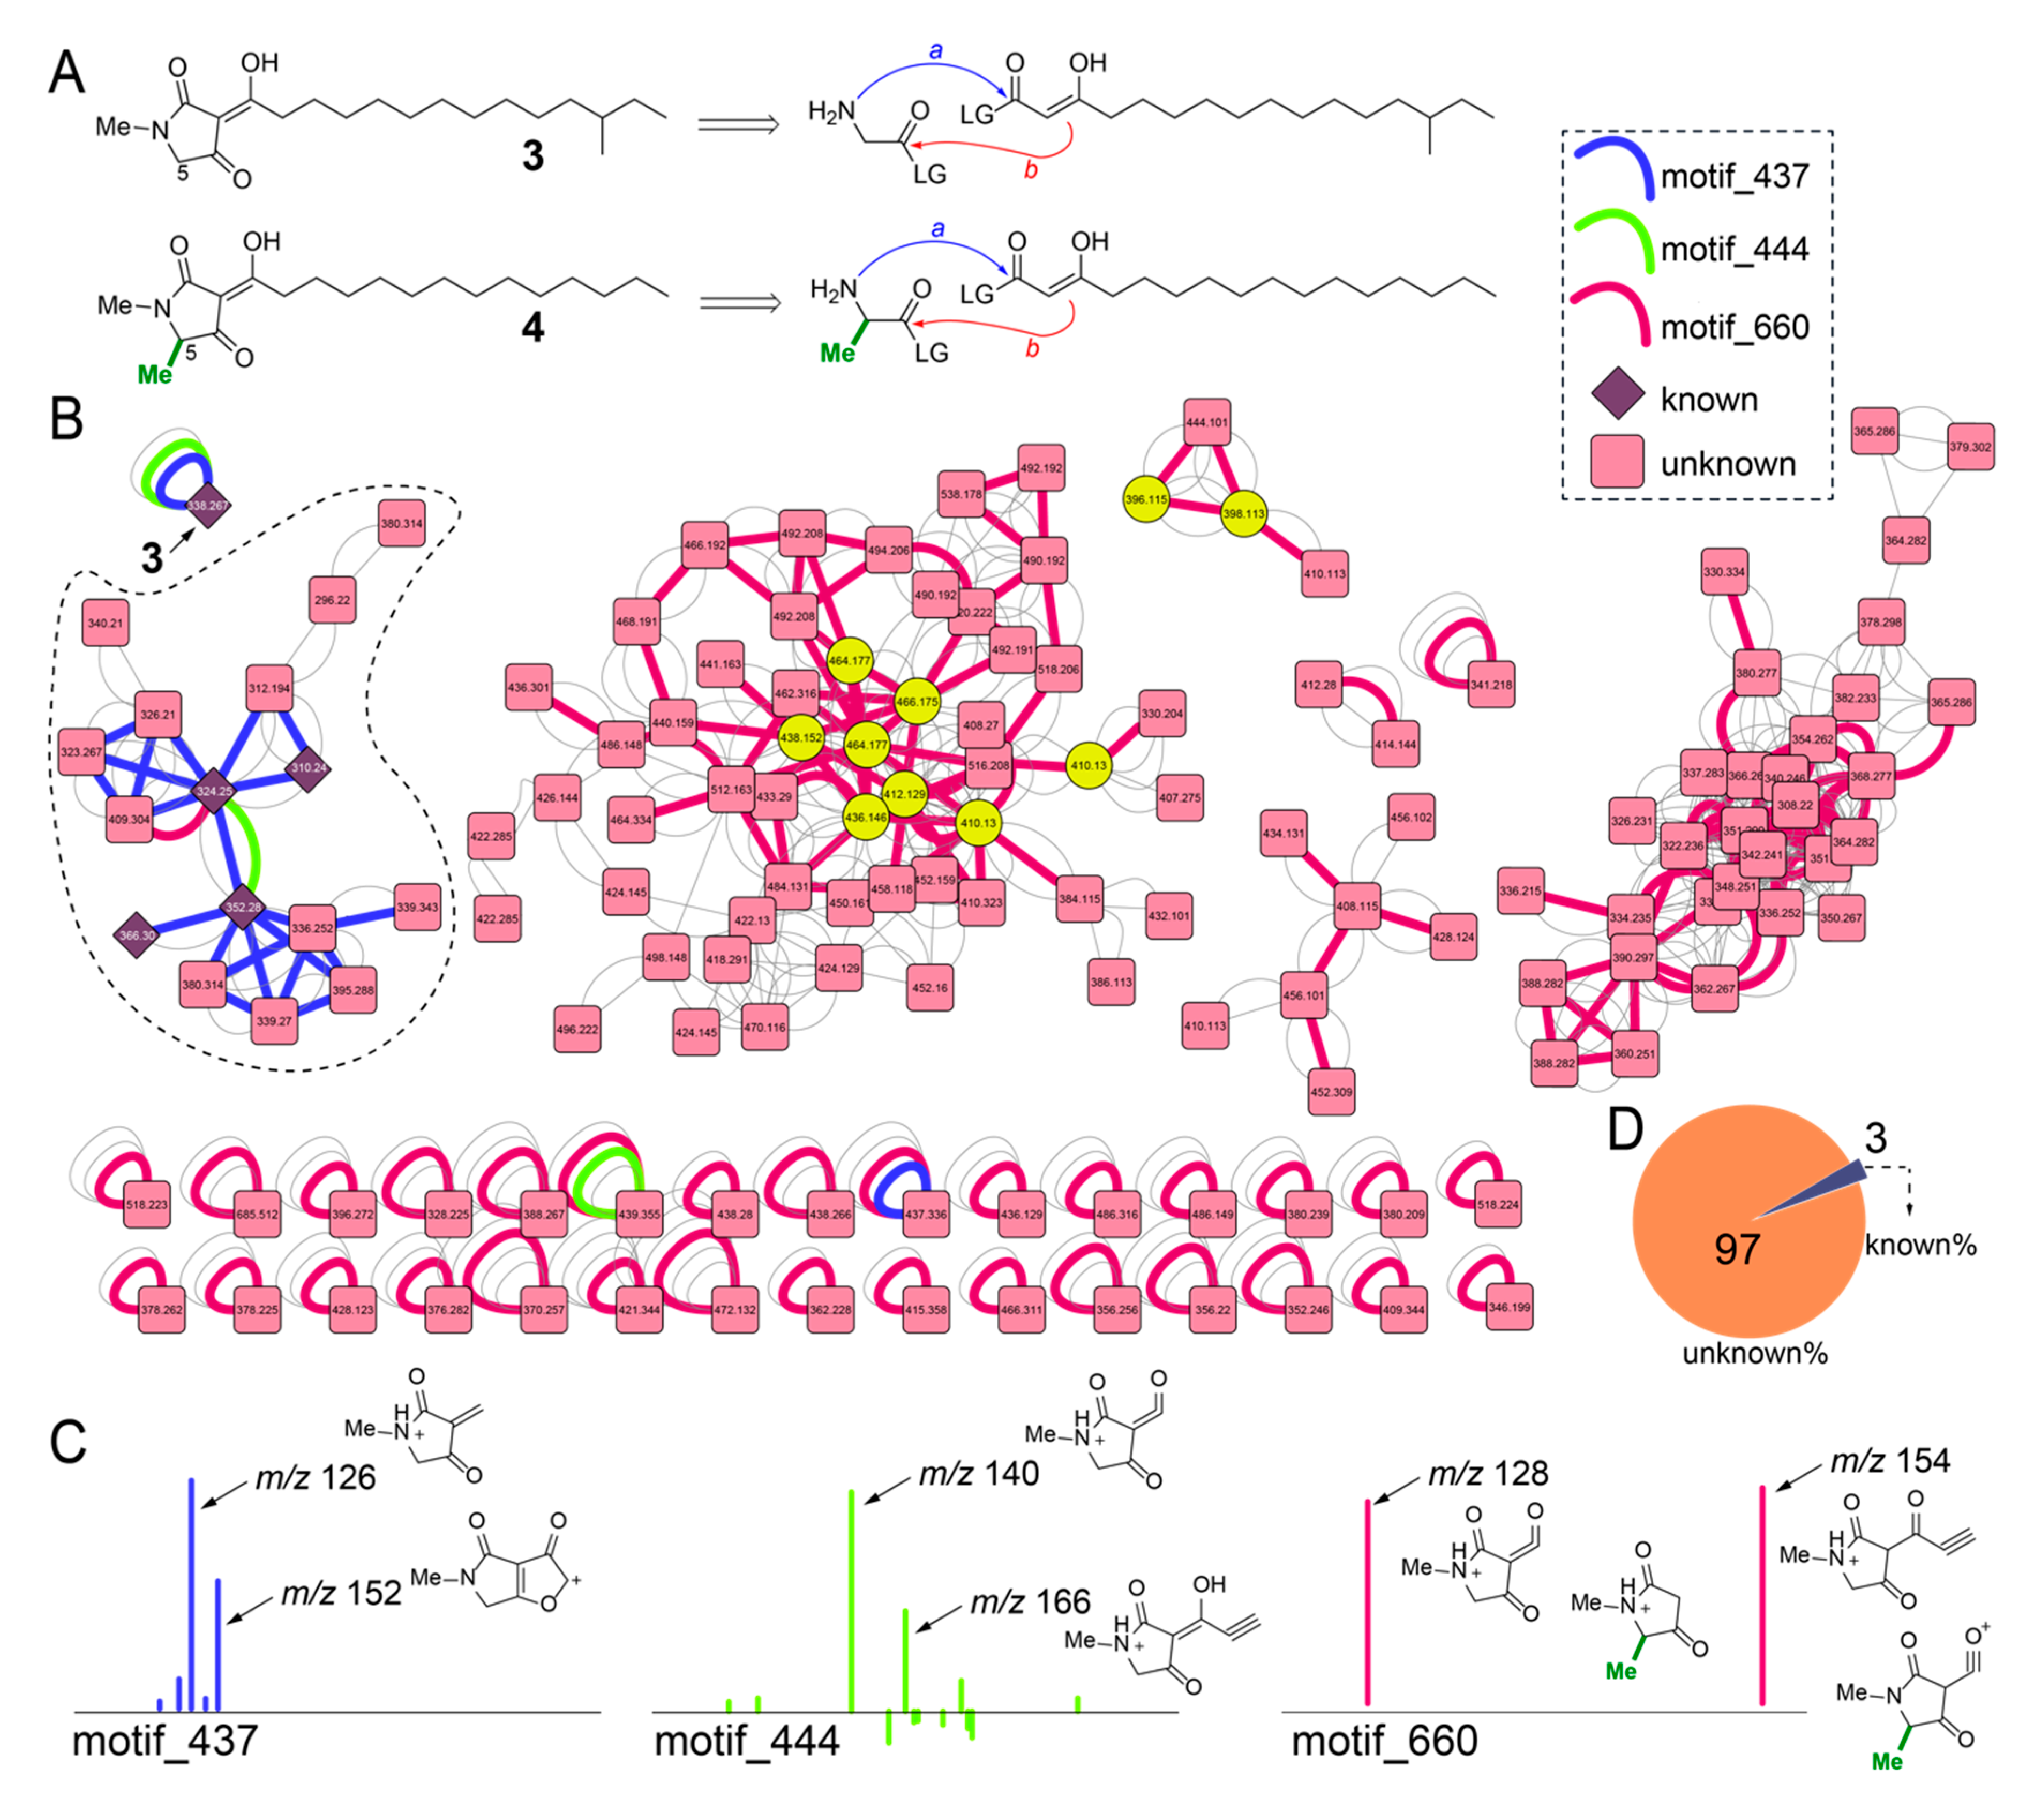
2.6. Diversity of Melophlin Natural Products
2.7. Microbiome and Metabolome Comparison of Melophlus Sponges to Neighboring Sponges
3. Discussion
4. Materials and Methods
4.1. DNA Extraction from Sponge Tissues
4.2. Molecular Determination of Sponge Phylogeny
4.3. 16S rRNA Gene Amplification, Sequencing, and Data Analysis
4.4. Sponge Chemical Extraction and Mass Spectrometry Data Acquisition
4.5. Molecular Networking
4.6. Isolation and Structural Characterization of 1 and 3
4.7. Quantification of Relative Abundances of Sarasinosides and Melophlins
4.8. Metagenomic Sequencing, Assembly, and Mining
5. Database Deposition Information
Supplementary Materials
Author Contributions
Funding
Acknowledgments
Conflicts of Interest
References
- De Goeij, J.M.; van Oevelen, D.; Vermeij, M.J.A.; Osinga, R.; Middelburg, J.J.; de Goeij, A.F.P.M.; Admiraal, W. Surviving in a Marine Desert: The Sponge Loop Retains Resources Within Coral Reefs. Science 2013, 342, 108–110. [Google Scholar] [CrossRef] [PubMed]
- Maldonado, M.; Ribes, M.; van Duyl, F.C. Chapter three—Nutrient Fluxes Through Sponges: Biology, Budgets, and Ecological Implications. In Advances in Marine Biology; Becerro, M.A., Uriz, M.J., Maldonado, M., Turon, X., Eds.; Academic Press: Cambridge, MA, USA, 2012; Volume 62, pp. 113–182. [Google Scholar]
- Gloeckner, V.; Wehrl, M.; Moitinho-Silva, L.; Gernert, C.; Schupp, P.; Pawlik, J.R.; Lindquist, N.L.; Erpenbeck, D.; Wörheide, G.; Hentschel, U. The HMA-LMA Dichotomy Revisited: An Electron Microscopical Survey of 56 Sponge Species. Biol. Bull. 2014, 227, 78–88. [Google Scholar] [CrossRef] [PubMed] [Green Version]
- Webster, N.S.; Taylor, M.W. Marine sponges and their microbial symbionts: Love and other relationships. Environ. Microbiol. 2012, 14, 335–346. [Google Scholar] [CrossRef] [PubMed]
- Nguyen, M.T.H.D.; Thomas, T. Diversity, host-specificity and stability of sponge-associated fungal communities of co-occurring sponges. PeerJ 2018, 6, e4965. [Google Scholar] [CrossRef] [Green Version]
- Gerwick, W.H.; Moore, B.S. Lessons from the past and charting the future of marine natural products drug discovery and chemical biology. Chem. Biol. 2012, 19, 85–98. [Google Scholar] [CrossRef] [Green Version]
- Molinski, T.F.; Dalisay, D.S.; Lievens, S.L.; Saludes, J.P. Drug development from marine natural products. Nat. Rev. Drug Discov. 2009, 8, 69–85. [Google Scholar] [CrossRef]
- Loh, T.-L.; Pawlik, J.R. Chemical defenses and resource trade-offs structure sponge communities on Caribbean coral reefs. Proc. Natl. Acad. Sci. USA 2014, 111, 4151–4156. [Google Scholar] [CrossRef] [Green Version]
- Morita, M.; Schmidt, E.W. Parallel lives of symbionts and hosts: Chemical mutualism in marine animals. Nat. Prod. Rep. 2018, 35, 357–378. [Google Scholar] [CrossRef]
- MarinLit. Available online: http://pubs.rsc.org/marinlit/searchresult/compounds?AFreeText=porifera&FullText=True&Page=bib (accessed on 14 January 2020).
- Paul, V.J.; Freeman, C.J.; Agarwal, V. Chemical Ecology of Marine Sponges: New Opportunities through “-Omics”. Integr. Comp. Biol. 2019, 59, 765–776. [Google Scholar] [CrossRef]
- Nichols, S.A. An evaluation of support for order-level monophyly and interrelationships within the class Demospongiae using partial data from the large subunit rDNA and cytochrome oxidase subunit I. Mol. Phylogenet. Evol. 2005, 34, 81–96. [Google Scholar] [CrossRef]
- Cárdenas, P.; Xavier, J.R.; Reveillaud, J.; Schander, C.; Rapp, H.T. Molecular Phylogeny of the Astrophorida (Porifera, Demospongiaep) Reveals an Unexpected High Level of Spicule Homoplasy. PLoS ONE 2011, 6, e18318. [Google Scholar] [CrossRef] [PubMed] [Green Version]
- Schmitz, F.J.; Ksebati, M.B.; Gunasekera, S.P.; Agarwal, S. Sarasinoside A1: A saponin containing amino sugars isolated from a sponge. J. Org. Chem. 1988, 53, 5941–5947. [Google Scholar] [CrossRef]
- Espada, A.; Jiménez, C.; Rodríguez, J.; Crews, P.; Riguera, R. Sarasinosides D-G: Four new triterpenoid saponins from the sponge asteropus sarasinosum. Tetrahedron 1992, 48, 8685–8696. [Google Scholar] [CrossRef]
- Dai, H.-F.; Edrada, R.A.; Ebel, R.; Nimtz, M.; Wray, V.; Proksch, P. Norlanostane Triterpenoidal Saponins from the Marine Sponge Melophlus sarassinorum. J. Nat. Prod. 2005, 68, 1231–1237. [Google Scholar] [CrossRef]
- Lee, H.-S.; Seo, Y.; Cho, K.W.; Rho, J.-R.; Shin, J.; Paul, V.J. New Triterpenoid Saponins from the Sponge Melophlus isis. J. Nat. Prod. 2000, 63, 915–919. [Google Scholar] [CrossRef]
- Aoki, S.; Higuchi, K.; Ye, Y.; Satari, R.; Kobayashi, M. Melophlins A and B, Novel Tetramic Acids Reversing the Phenotype of ras-Transformed Cells, from the Marine Sponge Melophlus sarassinorum. Tetrahedron 2000, 56, 1833–1836. [Google Scholar] [CrossRef]
- Xu, J.; Hasegawa, M.; Harada, K.-I.; Kobayashi, H.; Nagai, H.; Namikoshi, M. Melophlins p, q, R, and s: Four New Tetramic Acid Derivatives, from Two Palauan Marine Sponges of the Genus Melophlus. Chem. Pharm. Bull. 2006, 54, 852–854. [Google Scholar] [CrossRef] [Green Version]
- Wang, C.-Y.; Wang, B.-G.; Wiryowidagdo, S.; Wray, V.; van Soest, R.; Steube, K.G.; Guan, H.-S.; Proksch, P.; Ebel, R. Melophlins C−O, Thirteen Novel Tetramic Acids from the Marine Sponge Melophlus sarassinorum. J. Nat. Prod. 2003, 66, 51–56. [Google Scholar] [CrossRef]
- Wang, M.X.; Carver, J.J.; Phelan, V.V.; Sanchez, L.M.; Garg, N.; Peng, Y.; Nguyen, D.D.; Watrous, J.; Kapono, C.A.; Luzzatto-Knaan, T.; et al. Sharing and community curation of mass spectrometry data with Global Natural Products Social Molecular Networking. Nat. Biotechnol. 2016, 34, 828–837. [Google Scholar] [CrossRef] [Green Version]
- Pluskal, T.; Castillo, S.; Villar-Briones, A.; Orešič, M. MZmine 2: Modular framework for processing, visualizing, and analyzing mass spectrometry-based molecular profile data. BMC Bioinform. 2010, 11, 395. [Google Scholar] [CrossRef] [Green Version]
- Van der Hooft, J.J.J.; Wandy, J.; Barrett, M.P.; Burgess, K.E.V.; Rogers, S. Topic modeling for untargeted substructure exploration in metabolomics. Proc. Natl. Acad. Sci. USA 2016, 113, 13738–13743. [Google Scholar] [CrossRef] [PubMed] [Green Version]
- Nothias, L.F.; Petras, D.; Schmid, R.; Dührkop, K.; Rainer, J.; Sarvepalli, A.; Protsyuk, I.; Ernst, M.; Tsugawa, H.; Fleischauer, M.; et al. Feature-based Molecular Networking in the GNPS Analysis Environment. bioRxiv 2019, 812404. [Google Scholar] [CrossRef] [Green Version]
- Wei, J.H.; Yin, X.; Welander, P.V. Sterol Synthesis in Diverse Bacteria. Front. Microbiol. 2016, 7, 990. [Google Scholar] [CrossRef] [PubMed] [Green Version]
- Haubrich, A.B. Microbial Sterolomics as a Chemical Biology Tool. Molecules 2018, 23, 2768. [Google Scholar] [CrossRef] [PubMed] [Green Version]
- Li, X.-C.; Jacob, M.R.; Ding, Y.; Agarwal, A.K.; Smillie, T.J.; Khan, S.I.; Nagle, D.G.; Ferreira, D.; Clark, A.M. Capisterones A and B, which Enhance Fluconazole Activity in Saccharomyces cerevisiae, from the Marine Green Alga Penicillus capitatus. J. Nat. Prod. 2006, 69, 542–546. [Google Scholar] [CrossRef] [PubMed] [Green Version]
- Ebada, S.S.; Lin, W.; Proksch, P. Bioactive Sesterterpenes and Triterpenes from Marine Sponges: Occurrence and Pharmacological Significance. Mar. Drugs 2010, 8, 313–346. [Google Scholar] [CrossRef] [Green Version]
- Agarwal, V.; Blanton, J.M.; Podell, S.; Taton, A.; Schorn, M.A.; Busch, J.; Lin, Z.; Schmidt, E.W.; Jensen, P.R.; Paul, V.J.; et al. Metagenomic discovery of polybrominated diphenyl ether biosynthesis by marine sponges. Nat. Chem. Biol. 2017, 13, 537–543. [Google Scholar] [CrossRef] [Green Version]
- Podell, S.; Blanton, J.M.; Neu, A.; Agarwal, V.; Biggs, J.S.; Moore, B.S.; Allen, E.E. Pangenomic comparison of globally distributed Poribacteria associated with sponge hosts and marine particles. ISME J. 2019, 13, 468–481. [Google Scholar] [CrossRef] [Green Version]
- Seemann, T. Prokka: Rapid prokaryotic genome annotation. Bioinformatics 2014, 30, 2068–2069. [Google Scholar] [CrossRef]
- El-Gebali, S.; Mistry, J.; Bateman, A.; Eddy, S.R.; Luciani, A.; Potter, S.C.; Qureshi, M.; Richardson, L.J.; Salazar, G.A.; Smart, A.; et al. The Pfam protein families database in 2019. Nucleic Acids Res. 2018, 47, D427–D432. [Google Scholar] [CrossRef]
- Lombard, V.; Golaconda Ramulu, H.; Drula, E.; Coutinho, P.M.; Henrissat, B. The carbohydrate-active enzymes database (CAZy) in 2013. Nucleic Acids Res. 2013, 42, D490–D495. [Google Scholar] [CrossRef] [PubMed] [Green Version]
- Parks, D.H.; Imelfort, M.; Skennerton, C.T.; Hugenholtz, P.; Tyson, G.W. CheckM: Assessing the quality of microbial genomes recovered from isolates, single cells, and metagenomes. Genome Res. 2015, 25, 1043–1055. [Google Scholar] [CrossRef] [PubMed] [Green Version]
- Lee, A.K.; Banta, A.B.; Wei, J.H.; Kiemle, D.J.; Feng, J.; Giner, J.-L.; Welander, P.V. C-4 sterol demethylation enzymes distinguish bacterial and eukaryotic sterol synthesis. Proc. Natl. Acad. Sci. USA 2018, 115, 5884–5889. [Google Scholar] [CrossRef] [PubMed] [Green Version]
- Takanashi, E.; Takada, K.; Hashimoto, M.; Itoh, Y.; Ise, Y.; Ohtsuka, S.; Okada, S.; Matsunaga, S. Cytotoxic linear acetylenes from a marine sponge Pleroma sp. Tetrahedron 2015, 71, 9564–9570. [Google Scholar] [CrossRef]
- Zhou, Z.-F.; Menna, M.; Cai, Y.-S.; Guo, Y.-W. Polyacetylenes of Marine Origin: Chemistry and Bioactivity. Chem. Rev. 2015, 115, 1543–1596. [Google Scholar] [CrossRef]
- Wu, Q.; Wu, Z.; Qu, X.; Liu, W. Insights into Pyrroindomycin Biosynthesis Reveal a Uniform Paradigm for Tetramate/Tetronate Formation. J. Am. Chem. Soc. 2012, 134, 17342–17345. [Google Scholar] [CrossRef]
- Gui, C.; Li, Q.; Mo, X.; Qin, X.; Ma, J.; Ju, J. Discovery of a New Family of Dieckmann Cyclases Essential to Tetramic Acid and Pyridone-Based Natural Products Biosynthesis. Org. Lett. 2015, 17, 628–631. [Google Scholar] [CrossRef]
- Kakule, T.B.; Zhang, S.; Zhan, J.; Schmidt, E.W. Biosynthesis of the Tetramic Acids Sch210971 and Sch210972. Org. Lett. 2015, 17, 2295–2297. [Google Scholar] [CrossRef]
- Bihlmaier, C.; Welle, E.; Hofmann, C.; Welzel, K.; Vente, A.; Breitling, E.; Müller, M.; Glaser, S.; Bechthold, A. Biosynthetic Gene Cluster for the Polyenoyltetramic Acid α-Lipomycin. Antimicrob. Agents Chemother. 2006, 50, 2113–2121. [Google Scholar] [CrossRef] [Green Version]
- Calcul, L.; Inman, W.D.; Morris, A.A.; Tenney, K.; Ratnam, J.; McKerrow, J.H.; Valeriote, F.A.; Crews, P. Additional insights on the bastadins: Isolation of analogues from the sponge Ianthella cf. reticulata and exploration of the oxime configurations. J. Nat. Prod. 2010, 73, 365–372. [Google Scholar] [CrossRef] [Green Version]
- Peng, J.; Li, J.; Hamann, M.T. The marine bromotyrosine derivatives. Alkaloids Chem. Biol. 2005, 61, 59–262. [Google Scholar]
- Pereira, T.J.; Baldwin, J.G. Contrasting evolutionary patterns of 28S and ITS rRNA genes reveal high intragenomic variation in Cephalenchus (Nematoda): Implications for species delimitation. Mol. Phylogenet. Evol. 2016, 98, 244–260. [Google Scholar] [CrossRef]
- Sarma, S.N.; Krishna, S.M.; Rao, R.S. Sterol Ring System Oxidation Pattern in Marine Sponges. Mar. Drugs 2005, 3, 84–111. [Google Scholar] [CrossRef] [Green Version]
- Ferrer, A.; Altabella, T.; Arró, M.; Boronat, A. Emerging roles for conjugated sterols in plants. Prog. Lipid Res. 2017, 67, 27–37. [Google Scholar] [CrossRef]
- Stonik, A.V.; Stonik, V.I. Sterol and Sphingoid Glycoconjugates from Microalgae. Mar. Drugs 2018, 16, 514. [Google Scholar] [CrossRef] [Green Version]
- Agarwal, V.; Li, J.; Rahman, I.; Borgen, M.; Aluwihare, L.I.; Biggs, J.S.; Paul, V.J.; Moore, B.S. Complexity of naturally produced polybrominated diphenyl ethers revealed via mass spectrometry. Environ. Sci. Technol. 2015, 49, 1339–1346. [Google Scholar] [CrossRef] [Green Version]
- Cantrell, T.P.; Freeman, C.J.; Paul, V.J.; Agarwal, V.; Garg, N. Mass Spectrometry-Based Integration and Expansion of the Chemical Diversity Harbored Within a Marine Sponge. J. Am. Soc. Mass Spectrom. 2019, 30, 1373–1384. [Google Scholar] [CrossRef]
- Moitinho-Silva, L.; Steinert, G.; Nielsen, S.; Hardoim, C.C.P.; Wu, Y.-C.; McCormack, G.P.; López-Legentil, S.; Marchant, R.; Webster, N.; Thomas, T.; et al. Predicting the HMA-LMA Status in Marine Sponges by Machine Learning. Front. Microbiol. 2017, 8, 752. [Google Scholar] [CrossRef] [Green Version]
- Thacker, R.W.; Starnes, S. Host specificity of the symbiotic cyanobacterium Oscillatoria spongeliae in marine sponges, Dysidea spp. Mar. Biol. 2003, 142, 643–648. [Google Scholar] [CrossRef]
- Pratte, Z.A.; Longo, G.O.; Burns, A.S.; Hay, M.E.; Stewart, F.J. Contact with turf algae alters the coral microbiome: Contact versus systemic impacts. Coral Reefs 2018, 37, 1–13. [Google Scholar] [CrossRef]
- Kozich, J.J.; Westcott, S.L.; Baxter, N.T.; Highlander, S.K.; Schloss, P.D. Development of a Dual-Index Sequencing Strategy and Curation Pipeline for Analyzing Amplicon Sequence Data on the MiSeq Illumina Sequencing Platform. Appl. Environ. Microbiol. 2013, 79, 5112–5120. [Google Scholar] [CrossRef] [PubMed] [Green Version]
- Bolyen, E.; Rideout, J.R.; Dillon, M.R.; Bokulich, N.A.; Abnet, C.C.; Al-Ghalith, G.A.; Alexander, H.; Alm, E.J.; Arumugam, M.; Asnicar, F.; et al. Reproducible, interactive, scalable and extensible microbiome data science using QIIME 2. Nat. Biotechnol. 2019, 37, 852–857. [Google Scholar] [CrossRef] [PubMed]
- Callahan, B.J.; McMurdie, P.J.; Rosen, M.J.; Han, A.W.; Johnson, A.J.A.; Holmes, S.P. DADA2: High-resolution sample inference from Illumina amplicon data. Nat. Methods 2016, 13, 581–583. [Google Scholar] [CrossRef] [PubMed] [Green Version]
- Yilmaz, P.; Parfrey, L.W.; Yarza, P.; Gerken, J.; Pruesse, E.; Quast, C.; Schweer, T.; Peplies, J.; Ludwig, W.; Glockner, F.O. The SILVA and “All-species Living Tree Project (LTP)” taxonomic frameworks. Nucleic Acids Res. 2014, 42, D643–D648. [Google Scholar] [CrossRef] [Green Version]
- Chong, J.; Wishart, D.S.; Xia, J. Using MetaboAnalyst 4.0 for Comprehensive and Integrative Metabolomics Data Analysis. Curr. Protoc. Bioinform. 2019, 68, e86. [Google Scholar] [CrossRef]
- Bolger, A.M.; Lohse, M.; Usadel, B. Trimmomatic: A flexible trimmer for Illumina sequence data. Bioinformatics 2014, 30, 2114–2120. [Google Scholar] [CrossRef] [Green Version]
- Peng, Y.; Leung, H.C.; Yiu, S.M.; Chin, F.Y. IDBA-UD: A de novo assembler for single-cell and metagenomic sequencing data with highly uneven depth. Bioinformatics 2012, 28, 1420–1428. [Google Scholar] [CrossRef] [Green Version]
- Podell, S.; Gaasterland, T. DarkHorse: A method for genome-wide prediction of horizontal gene transfer. Genome Biol. 2007, 8, R16. [Google Scholar] [CrossRef] [Green Version]
- Podell, S.; Ugalde, J.A.; Narasingarao, P.; Banfield, J.F.; Heidelberg, K.B.; Allen, E.E. Assembly-driven community genomics of a hypersaline microbial ecosystem. PLoS ONE 2013, 8, e61692. [Google Scholar] [CrossRef] [Green Version]
- Langmead, B.; Salzberg, S.L. Fast gapped-read alignment with Bowtie 2. Nat. Methods 2012, 9, 357–359. [Google Scholar] [CrossRef] [Green Version]
- Li, H.; Handsaker, B.; Wysoker, A.; Fennell, T.; Ruan, J.; Homer, N.; Marth, G.; Abecasis, G.; Durbin, R. The Sequence Alignment/Map format and SAMtools. Bioinformatics 2009, 25, 2078–2079. [Google Scholar] [CrossRef] [PubMed] [Green Version]
- Myers, E.W.; Sutton, G.G.; Delcher, A.L.; Dew, I.M.; Fasulo, D.P.; Flanigan, M.J.; Kravitz, S.A.; Mobarry, C.M.; Reinert, K.H.J.; Remington, K.A.; et al. A Whole-Genome Assembly of Drosophila. Science 2000, 287, 2196–2204. [Google Scholar] [CrossRef] [PubMed]


© 2020 by the authors. Licensee MDPI, Basel, Switzerland. This article is an open access article distributed under the terms and conditions of the Creative Commons Attribution (CC BY) license (http://creativecommons.org/licenses/by/4.0/).
Share and Cite
Mohanty, I.; Podell, S.; Biggs, J.S.; Garg, N.; Allen, E.E.; Agarwal, V. Multi-Omic Profiling of Melophlus Sponges Reveals Diverse Metabolomic and Microbiome Architectures that Are Non-overlapping with Ecological Neighbors. Mar. Drugs 2020, 18, 124. https://doi.org/10.3390/md18020124
Mohanty I, Podell S, Biggs JS, Garg N, Allen EE, Agarwal V. Multi-Omic Profiling of Melophlus Sponges Reveals Diverse Metabolomic and Microbiome Architectures that Are Non-overlapping with Ecological Neighbors. Marine Drugs. 2020; 18(2):124. https://doi.org/10.3390/md18020124
Chicago/Turabian StyleMohanty, Ipsita, Sheila Podell, Jason S. Biggs, Neha Garg, Eric E. Allen, and Vinayak Agarwal. 2020. "Multi-Omic Profiling of Melophlus Sponges Reveals Diverse Metabolomic and Microbiome Architectures that Are Non-overlapping with Ecological Neighbors" Marine Drugs 18, no. 2: 124. https://doi.org/10.3390/md18020124