Article

Absorption and Transport of Sea Cucumber Saponins from Apostichopus japonicus

Marine Drug and Food Institute, School of Medicine and Pharmacy, Ocean University of China, Qingdao 266003, China
*
Author to whom correspondence should be addressed.
Mar. Drugs 2016, 14(6), 114; https://doi.org/10.3390/md14060114
Submission received: 14 March 2016 / Revised: 27 May 2016 / Accepted: 7 June 2016 / Published: 17 June 2016
(This article belongs to the Collection Bioactive Compounds from Marine Invertebrates)

Abstract

:
The present study is focused on the intestinal absorption of sea cucumber saponins. We determined the pharmacokinetic characteristics and bioavailability of Echinoside A and Holotoxin A1; the findings indicated that the bioavailability of Holotoxin A1 was lower than Echinoside A. We inferred that the differences in chemical structure between compounds was a factor that explained their different characteristics of transport across the intestine. In order to confirm the absorption characteristics of Echinoside A and Holotoxin A1, we examined their transport across Caco-2 cell monolayer and effective permeability by single-pass intestinal perfusion. The results of Caco-2 cell model indicate that Echinoside A is transported by passive diffusion, and not influenced by the exocytosis of P-glycoprotein (P-gp, expressed in the apical side of Caco-2 monolayers as the classic inhibitor). The intestinal perfusion also demonstrated well the absorption of Echinoside A and poor absorption of Holotoxin A1, which matched up with the result of the Caco-2 cell model. The results demonstrated our conjecture and provides fundamental information on the relationship between the chemical structure of these sea cucumber saponins and their absorption characteristics, and we believe that our findings build a foundation for the further metabolism study of sea cucumber saponins and contribute to the further clinical research of saponins.

1. Introduction

Glycosides are an important class of natural products discovered in higher plants and animals [1,2,3]. Sea cucumber saponins are triterpene glycosides isolated from holothuroids (Echinodermata), which consists of a sugar moiety composed of a maximum of six monosaccharides attached to a triterpene based on holostanol [4,5]. With more and more recent papers describing saponins properties, sea cucumber saponins are reported to possess extensive physiological activities [6] including hemolytic, antitumoral, antifungal, anti-bacterial, antiviral, cytostatic, and immunoregulatory activity [7,8,9,10,11,12,13]. However, the pharmacological effect of sea cucumber saponins in vivo as an oral medicine depends on its bioavailability in humans. Our attention is focused on two sea cucumber saponins, Echinoside A and Holotoxin A1, isolated from Apostichopus japonicus which possess wide pharmacological effects, including antifungal, hemolytic, cytotoxic activity, increasing viscidity of cytomembrane, and decreasing lipids in serum [14].
Bioavailability represents the rate and extent of an oral dose reaching the blood circulation. It is controlled by the solubility and dissolution rate of a drug in the intestinal fluid and permeability across the intestinal membrane, pre-systemic metabolism and, sometimes, the efficiency of the drug transporting system [15]. In addition to an animal model, a number of in vitro and in situ experimental models have been developed to figure out the intestinal permeability of a drug and its mechanism, such as the Caco-2 cell model, single-pass intestinal perfusion, and everted gut sac [16,17,18].
Caco-2 cells originate from human colonic carcinoma. They can spontaneously differentiate into apical side and basolateral side (similarly to the villi and the base of the intestine), and form a monolayer under the culture condition in vitro [19,20]. Similarly to the human small intestine, Caco-2 cells express several active transport systemers and marker enzymes [21,22,23]. Single-pass intestinal perfusion is the most frequently used technique, which provides the closest conditions to the in vivo oral administration [24,25].
Previously, several studies about the absorption of plant saponins have been published. Jiang et al. [26] investigated the bioavailability of Soyasaponin, demonstrated that Soyasaponin I and Sapongenol B have limited absorption. Han et al. [27] indicated that transport across Caco-2 cell monolayer for panaxnotoginseng saponin is a simple passive diffusion process and no efflux transporters showed effects on it. Although new sea cucumber saponins with great physiological activity have been discovered successively [28], knowledge on the bioavailability of these compounds is limited.
Our study attempted to characterize the permeability of sea cucumber saponins in the intestine. We investigated the pharmacokinetics of two sea cucumber saponins, and analyzed the relationship between their bioavailability and their chemical structure. Caco-2 monolayer and single-pass intestinal perfusions were used to explore the transport mechanism of sea cucumber saponins.

2. Results

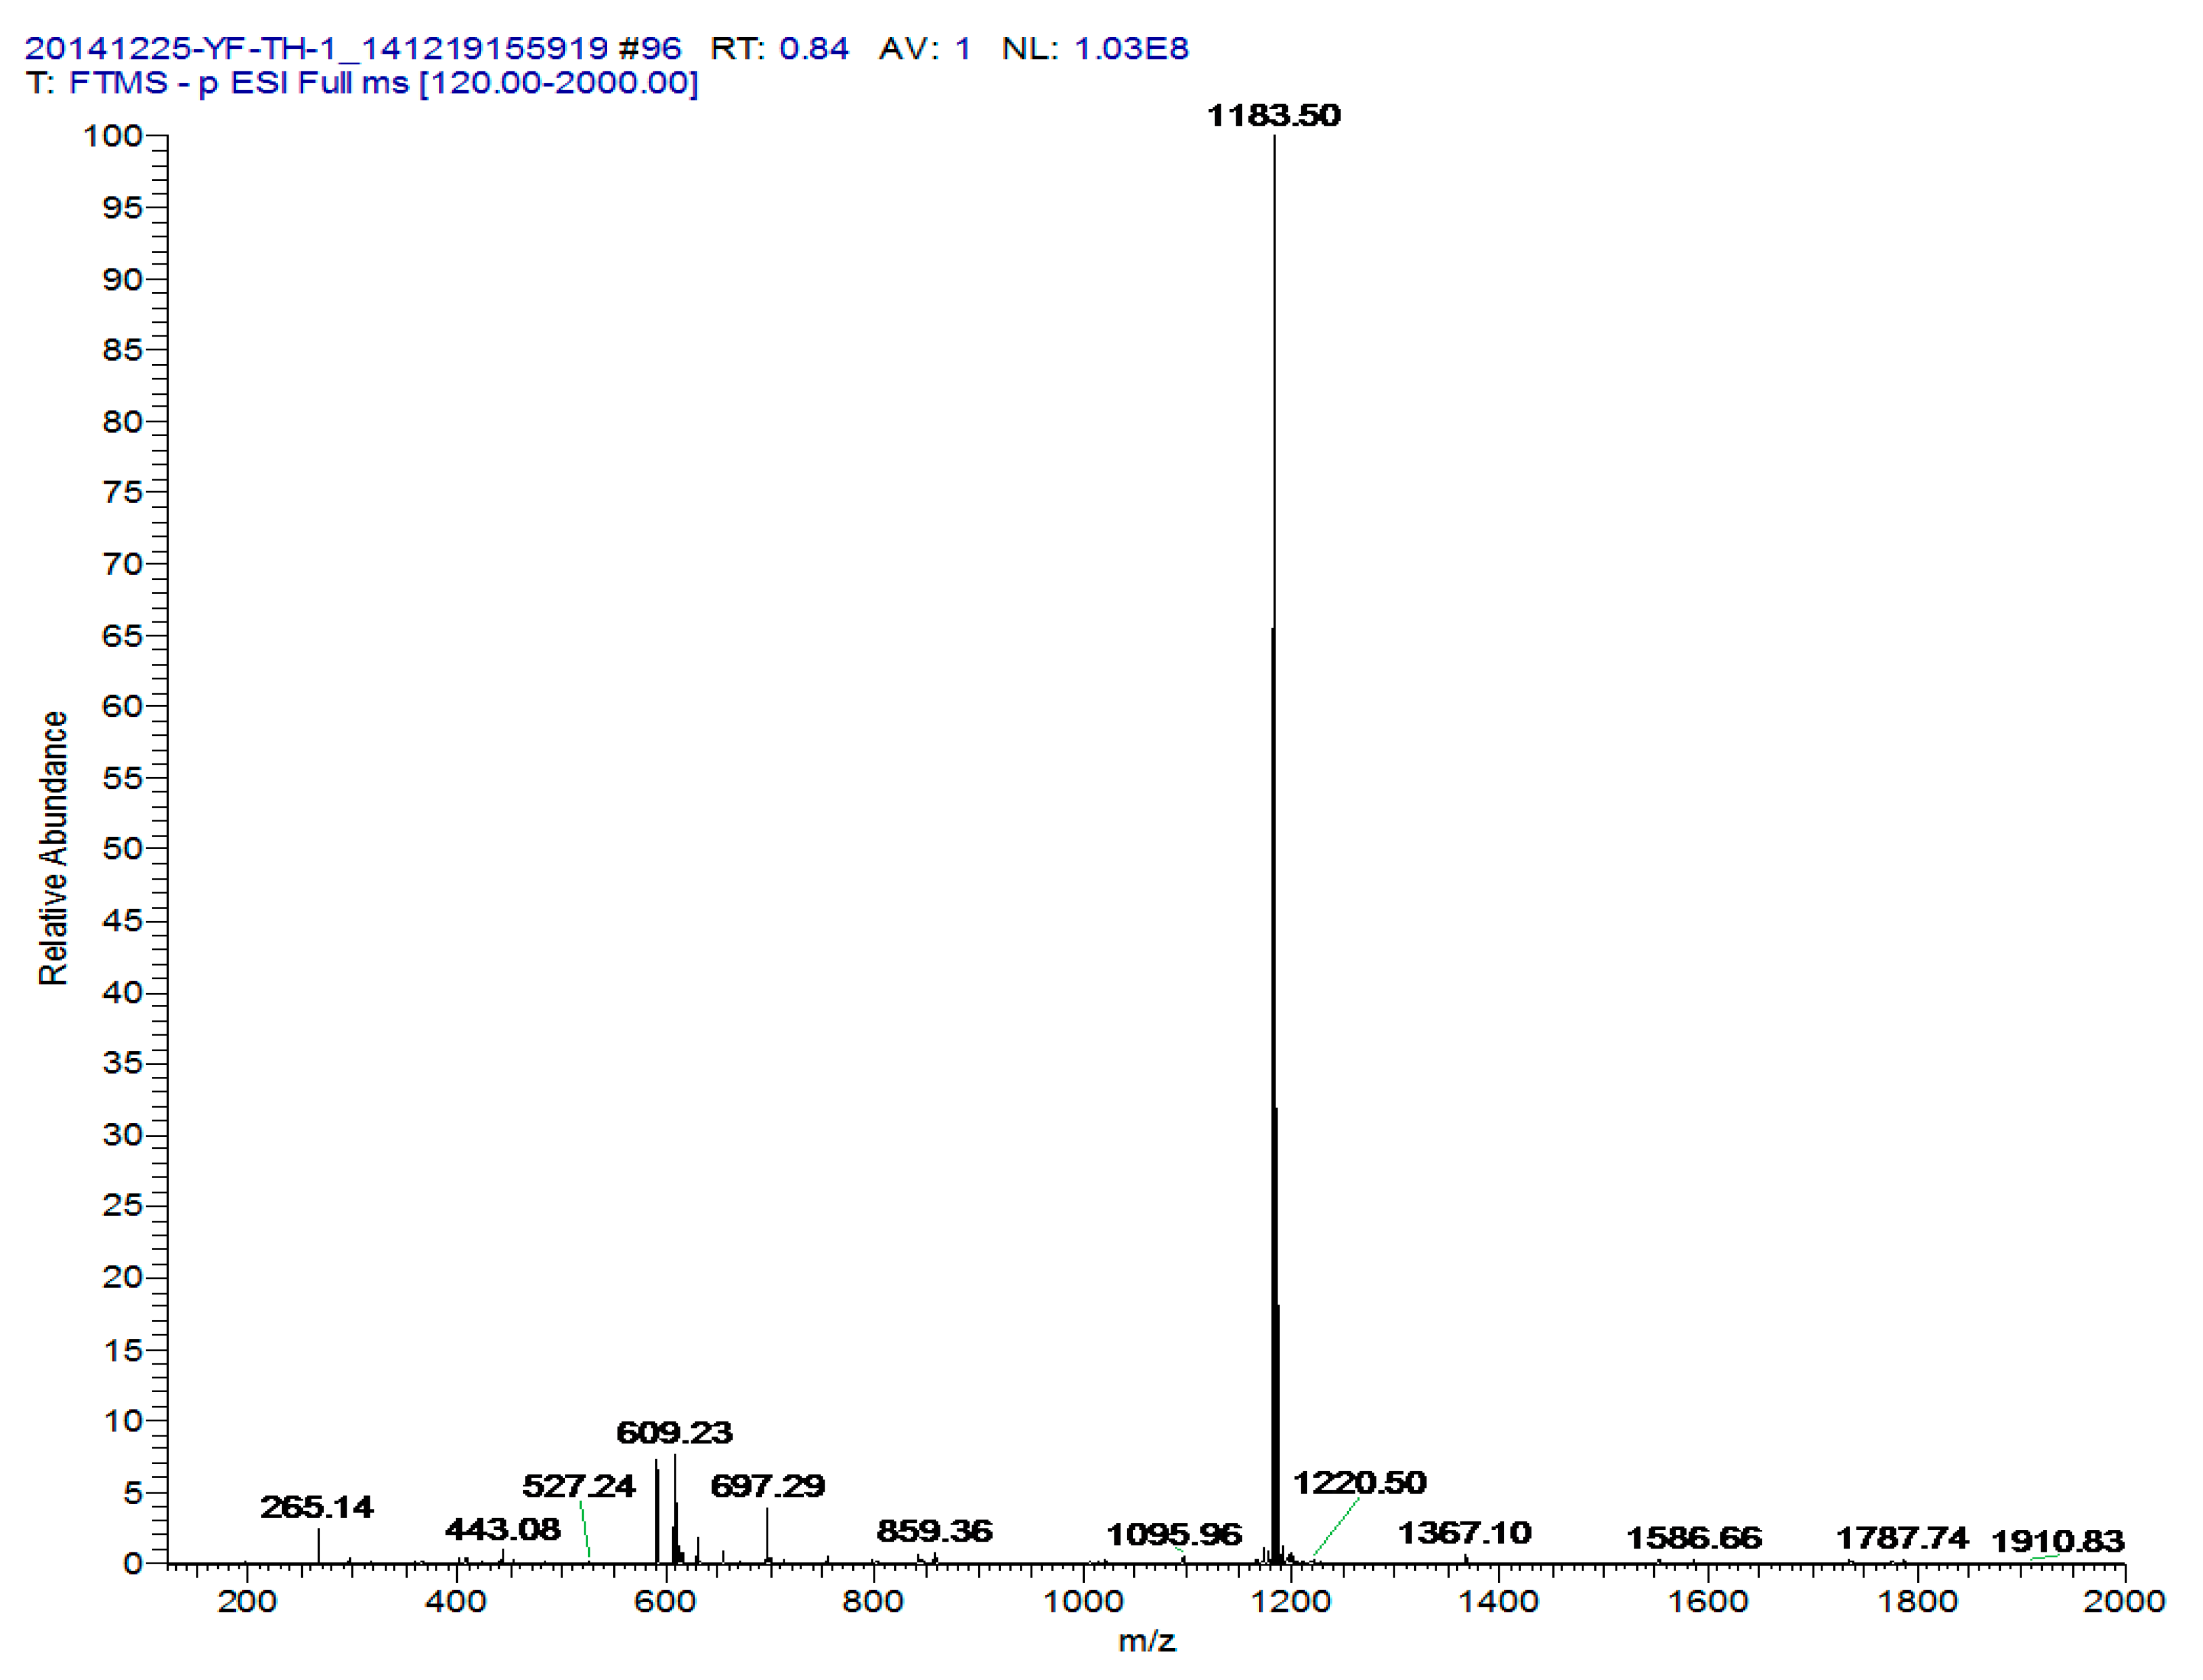
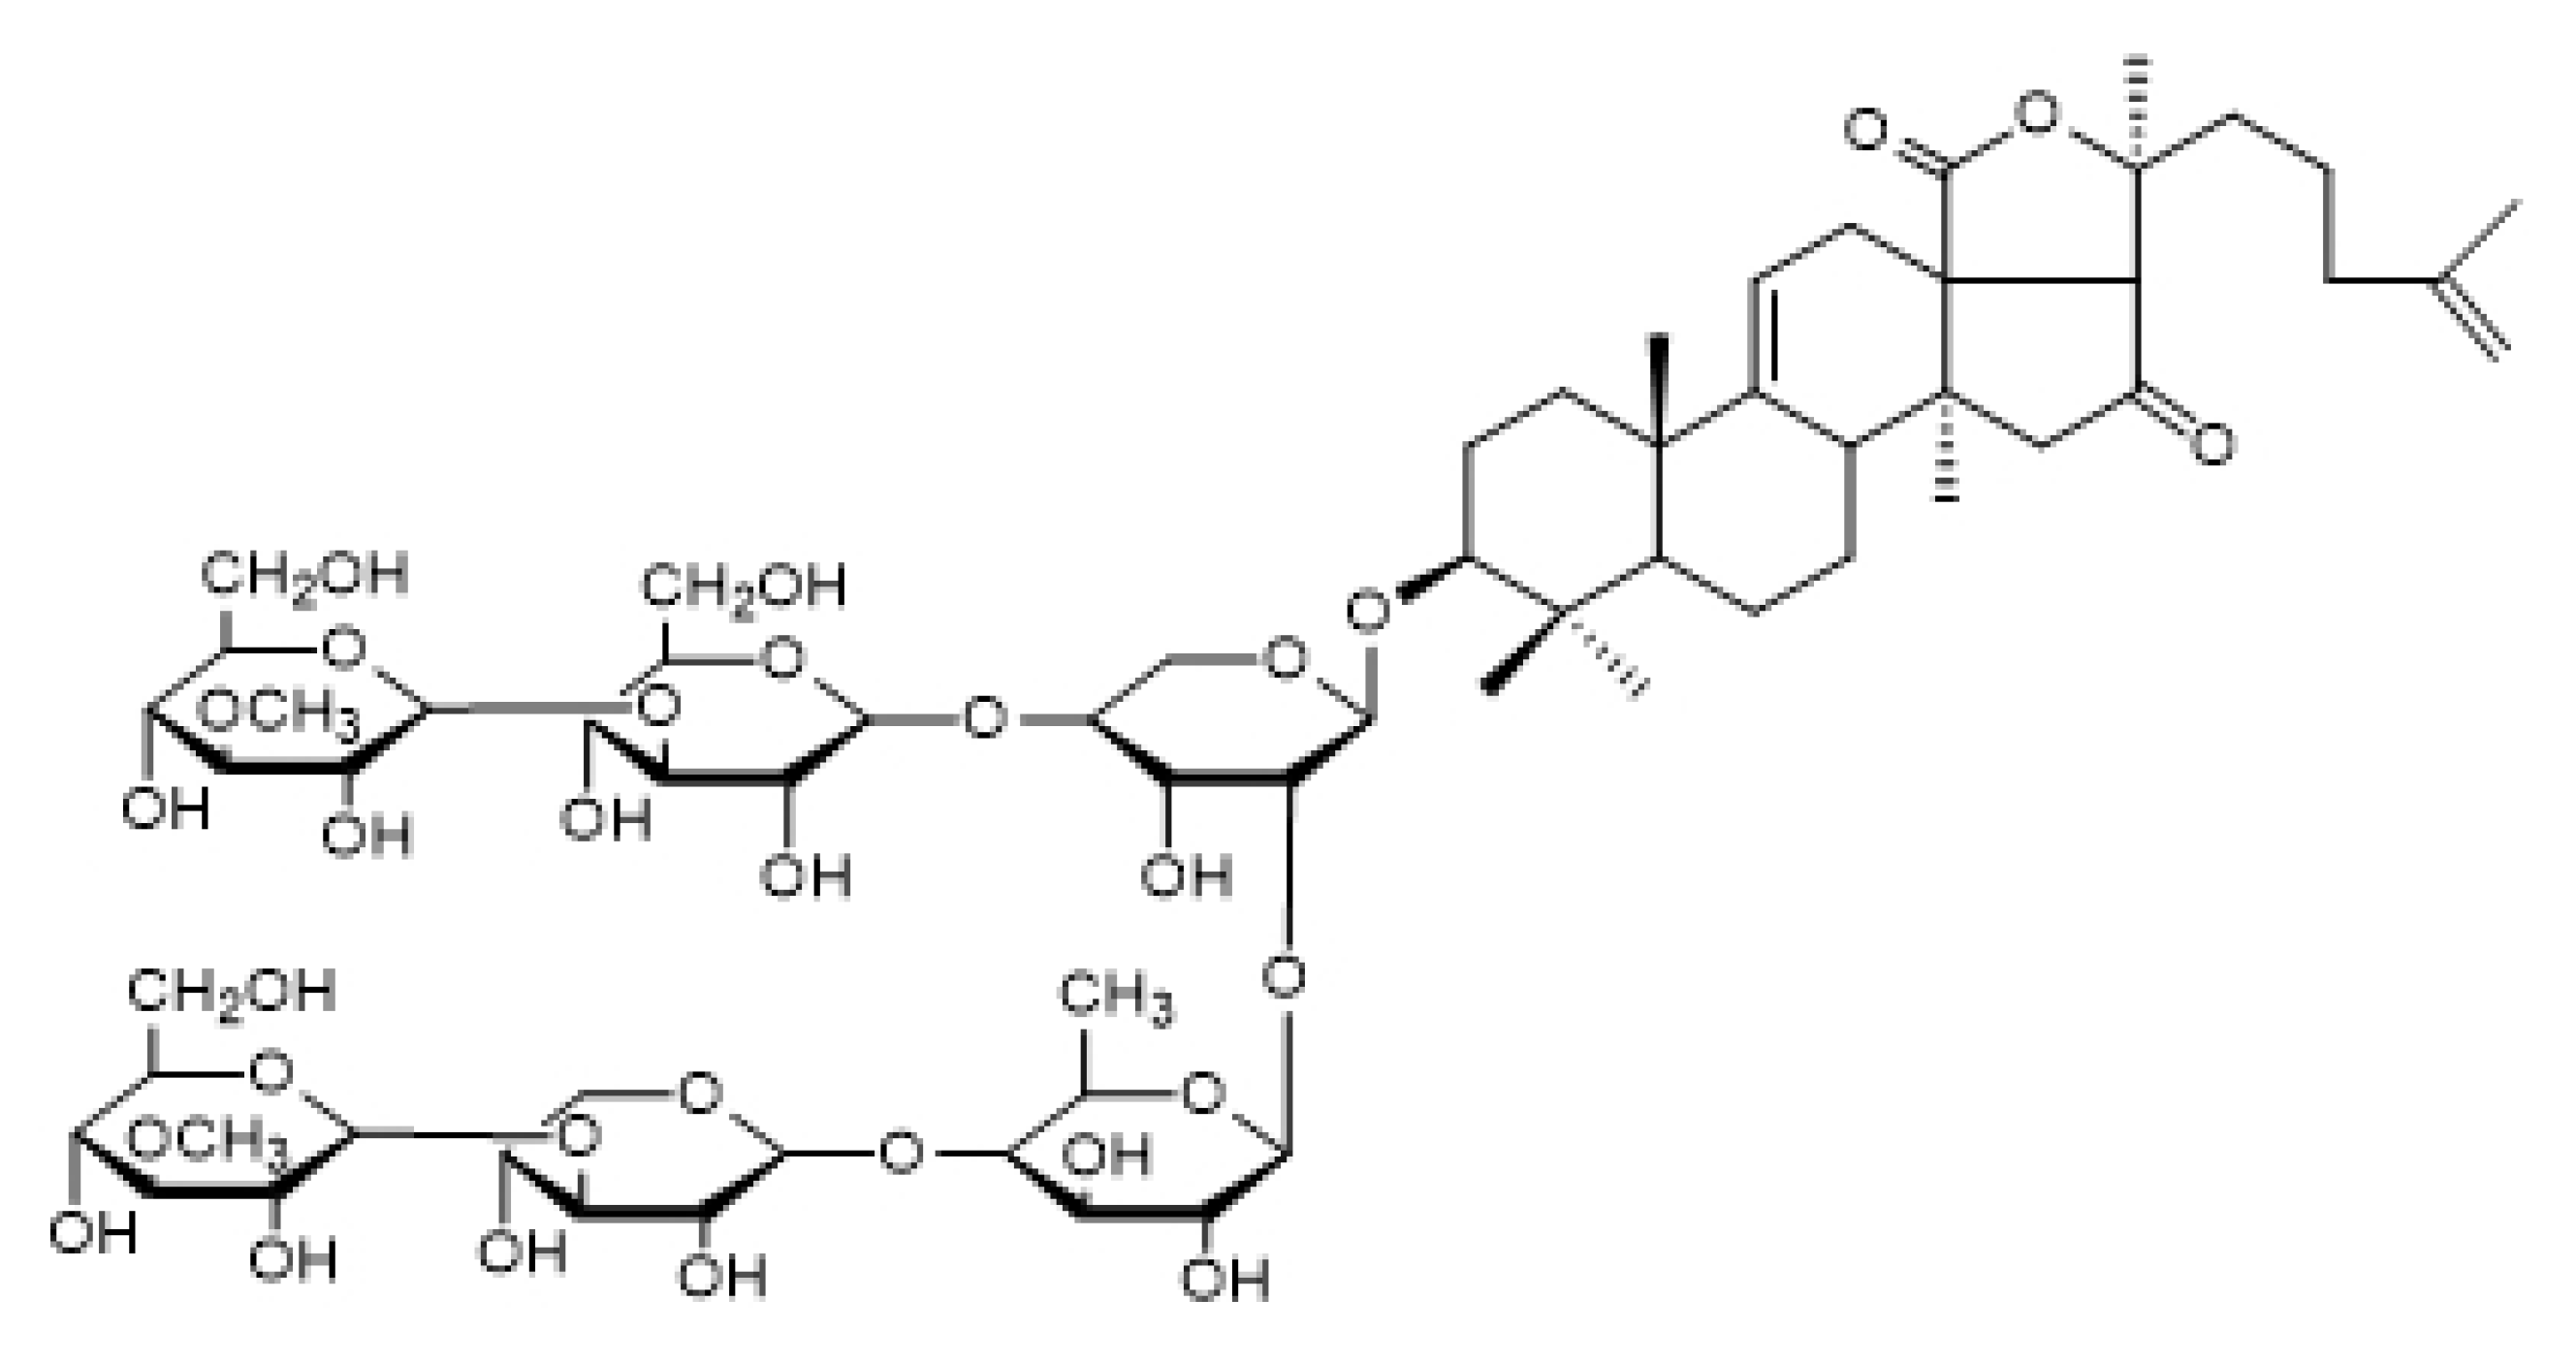
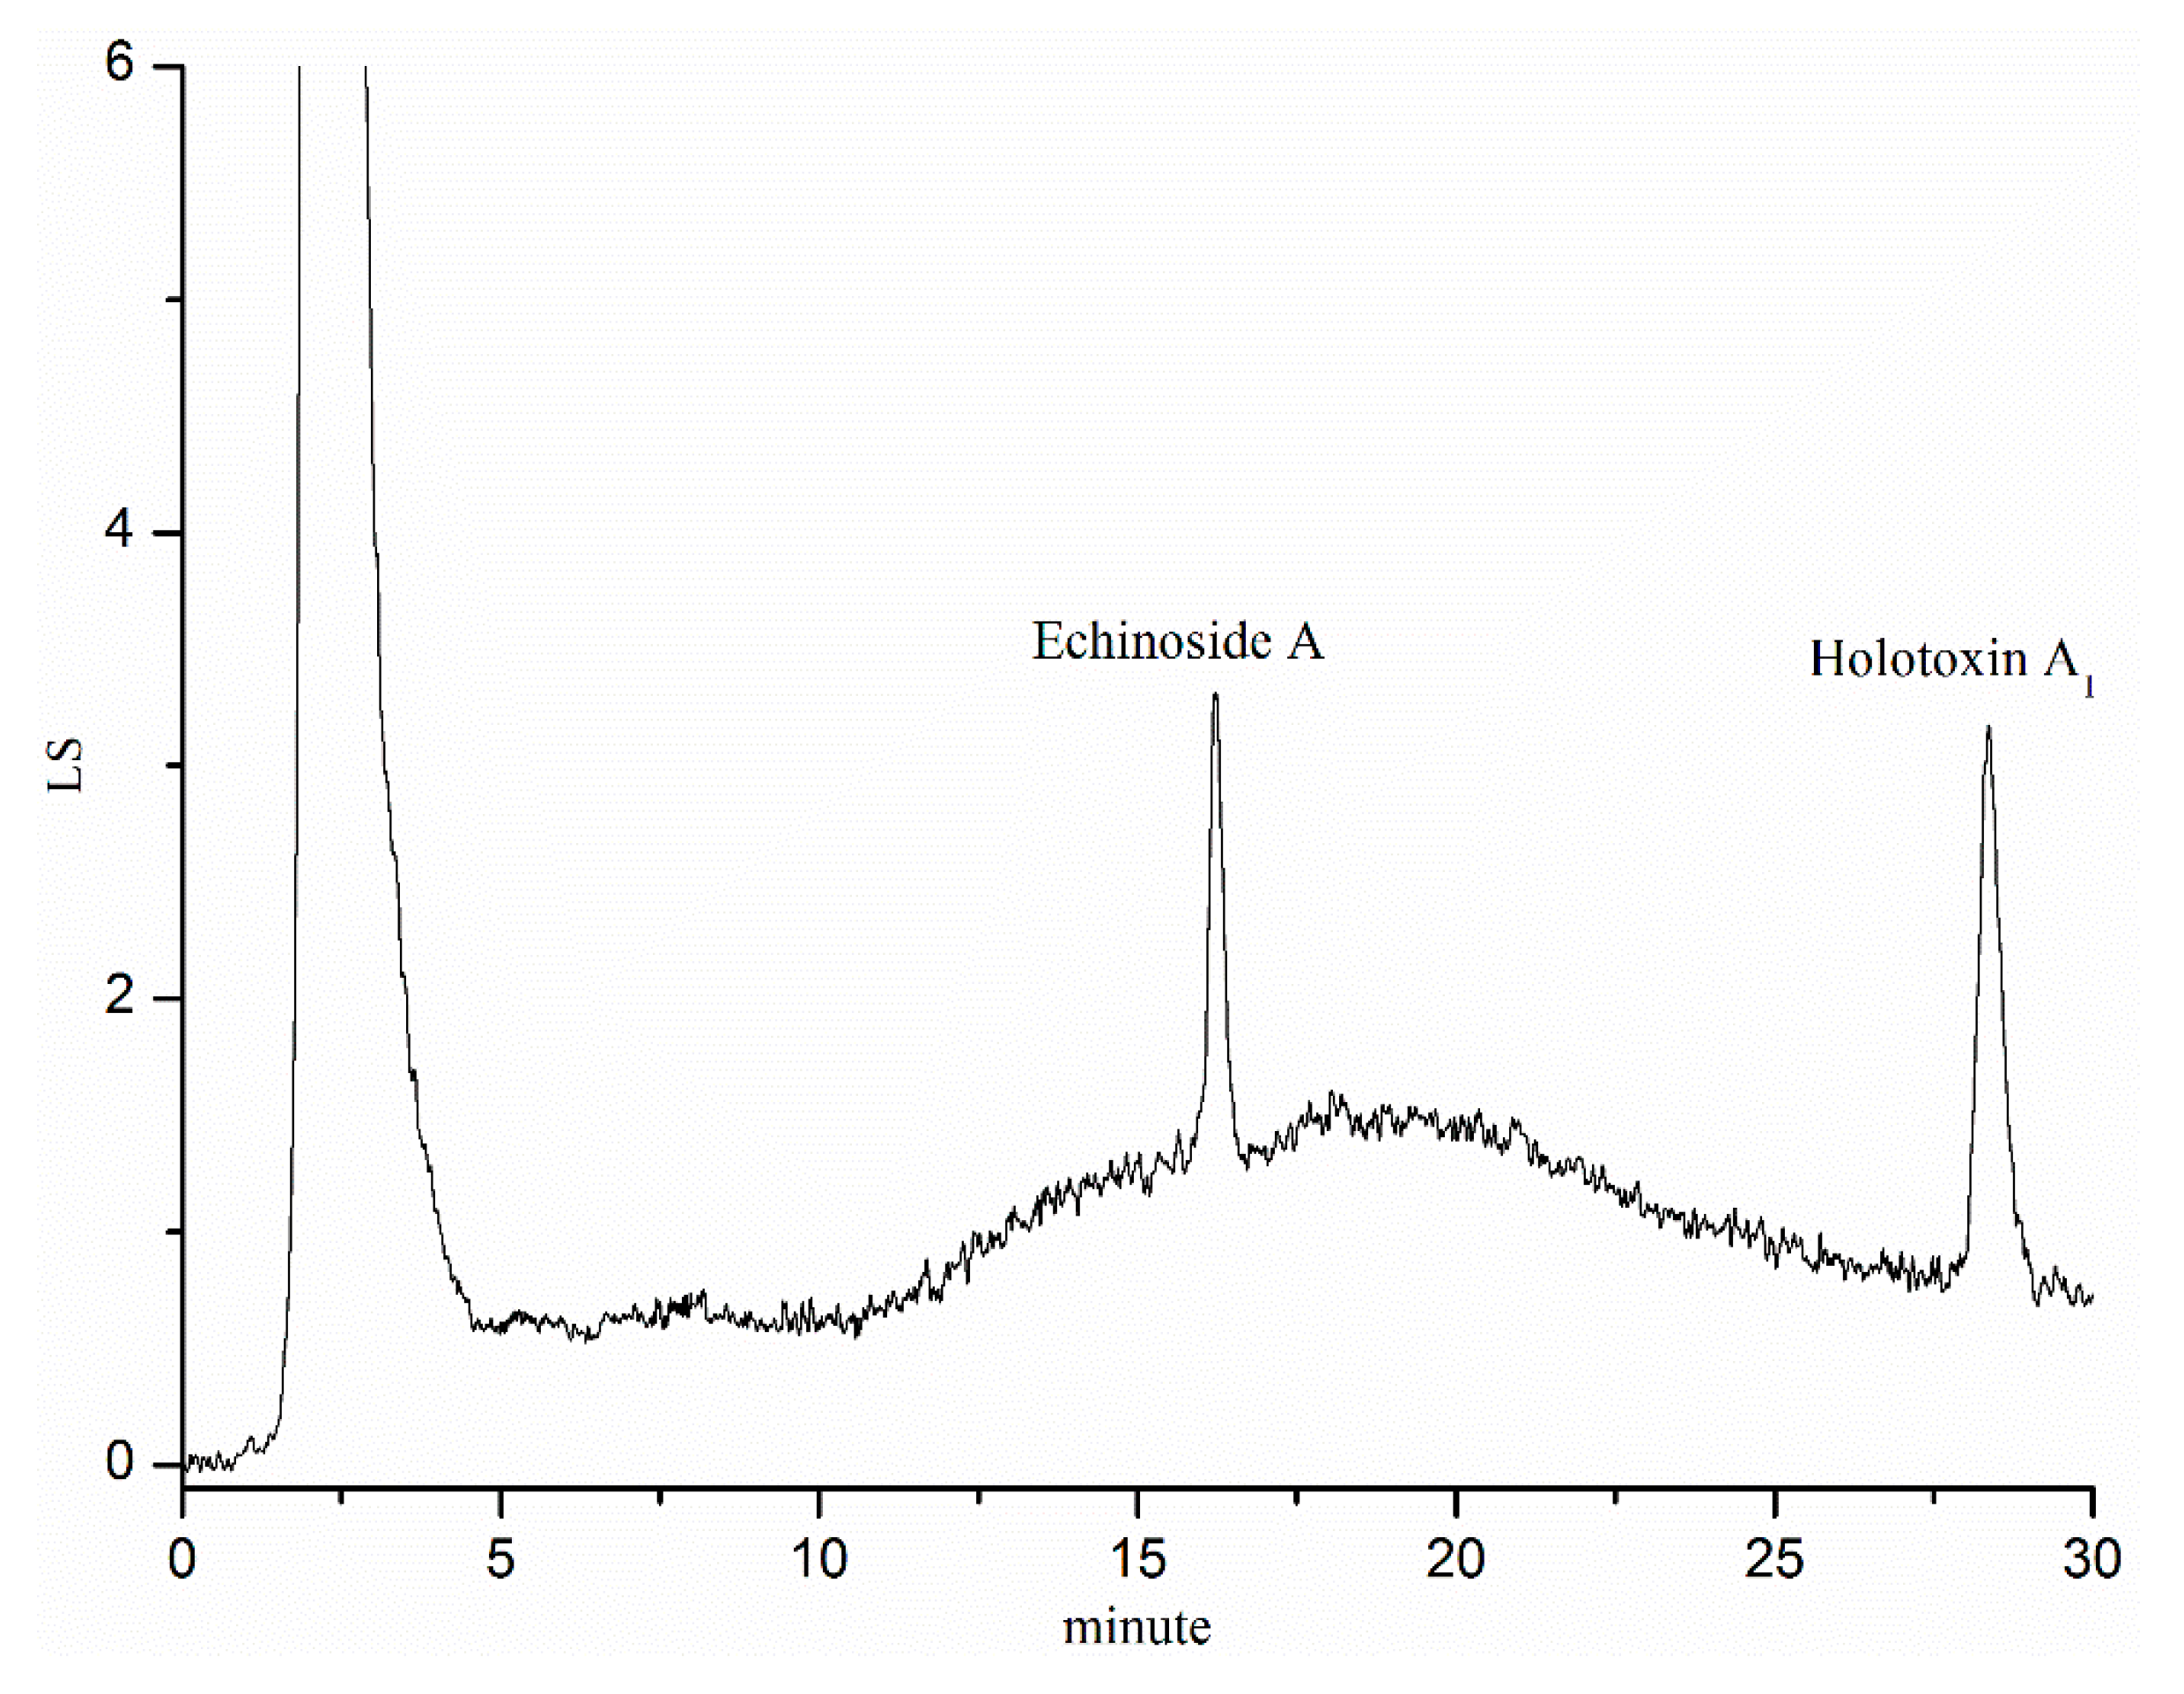
2.1. Characterization of Echinoside A

Echinoside A was isolated and identified by our research group. Its mass spectrum (MS) and nuclear magnetic resonance (NMR) data are shown in Figure 1 and Table 1 and Table 2. This is the first characterization of this saponin in Apostichopus japonicas.
The chemical structure of Holotoxin A1 and Echinoside A are shown in Figure 2 and Figure 3.

2.2. Method Validation

The retention times for Echinoside A and Holotoxin A1 were 16.2 and 28.3 min, respectively (Figure 4).

2.2.1. Linearity and Sensitivity

The calibration curves were linear over the concentration range of 100–5000 ng/mL and 100–20,000 ng/mL for Echinoside A and Holotoxin A1 in Hank’s balanced salt solution (HBSS) and rat plasma. The regression equation for the calibration curve of Echinoside A in HBSS and plasma were, respectively, Y = 528884X − 2318.7 (r2 = 0.9988) and Y = 30668X + 30.707 (r2 = 0.9991). The regression equation for the calibration curve of Holotoxin A1 in HBSS and plasma, were respectively, Y = 25428X − 301.05 (r2 = 0.9991) and Y = 25562X + 2171.8 (r2 = 0.9992). The lower limits of quantification (LLOQ) of Echinoside A and Holotoxin A1 in HBSS and rat plasma were found to be 100 ng/mL. The limit of detection (LOD) for Echinoside A and Holotoxin A1 in HBSS and plasma were both 50 ng/mL. Meanwhile, the calibration curves were linear over the concentration range of 500–15,000 ng/mL for Echinoside A and Holotoxin A1 in perfusate. The regression equation for the calibration curve of Echinoside A and Holotoxin A1 in perfusate were, respectively, Y = 39950X + 576.33 (r2 = 0.9990) and Y = 46916X + 1715.7 (r2 = 0.9989). The LLOQ of Echinoside A and Holotoxin A1 were found to be 500 ng/mL in perfusate. The LOD for Echinoside A and Holotoxin A1 in perfusate were 200 ng/mL.

2.2.2. Precision and Accuracy

The precision and accuracy data are shown in Table 3. The repeatability of the method was examined by both intra and inter-day repeatability. The intra and inter-day R.S.D.% of Echinoside A and Holotoxin A1 were less than 7.8% and 5.6%, and accuracy was ranged from −4.4% to 5.8%. The results indicated the stability and repeatability of the method for the quantitative determination of Echinoside A and Holotoxin A1.

2.2.3. Recovery and Stability

As shown in Table 4, the absolute recovery of Echinoside A and Holotoxin A1 in plasma were both above 90%. Two analytes were stable after frozen storage, analysis processing, and freeze-thaw conditions. The stability of Echinoside A and Holotoxin A1 in plasma and perfusate were 93.4%–102.4% and 88.2%–94.8% under three conditions, respectively (Table 5), which confirms the stability of Echinoside A and Holotoxin A1.

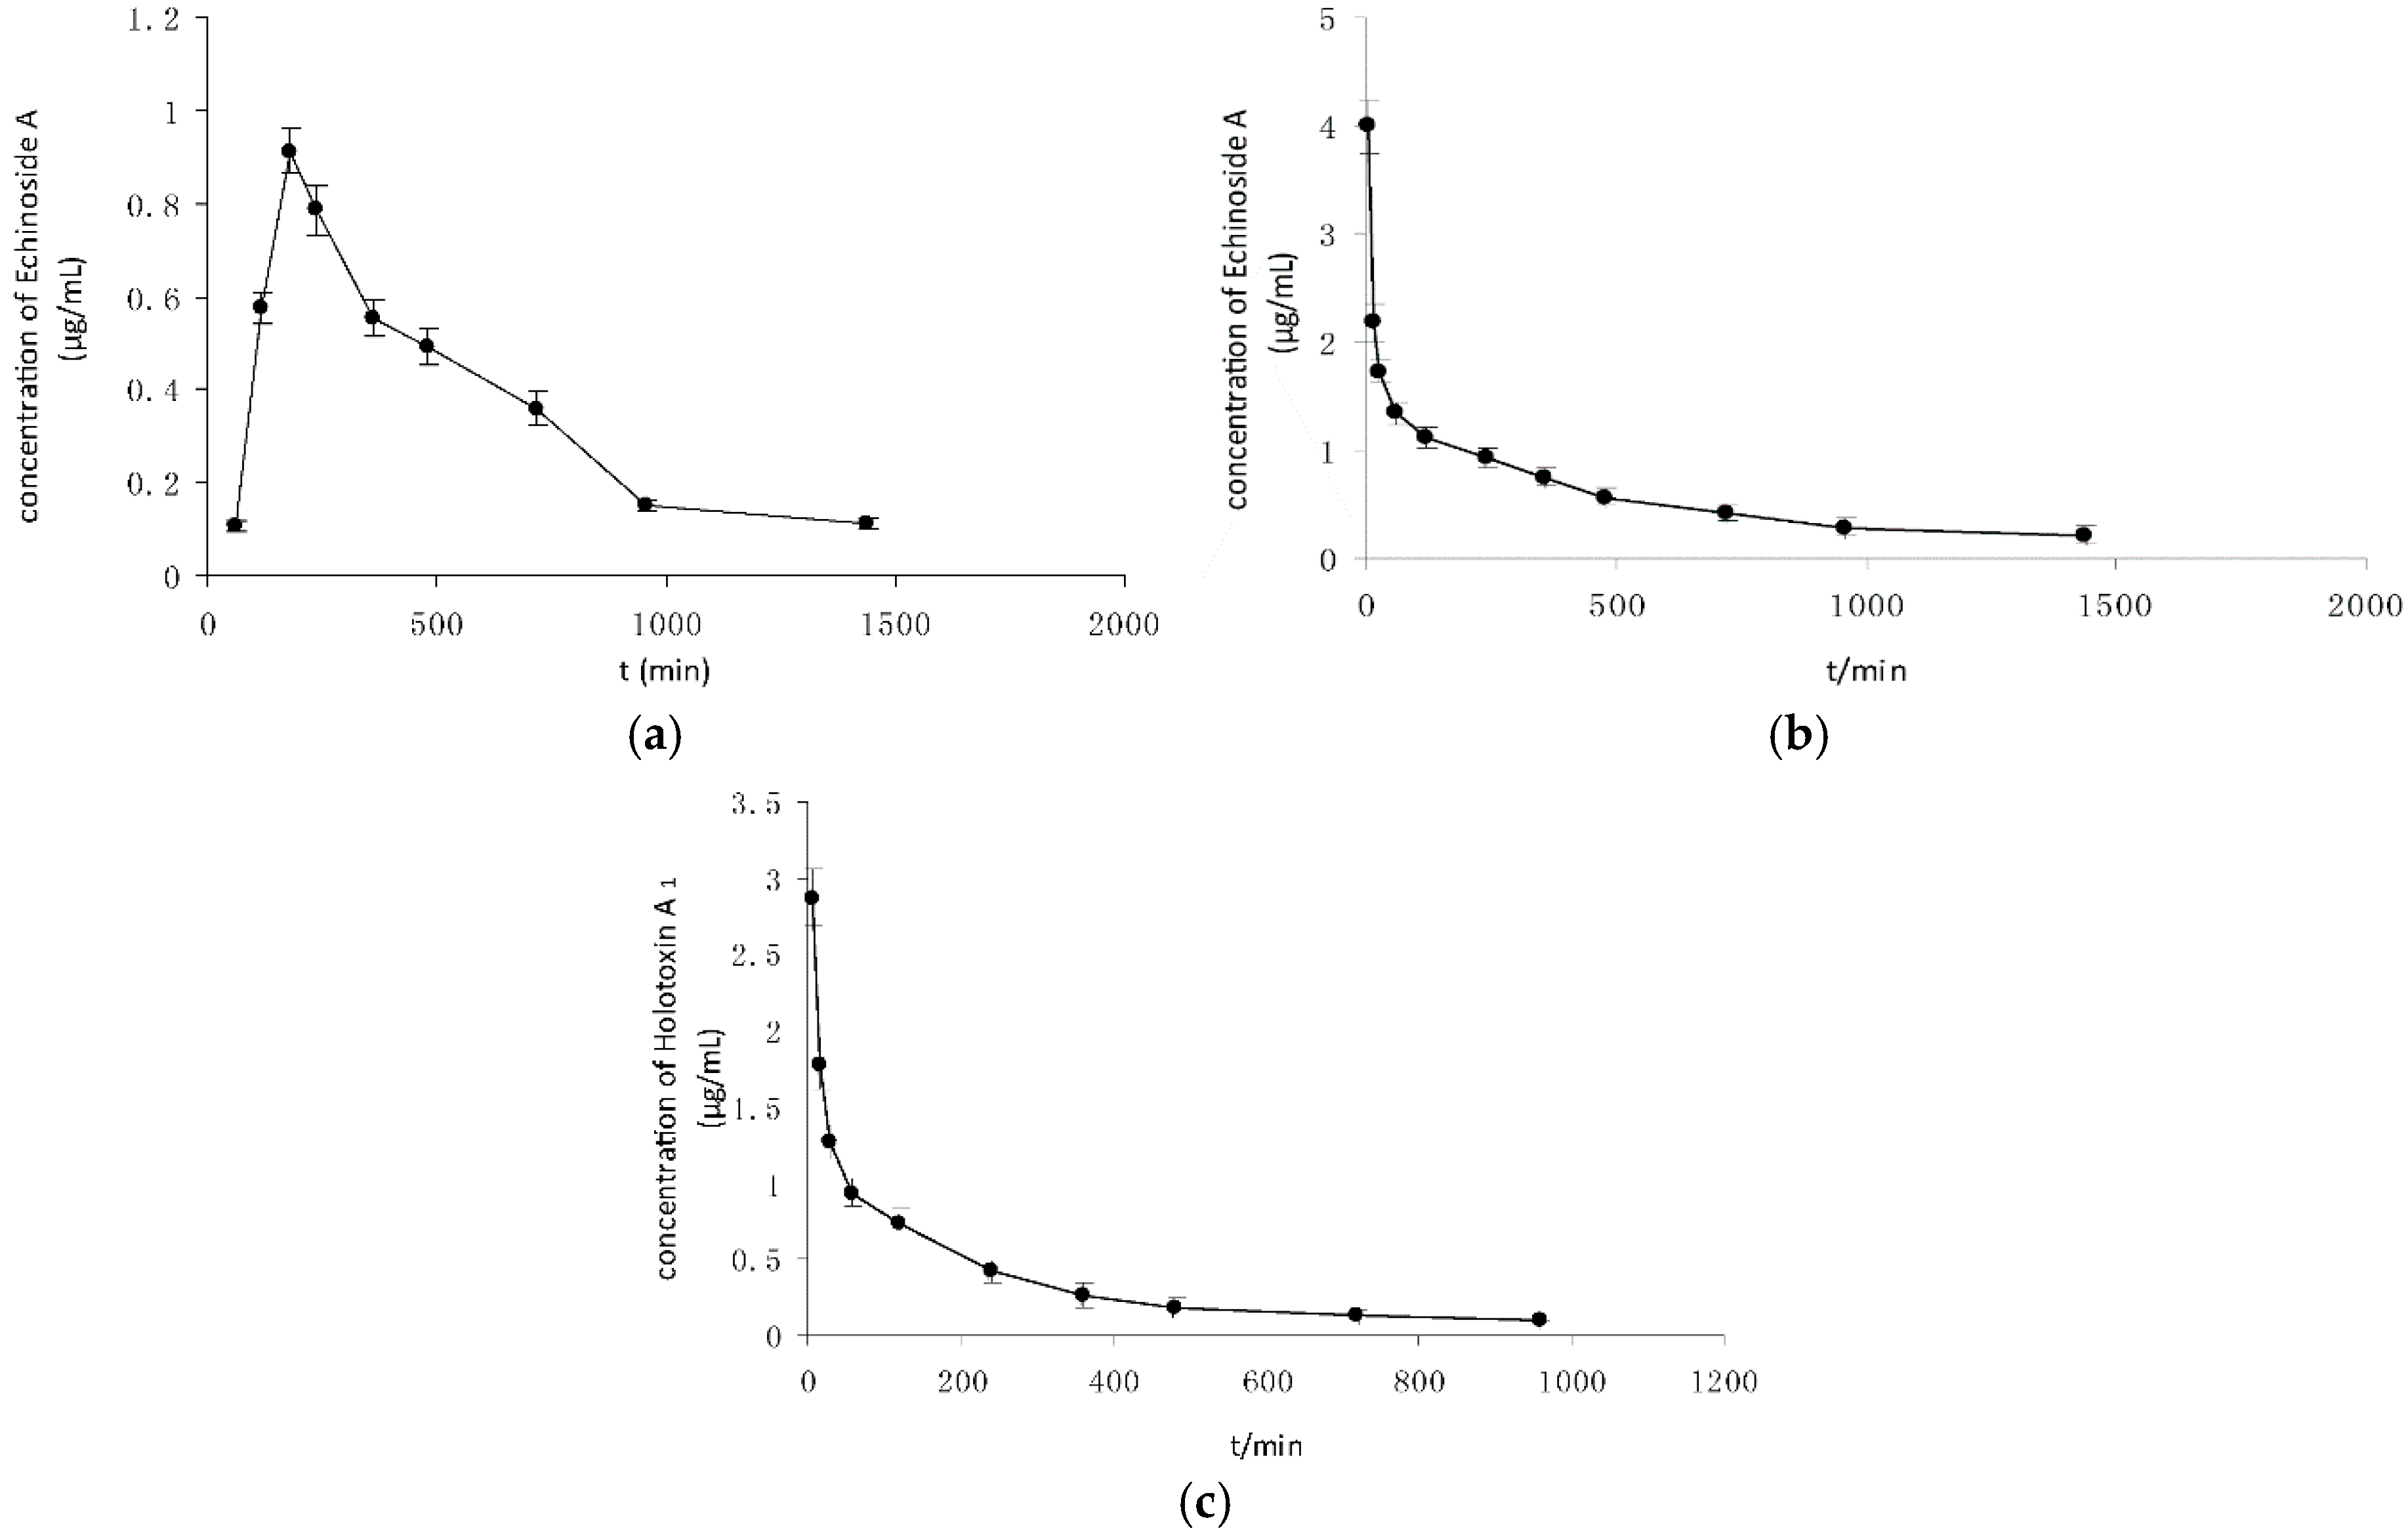
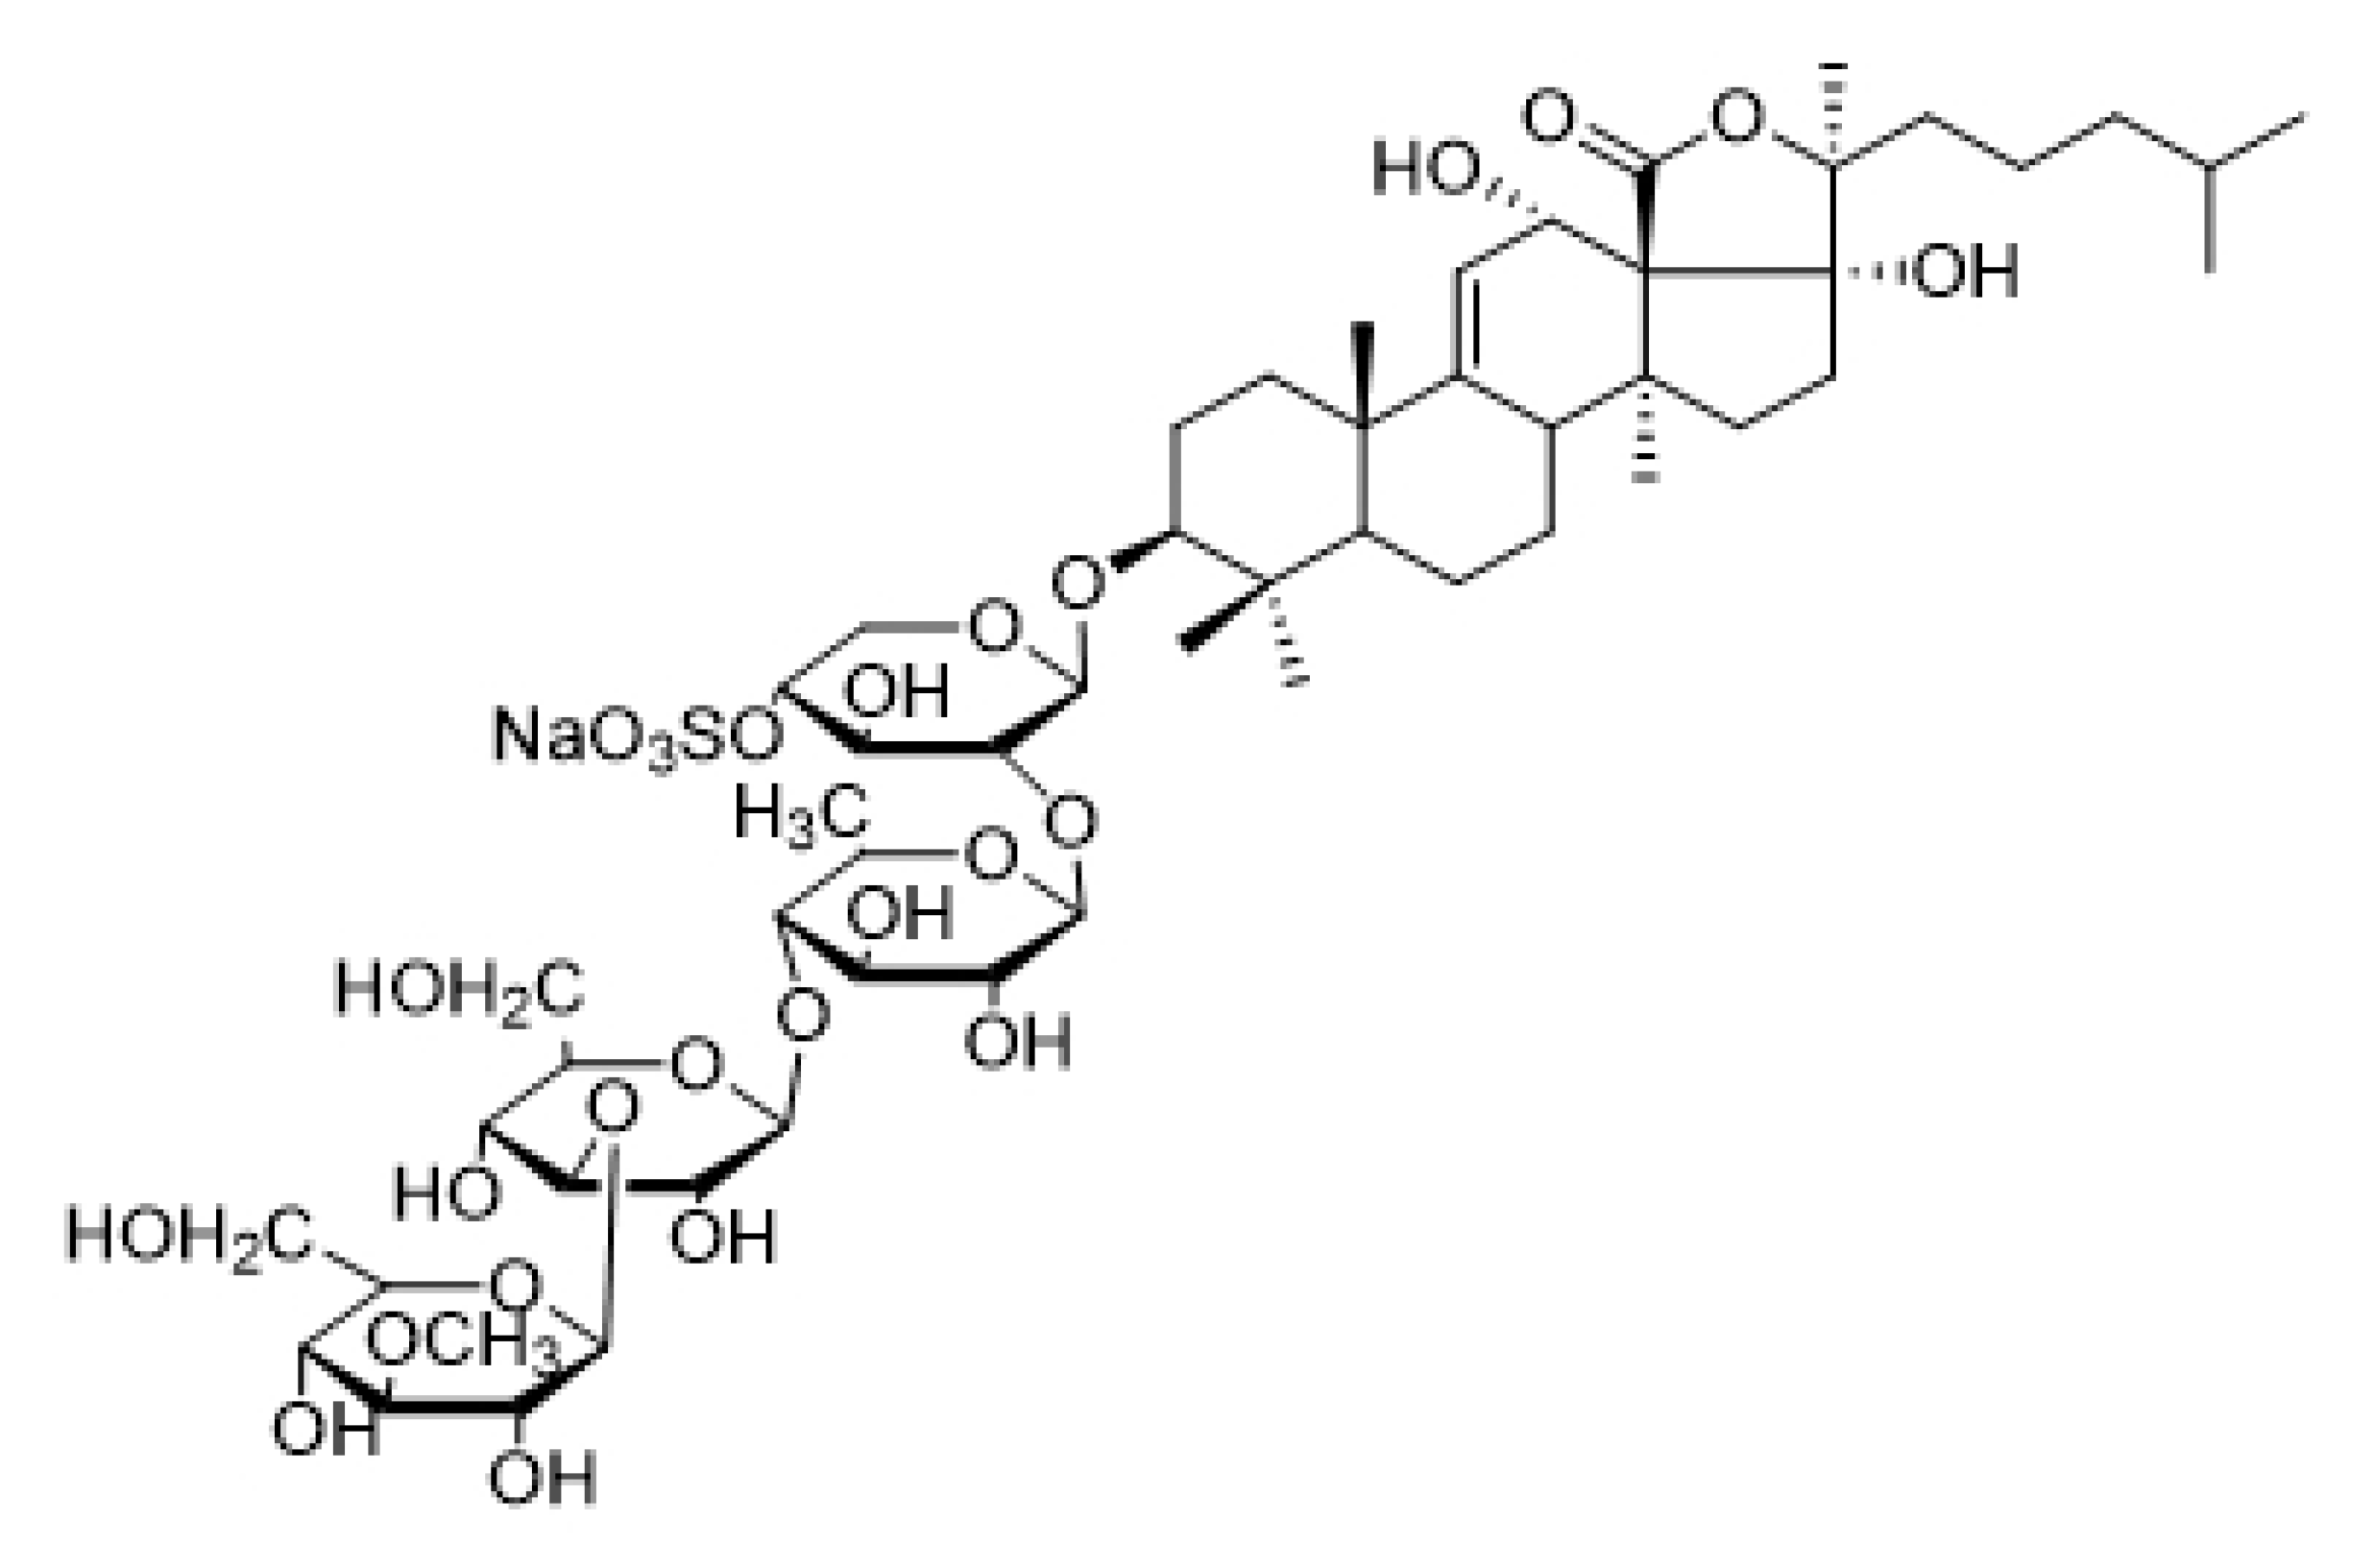
2.3. Pharmacokinetic Analysis of Sea Cucumber Saponins

After oral administration, Echinoside A and Holotoxin A1 were present in blood with different levels. Figure 5a shows the mean plasma concentrations-time profiles of Echinoside A. After oral administration, Echinoside A was detected at 1 h in rat plasma, which indicated that it could be gradually absorbed into plasma. Within 3 h, the concentration of Echinoside A in the plasma achieved the max value of 910 ng/mL. The elimination half-life time (T1/2) of Echinoside A was 6.99 h. On the contrary, no saponin was detected during the experiment (i.e., 24 h). The relevant pharmacokinetic parameters are listed in Table 6.
After intravenous administration, Echinoside A and Holotoxin A1 were present in plasma and decreased gradually over time (Figure 5b,c). The concentration-time curve of Echinoside A after intravenous administration included decreasing process only, whereas the concentration-time curve of Echinoside A after oral administration divided into increasing and decreasing trend. The relevant pharmacokinetic parameters are listed in Table 6. The area under the curve (AUC) and Cmax of Echinoside A after intravenous administration were significantly higher (p < 0.05) than Holotoxin A1.
Echinoside A and Holotoxin A1 exhibited different transport dynamics after oral and intravenous administration. The bioavailability of Echinoside A was 59%, meanwhile Holotoxin A1 was not detected in the plasma after oral administration. This finding revealed that the bioavailability of Holotoxin A1 was lower than Echinoside A.

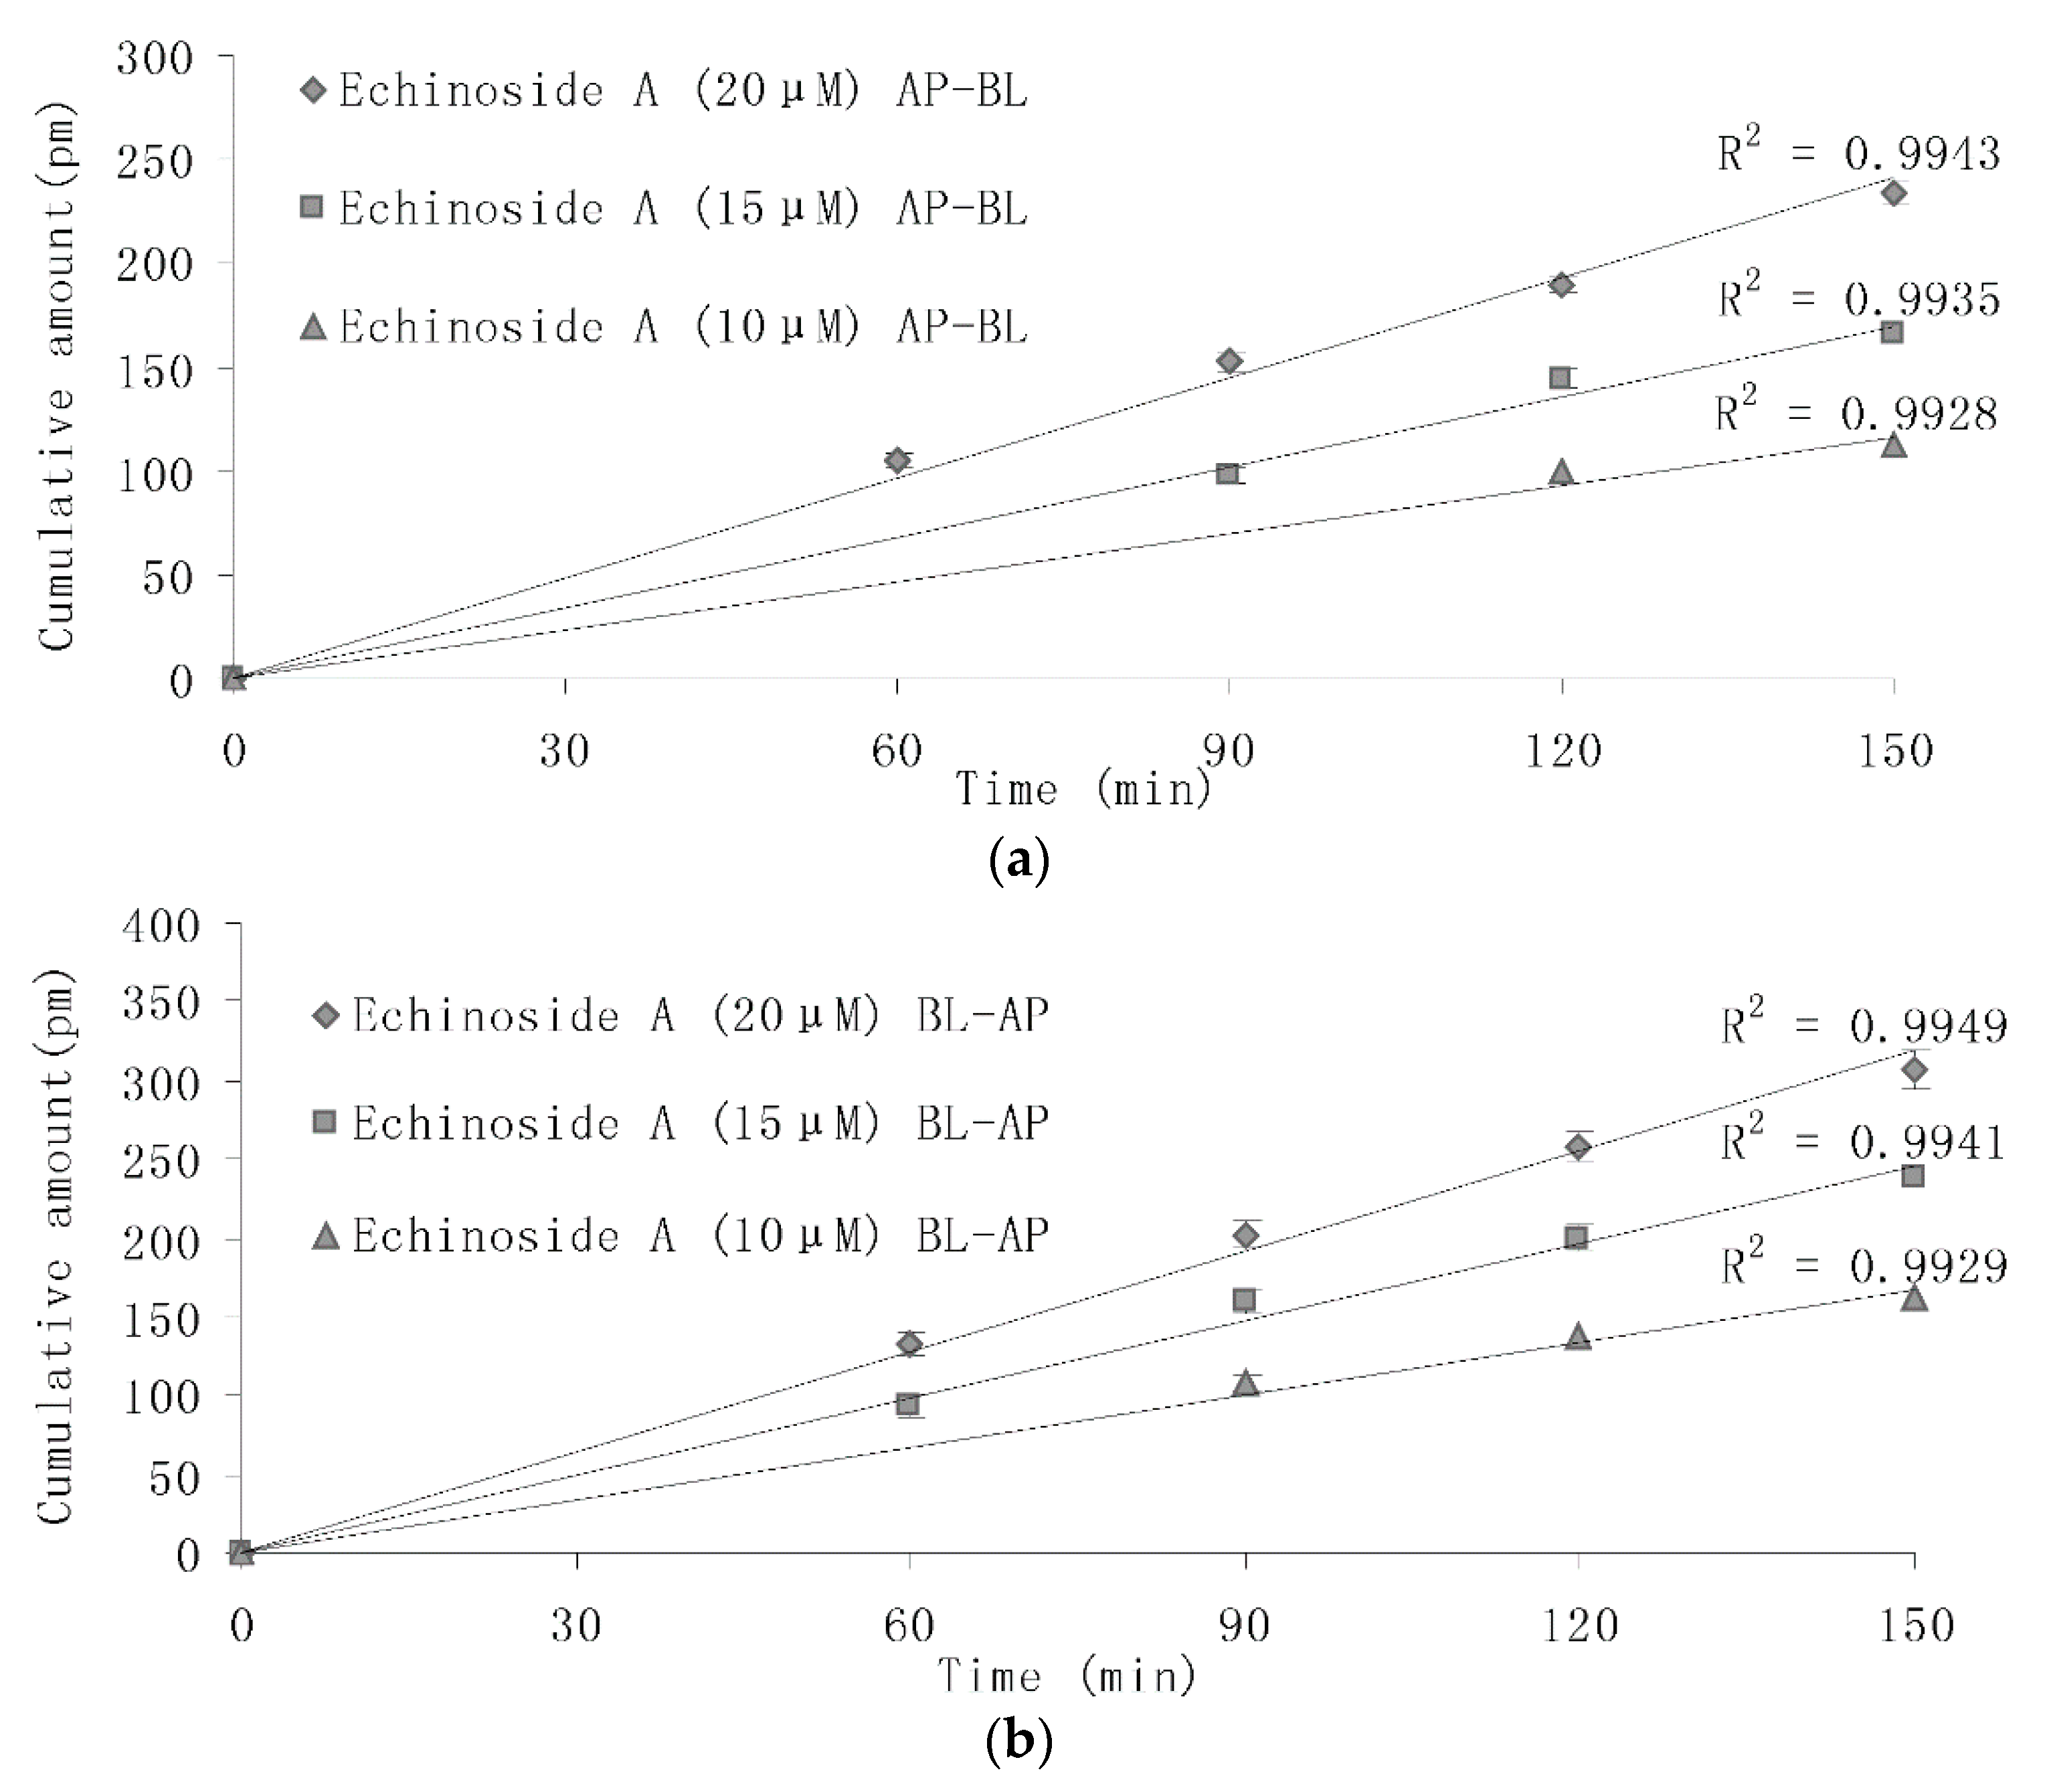
2.4. Transport Experiments of the Caco-2 Cell Model

The present study was undertaken to detect the transport of sea cucumber saponins with different concentrations over time. Figure 6 shows Echinoside A collected in the receiver chamber at 0, 60, and 150 min. The accumulation of different concentration of Echinoside A transported from apical-to-basolateral (AP-to-BL) (Figure 6a) and from basolateral-to-apical (BL-to-AP) (Figure 6b) increased linearly within 150 min. The results indicated that the cumulative amounts in the receiver chamber rose significantly (p < 0.05) at the same time as the concentration of Echinoside A increased; meanwhile, the cumulative amounts in the receiver chamber in BL-AP direction were significantly higher (p < 0.05) than the cumulative amounts in AP-BL direction at the same time in each concentration.
The absorption and transport of the drug in Caco-2 cell monolayer was evaluated by the apparent permeability coefficients (Papp). The PappAB (Papp (AP to BL) value) of Echinoside A (20 µM), Holotoxin A1 (20 µM) and two transcellular transport markers propranolol and atenolol are summarized in Figure 7. Figure 7 indicated that the PappAB of Echinoside A was significantly higher (p < 0.05) than atenolol, and significantly lower (p < 0.05) than propranolol. The PappAB of Holotoxin A1 was significantly lower (p < 0.05) than propranolol and Echinoside A.
The PappAB of Echinoside A was (3.96 ± 0.55) × 10−6 cm·s−1, which was about one sixth of that for propranolol, at (26.1 ± 1.2) × 10−6 cm·s−1; meanwhile, it was more than eight-fold higher than that for atenolol of (0.48 ± 0.07) × 10−6 cm·s−1. Holotoxin A1 was not detected in the receiver compartment, which indicated that Holotoxin A1 accumulated in the receiver compartment was less than the limit of detection; therefore, the PappAB of Holotoxin A1 was less than 0.83 × 10⁻⁶ cm·s−1.
At the same time, Echinoside A and Holotoxin A1 in the AP chambers and cells were detected to verify their stability. The percentage recovered in AP chambers, BL chambers, and cell monolayer are shown in Table 7. Table 7 indicated that Echinoside A were present in AP chambers, BL chambers, and cell monolayer. Holotoxin A1 was present in AP chambers. The recovery revealed that they were stable in this model.
P-glycoprotein (P-gp) is expressed in the apical side of Caco-2 monolayers with verapamil as the classic inhibitor. The efflux ratio which is used to present the extent of excretion is calculated by efflux versus absorption (PappBA/PappAB). To investigate the present of exocytosis, transport experiment was examined in the presence and absence of verapamil (Sigma-Aldrich, St. Louis, MO, USA, 100 μM). Table 8 showed the Papp value of Echinoside A (20 µM) and Holotoxin A1 (20 µM) in the absence and presence of verapamil. The lack of directional preference and no significant decrease of the efflux ratio compared to the data in the absence of the P-gp-inhibitor suggested that Echinoside A was transported by passive diffusion without the participation of P-gp.
We found that the Caco-2 cell model showed high and efficient transport of Echinoside A, and oppositely, poor transport of Holotoxin A1. The results were coincident with their transport dynamics parameters of pharmacokinetics.

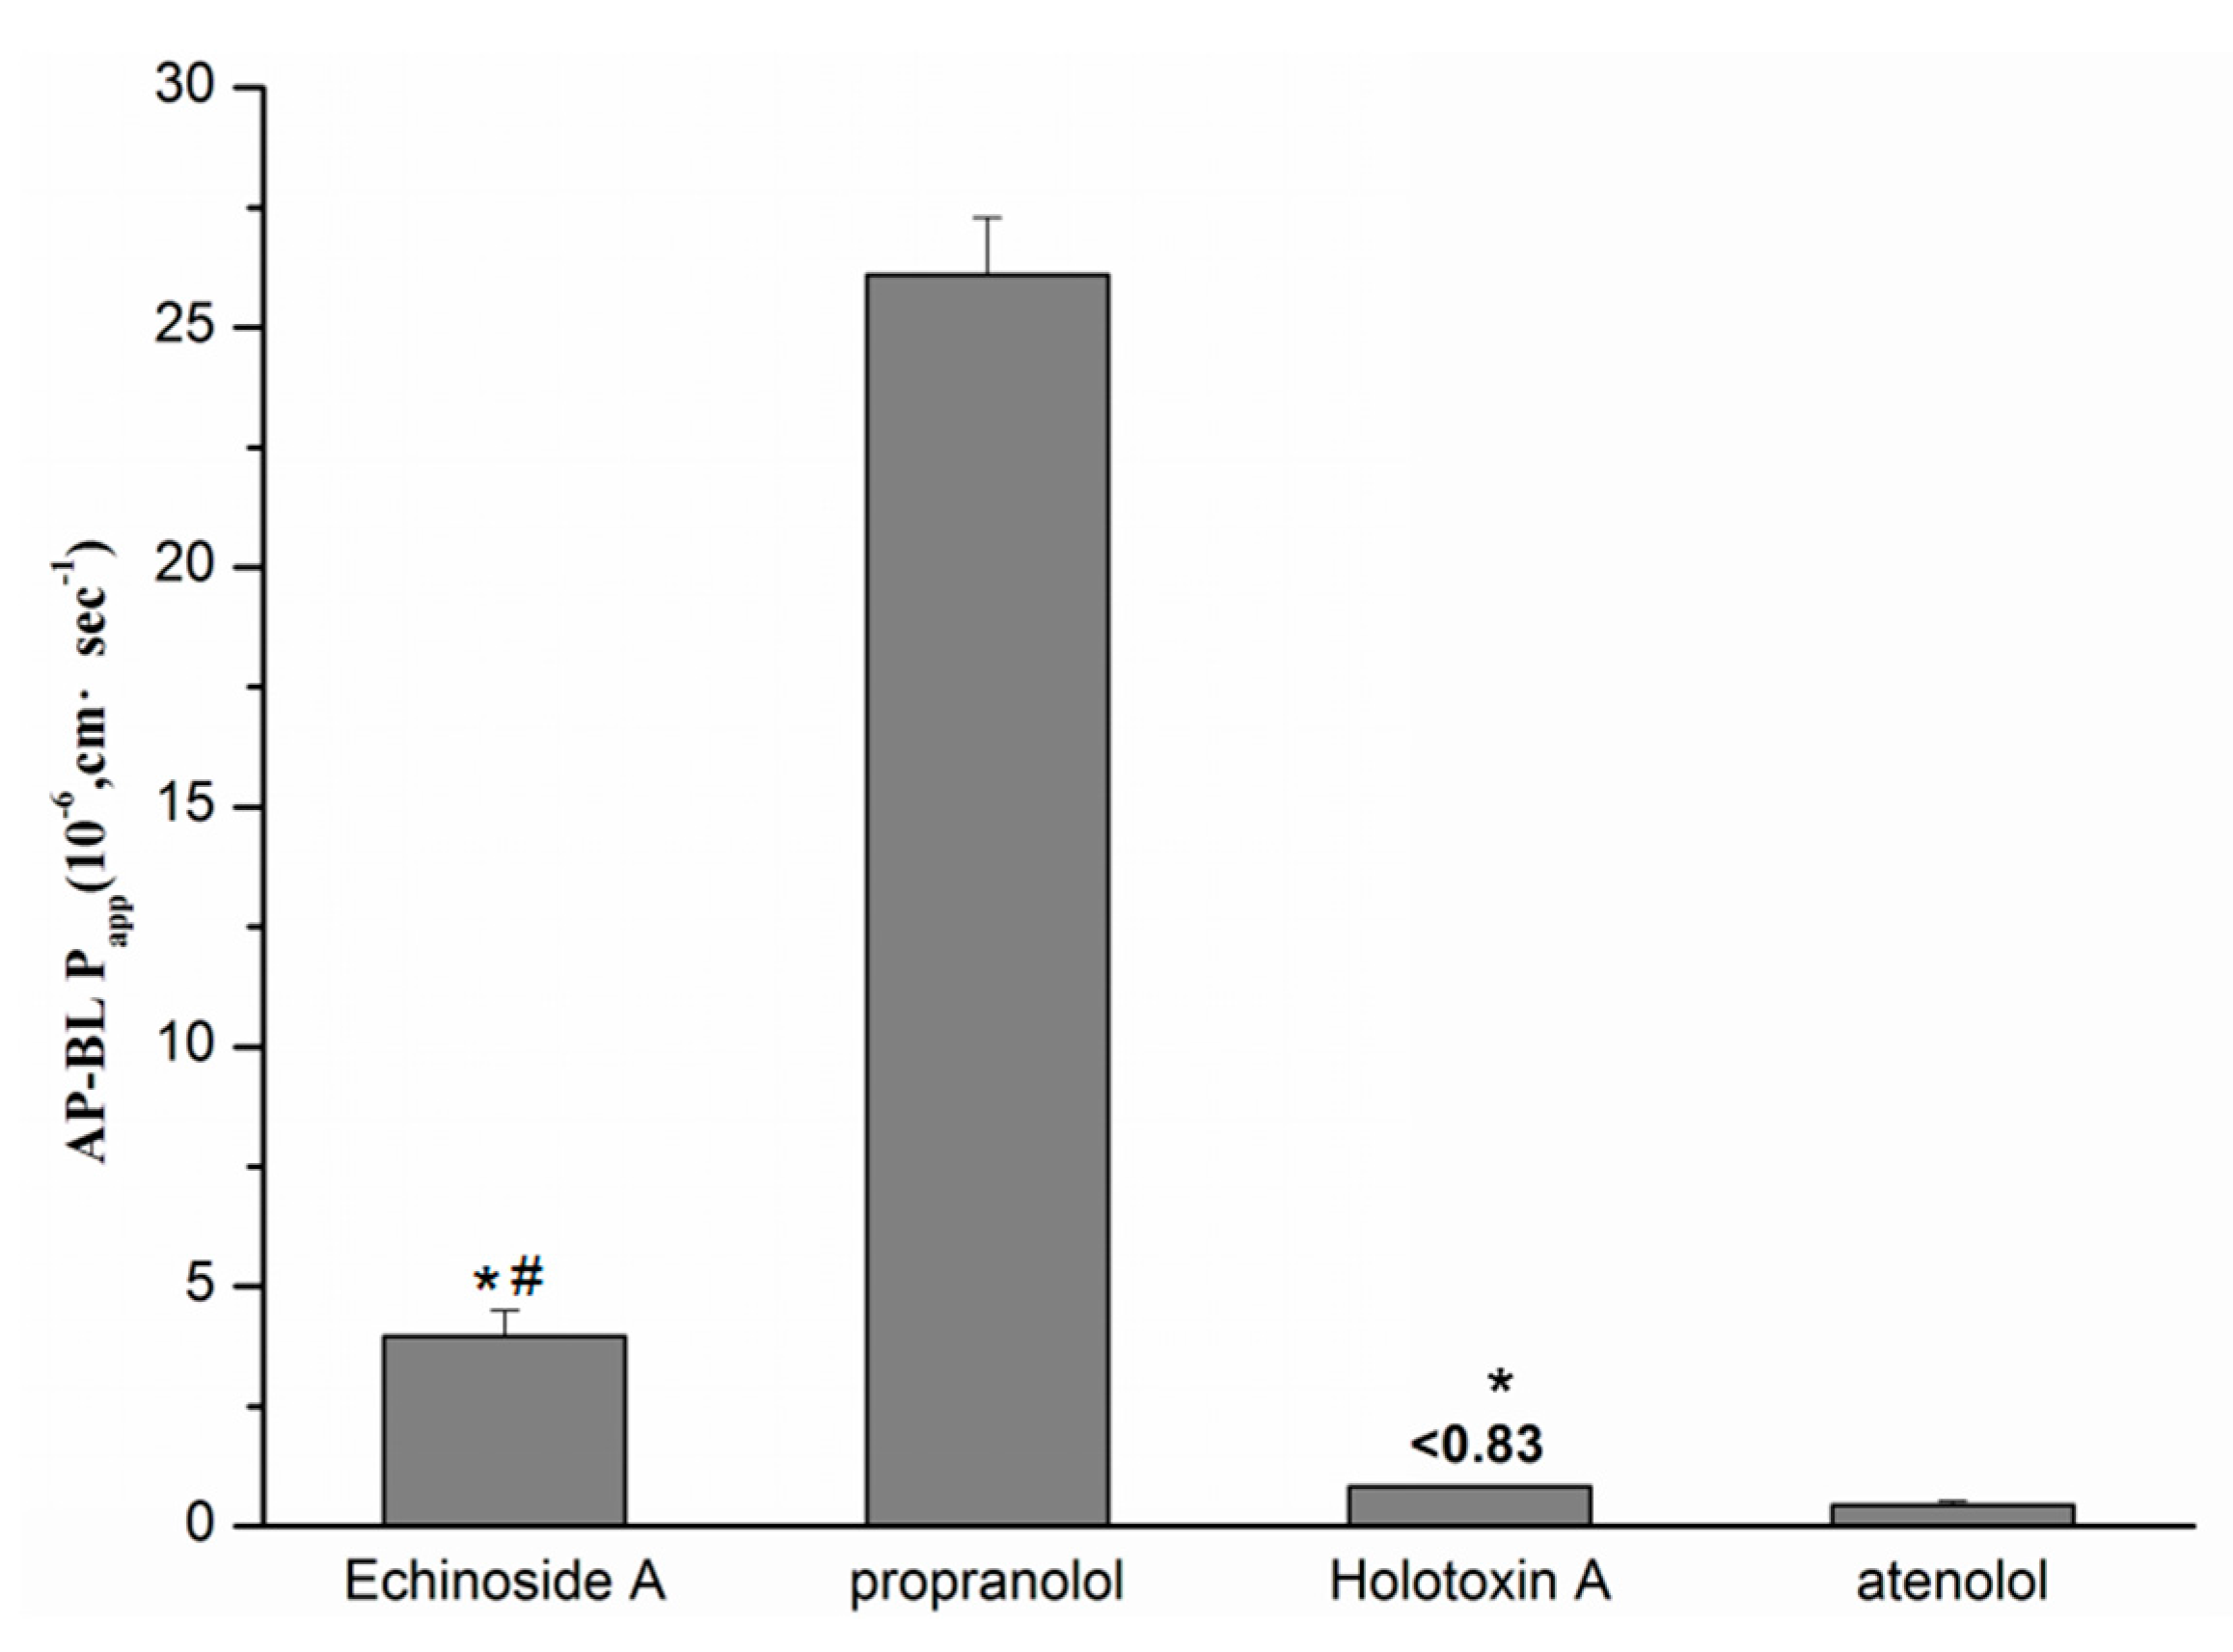
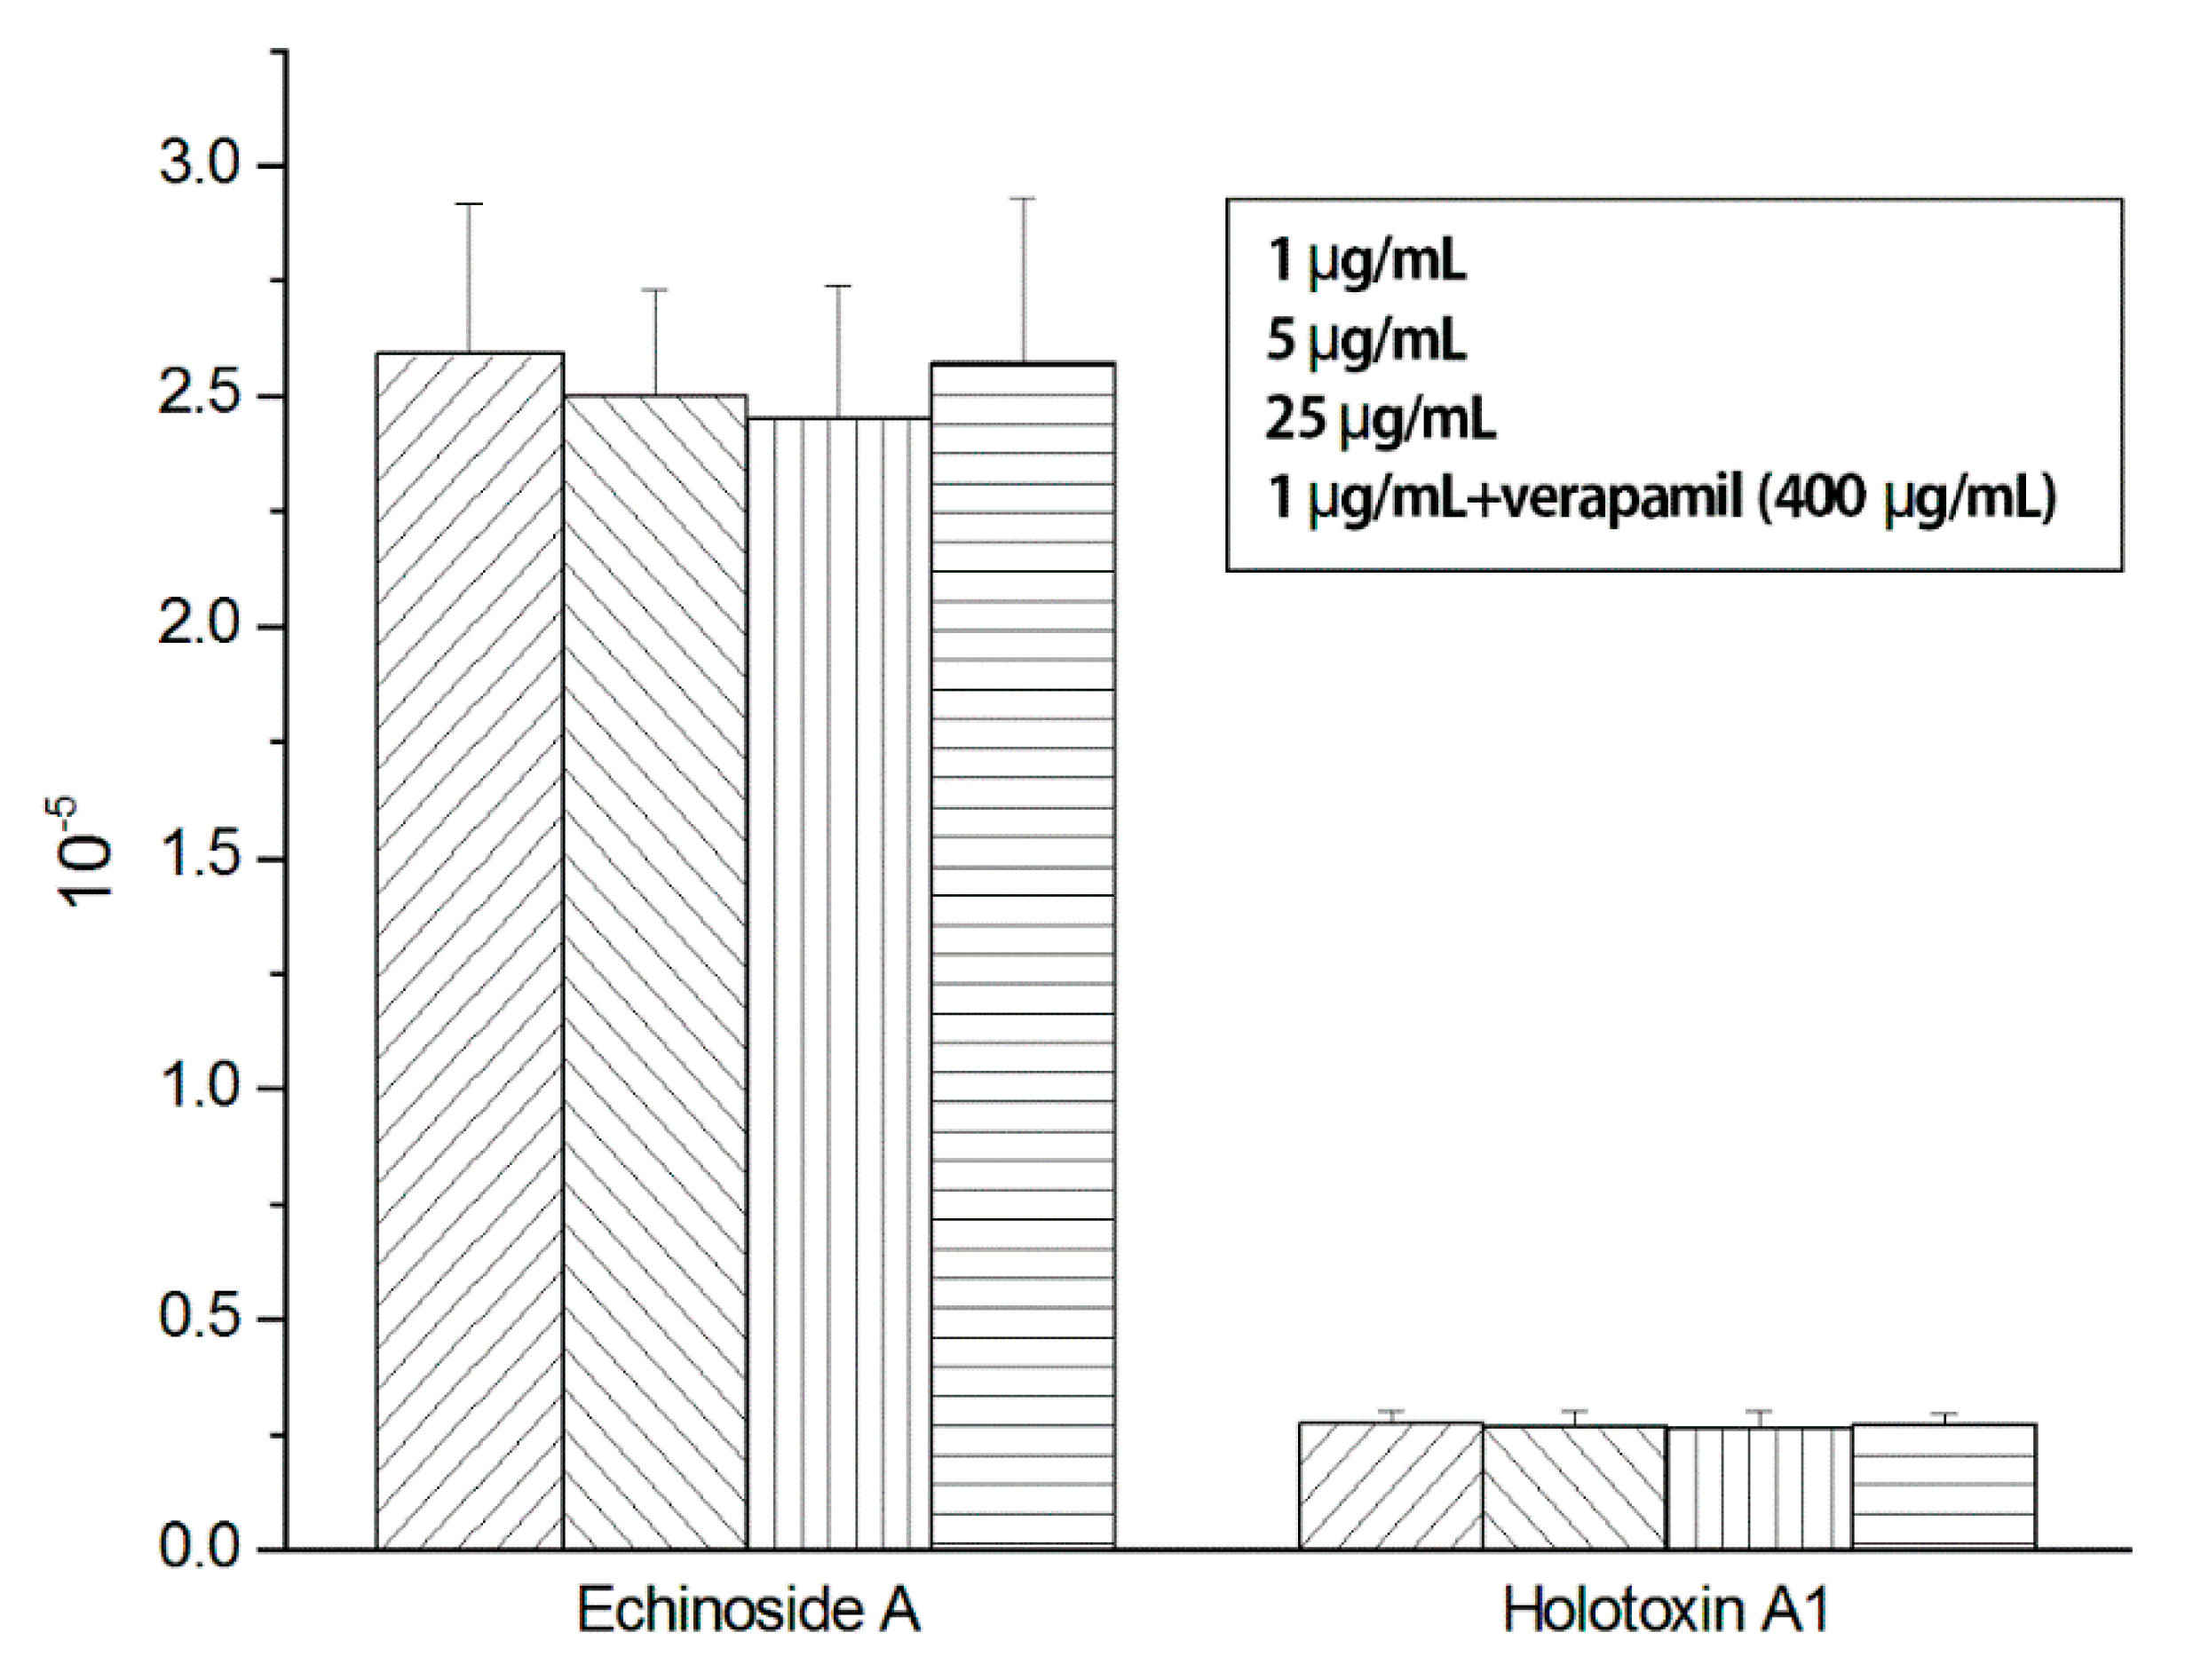
2.5. Single-Pass Intestinal Perfusion of Sea Cucumber Saponins

After the perfusion of different doses of Echinoside A and Holotoxin A1, their steady-state concentrations collected from the outlet were detected. The intestinal permeability of Echinoside A and Holotoxin A1 were determined by permeability across the intestinal membrane (Peff) value. The Peff of Echinoside A and Holotoxin A1 from in situ vascular perfusion were, respectively, 2.50 × 10⁻⁵ cm·s−1 and 2.67 × 10⁻⁶ cm∙s−1. The Peff values of each concentration are listed in Figure 8.
Concentration-dependent changes of Echinoside A and Holotoxin A1 in permeability were not found in the segment of intestine. The permeability at 25 μg/mL of Echinoside A was close to that at 1 μg/mL. No significant increase in permeability of Echinoside A and Holotoxin A1 was tested when verapamil (400 μg/mL) was added to the perfusate, which indicated that P-gp did not affect the intestinal absorption of Echinoside A and Holotoxin A1.
The results of single-pass intestinal perfusion model on the absorption and metabolism of Echinoside A and Holotoxin A1 confirmed the results of pharmacokinetics experiments and transport experiments across Caco-2 model.

2.6. Formatting of Mathematical Components

Papp = (dQ/dt)/(A × C0)
where, dQ/dt (nmol·s−1) represents the rate of the compound accumulated in the receiver compartment over time. A (cm2) represents the membrane area of the insert. C0 (nmol/cm3) represents the initial concentration of the drug in the donor compartment [29,30,31]. Data were expressed as the means ± SD of three determinations:
Peff = −Q ln [Cout/Cin]/2πrl
In which Cin is the inlet concentration and Cout is the outlet concentration of compound, which is corrected for volume change in the segment using phenol red concentration in the inlet and outlet tubing. Q is the flow rate (0.2 mL/min), r is the rat intestinal radius (0.18 cm), and l is the length of the segment [32].

3. Discussion

The current study developed a highly-sensitive and effective HPLC method with evaporative light scattering detection to determine sea cucumber saponins. This method was validated to confirm high accuracy, precision, and reproducibility. This study highlighted the absorption and transport of two sea cucumber saponin monomers using the Caco-2 monolayer model, single-pass intestinal perfusion model, and in vivo pharmacokinetics in rats, and speculated the relationship between the chemical structure of two sea cucumber saponins and their bioavailability.
Echinoside A showed higher bioavailability than Holotoxin A1. Factors affect the bioavailability of drugs include structural and chemical properties of molecules, such as molecular weight, hydrogen performance, branched chain, and solubility. As a small molecular substance, sea cucumber saponins are neutral, liposoluble, but not hydrophobic. Compared with Holotoxin A1, Echinoside A has a lower molecular weight. Holotoxin A1 has six monosaccharides, which is two more than that of Echinoside A. Additionally, the six monosaccharides are divided into two branched chains, which results in larger steric hindrance. We speculate that these reasons lead to lower bioavailability of Holotoxin A1.
Artursson, Karlsson [33], and Lau [34] indicated that drugs with Papp ≥ 3 × 10⁻⁶ cm·s−1 represented high permeability and good absorption, while compounds with a Papp of less than about 2 × 10⁻⁶ cm·s−1 exhibited poor oral absorption. The results of the Caco-2 cell model and single-pass intestinal perfusion model showed high and efficient transport of Echinoside A, and oppositely, poor transport of Holotoxin A1, which confirmed the results of pharmacokinetics experiments, and demonstrated our conjecture that the differences in chemical structure between compounds was a factor that explained their different characteristics of transport across the intestine.
Jiang et al. [27] investigated the bioavailability of Soyasaponin, demonstrated that Soyasaponin I and Sapongenol B have limited absorption. Han et al. [27] used Caco-2 cells and rat models to study the mechanism of absorption after oral administration of panaxnotoginseng saponins (PNS). The results indicated that PNS showed low membrane permeability on Caco-2 cell monolayer and poor absorption. Our study indicated that Echinoside A exerted efficient transport on the Caco-2 cell monolayer and favorable bioavailability compared with plant saponins.
Processed sea cucumbers (trepangs) have a high commercial value and are consumed for food and traditional medicine in Asian communities. Caulier et al. [35] compared the saponins contained in the body wall of sea cucumbers and the trepangs. They found that saponins seem to be thermically resistant in the processed procedure which indicated that sea cucumbers saponins were stable as food.
Our work found a sea cucumber saponin monomer with high and efficient transport, which indicated that this secondary metabolite with extensive physiological activities can be absorbed efficiently by humans. This study lays a foundation for further study of the clinical application of sea cucumber saponins. In addition, our speculation about the relationship between the chemical structure of two sea cucumber saponins and their bioavailability could be verified by more sea cucumber saponins in the future studies and provided a method for direct assessment of the intestinal absorption of drug.

4. Materials and Methods

4.1. Chemicals and Materials

The human colon adenocarcinoma cell line, Caco-2, was obtained from the cell resource center of the Shanghai Institutes for Biological Sciences. Dulbecco’s modified eagle medium (DMEM) and fetal bovine serum were from Gibco (Thermo Fisher, Shanghai, China), penicillin and streptomycin were from Sigma-Aldrich.
Sea cucumber saponins were separated and purified by our research group [36]. We used two saponin monomers (Holotoxin A1 and Echinoside A) which did not contain other molecules in our experiments. 15.5 kg sea cucumbers were used for extraction. The weight of extraction was 9.763 g. The productive rate of Holotoxin A1 and Echinoside A from the extraction were respectively about 6% and 4%.
Millicell hanging cell culture inserts (polyethylene terephthalate membrane, 0.33 cm2 surface, 0.4 μm pore size) were purchased from Corning (New York, NY, USA). All other chemicals used in this study were of analytical grade.
Hanks’ buffered saline solution (HBSS) containing 10 mM HEPES and 25 mM D-(+)-glucose. Perfusate was Krebs-Ringer buffer solution containing (g/L) NaCl 7.8, KCl 0.35, CaCl2 0.37, MgCl2 0.22, NaH2PO4 0.32, glucose 3.0, NaHCO3 1.37, dextran 30, and BSA 50.

4.2. Animals

Male Wistar rats weighting 200–220 g were obtained from Qingdao Institute for Drug Control (Qingdao, China, SCXK2009007) and acclimated for 7 d in an environmentally-controlled room (temperature: 25 ± 2 °C, humidity: 50% ± 5%, 12 h dark-light cycle) with free access to water and food. All in vivo animal work was approved by Animal Ethics Committee of School of Medicine and Pharmacy, Ocean University of China. The rats were subjected to fasting, with access to water, for 12 h before the experiment in order to avoid the influence of the food to the absorption of sea cucumber saponins. Five rat individuals were used for each parallel control group.

4.3. Chromatographic Conditions

The content of sea cucumber saponins was tested by HPLC system (Waters Corp, Milford, MA, USA) consisting of a pump (Model 1525), an autosampler (Model 717), and an evaporative light-scattering detector (ELSD, Model 2420). Separations were performed on a Kromasil C18 (Zonran Technologies, Huaian, China) reversed-phase column (5 μm, 150 × 4.6 mm). The column temperature was set to 40 °C and the flow rate was 0.7 mL·min−1. The mobile phase consisted of double-distilled water (solution A) and acetonitrile (solution B), the acetonitrile gradient was 27% from 0 to 15 min, 27%–42% from 15 to 30 min, 42%–27% from 30 to 32 min. The carrier gas pressure of ELSD was 25 psi, the drift tube temperature was 60 °C, the atomization efficiency was 50% and the gain value was 25. These conditions were chosen according to the research of Zhang et al. [36].

4.4. Method Validation

Stock solutions of Echinoside A and Holotoxin A1 were prepared in water (1 mg/mL) and working standard solutions were prepared by serial dilution in HBSS, blank rat plasma, and blank perfusate, respectively. The plasma with the quality control (QC) sample was blended with methanol and centrifuged for 10 min at 15,000 rpm, the supernatant was dried under nitrogen and dissolved with methanol for analysis.

4.4.1. Linearity

The linearity of HPLC method for the determination of Holotoxin A1 and Echinoside A was evaluated by calibration curves. The calibration curves were obtained by plotting the chromatographic peaks area versus the concentrations of analytes prepared. The slope, intercept, and correlation coefficient of the calibration curves were determined by least squares linear regression analysis.

4.4.2. Precision and Accuracy

Five QC samples of different concentrations were injected on a single day (intra-day) and on three consecutive days (inter-day). The precision was expressed as the relative standard deviation (R.S.D.%) and the accuracy was expressed as the relative error (R.E.%).

4.4.3. Recovery and Stability

Five replicates of Holotoxin A1 and Echinoside A diluted to 100, 1000, and 5000 ng/mL by plasma and perfusate were detected, and the absolute recovery was determined by comparing the peak-area value from the calibration curve and the real concentration. Freeze-thaws, short-term, and long-term stabilities of Holotoxin A1 and Echinoside A in plasma and perfusate were verified using different concentrations of QC samples. In the freeze-thaw cycle, the samples were frozen and stored at −20 °C for 24 h, then thawed at ambient temperature. To evaluate long-term stability, samples were kept at ambient temperature for 5 d until extraction. For the short-term stability, samples were kept at ambient temperature for 24 h before extraction.

4.5. In Vivo Pharmacokinetics of Sea Cucumber Saponins in Rats

4.5.1. Oral Administration of Sea Cucumber Saponins

20 mg/kg Echinoside A and Holotoxin A1 dissolved in water were, respectively, orally administered to the rats by gavage. Blood samples were collected from the orbital cavity at different times (5, 15, 30 min and 1, 2, 3, 4, 8, 12, and 24 h). The plasma was obtained from the blood samples by being centrifuged for 10 min at 4000 rpm, and then frozen at −20 °C prepared for analysis.

4.5.2. Intravenous Administration of Sea Cucumber Saponins

20 mg/kg Echinoside A and Holotoxin A1 dissolved in water were, respectively, orally administered to the rats by tail vein injection. Blood samples were collected from the orbital cavity at different times (5, 15, 30 min and 1, 2, 4, 8, 12, and 24 h). The plasma was separated and frozen at −20 °C and prepared for analysis.
We chose these parameters after we referred to other saponins. Doses of administration for saponins are different in previous research. Li et al. [37] investigated the pharmacokinetics of ilexsaponin A1 in rats, the dose of intravenous administration was 30 mg/kg. Odani et al. [38] investigated the pharmacokinetics of ginsenoside Rg1 in rats, the dose of intravenous administration was 5 mg/kg, and the dose of oral administration was 100 mg/kg. Lin et al. [39] investigated the pharmacokinetics of ginsenoside in rats, with the dose of oral administration being 50 mg/kg.

4.6. Caco-2 Cells Model

4.6.1. Cell Culture

Caco-2 cells were cultured in DMEM supplemented with 20% fetal bovine serum, 100 U/mL penicillin, and 100 μg/mL streptomycin. Cells were grown in a humidified atmosphere of 5% CO2 at 37 °C and were subcultured at 80%–90% confluency.

4.6.2. Transepithelial Transport Experiments

For transport studies, Caco-2 cells were seeded in Millicell (Corning) hanging cell culture inserts (0.33 cm2 surface, 0.4 μm pore size) at a density of 1 × 10⁵/cm2. The basolateral and apical compartments contained 1.0 and 0.5 mL of culture medium, respectively. Culture medium was replaced three times a week for 14 d, and daily thereafter. Cells with passage numbers 30–65 were used for transport experiments 19–30 d post-seeding. Monolayers with TEER value equal or above 300 Ω·cm−2 were selected for transport experiments.
The monolayers were washed twice with preheating transport medium (HBSS) and prei-ncubated for 30 min. Transport medium containing different concentration of sea cucumber saponins was added on either the apical (0.5 mL) or basolateral (1 mL) side while the receiver chamber contained corresponding volume of transport medium. Samples were collected from the receiver chamber after 30, 60, 90, 120, and 150 min. During the experiments, each sampling volume (300 μL) was replaced by an equal volume of blank transport medium. The relevant parameters were chosen according to previous research [30,40,41].
Samples collected from the receiver chamber were detected and the apparent permeability coefficients (Papp) were calculated. The absorption and transport of the drug in Caco-2 cell monolayer was evaluated by Papp. Propranolol and atenolol are typical drugs with high and low permeability on the Caco-2 cell monolayer. The Papp of propranolol and atenolol measured in this study were, respectively, (26.1 ± 1.2) × 10−6 and (0.48 ± 0.07) × 10−6 cm∙s−1, which was coincident with the literature [42,43].

4.7. Single-Pass Intestinal Perfusion Model

The rats were anaesthetized with an intra-abdominal injection of 10% chloral hydrate at a dose of 5 mL/kg. The enterocoelia of the rat was dissected by a 3–4 cm midline length, a segment of intestine about 10 cm long was separated and washed with saline. Silicone tubing was inserted into both sides of the segment of intestine and a peristaltic pump was connected to the proximal side of the tube. A pledget with saline was added onto the surgical area to avoid loss of fluid. The segment was cleared with 37 °C saline firstly, then blank K-R buffer solution was infused at the inlet and blank perfusate was collected at the outlet. The segment was infused with perfusate containing phenol red and different concentrations of sea cucumber saponins (1, 5, and 25 μg/mL) at a flow rate of 2 mL/min. Then the rate was reduced to 0.2 mL/min for 30 min until steady-state. Samples were obtained from the outlet of the segment every 15 min and stored at −20 °C for analysis. Different concentrations of sea cucumber saponins were perfused to highlight the absorption mechanism of sea cucumber saponins, which were investigated by the concentration-dependent change of the permeability values. 400 μg/mL verapamil was added to the perfusion solution containing 5 μg/mL sea cucumber saponins and 20 μg/mL phenol red to investigate whether the intestinal absorption of sea cucumber saponins were affected by P-gp. The relevant parameters were chosen according to previous researches [18,44].

4.8. Statistical Analysis

Each experiment was carried out more than three individual times. The differences of AUC and Cmax between Echinoside A and Holotoxin A1 after intravenous administration were assessed by a one-way analysis of variance (ANOVA) test using the SPSS (version 18.0, IBM SPSS Inc., Chicago, IL, USA). In the absorption transport experiment, two factor ANOVA for concentration and direction were used to compare the cumulative amounts in bidirectional transport. A pair-wise test was used to compare the Papp values of Echinoside A, Holotoxin A1, propranolol and atenolol. Differences were considered statistically significant at p < 0.05.

5. Conclusions

In this study, a highly-sensitive and effective HPLC method with evaporative light scattering detection was developed to determine sea cucumber saponins. This method was validated to confirm high accuracy, precision, and reproducibility. The method was successfully applied to the analysis in Caco-2 monolayer model, single-pass intestinal perfusion model, and in vivo pharmacokinetics in rats. The result indicated that Echinoside A showed higher bioavailability in rats than Holotoxin A1. In the Caco-2 monolayer model, the Papp value demonstrated efficient transport of Echinoside A and poor transport of Holotoxin A1, and the single-pass intestinal perfusion model confirmed high permeability of Echinoside A and poor permeability of Holotoxin A1. This study highlighted the absorption and transport of two sea cucumber saponin monomers, the relationship between the chemical structure of sea cucumber saponins and their bioavailability and the clinical application of sea cucumber saponins will be studied further in the future.

Acknowledgments

The research was funded by the National Natural Science Foundation of China (31171665) and the Fundamental Research Funds for the Central Universities.

Author Contributions

Zhihua Lv initiated the project. Yuanhong Wang and Tingfu Jiang designed and supervised the experimental work. Shuai Li performed the experimental work, collected and analyzed the data. Han Wang and Shuang Yang participated in the data analysis. Shuai Li was in charge of writing and checking the manuscript. All the authors read and approved the final manuscript.

Conflicts of Interest

The authors declare no conflict of interest.

References

  1. Caulier, G.; Dyck, S.V.; Gerbaux, P.; Eeckhaut, I.; Flammang, P. Review of saponin diversity in sea cucumbers belonging to the family Holothuriidae. SPC Beche-de-mer Inf. Bull. 2011, 31, 48–54. [Google Scholar]
  2. Kalinin, V.I.; Silchenko, A.S.; Avilov, S.A.; Stonik, V.A.; Smirnov, A.V. Sea cucumbers triterpene glycosides, the recent progress in structural elucidation and chemotaxonomy. Phytochem. Rev. 2005, 4, 221–236. [Google Scholar] [CrossRef]
  3. Sparg, S.G.; Light, M.E.; Staden, J.V. Biological activities and distribution of plant saponins. J. Ethnopharmacol. 2004, 94, 219–243. [Google Scholar] [CrossRef] [PubMed]
  4. Park, J.I.; Bae, H.R.; Kim, C.G.; Stonik, V.A.; Kwak, J.Y. Relationships between chemical structures and functions of triterpene glycosides isolated from sea cucumbers. Front. Chem. 2014, 2, 77–90. [Google Scholar] [CrossRef] [PubMed]
  5. Han, H.; Yi, Y.H.; Li, L.; Wang, X.H.; Liu, B.S.; Sun, P.; Pan, M.X. A new triterpene glycoside from sea cucumber Holothuria leucospilotal. Chin. Chem. Lett. 2007, 18, 161–164. [Google Scholar] [CrossRef]
  6. Bordbar, S.; Anwar, F.; Saari, N. High-Value Components and Bioactives from Sea Cucumbers for Functional Foods—A Review. Mar. Drugs 2011, 9, 1761–1805. [Google Scholar] [CrossRef] [PubMed]
  7. Kitagawa, I.; Sugawara, T.; Yosioka, I.; Kuriyama, K. Saponin and sapogenol. XV. Antifungal glycosides from the sea cucumber Stichopus japonicus selenka (2). Structures of holotoxin A and holotoxin B. Chem. Pharm. Bull. 1976, 24, 275–284. [Google Scholar] [CrossRef] [PubMed]
  8. Zou, Z.R.; Yi, Y.H.; Wu, H.M.; Wu, J.H.; Liaw, C.C.; Lee, K.H. Intercedensides AC, three new cytotoxic triterpene glycosides from the sea cucumber Mensamaria intercedens Lampert. J. Nat. Prod. 2003, 66, 1055–1060. [Google Scholar] [CrossRef] [PubMed]
  9. Kalinin, V.I.; Prokofieva, N.G.; Likhatskaya, G.N.; Schentsova, E.B.; Agafonova, I.G.; Avilov, S.A.; Drozdova, O.A. Hemolytic activities of triterpene glycosides from the holothurian order Dendrochirotida: Some trends in the evolution of this group of toxi. Toxicon 1996, 34, 475–483. [Google Scholar] [CrossRef]
  10. Han, H.; Yi, Y.H.; Li, L.; Liu, B.S.; La, M.P.; Zhang, H.W. Antifungal active triterpene glycosides from sea cucumber Holothuria scabra. Acta Pharm. Sin. 2009, 44, 620–624. [Google Scholar]
  11. Aminin, D.L.; Agafonova, I.G.; Berdyshev, E.V.; Isachenko, E.G.; Avilov, S.A.; Stonik, V.A. Immunomodulatory properties of cucumariosides from the edible Far-Eastern holothurian Cucumaria japonica. J. Med. Food 2001, 4, 127–135. [Google Scholar] [CrossRef] [PubMed]
  12. Kerr, R.G.; Chen, Z. In vivo and in vitro biosynthesis of saponins in sea cucumbers. J. Nat. Prod. 1995, 58, 172–176. [Google Scholar] [CrossRef] [PubMed]
  13. Prokof'eva, N.G.; Chaikina, E.L.; Kicha, A.A.; Ivanchina, N.V. Biological activities of steroid glycosides from starfish. Comp. Biochem. Physiol. B Biochem. Mol. Biol. 2003, 134, 695–701. [Google Scholar] [CrossRef]
  14. Popov, A.M. Comparative study of the hemolytic and cytotoxic activities of Triterpenoids isolated from Ginseng and Sea Cucumbers. Biolchemisty 2002, 29, 120–128. [Google Scholar]
  15. Zakeri-Milani, P.; Valizadeh, H.; Tajerzadeh, H. Predicting human intestinal permeability using single-pass intestinal perfusion in rat. J. Pharm. Sci. 2007, 10, 368–379. [Google Scholar]
  16. Hillgren, K.M.; Kato, A.; Borechard, R.T. In vitro systems for studying intestinal drug absorption. Med. Res. Rev. 1995, 15, 83–109. [Google Scholar] [CrossRef] [PubMed]
  17. Salphati, L.; Childers, K.; Pan, L.; Tsutsui, K.; Takahashi, L. Evaluation of a single-pass intestinal perfusion method in rat for the prediction of absorption in man. J. Pharm. Pharmacol. 2001, 53, 1007–1013. [Google Scholar] [CrossRef] [PubMed]
  18. Cook, T.J.; Shenoy, S.S. Intestinal permeability of chlorpyrifos using a single-pass intestinal perfusion method in the rat. Toxicology 2003, 184, 125–133. [Google Scholar] [CrossRef]
  19. Murota, K.; Shimizu, S.; Miyamoto, S.; Izumi, T.; Obata, A.; Kikuchi, M.; Terao, J. Unique uptake and transport of isoflavone aglycones by human intestinal Caco-2 cells: Comparison of isoflavonoids and flavonoids. J. Nutr. 2002, 132, 1956–1961. [Google Scholar] [PubMed]
  20. Walter, E.; Kissel, T.; Raddatz, P. Transport of peptidomimetic renin inhibitors across monolayers of a human intestinal cell line (Caco-2): Evidence for self-enhancement of paracellular transport route. Pharm. Res. 1995, 12, 1801–1805. [Google Scholar] [CrossRef] [PubMed]
  21. Fossati, L.; Dechaume, R.; Hardillier, E.; Chevillon, D.; Prevost, C.; Bolze, S.; Maubon, N. Use of simulated intestinal fluid for Caco-2 permeability assay of lipophilic drugs. Int. J. Pharm. 2008, 360, 148–155. [Google Scholar] [CrossRef] [PubMed]
  22. Borlak, J.; Zwadlo, C. Expression of drug-metabolizing enzymes, nuclear transcription factors and ABC transporters in Caco-2 cells. Xenobiotica 2003, 33, 927–943. [Google Scholar] [CrossRef] [PubMed]
  23. Maubon, N.; Vee, M.L.; Fossati, L.; Audry, M.; Ferrec, E.L.; Bolze, S.; Fardel, O. Analysis of drug transporter expression in human intestinal Caco-2 cells by real-time PCR. Fundam. Clin. Pharm. 2007, 21, 659–663. [Google Scholar] [CrossRef] [PubMed]
  24. Taylor, D.C. Animal models for oral drug delivery in man: In situ and in vivo approaches. J. Pharm. Sci. 1984, 73, 1676. [Google Scholar] [CrossRef]
  25. Sutton, S.C.; Rinaldi, M.T.S.; Vukovinsky, K.E. Comparison of the Gravimetric, Phenol Red, and 14C-PEG-3350 Methods to Determine Water Absorption in the Rat Single-Pass Intestinal Perfusion Model. AAPS Pharm. Sci. 2001, 3, 93–97. [Google Scholar] [CrossRef]
  26. Hu, J.; Reddy, M.B.; Hendrich, S.; Murphy, P.A. Soyasaponin I and sapongenol B have limited absorption by Caco-2 intestinal cells and limited bioavailability in women. J. Nutr. 2004, 134, 1867–1873. [Google Scholar] [PubMed]
  27. Han, M.; Han, L.M.; Wang, Q.S.; Bai, Z.H.; Fang, X.L. Mechanism of oral absorption of panaxnotoginseng saponins. Acta Pharm. Sin. 2006, 41, 498–505. [Google Scholar]
  28. Hill, R.A.; Connolly, J.D. Triterpenoids. Nat. Prod. Rep. 2012, 29, 780–818. [Google Scholar] [CrossRef] [PubMed]
  29. Walgren, R.A.; Walle, U.K.; Walle, T. Transport of quercetin and its glucosides across human intestinal epithelial Caco-2 cells. Biochem. Pharmacol. 1998, 55, 1721–1727. [Google Scholar] [CrossRef]
  30. Artursson, P. Epithelial transport of drugs in cell culture. I: A model for studying the passive diffusion of drugs over intestinal absorbtive (Caco2) cells. J. Pharm. Sci. 1990, 79, 476–482. [Google Scholar] [CrossRef] [PubMed]
  31. Lu, S.; Gough, A.W.; Bobrowski, W.F.; Stewart, B.H. Transport properties are not altered across Caco-2 cells with heightened TEER despite underlying physiological and ultrastructural changes. J. Pharm. Sci. 1996, 85, 270–273. [Google Scholar] [CrossRef] [PubMed]
  32. Levitt, M.D.; Kneip, J.M.; Levitt, D.G. Use of laminar flow and unstirred layer models to predict intestinal absorption in the rat. J. Clin. Investig. 1988, 81, 1365–1369. [Google Scholar] [CrossRef] [PubMed]
  33. Artursson, P.; Karlsson, J. Correlation between oral drug absorption in humans and apparent drug permeability coefficients in human intestinal epithelial (Caco-2) cells. Biochem. Biophys. Res. Commun. 1991, 175, 880–885. [Google Scholar] [CrossRef]
  34. Lau, Y.Y.; Chen, Y.H.; Liu, T.T. Evaluation of a novel in vitro Caco-2 hepatocyte hybrid system for predicting in vivo oral bioavailability. Drug Metab. Dispos. 2004, 32, 937–942. [Google Scholar] [PubMed]
  35. Caulier, G.; Flammang, P.; Rakotoarisoa, P. Preservation of the bioactive saponins of Holothuria scabra through the processing of trepang. Cah. Biol. Mar. 2013, 54, 685–690. [Google Scholar]
  36. Zhang, R.; Wang, Y.H.; Liu, Y.F.; Yang, J.; Jiang, T.F.; Lv, Z.H. Isolation, preparation and analysis of triterpene glycoside Holotoxin A1 in Apostichopus japonicus. Chin. J. Mar. Drugs 2013, 32, 8–14. [Google Scholar]
  37. Li, M.F.; Zhao, Z.X.; Lin, C.Z. Pharmacokinetic Studies of llexsaponin A1 in Rats. Tradit. Chin. Drug Res. Clin. Pharmacol. 2011, 22, 187–189. [Google Scholar]
  38. Odani, T.; Tanizawa, H.; Takino, Y. Studies on the absorption, distribution, excretion and metabolism of ginseng saponins. II. The absorption, distribution and excretion of ginsenoside Rg1 in the rat. Chem. Pharm. Bull. 1964, 14, 189–192. [Google Scholar] [CrossRef]
  39. Lin, L.; Liu, J.X.; Zhang, Y. Pharmacokinetic Studies of Ginsenoside Rg1, Re, Rb1 and Rd in Rats by LC-MS/MS Method. Chin. Pharm. J. 2009, 373–377. [Google Scholar]
  40. Cattoor, K.; Bracke, M.; Deforce, D. Transport of Hop Bitter Acids across Intestinal Caco-2 Cell Monolayers. J. Agric. Food Chem. 2010, 58, 4132–4140. [Google Scholar] [CrossRef] [PubMed]
  41. Palmgrén, J.J.; Mönkkönen, J.; Jukkola, E. Characterization of Caco-2 cell monolayer drug transport properties by cassette dosing using UV/fluorescence HPLC. Eur. J. Pharm. Biopharm. 2004, 57, 319–328. [Google Scholar] [CrossRef] [PubMed]
  42. Laurent, C.; Besançon, P.; Caporiccio, B. Flavonoids from a grape seed extract interact with digestive secretions and intestinal cells as assessed in an in vitro digestion/Caco-2 cell culture model. Food Chem. 2007, 100, 1704–1712. [Google Scholar] [CrossRef]
  43. Lennernäs, H.; Palm, K. Comparison between active and passive drug transport in human intestinal epithelial (caco-2) cells in vitro and human jejunum in vivo. Int. J. Pharm. 1996, 127, 103–107. [Google Scholar] [CrossRef]
  44. Song, N.N.; Li, Q.S.; Liu, C.X. Intestinal permeability of metformin using single-pass intestinal perfusion in rats. World J. Gastroenterol. 2006, 12, 4064–4070. [Google Scholar] [CrossRef] [PubMed]
Figure 1. ESI-MS spectra of Echinoside A in negative mode.
Marinedrugs 14 00114 g001
Figure 2. Chemical structure of Holotoxin A1.
Marinedrugs 14 00114 g002
Figure 3. Chemical structure of Echinoside A.
Marinedrugs 14 00114 g003
Figure 4. HPLC-chromatogram of Echinoside A and Holotoxin A1.
Marinedrugs 14 00114 g004
Figure 5. (a) Plasma concentrations-time curves of Echinoside A after oral administration; (b) plasma concentrations-time curves of Echinoside A after intravenous administration; and (c) plasma concentrations-time curves of Holotoxin A1 after intravenous administration. (means ± SD, n = 5).
Marinedrugs 14 00114 g005
Figure 6. (a) AP-to-BL transport of different concentration of Echinoside A across Caco-2 monolayers; and (b) BL-to-AP transport of different concentration of Echinoside A across Caco-2 monolayers, (means ± SD, n = 3).
Marinedrugs 14 00114 g006
Figure 7. Papp (AP to BL) value of Echinoside A, Holotoxin A1 and two transcellular transport markers, propranolol and atenolol, (means ± SD, n = 5). * p < 0.05, compared with propranolol; # p < 0.05, compared with atenolol.
Marinedrugs 14 00114 g007
Figure 8. Peff values of Echinoside A and Holotoxin A1 at 1, 5, 25 μg/mL, as well as 50 μg/mL with the addition of verapamil using single-pass intestinal perfusion (means ± SD, n = 5).
Marinedrugs 14 00114 g008
Table 1. 1H NMR and 13C NMR data for the aglycone moiety of Echinoside A.
PositionδCδH (J in Hz)PositionδCδH (J in Hz)
136.9 t1.54 m1537.2 t1.89 m
1.88 m1.42 m
227.6 t1.90 m1636.4 t2.37 d (11.7)
2.14 m2.70 m
389.2 d3.39 d (10.9)1789.8 s-
440.5s-18175.3 s-
553.2 d1.10 s1923.5 q1.28 s
621.7 t1.36 m2087.7 s-
1.54 m2123.6 q1.76 s
728.8 t1.54 m2239.5 t1.85 m
1.76 m2322.8 t1.80 m
841.4 d3.39 d (10.9)2440.2 t1.18 m
9154.5 s-2528.5 d1.54 m
1040.2 s-2623.2 q0.86 s
11116.1 d5.63 d (4.2)2723.3 q0.87 m
1271.8 d5.05 m3028.5 q1.28 s
1359.1 s-3117.2 q1.13 s
1446.9 s-3220.6 q1.70 s
Table 2. 1H NMR and 13C NMR data for the sugar moiety of Echinoside A.
PositionδCδH (J in Hz)PositionδCδH (J in Hz)
Xyl--Glc--
1105.84.711105.54.96
283.84.02272.24.02
376.24.26388.43.88
474.45.12465.34.23
562.8 t3.67576.94.26
4.40661.3 t4.30
---4.55
Qui--MeGlc--
1105.95.051106.25.32
274.54.02276.34.02
375.64.17389.84.23
487.93.75470.44.19
571.93.75578.53.88
618.71.72662.74.26
---OMe61.33.86
Table 3. Intra- and inter-day precision and accuracy of Echinoside A and Holotoxin A1 measurements in rat plasma (n = 5).
CompoundsNominal Conc. (ng/mL)Intra-DayInter-Day
Measured Conc. (mean ± S.D., ng/mL)Accuracy (R.E.%)Precision (R.S.D.%)Measured Conc. (mean ± S.D., ng/mL)Accuracy (R.E.%)Precision (R.S.D.%)
Echinoside A100.0095.60 ± 4.90−4.45.196.20 ± 5.08−3.25.3
1000.00985.92 ± 27.51−1.42.81023.65 ± 40.332.43.9
5000.004931.22 ± 94.00−1.41.95112.43 ± 71.882.21.4
Holotoxin A1100.00104.89 ± 7.604.97.2105.75 ± 4.095.83.9
1000.001029.80 ± 39.893.03.91030.41 ± 31.513.03.6
5000.004902.63 ± 114.78−2.02.34826.33 ± 87.15−3.51.8
Table 4. Absolute recovery of the method for determining the concentration of Echinoside A and Holotoxin A1 in plasma samples (n = 5).
CompoundsConcentration (ng/mL)Absolute Recovery (mean ± SD %)CV%
Echinoside A10091.30 ± 5.928.70
100094.74 ± 5.515.26
500095.66 ± 4.084.34
Holotoxin A110090.58 ± 6.729.42
100096.13 ± 4.553.87
500095.96 ± 4.804.04
Table 5. Stability of Echinoside A and Holotoxin A1 in rat plasma and perfusate (n = 5).
CompoundsNominal Conc. (ng/mL)Accuracy (%)
Freeze-Thaw StabilityShort-Term StabilityLong-Term Stability
PerfusatePlasmaPerfusatePlasmaPerfusatePlasma
Echinoside A100.0091.694.490.895.489.297.2
1000.0091.996.791.396.092.6102.1
5000.0093.598.994.4102.491.1100.3
Holotoxin A1100.0088.293.492.796.292.494.7
1000.0092.1101.490.999.391.398.6
5000.0094.398.093.896.594.899.6
Table 6. Pharmacokinetic parameters of Echinoside A and Holotoxin A1 after oral administration and intravenous administration (means ± SD, n = 5).
CompoundsAdministrationPharmacokinetic Parameters
T1/2 (h)Tmax (h)Cmax (µg/mL)AUC (h·μg/mL)
Echinoside Aoral6.9 ± 0.323.00.91 ± 0.029.27 ± 0.39
intravenous8.52 ± 0.320.084.0 ± 0.44 *16.43 ± 0.45 *
Holotoxin A1intravenous4.4 ± 0.060.082.87 ± 0.176.53 ± 0.15
* p < 0.05, compared with Holotoxin A1.
Table 7. Percentage of Echinoside A and Holotoxin A1 recovered in AP chambers, BL chambers, and cell monolayer (means ± SD, n = 5).
Time (min)Echinoside ARecoveryHolotoxin A1
AP Chamber (%)BL Chamber (%)Cell Fraction (%)AP Chamber (%)BL Chamber (%)Cell Fraction (%)
6082.14 ± 2.851.04 ± 0.1214.22 ± 1.1497.40 ± 2.7697.66 ± 2.02--
9081.63 ± 2.041.51 ± 0.1115.05 ± 1.2998.19 ± 1.9796.56 ± 1.89--
12080.25 ± 2.671.90 ± 0.2014.43 ± 1.2496.58 ± 2.3395.46 ± 1.72--
15079.38 ± 2.212.36 ± 0.2114.78 ± 0.9296.52 ± 2.0495.90 ± 2.27<0.2<0.2
Table 8. Values of apparent permeability coefficients (Papp) and efflux ratios in the absence and presence of verapamil (means ± SD, n = 5).
CompoundsPapp (× 10−6, cm·s−1)Efflux Ratio
AP-BLBL-AP
Echinoside A (20 μM)3.96 ± 0.555.38 ± 0.811.36 ± 0.17
Echinoside A (20 μM) + verapamil4.04 ± 0.395.33 ± 0.701.32 ± 0.16
Holotoxin A1 (18 μM)<0.83<0.83-
Holotoxin A1 (18 μM) + verapamil<0.83<0.83-

