2.1. Out-of-Plane Strain and Crystalline Structure
In agreement with the modeling of the magnetoelectric voltage coefficient in dependence of the volume fraction of the piezoelectric component in various lead-based and lead-free oxide composites [
1,
24], we have chosen the source target composition for our composite film growth by pulsed laser deposition (PLD) to be 67 wt % BaTiO
3 and 33 wt % BiFeO
3. The oxygen partial pressure during PLD was varied between 0.01 mbar and 0.5 mbar. As the growth rate of the composite films depends strongly on the oxygen partial pressure, it is natural that the film thickness of the samples is not uniform. We used several sample series for the results presented here (see the running sample numbers in
Table 1). In the last series (G5556–G5562), we tried to compensate for the changing growth rate by using different total numbers of laser pulses for the growth, resulting in reduced thickness variation from 208–388 nm only, instead of up to 1000 nm in the previous series. The substrate material of the films intended for X-ray diffraction (XRD) and ferroelectric and magnetoelectric measurements was SrTiO
3:Nb(001). For the STEM and SAED investigations only, films grown simultaneously on MgO(001) were used; see the Experimental Section for further insight into our growth regime. For oxygen-deficient weakly-Mn-doped ZnO thin films, we have recently measured the trigonal distortion of oxygen tetrahedra; see [
25]. Thus, lower oxygen partial pressure in PLD growth is clearly correlated to increasing density of oxygen vacancies. With that, we are able to correlate the ME coefficient to the oxygen deficiency of the composites and related structural properties.
Table 1.
X-ray diffraction (XRD) lattice parameters of SrTiO
3 substrates and BaTiO
3-BiFeO
3 composite films on SrTiO
3:Nb(001) at the indicated growth pressures p(O
2). Composite film thickness was determined at focused ion beam (FIB) cross-sections by scanning transmission electron microscopy (STEM) for one sample of each growth series.
c-lattice parameters were calculated from wide-angle 004 peaks. The bulk lattice parameters are as follows (nm): SrTiO
3:
a = 0.3905 (JCPDS 84-0444); BaTiO
3:
a = 0.39945,
c = 0.40335 (JCPDS 83–1880); BiFeO
3:
a = 0.3962 (JCPDS 73–0548). The out-of-plane strain values Δ
c/
c0 are calculated assuming an averaged bulk lattice parameter of the 67 wt % BaTiO
3-33 wt % BiFeO
3 composite of
c0 = 0.40099 nm. For visualization of the
cfilm and FWHM(ω) values, see
Figure 1b,
Figure 2 and
Figure 3, respectively. The accuracy of the lattice parameters is about ±0.0001 nm. Several samples for each growth pressure are included in the table to get an impression about the reproducibility of pulsed laser deposition (PLD) and the accuracy of lattice parameters. The sample numbers show which films were grown simultaneously (identical No.) or in consecutive PLD runs (successive No.), respectively.
Table 1.
X-ray diffraction (XRD) lattice parameters of SrTiO3 substrates and BaTiO3-BiFeO3 composite films on SrTiO3:Nb(001) at the indicated growth pressures p(O2). Composite film thickness was determined at focused ion beam (FIB) cross-sections by scanning transmission electron microscopy (STEM) for one sample of each growth series. c-lattice parameters were calculated from wide-angle 004 peaks. The bulk lattice parameters are as follows (nm): SrTiO3: a = 0.3905 (JCPDS 84-0444); BaTiO3: a = 0.39945, c = 0.40335 (JCPDS 83–1880); BiFeO3: a = 0.3962 (JCPDS 73–0548). The out-of-plane strain values Δc/c0 are calculated assuming an averaged bulk lattice parameter of the 67 wt % BaTiO3-33 wt % BiFeO3 composite of c0 = 0.40099 nm. For visualization of the cfilm and FWHM(ω) values, see Figure 1b, Figure 2 and Figure 3, respectively. The accuracy of the lattice parameters is about ±0.0001 nm. Several samples for each growth pressure are included in the table to get an impression about the reproducibility of pulsed laser deposition (PLD) and the accuracy of lattice parameters. The sample numbers show which films were grown simultaneously (identical No.) or in consecutive PLD runs (successive No.), respectively.
| p(O2) (mbar) | Sample No. | Thickness (nm) | csubstrate (nm) | cfilm (nm) | Strain (c − c0)/c0 | FWHM(ω) (°) |
|---|
| 0.01 | G 5084b | 730 | 0.39055 | 0.41030 | 2.322% | 0.127 |
| 0.01 | G 5084c | 730 | 0.39066 | 0.40991 | 2.224% | 0.125 |
| 0.1 | G 5085c | 488 | 0.39066 | 0.40708 | 1.519% | 0.109 |
| 0.1 | G 5562b | 208 | 0.39067 | 0.40767 | 1.666% | 0.734 * |
| 0.1 | G 5562d | 208 | 0.39081 | 0.40618 | 1.294% | 0.157 |
| 0.15 | G 5561b | 347 | 0.39067 | 0.40593 | 1.232% | 0.162 |
| 0.15 | G 5561d | 347 | 0.39069 | 0.40554 | 1.135% | 0.320 * |
| 0.2 | G 5560b | 365 | 0.39068 | 0.40403 | 0.758% | 0.131 |
| 0.25 | G 4728d | 285 | 0.39069 | 0.40103 | 0.010% | 0.237 |
| 0.25 | G 5559b | 388 | 0.39067 | 0.40168 | 0.172% | 0.272 |
| 0.325 | G 5558b | 352 | 0.39068 | 0.40148 | 0.122% | 0.303 |
| 0.4 | G 5557d | 311 | 0.39070 | 0.40148 | 0.122% | 0.354 |
| 0.5 | G 5086b | 1000 | 0.39056 | 0.40133 | 0.085% | 0.346 |
| 0.5 | G 5556b | 256 | 0.39068 | 0.40150 | 0.127% | 0.354 |
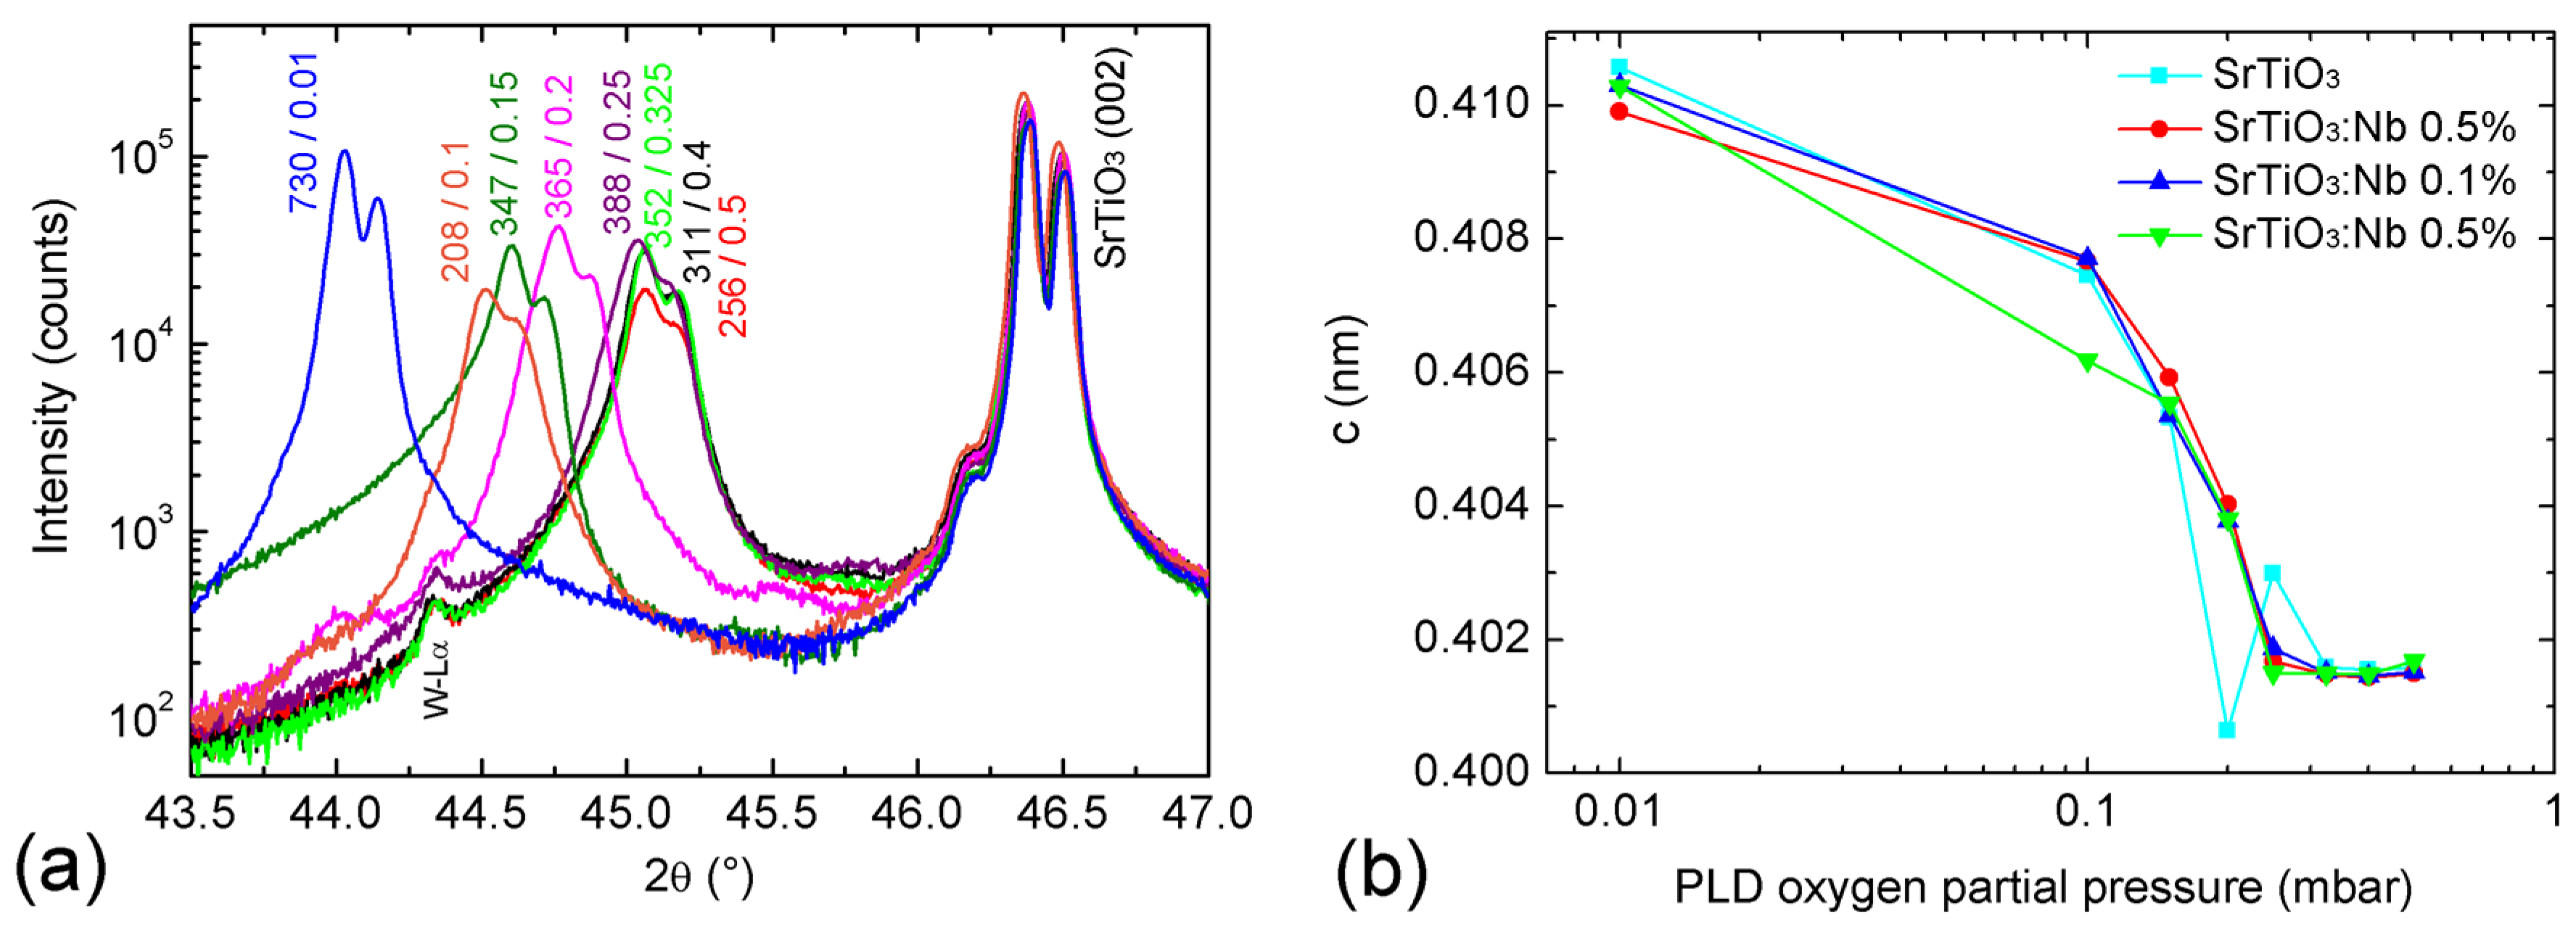
Figure 1a shows XRD 2θ-ω scans of the investigated BaTiO
3-BiFeO
3 composite films grown on SrTiO
3:Nb(001) single crystalline substrates around the 002 peaks.
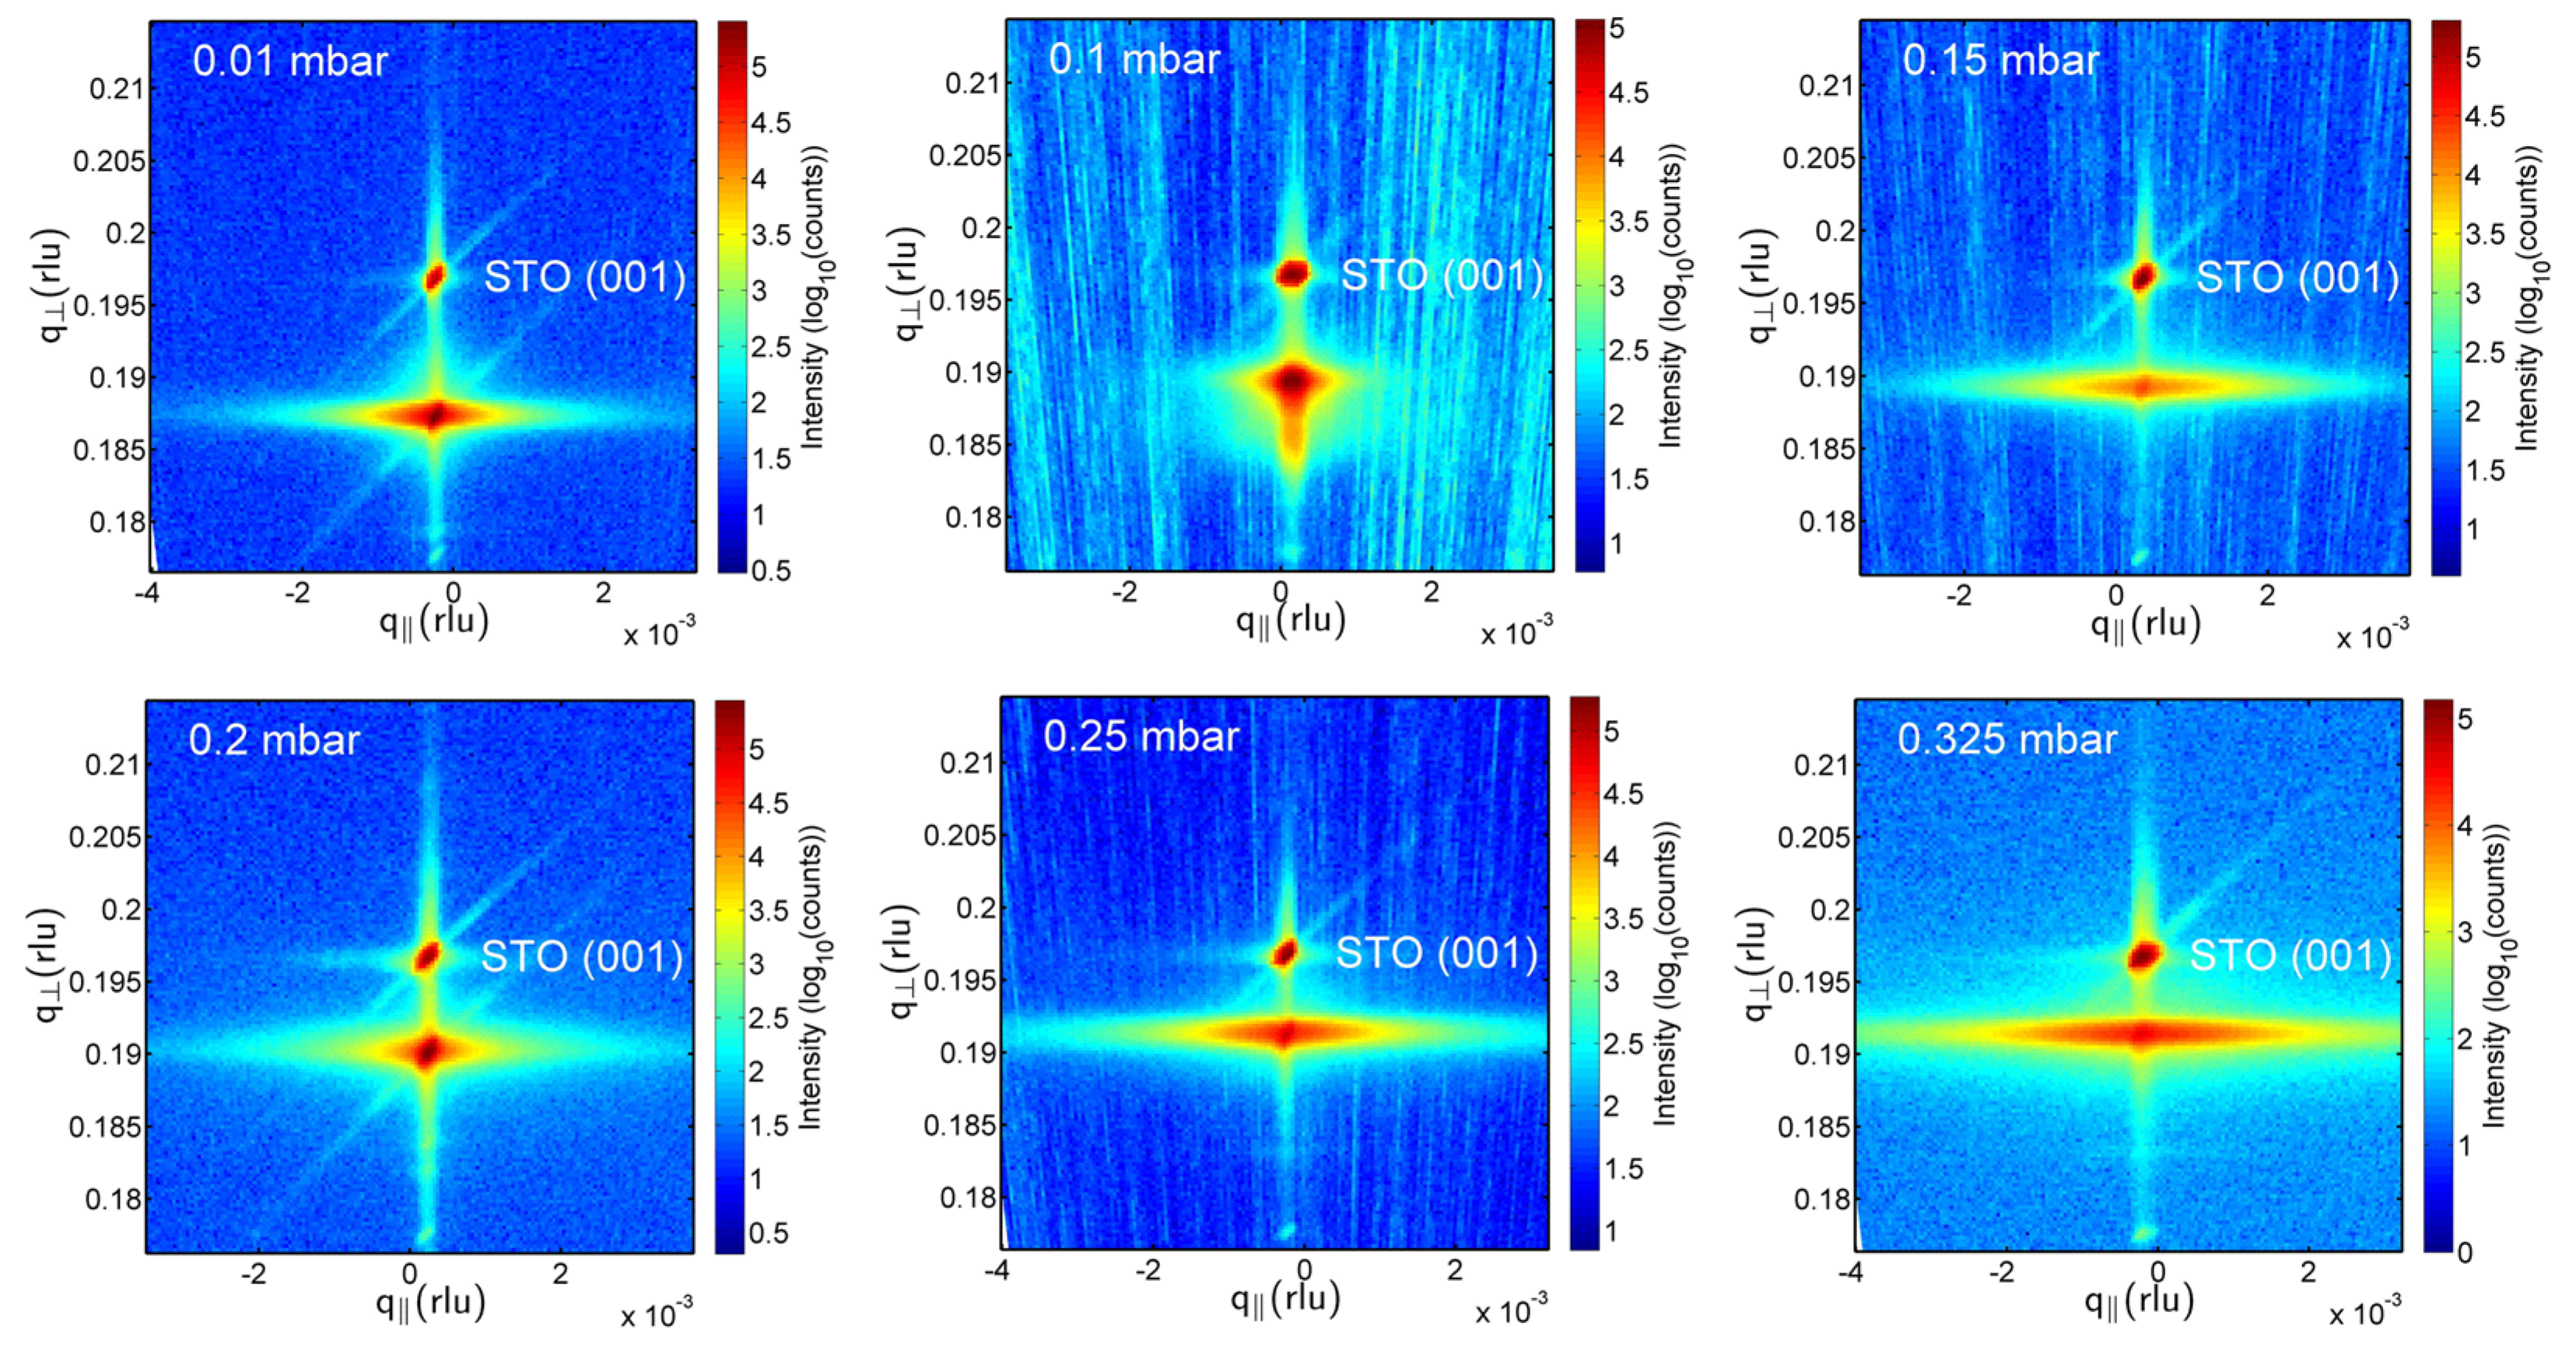
Figure 1a, as well as the 001 reciprocal space maps (RSMs) in
Figure 2 demonstrate the film peak shift to lower 2θ angles,
i.e., increasing out-of-plane lattice parameter with decreasing oxygen partial pressure. In
Figure 1b, the corresponding
c-lattice parameters as calculated from the positions of the 004 reflections of the films are plotted as depicted in
Figure S2 in the Supplementary Materials. We found that using 004 peaks for the calculation of
c values results in a smoother dependence on oxygen partial pressure in comparison to cos
2θ extrapolations with omission of 001 or 001 + 002 peaks. Due to the goniometer height error, the accuracy of lattice parameters calculated from low-θ peaks, such as 001 and 002, is not sufficient for a precise analysis. In addition to
Figure 2, the RSMs around the 001 peak in the
Supplementary Materials show the impact of the tilt mosaicity of the SrTiO
3 substrate on the composite film structure (
Figure S1); and the impact of a changed 33 wt %-67 wt % BaTiO
3-BiFeO
3 composite film composition instead of the generally used 67 wt %-33 wt % on the film mosaicity (
Figure S3).
Figure 1.
(
a) X-ray diffraction (XRD) 2θ-ω scans of BaTiO
3-BiFeO
3 composite thin films grown on SrTiO
3:Nb(001) at the indicated oxygen partial pressures. The two numbers at the film peaks indicate the total composite film thickness in nm, and the oxygen partial pressure during pulsed laser deposition (PLD) growth, respectively. Note the Kα
1/2 splitting of each peak. W-Lα is a spectral line from the X-ray tube. The single-phase contributions of BaTO
3 and BiFeO
3 cannot be resolved here; see
Table 1. (
b) PLD oxygen pressure evolution of the
c-axis lattice parameters calculated from 004 peaks of four BaTiO
3-BiFeO
3 composite thin films grown simultaneously for each growth pressure at the indicated substrates. See
Table 1 for the values of the c-lattice parameters and more structural details.
Figure 2.
XRD reciprocal space maps around the symmetric SrTiO
3 001 peaks of BaTiO
3 (67 wt %)-BiFeO
3 (33 wt %) composite thin films grown at the indicated PLD oxygen partial pressures. The separation of a point-like substrate and a broadened composite film peak decreases with increasing oxygen partial pressure due to decreasing out-of-plane strain; see
Table 1. The horizontal broadening of film peaks is a measure of the tilt mosaicity of the composites. STO stands for SrTiO
3.
As the lattice parameters of BaTiO
3 and BiFeO
3 as bulk and thin films are very close together (see the Joint Committee on Powder Diffraction Standards (JCPDS) data in the caption of
Table 1), the XRD peaks of the BaTiO
3 and BiFeO
3 phases in our composites cannot be resolved. Even closer agreement of BaTiO
3 and BiFeO
3 lattice parameters is supported by [
26], reporting for BiFeO
3 in tetragonal
P4
mm symmetry
a = 0.3935 and
c = 0.3998 nm. Therefore, we assume an averaged out-of-plane lattice constant
c0 to get estimates about the average out-of-plane strain of the composite films; see
Table 1. A higher oxygen deficiency of the composite films results in increased out-of-plane strain. For a comparison, in our (BaTiO
3-BiFeO
3) × 15 superlattices, both phases could be separately detected by Rutherford backscattering spectrometry, XRD and STEM with nearly no intermixing at the interfaces [
11,
22].
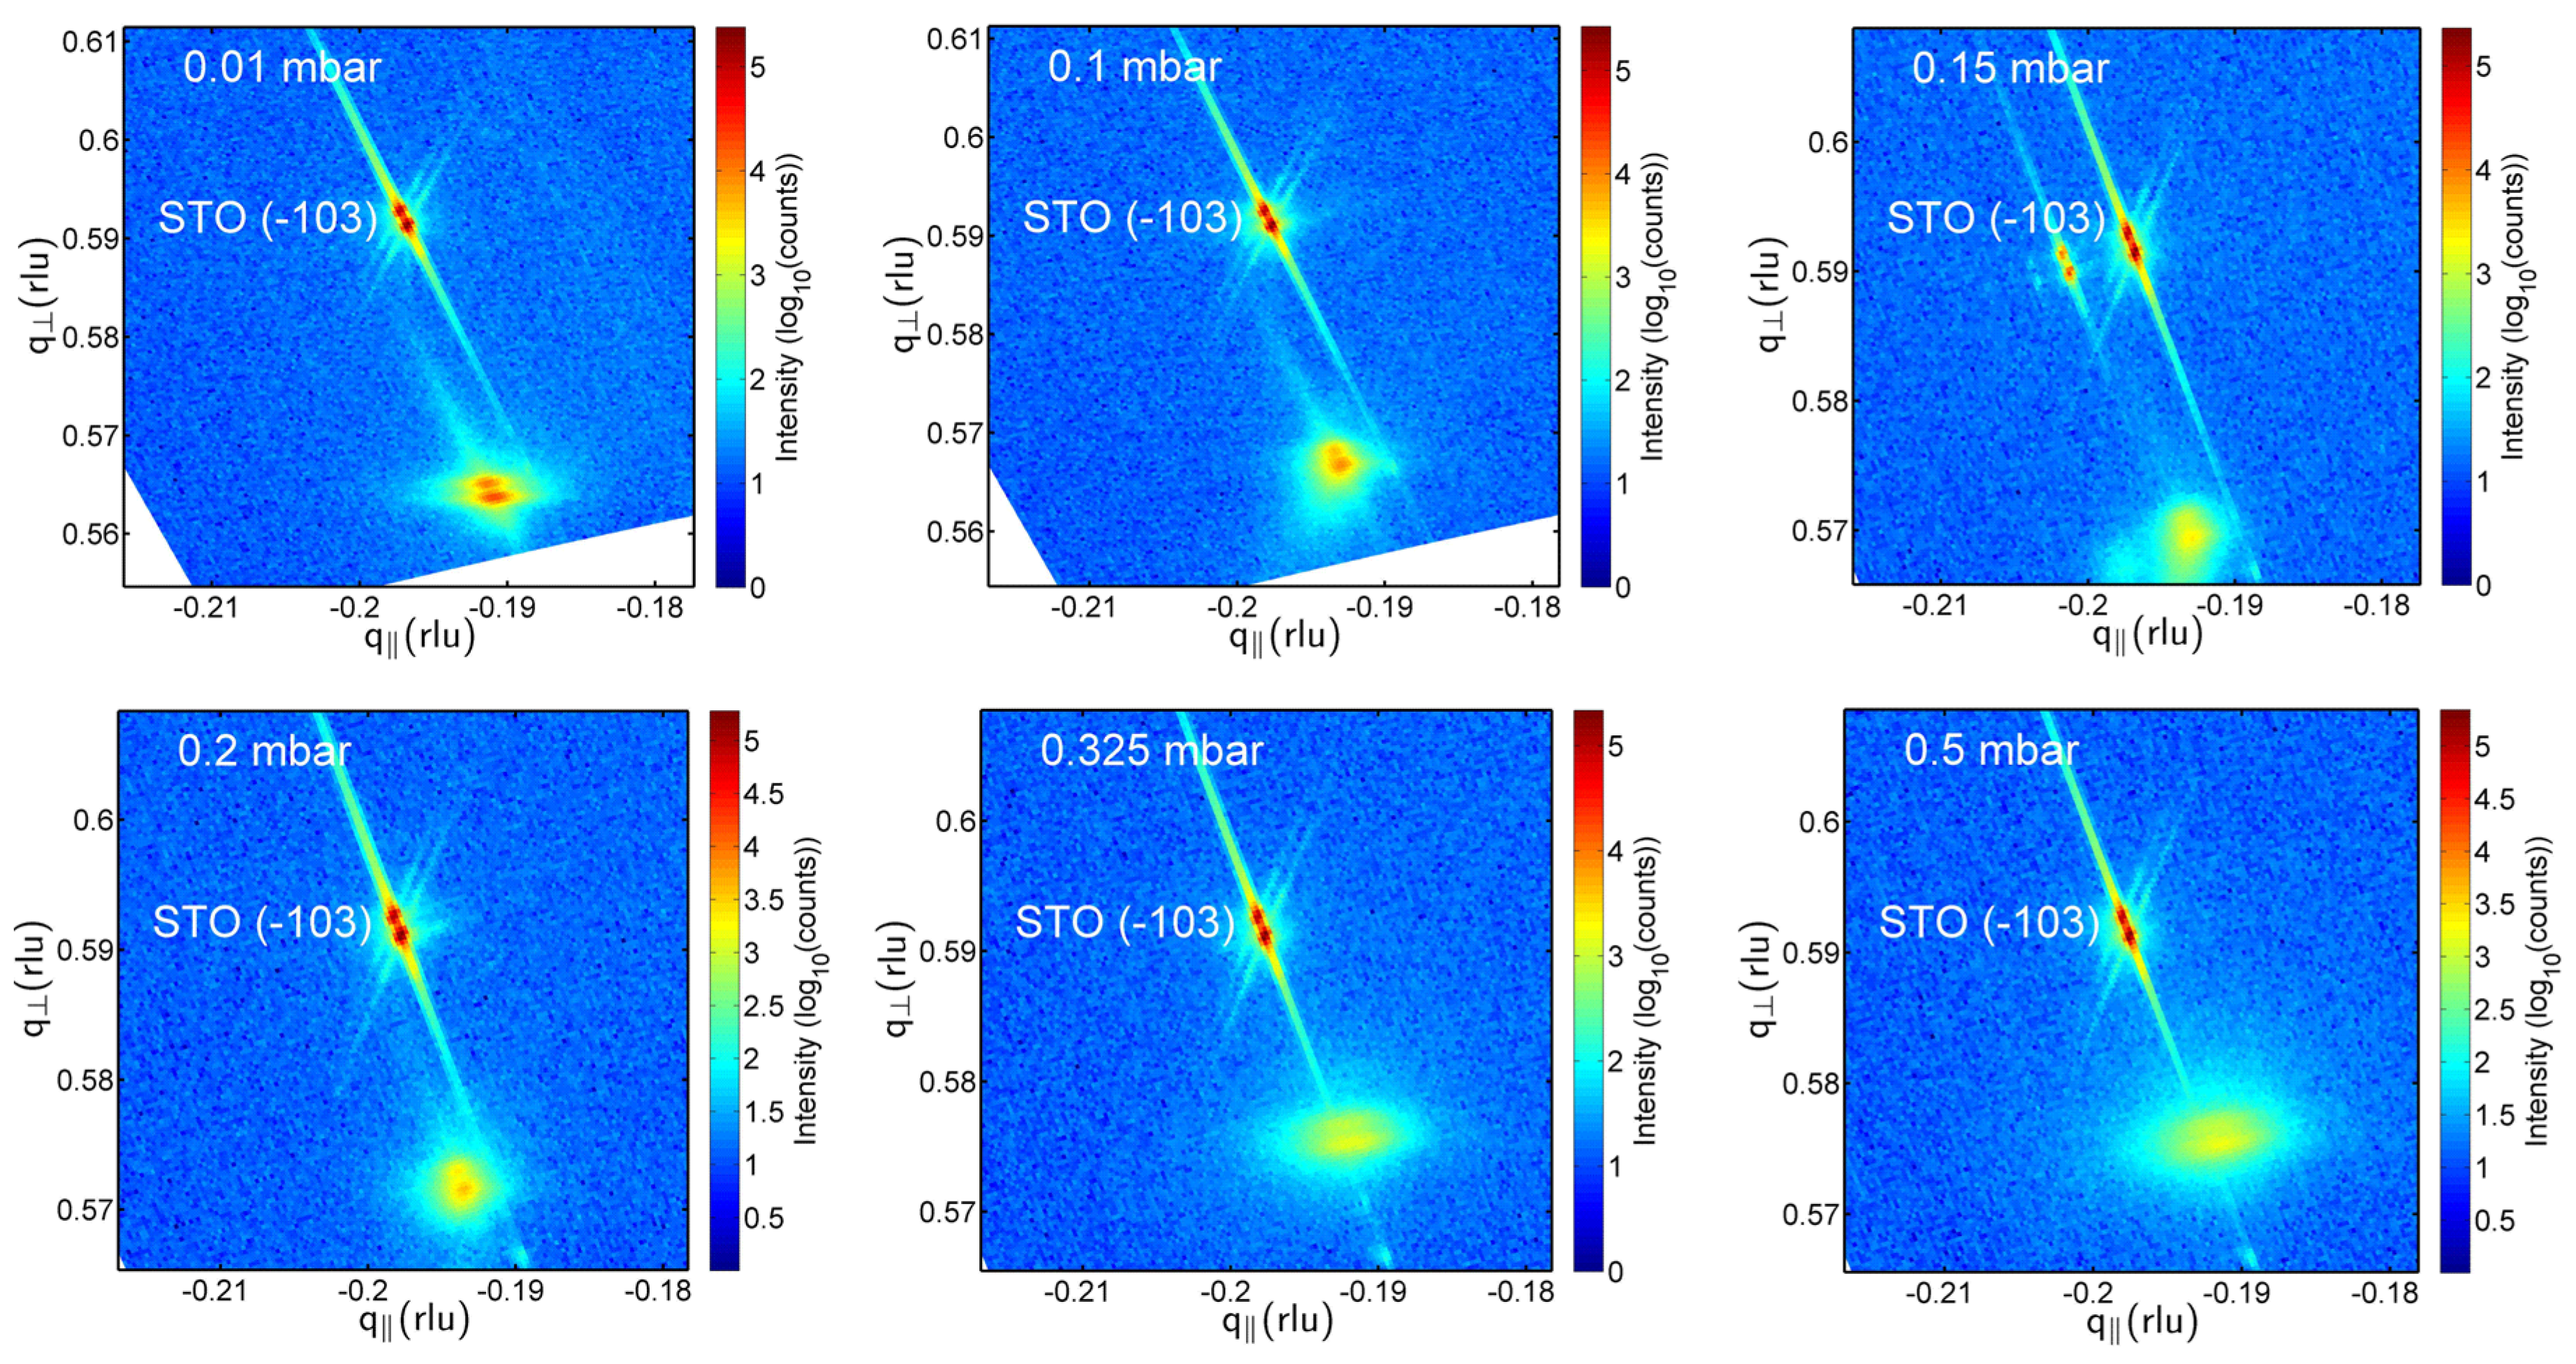
Figure 3 shows typical RSMs around the asymmetric
peaks of the composite films. As already visible in
Figure 2, the film peaks broaden both horizontally and vertically with increasing oxygen pressure,
i.e., the film mosaicity and the variation of film lattice parameter increases. This broadening is quantitatively expressed in
Table 1 by the FWHM(ω) values. From the increasing vertical misalignment of the film and substrate peaks with increasing growth pressure, we conclude an increasing film relaxation. That means that none of the grown composite films can be considered as in-plane lattice matched to the SrTiO
3:Nb substrates. The in-plane a-lattice parameters as calculated using
c004 (see
Table 1) and the
d-values extracted from the
RSM peaks scatter around 0.404 ± 0.005 nm. Because of the limited accuracy of these in-plane lattice parameters, statements about in-plane strain cannot be derived from these values.
Figure 3.
XRD reciprocal space maps around the asymmetric SrTiO3 substrate peaks (in the Figures referred to as STO (−103)) of the BaTiO3-BiFeO3 composite films grown at the indicated oxygen partial pressures. The lower intensity film peaks are at the bottom. With increasing oxygen pressure, the film peaks broaden, i.e., the composite mosaicity increases. However, film-to-substrate peak separation decreases. Note that the vertical q┴ axis for the two lowest pressures is enlarged. As is visible from the increasing vertical misalignment of film and substrate peaks with increasing growth pressure, the film relaxation increases. The 0.15-mbar sample shows substrate and corresponding crystalline film domains. The peak splitting is due to the Kα1/2 radiation used.
2.2. STEM and Oxygen Vacancy Superstructure
Two composite film samples grown on MgO(001) were investigated by STEM and SAED, namely one sample grown at 0.01 mbar (see
Figure 4 and
Figures S4–S7) and the other at 0.25 mbar (see
Figure 5 and
Figures S7–S10). Because these films on MgO were grown simultaneously with the samples on SrTiO
3 and SrTiO
3:Nb, we expect the microstructural features found here to be representative of all of our BaTiO
3-BiFeO
3 composite thin films.
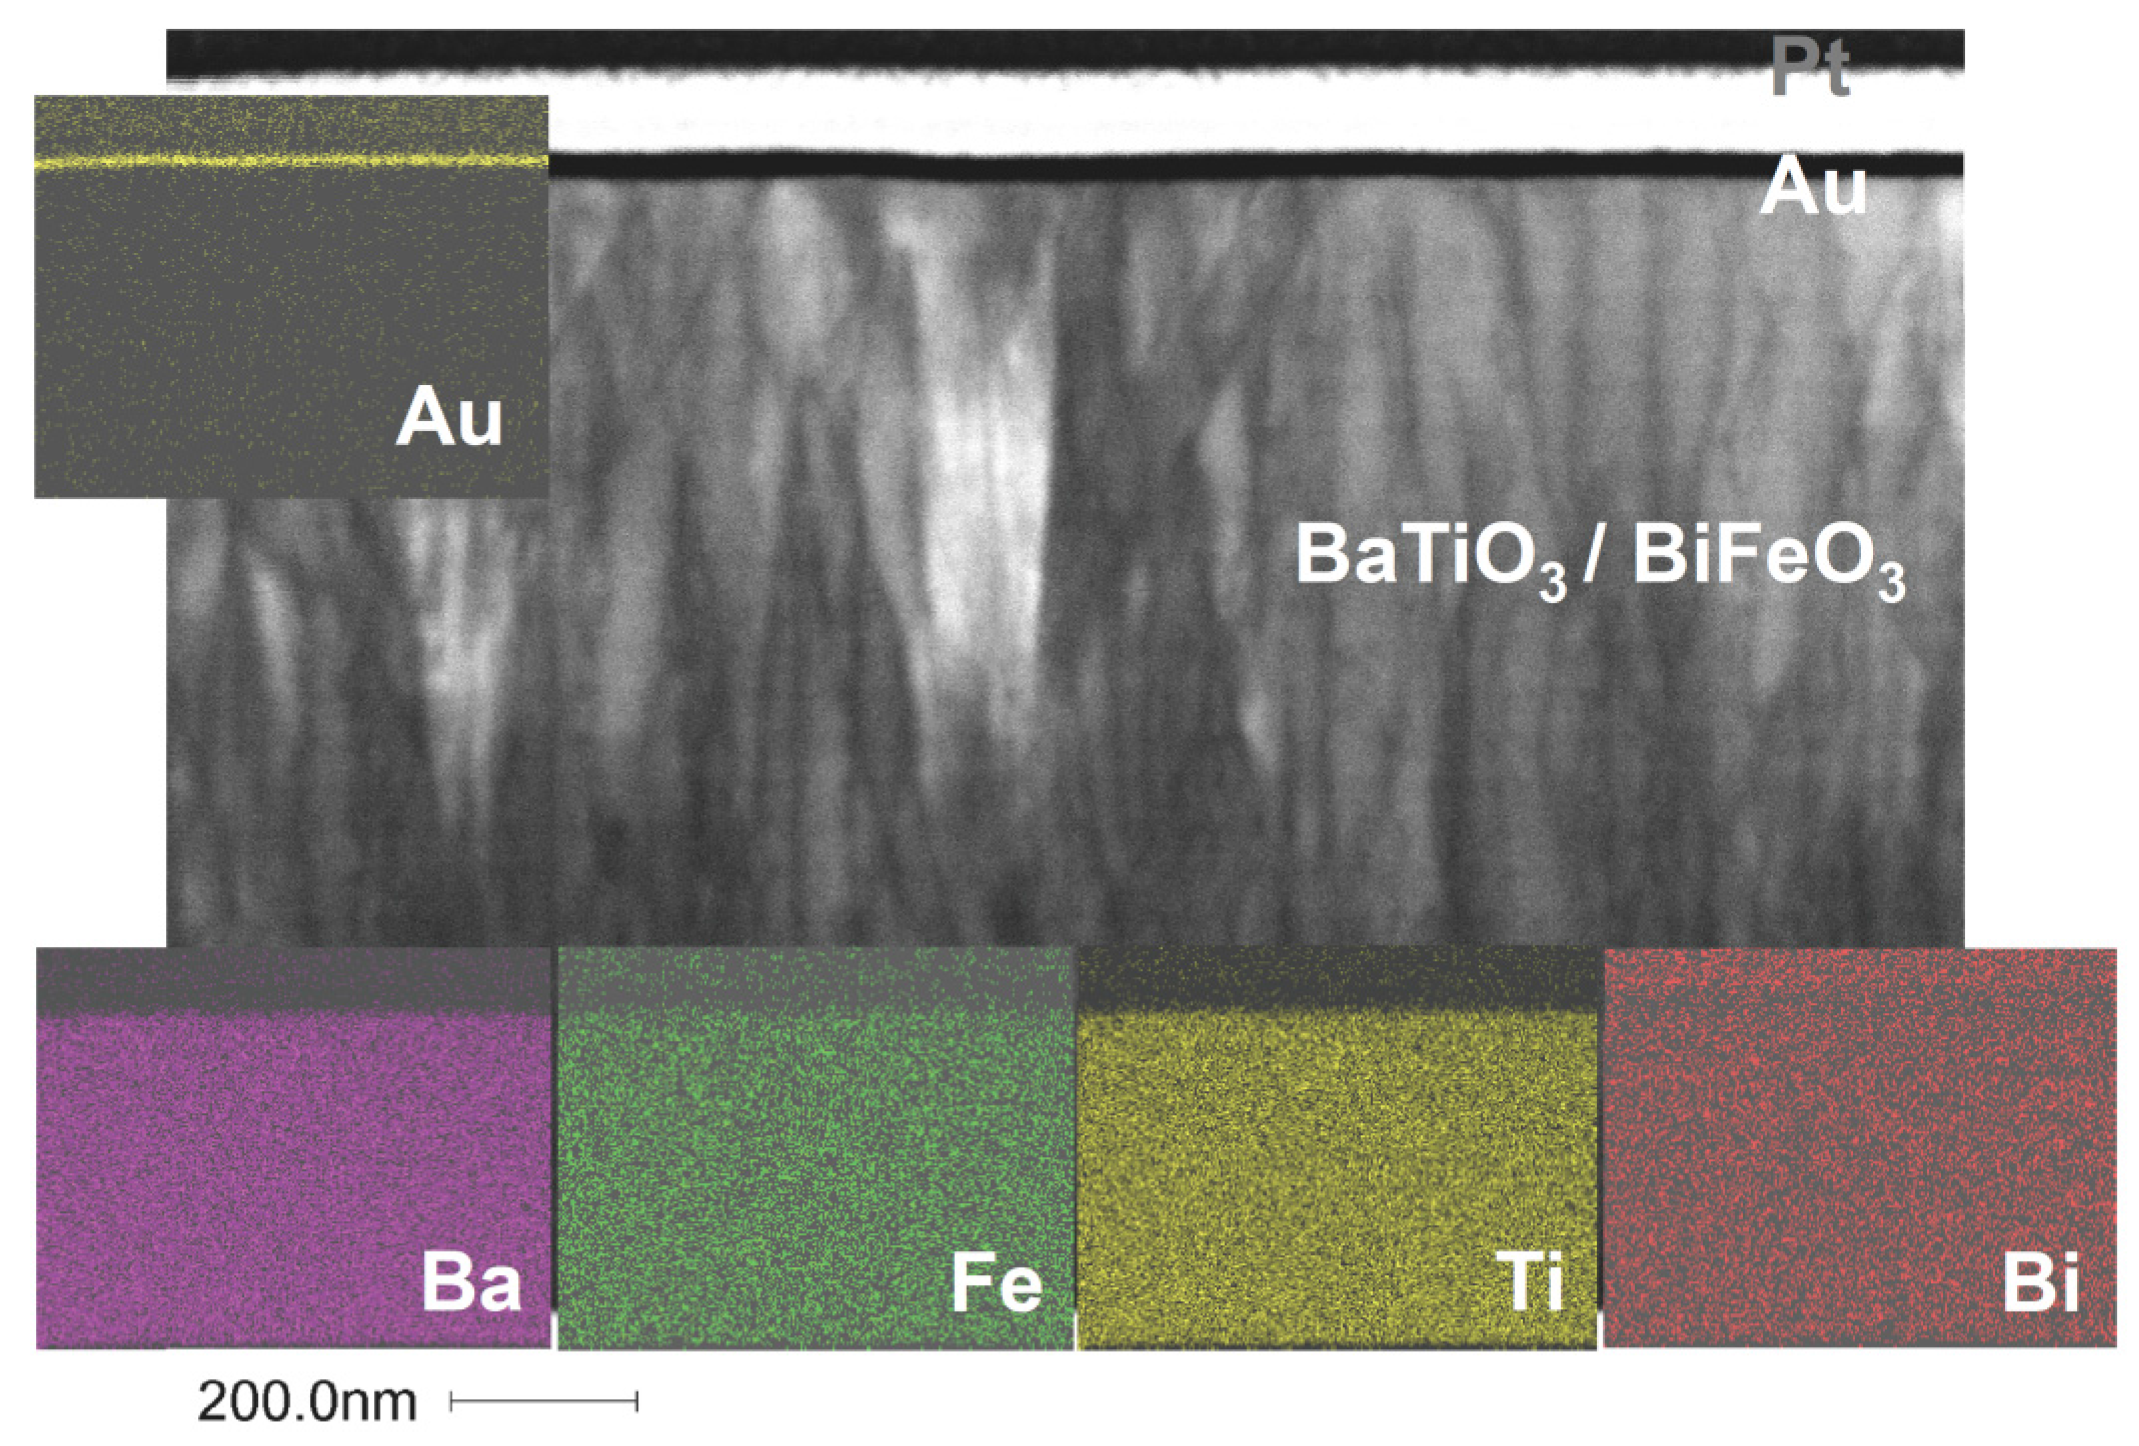
Figure 4 shows a bright-field STEM micrograph of a BaTiO
3-BiFeO
3 composite thin film grown at the lowest pressure of 0.01 mbar. It shows a high density of dislocation lines in the film. Energy dispersive X-ray spectroscopy (EDX) maps taken at the STEM cross-sections indicate a homogeneous elemental distribution of Ba, Ti, Bi and Fe in the composite film. On top of the composite film is a thin gold and a platinum layer (
Figure 4); see also
Figures S4 and S8 for STEM dark field images and EDX maps of the 0.25-mbar and the 0.01-mbar samples, respectively.
In the dark-field STEM image of a cross-section of a BaTiO
3-BiFeO
3 composite film grown at 0.25 mbar in
Figure 5, the columnar domains revealed by the grey scale contrast modulation reflect the different orientation of ordered oxygen vacancy layers,
i.e., (
) and/or (
). Probably, the small microstrain differences between these domains are responsible for the high magnetoelectric coefficients α
ME reported below.
Figure 4.
Scanning transmission electron microscopy (STEM) bright-field image of the BaTiO
3-BiFeO
3 composite film grown at 0.01 mbar oxygen pressure shown as the (110) cross-section. Clearly visible is the high density of dislocation lines in this particular composite film. The colored energy dispersive X-ray spectroscopy (EDX) maps demonstrate the homogeneous distribution of elements Ba, Fe, Ti and Bi in the plane of the cross-section. The gold film results from the extraction of the TEM cross-section out of the planar film sample using a focused ion beam. For more EDX maps and elemental analyses, see the
Supplementary Materials, Figures S4, S6, S8 and S9.
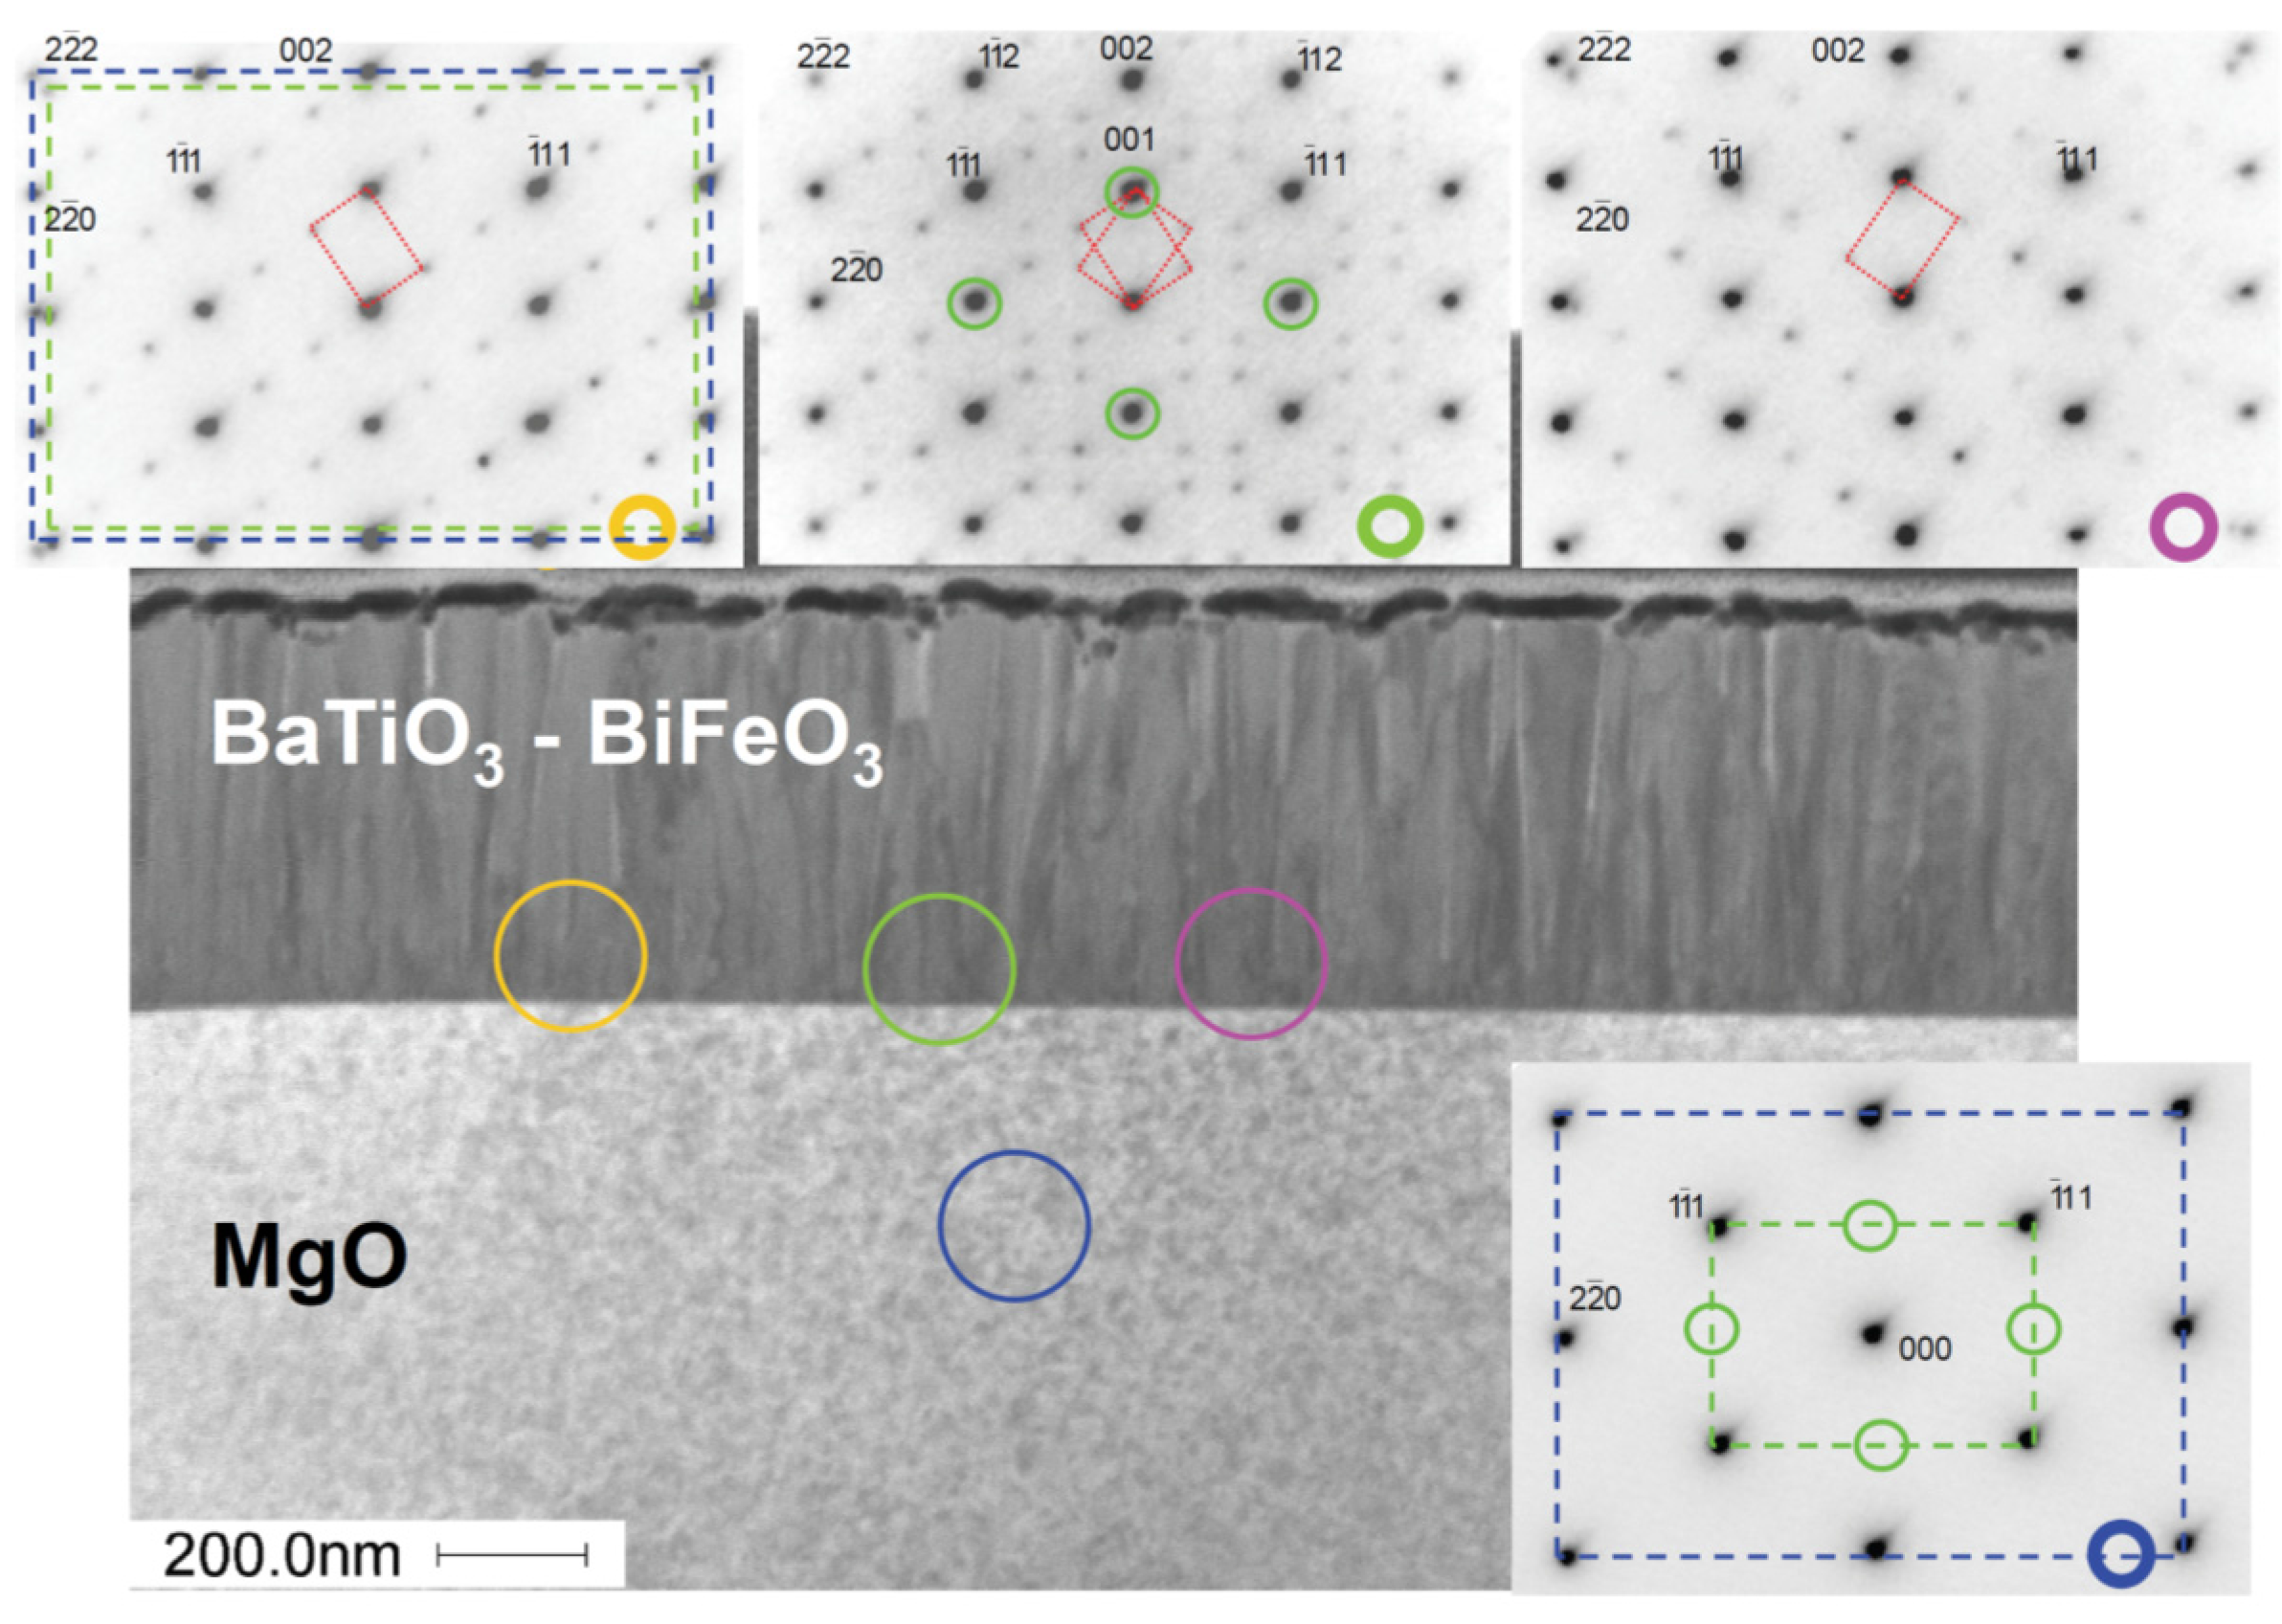
Figure 5.
STEM dark-field image of the BaTiO3-BiFeO3 composite film grown at 0.25 mbar on MgO(001) taken from the (110) cross-section. The four selected area electron diffraction (SAED) patterns have been taken from the encircled regions at the interface or the substrate. The main spots from the composite (green circles) confirm the BaTiO3-type structure of the composite film. These are forbidden for MgO, as seen bottom right. The additional weak spots in the composite indicate superstructure reflections that are probably due to oxygen vacancy ordering. The red dotted lines show the two possible orientations of oxygen vacancy ordering.
In
Figure 5 (top), in the SAED patterns, the main reflections indicate the BaTiO
3-type film structure of the 67 wt % BaTiO
3-33 wt % BiFeO
3 composite and the MgO structure of the substrate, which overlap. However, far away from the 000 reflection, a splitting appears due to small differences of the lattice parameters of MgO and BaTiO
3-BiFeO
3 composite film (see the blue and green frame in
Figure 5, top left). Upon closer inspection of the film patterns in
Figure 5, additional weaker reflections at ±⅓(
hkl)
pseudocubic become visible, which indicate a superstructure with three-times the BaTiO
3-BiFeO
3 composite lattice parameter (
Table 1). The superstructure clearly appears in two orientations, tilted left and right, and at some position, both orientations are observed simultaneously, such as in
Figure 5, top center. The origin of the superstructure may be the same oxygen vacancy ordering, which is known from BaTiO
3 grown in a reduced environment [
27]. If the structural data (space group
P3
m1; see [
27]) for such a “reduced BaTiO
3” were used for SAED simulation, exactly the same pattern (also the weak reflections) appears at the same positions as seen experimentally. In “reduced BaTiO
3”, every third of the hexagonal anion layers stacked along the pseudocubic <111> direction corresponds to a plane of ordered oxygen vacancies,
i.e., it remains “empty” [
27].
Several other types of perovskite superstructures have been discussed by Glazer [
28] in order to explain additional weak reflections. Those in the SAED patterns shown in
Figure 5 are consistent with the structure model shown in
Figure 6. In addition, the oxygen vacancies involve the reduction of Ti
4+ to Ti
3+ as a consequence of charge neutrality, which is corroborated by electron energy loss spectroscopy [
27]. Consistent with simple bond-valence considerations, the Ti
3+ ions should be located in the incomplete oxygen atom octahedra. Thus, oxygen defects lead to ordered dipoles.
Figures S5 and S7 in the Supplementary Materials show STEM and SAED images of the corresponding 0.01 mbar sample. There seems to be an indication of visually more intense oxygen superstructure reflections of the sample grown with higher oxygen deficiency,
i.e., at a lower pressure of 0.01 mbar.
Figure S7 provides a direct comparison of these SAED images of both samples.
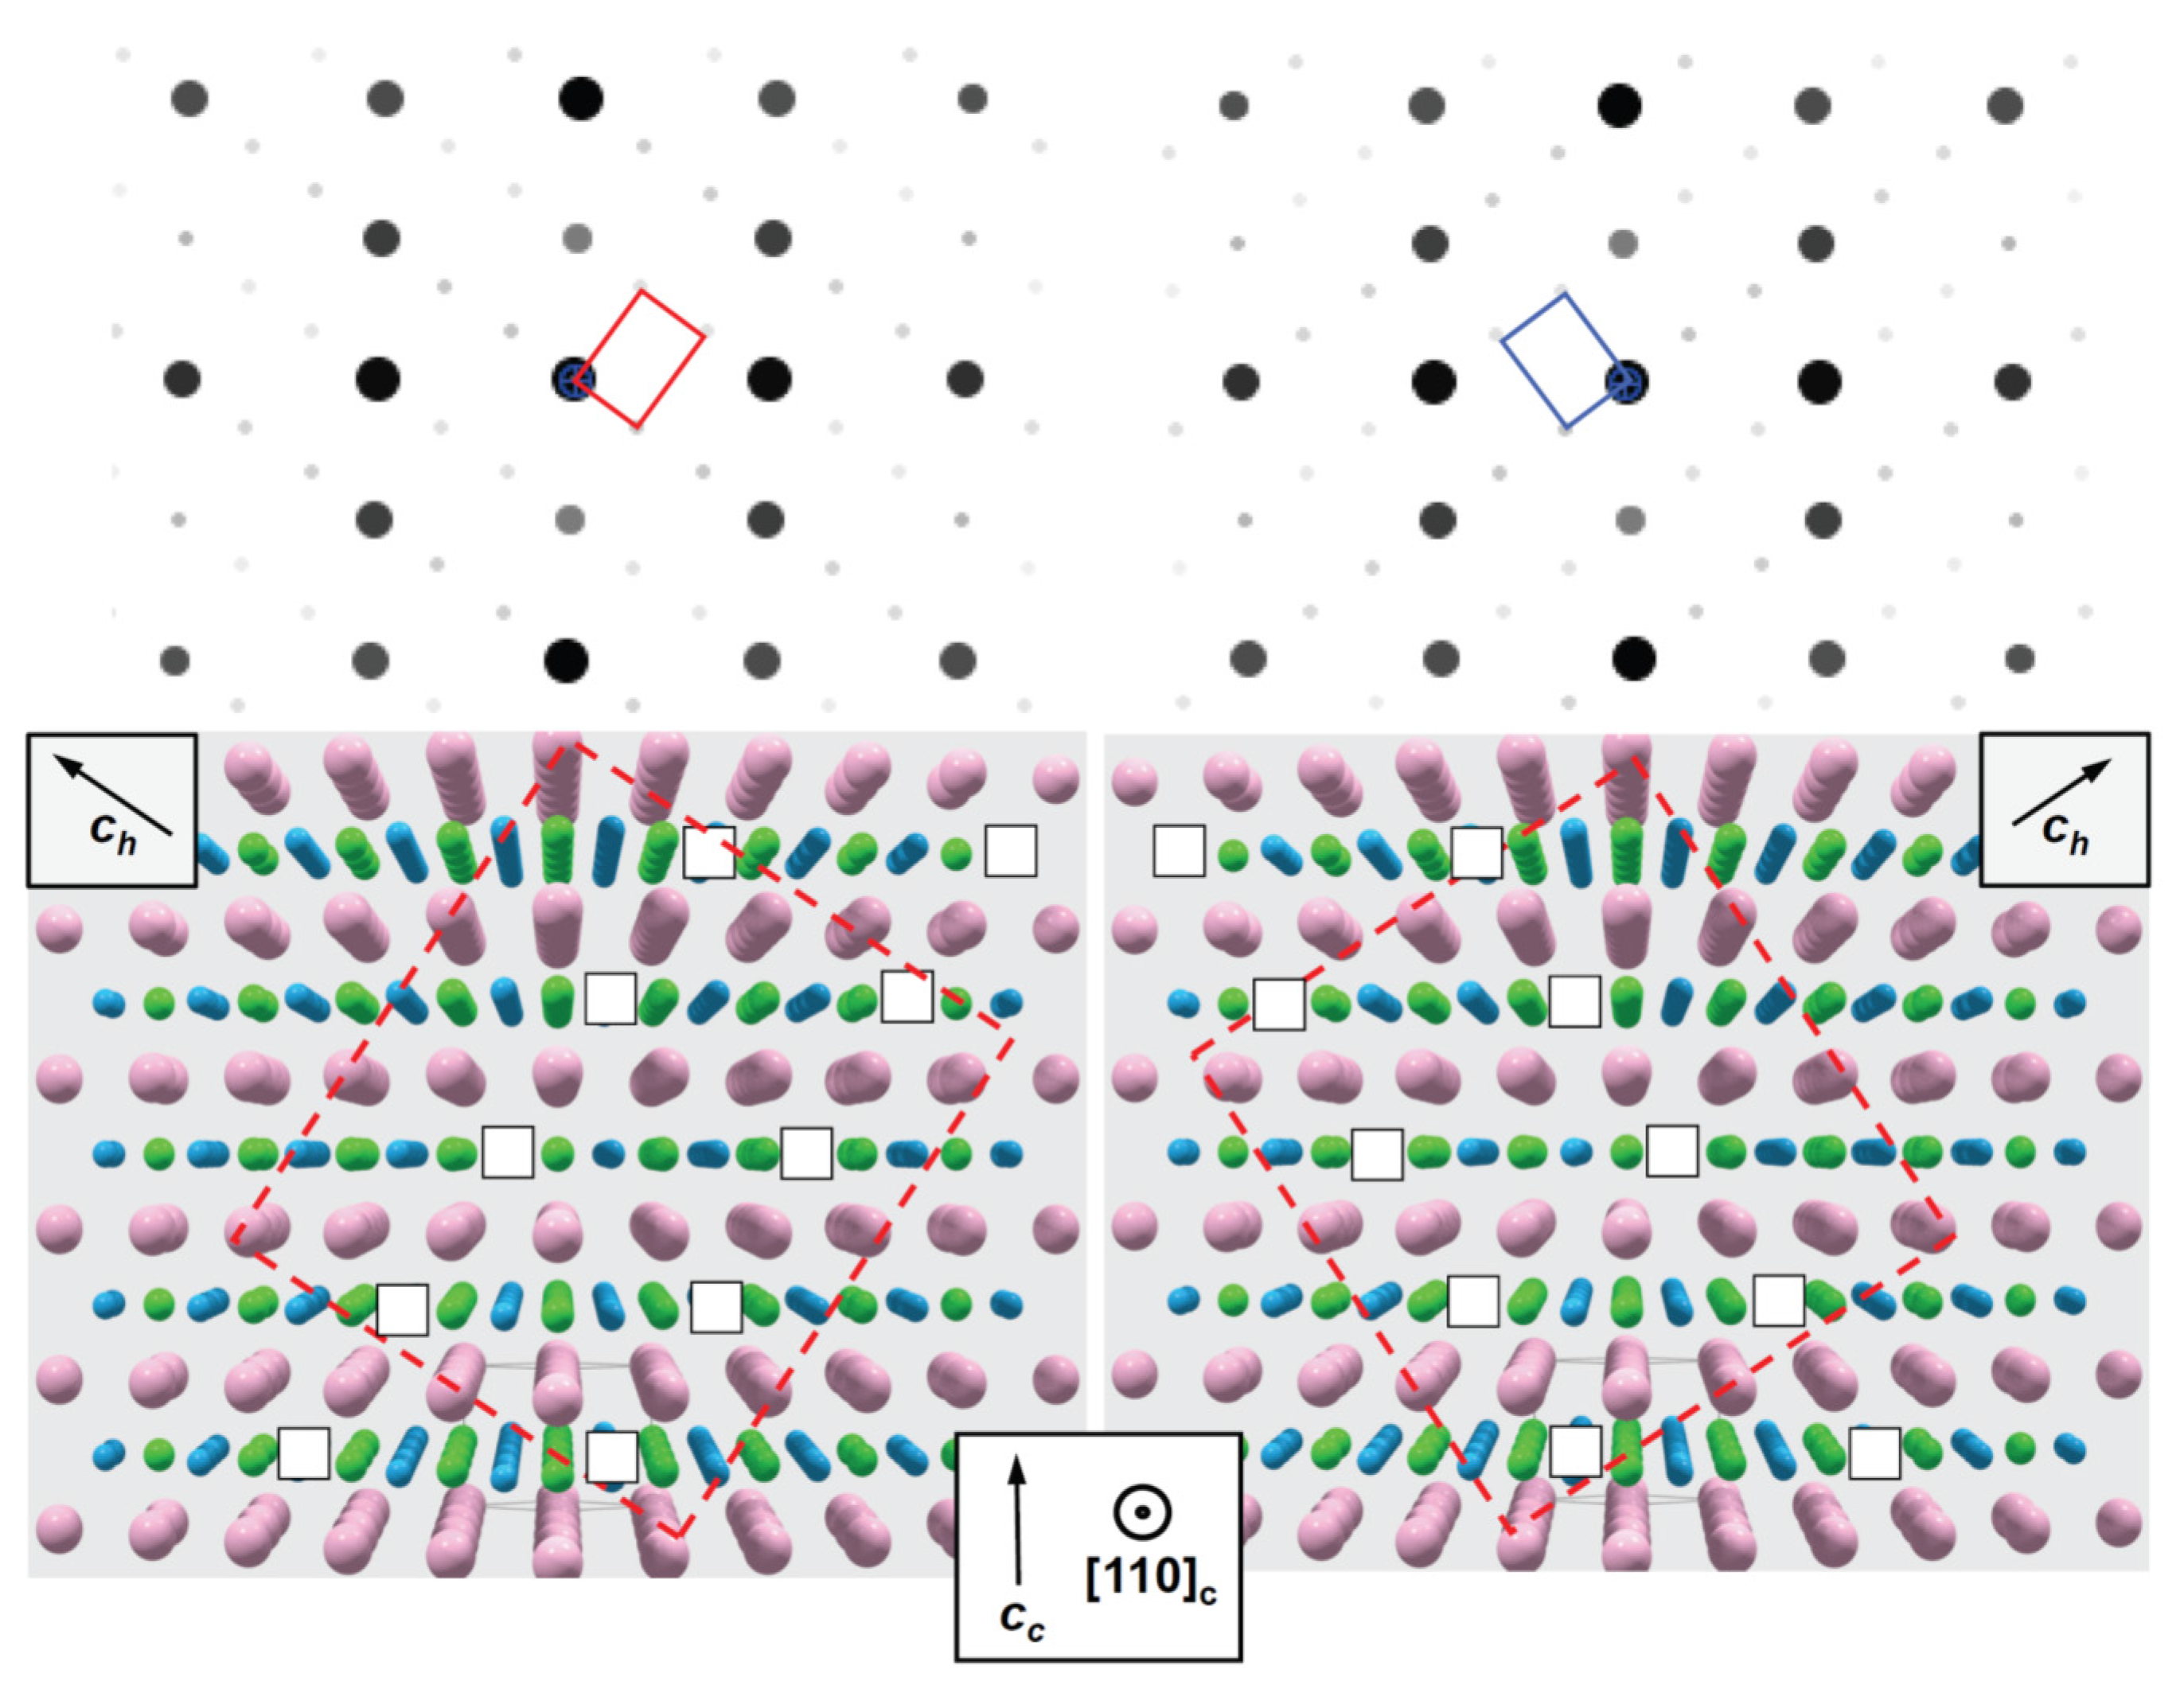
Figure 6.
Structure model of oxygen vacancy ordering in planes parallel () (left) and () (right), respectively; projection along [110] (directions according to cubic setting, subscript c; except the additionally indicated [001] direction with respect to the hexagonal setting, subscript h). The indication of atoms is as follows: blue, oxygen; pink, barium; green, titanium.
In order to confirm this kind of vacancy ordering, kinematical diffraction patterns (
cf. Figure 6) were calculated based on the structure model for oxygen-deficient trigonal Ba(Ti
4+1/3Ti
3+2/3)O
2.67 given by [
27]. The data for BaTiO
3 in the cubic setting were taken from [
29]. Apart from a small deviation of the average lattice parameters of the nanocomposite in comparison to bulk BaTiO
3 (splitting of the 222 reflection;
cf. Figure 5), the simulated SAED patterns (
Figure 6) agree well with the experimental ones. This may suggest a close analogy between oxygen vacancy ordering in reduced BaTiO
3 and that in our BaTiO
3-BiFeO
3 composite thin films.
Figure S11 compares the calculated oxygen vacancy ordered “defective” BaTiO
3 electron diffraction pattern with that of pseudocubic “stoichiometric” BaTiO
3. The SAED image taken from the 0.25-mbar composite film depicted in
Figure S10 confirms again the BaTiO
3-type structure of the entire BaTiO
3-BiFeO
3 composite film.
2.3. Magnetoelectric Voltage Coefficients
Figure 7a,b shows the magnetoelectric voltage coefficient α
ME of the BaTO
3-BiFeO
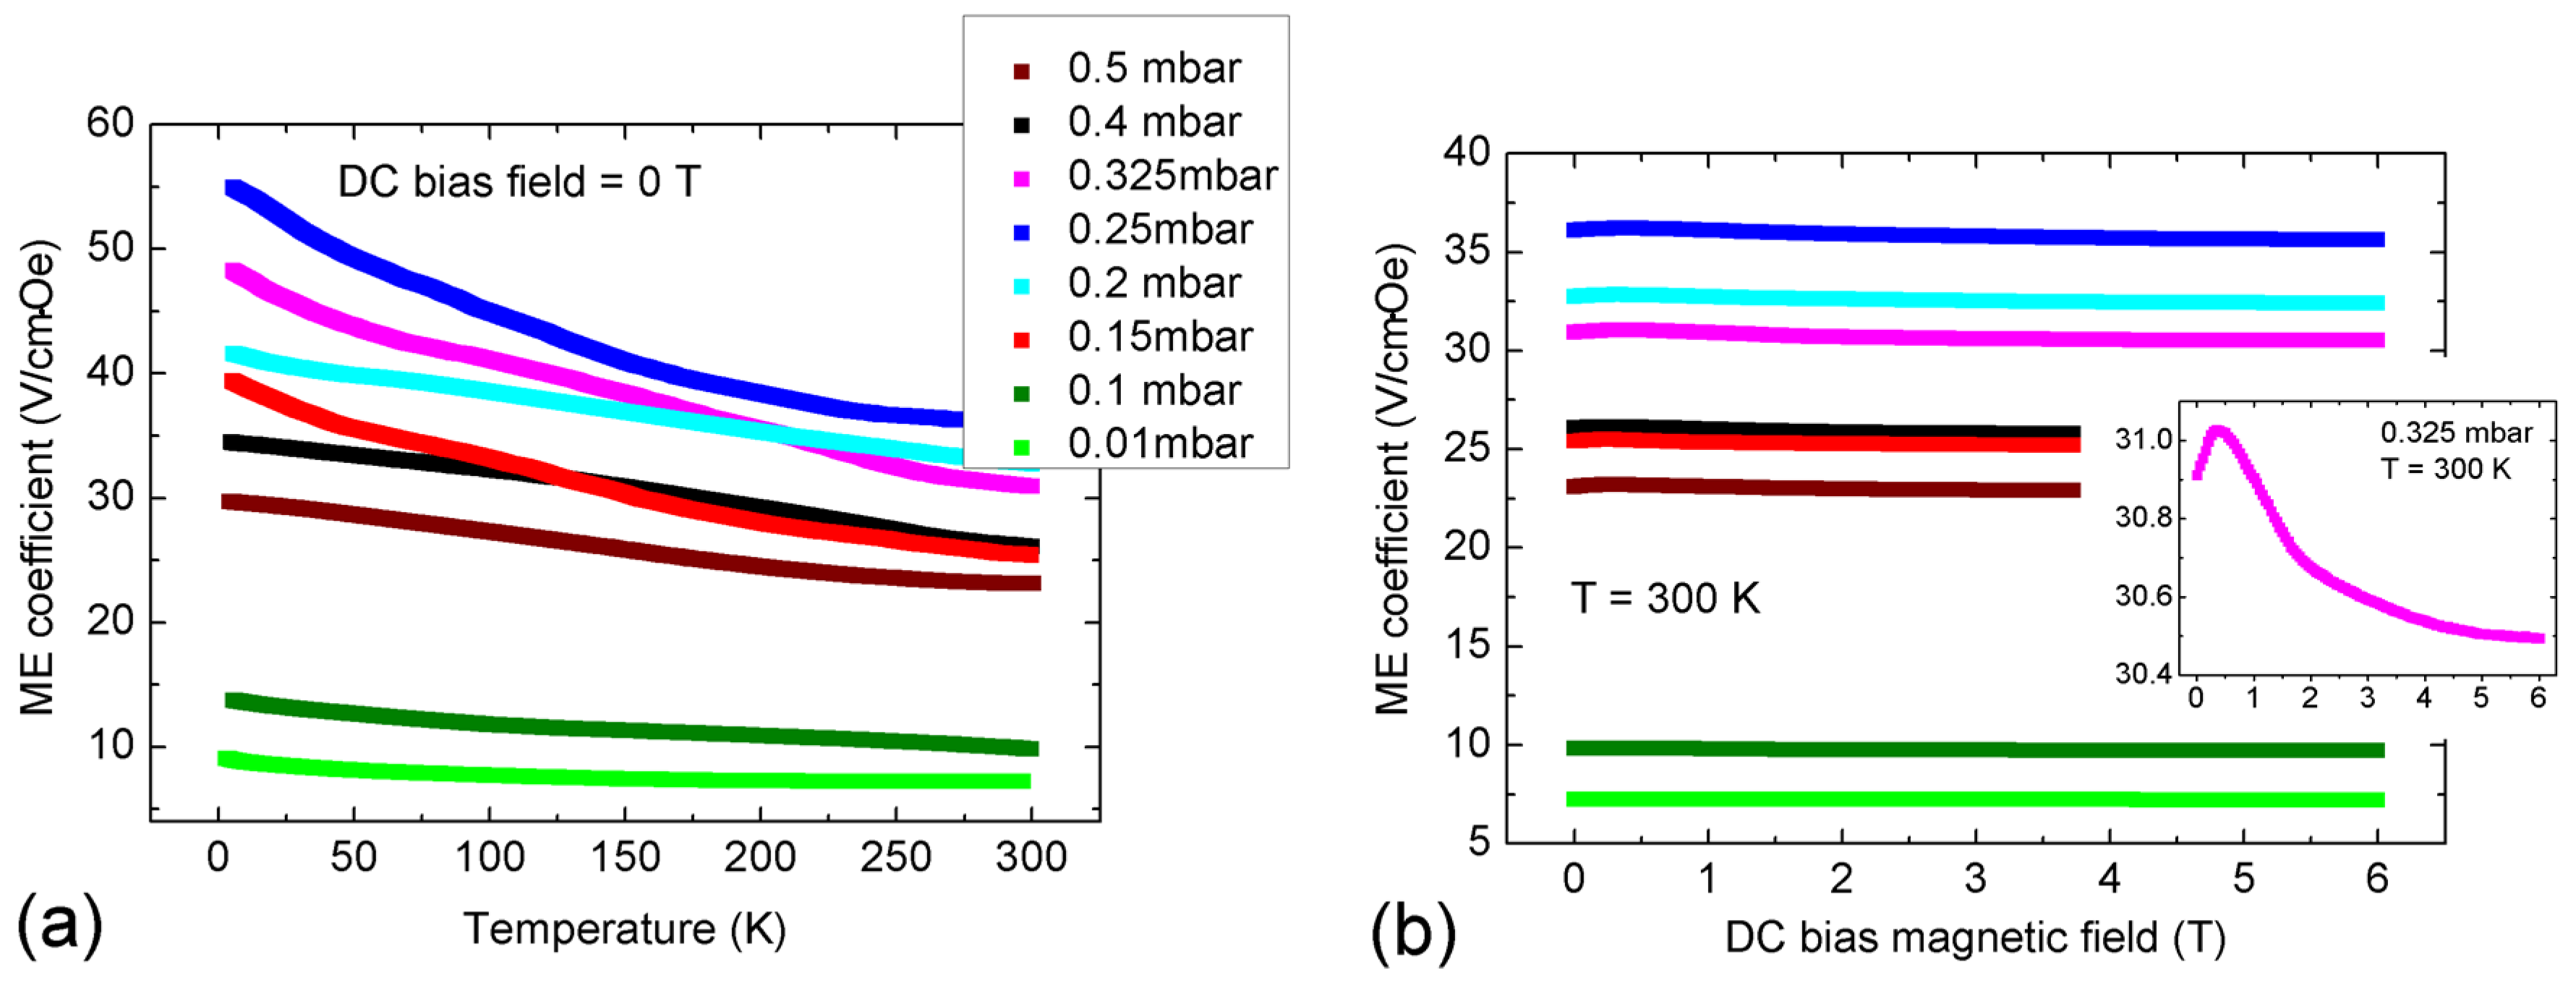
3 composite thin films as a function of temperature and direct current (DC) bias magnetic field (H), respectively, for the indicated oxygen partial pressures during PLD growth. In these experiments, the measured electric field (E) is oriented parallel to the applied alternating current (AC) and DC H-fields. During the measurements, the AC H-field was kept constant, and we did not apply any stress nor an additional E-field to the samples. In the temperature dependencies, the DC H-field was also constant. For more details, see the Experimental Section.
Figure 7.
Magnetoelectric voltage coefficient α
ME of BaTiO
3-BiFeO
3 composite thin films in dependence of (
a) temperature and (
b) the DC bias magnetic field, for the indicated oxygen partial pressures during the growth of the composites. The legend of (a) is valid for both (a) and (b). The DC bias dependence of α
ME in (b) is generally weak with a local maximum around 0.5 T. The inset is an expanded view of α
ME(H
DC) of the 0.325 mbar sample G5558c, compare
Table 1. For additional field-dependent α
ME graphs, see the
Supplementary Materials, Figure S12.
The magnetoelectric coupling of the composite films increases with decreasing temperature, in contrast to that of our recently-reported BaTO
3-BiFeO
3 superlattices consisting of 15 pairs of stacked thin BaTiO
3 and BiFeO
3 layers; see [
22]. We assume that in superlattice heterostructures with clearly separated phases, as reported in [
11,
22,
23], the magnetoelectric coupling is dominated by magnetostrictive-piezoelectric interaction coupled via strain at the interfaces of both phases. In purely strain-mediated coupling of the piezoelectric (electrostrictive, ferroelectric) phase to the magnetostrictive (magnetoelastic, ferromagnetic) phase, the coupling should decrease with decreasing temperature due to the temperature dependence of magnetostrictive and piezoelectric coefficients. Because the temperature dependence of α
ME of the BaTO
3-BiFeO
3 composite thin films is opposite in tendency (
Figure 7a), we expect the participation of an additional coupling mechanism, for example via charge; see the further discussion below. However, the temperature dependence of magnetoelectric coupling is not yet fully understood. The ferroelectric and magnetic phase transitions of undoped and Ba-doped BiFeO
3 at high temperatures are reported in [
30].
In
Figure S13, we show additionally typical ferroelectric hysteresis loops of two series of composite films grown simultaneously to that used for the magnetoelectric measurements in
Figure 7 and
Figure 8. Almost all samples show ferroelectric switching peaks in the current-voltage (I-V) characteristics used for calculation of the polarization-electrical field (P(E)) hysteresis loops. However, some samples show distorted I–V characteristics and P(E) loops, as SrTiO
3:Nb substrates with different Nb contents of 0.1% and 0.5% were partly used for the samples called “b” and “d”, respectively; see
Figure S13. Too high Nb content might introduce a barrier layer at the interface to the substrate, which results in rectifying,
i.e., Schottky behavior concerning the unavoidable leakage current through the films. However, high magnetoelectric coupling seems to correlate clearly with high saturation polarization, as the 0.25 mbar sample shows both the highest α
ME and the highest saturation polarization.
In our recent investigation of BaTiO
3-BiFeO
3 superlattices, we found anomalies in the temperature dependence of α
ME around the phase transition from tetragonal to orthorhombic BaTiO
3 [
22]. Furthermore, it is well known that strain in thin films may shift and remarkably broaden magnetic and ferroelectric transitions. For example, strain-induced shifts of the ferromagnetic Curie temperature of up to 19 K were found in La
0.7Sr
0.3MnO
3 films [
31]. The intrinsic piezoelectric coefficient
d31, as well as the relative permittivity of Pb(ZrTi)O
3 clearly decrease with decreasing temperature, while remanent polarization and the coercive field increase [
32]. Because also magnetostriction decreases with decreasing temperature, the generally increasing α
ME with decreasing temperature cannot be explained by strain coupling alone. Rather, charge-related coupling mechanisms may play also a role here for our composites. Spurgeon
et al. report direct local measurements of strain- and charge-mediated magnetization changes in the La
0.7Sr
0.3MnO
3/PbZr
0.2Ti
0.8O
3 system, which can be tuned by the manganite and ferroelectric layer thicknesses [
33]. In contradiction to the chemically almost homogeneous composite films reported here, our superlattices consisting of clearly separated BaTiO
3 and BiFeO
3 films with a thickness of a few nm show the opposite temperature dependence of α
ME down to about 100 K and only below an increasing α
ME; compare [
22].
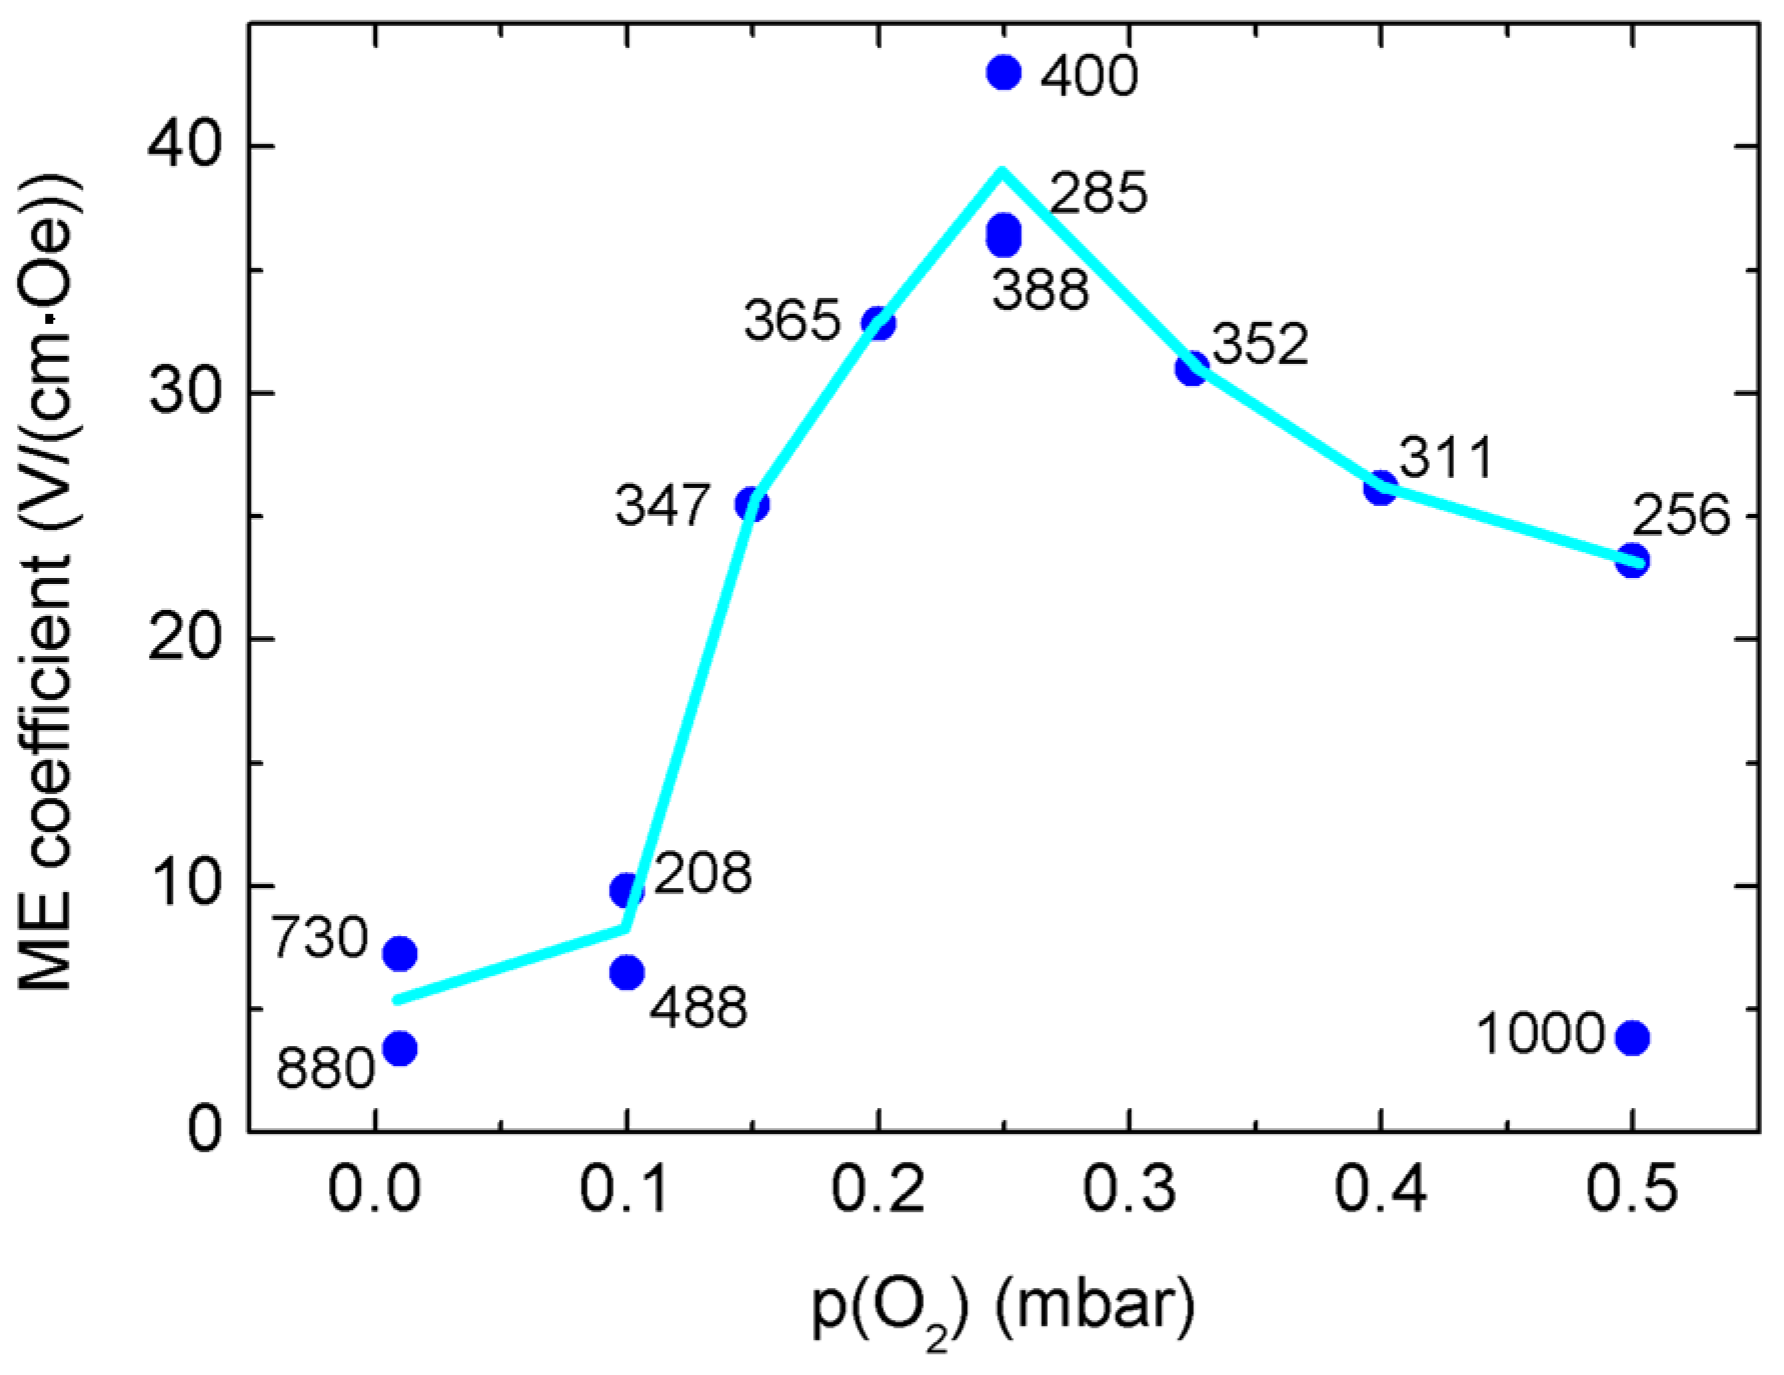
Figure 8 shows directly the dependence of α
ME on oxygen partial pressure during growth, for 300 K and at the DC-field of maximum α
ME,
i.e., between 0 and 1 T. We found a reproducible maximum of α
ME around a 0.25-mbar growth pressure, and for composite thicknesses of 200–400 nm. Thicker composite films seem to show lower α
ME values; see
Figure 8. The composite film thicknesses were determined directly and precisely from focused ion beam (FIB)-prepared cross-sections: see
Figures S14 and S15. In [
25], we have measured the trigonal distortion of oxygen tetrahedra of oxygen-deficient, weakly-Mn-doped ZnO thin films. Lower oxygen partial pressure in PLD growth is clearly correlated to increasing density of oxygen vacancies, which is accompanied by higher structural distortions, expressed locally by increasing variation of bond distances and rocking curve widths,
i.e., film mosaicity [
25].
Figure 8.
Magnetoelectric voltage coefficients α
ME of BaTO
3-BiFeO
3 composite thin films on SrTiO
3:Nb(001) measured at 300 K and at the DC bias magnetic field with the maximum α
ME. The number at each data point is the composite film thickness as determined from STEM images of cross-sections prepared by focused ion beam (see the
Supplementary Materials, Figures S14 and S15). The line is drawn to guide the eye only. Using the film thicknesses, structural details of the samples (
Table 1) can be assigned to the α
ME values.
However, in contrast to the BaTiO
3-BiFeO
3 superlattices [
22], we do not find a clear correlation of α
ME and the ω-related widths of the
RSM lattice points; see
Table 1 and
Figure 3. The lowest growth pressures result in the narrowest XRD peak widths,
i.e., the smallest tilt mosaicity of the composite films. This behavior is again contradictory to the (BaTO
3-BiFeO
3) × 15 superlattices, where we found strongly increasing (001) ω-broadening with both decreasing growth pressure and α
ME [
22]. The contradictory temperature dependencies of the α
ME of composites and superlattices and their sensitivity to external growth parameters, such as oxygen supply and layer geometry, indicate a complex interplay of strain- and charge-mediated magnetoelectric coupling, which requires further extensive efforts to become clearer in the future.


