Mechanical Properties of High-Volume Fly Ash Strain Hardening Cementitious Composite (HVFA-SHCC) for Structural Application

 , and
, and
Abstract
:1. Introduction
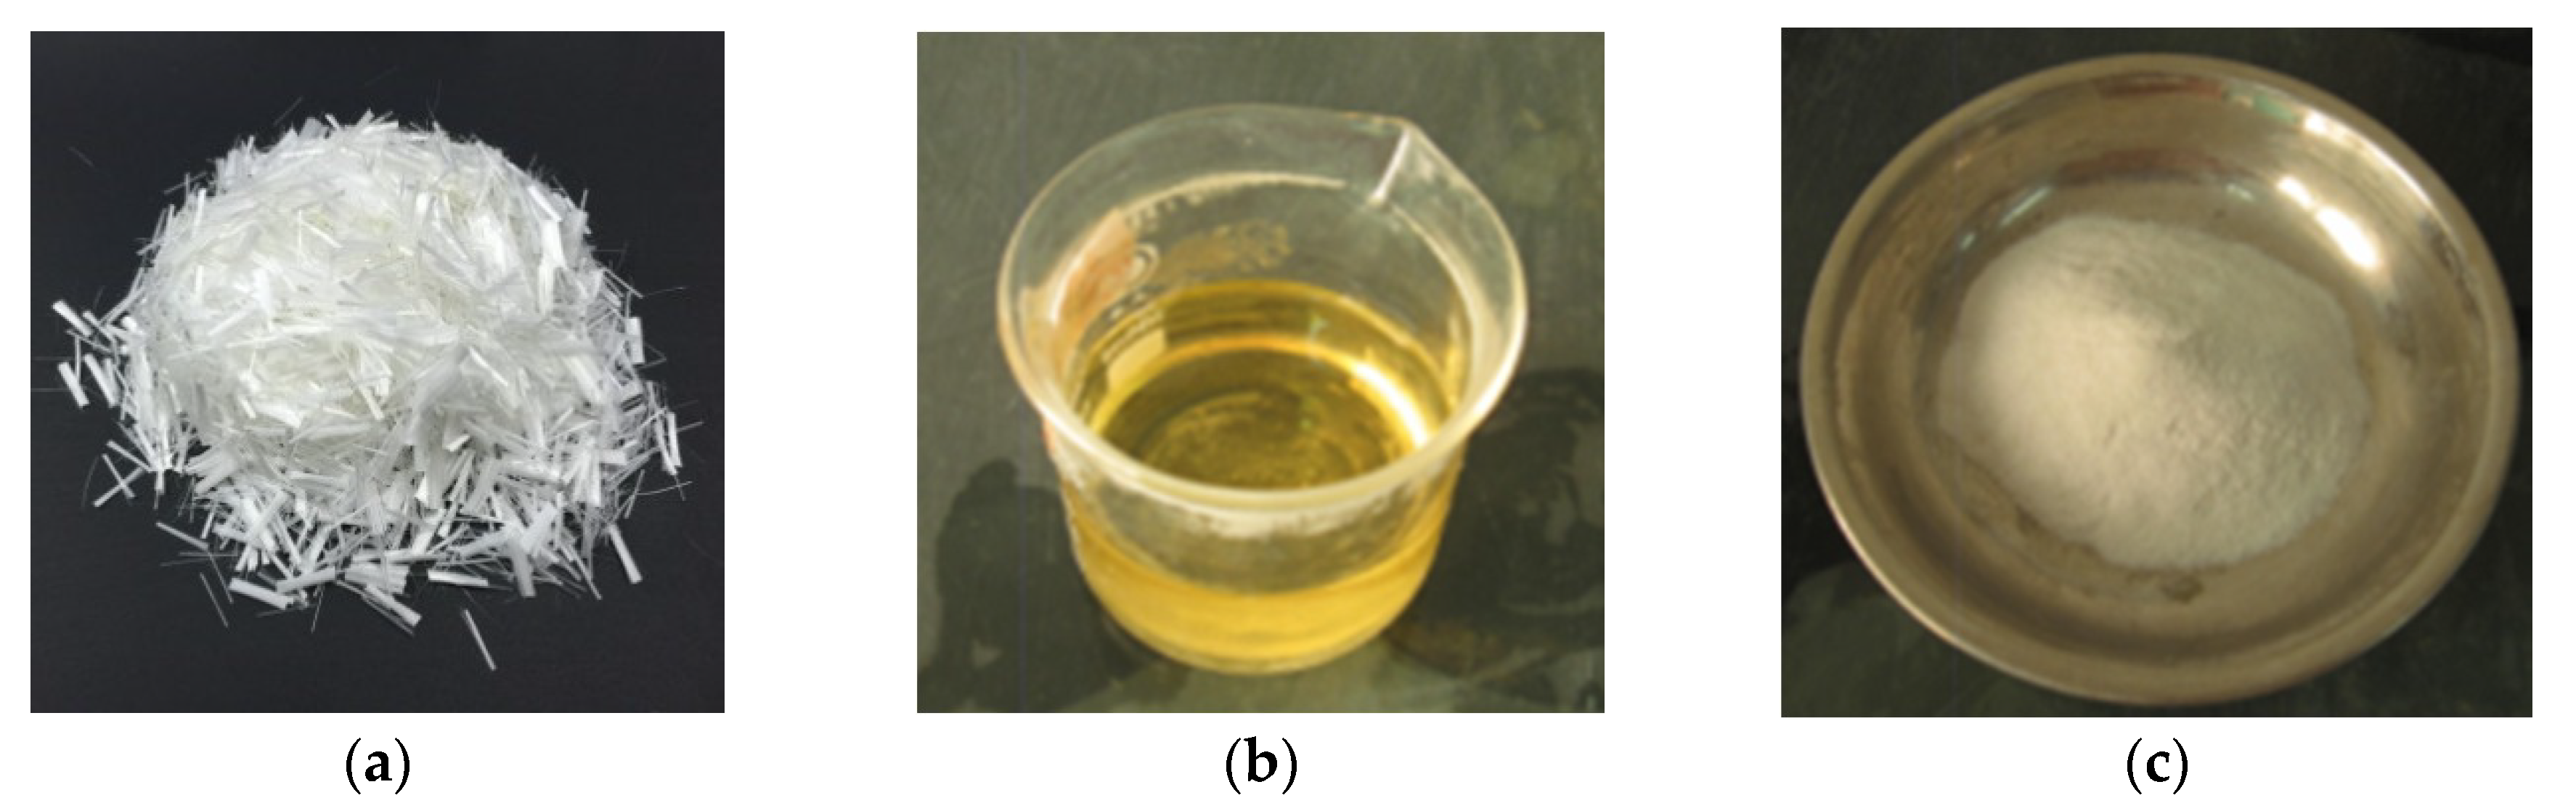
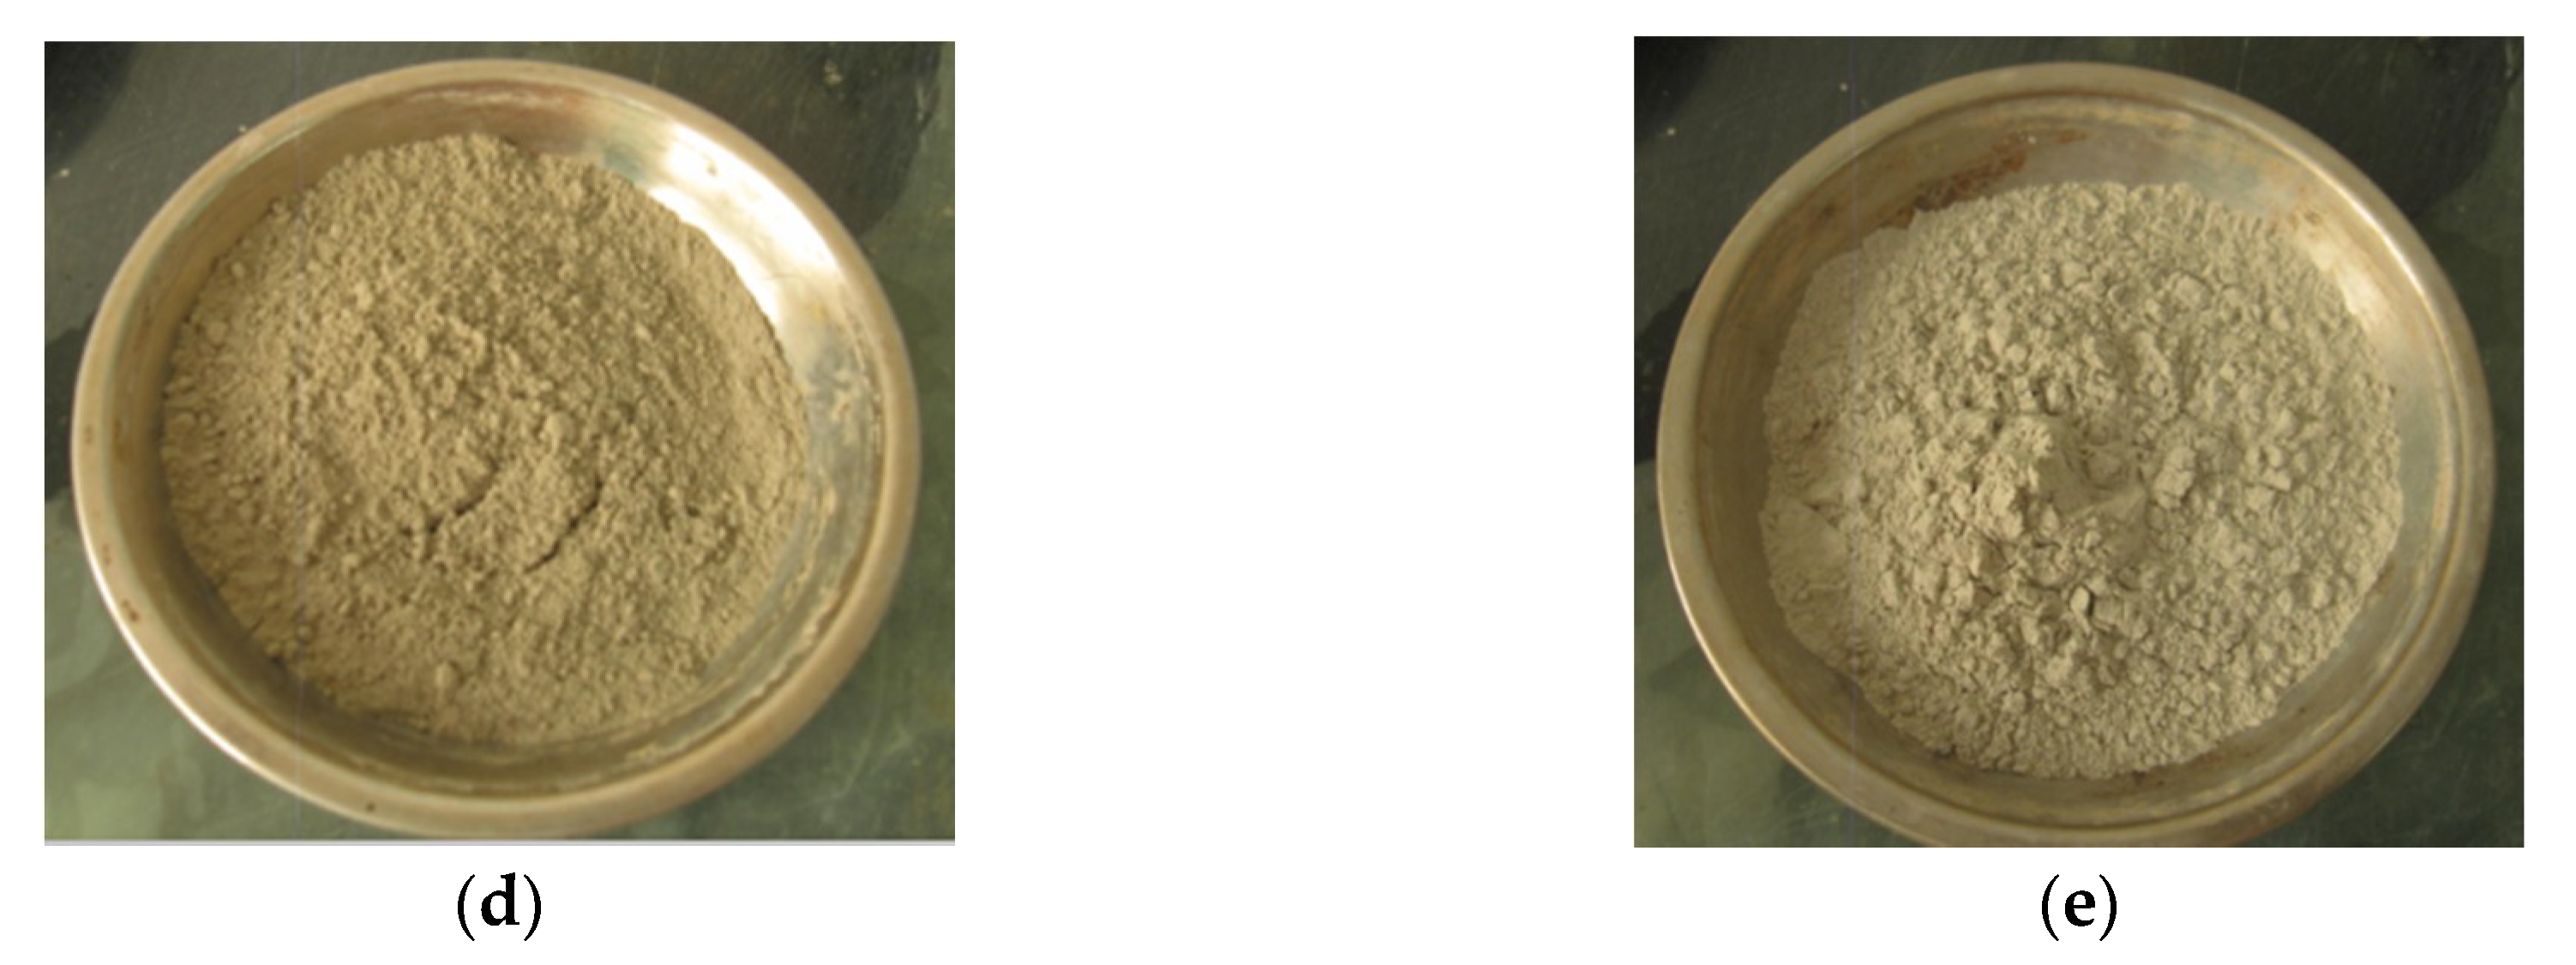
2. Material Design
2.1. Objective
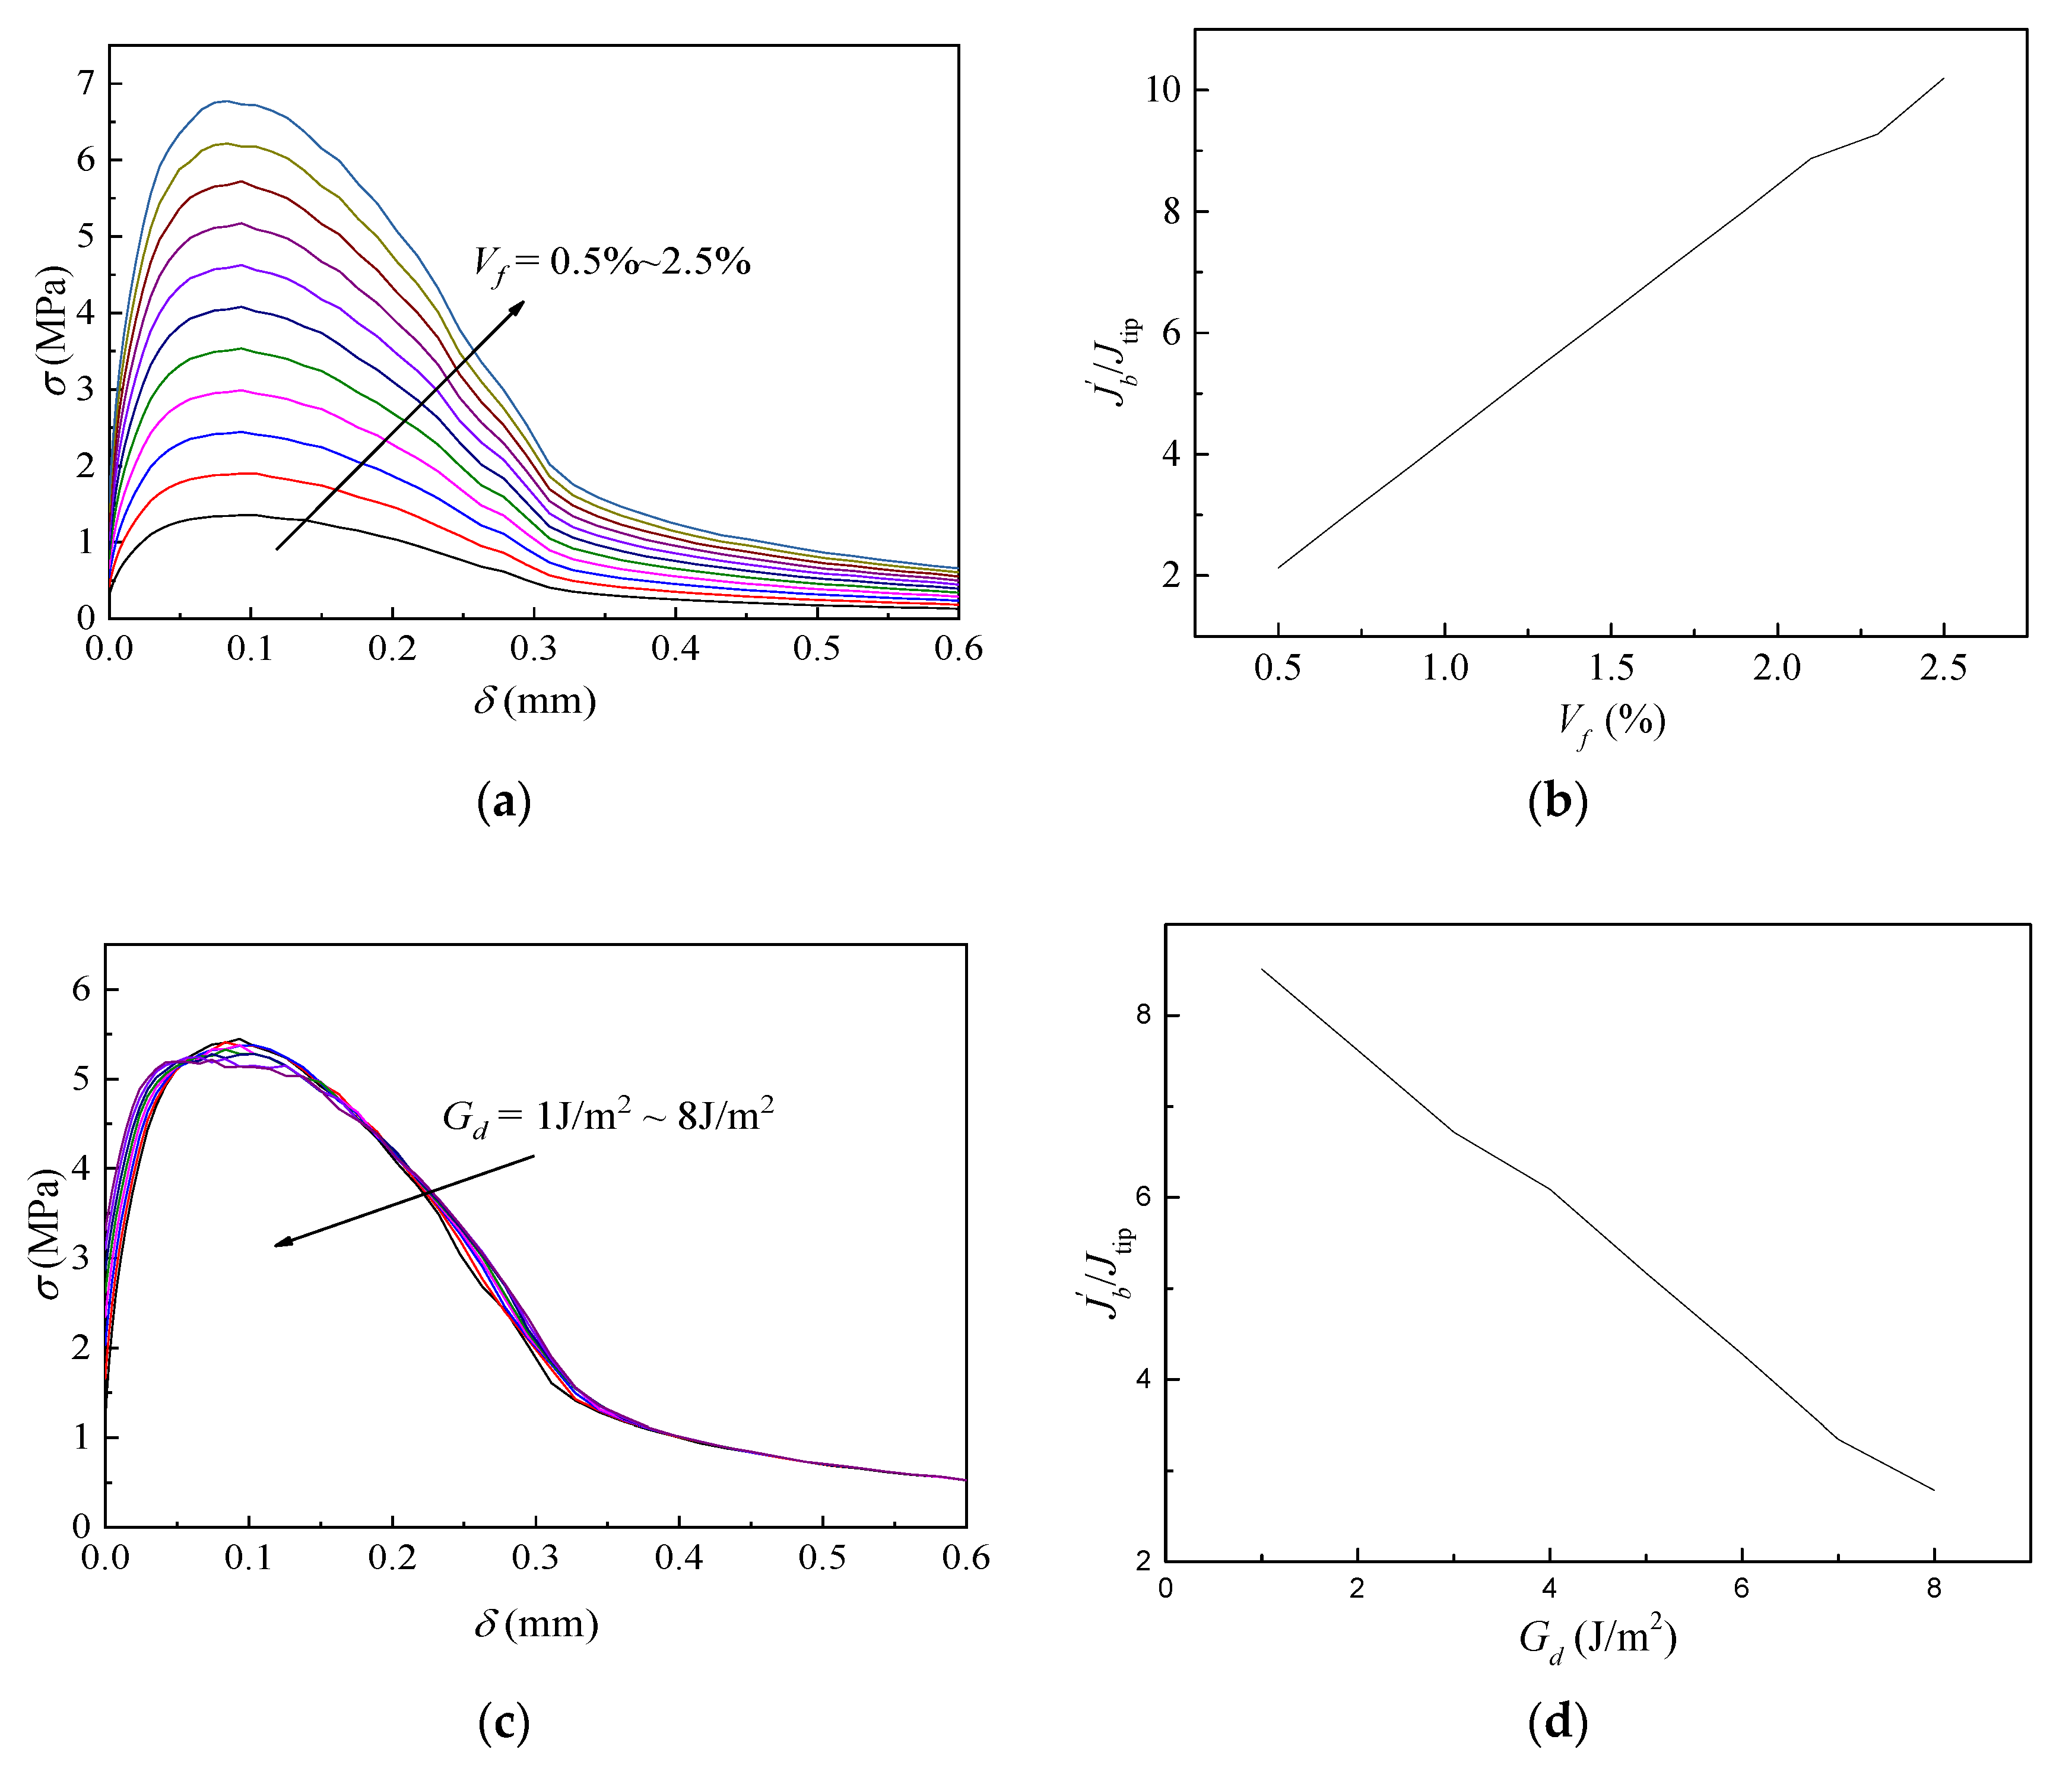
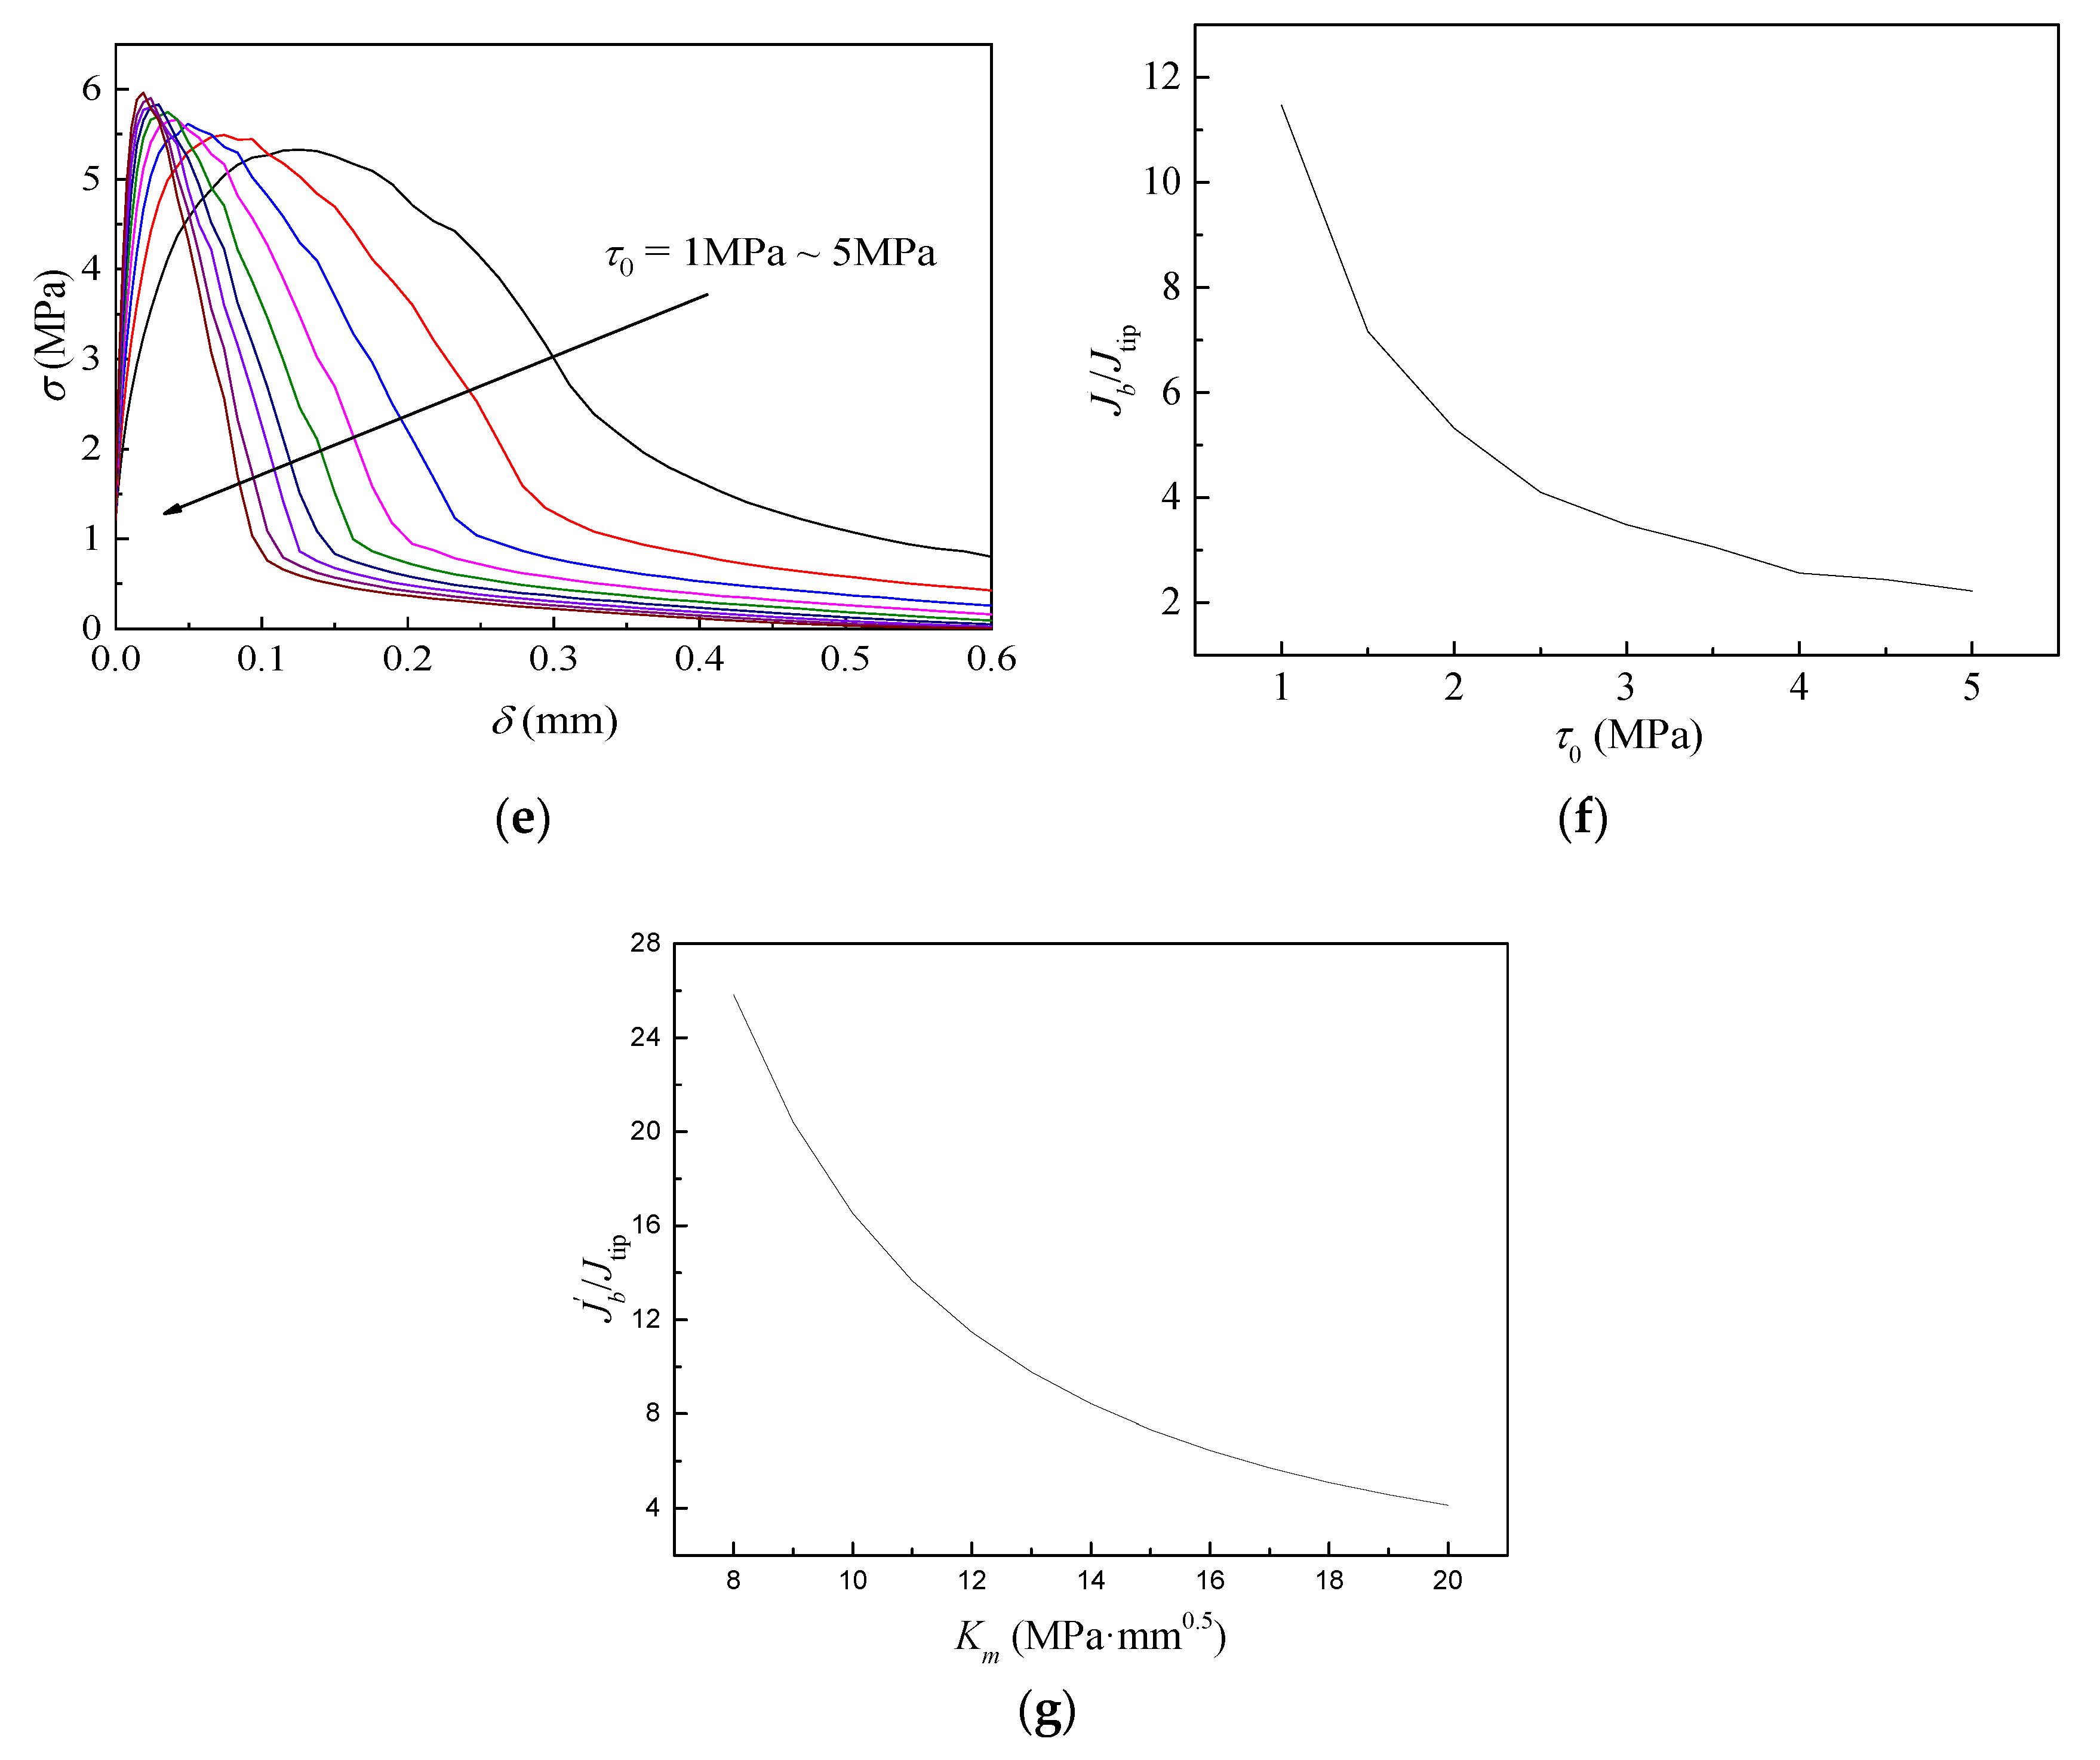
2.2. Micromechanics-Based Analysis
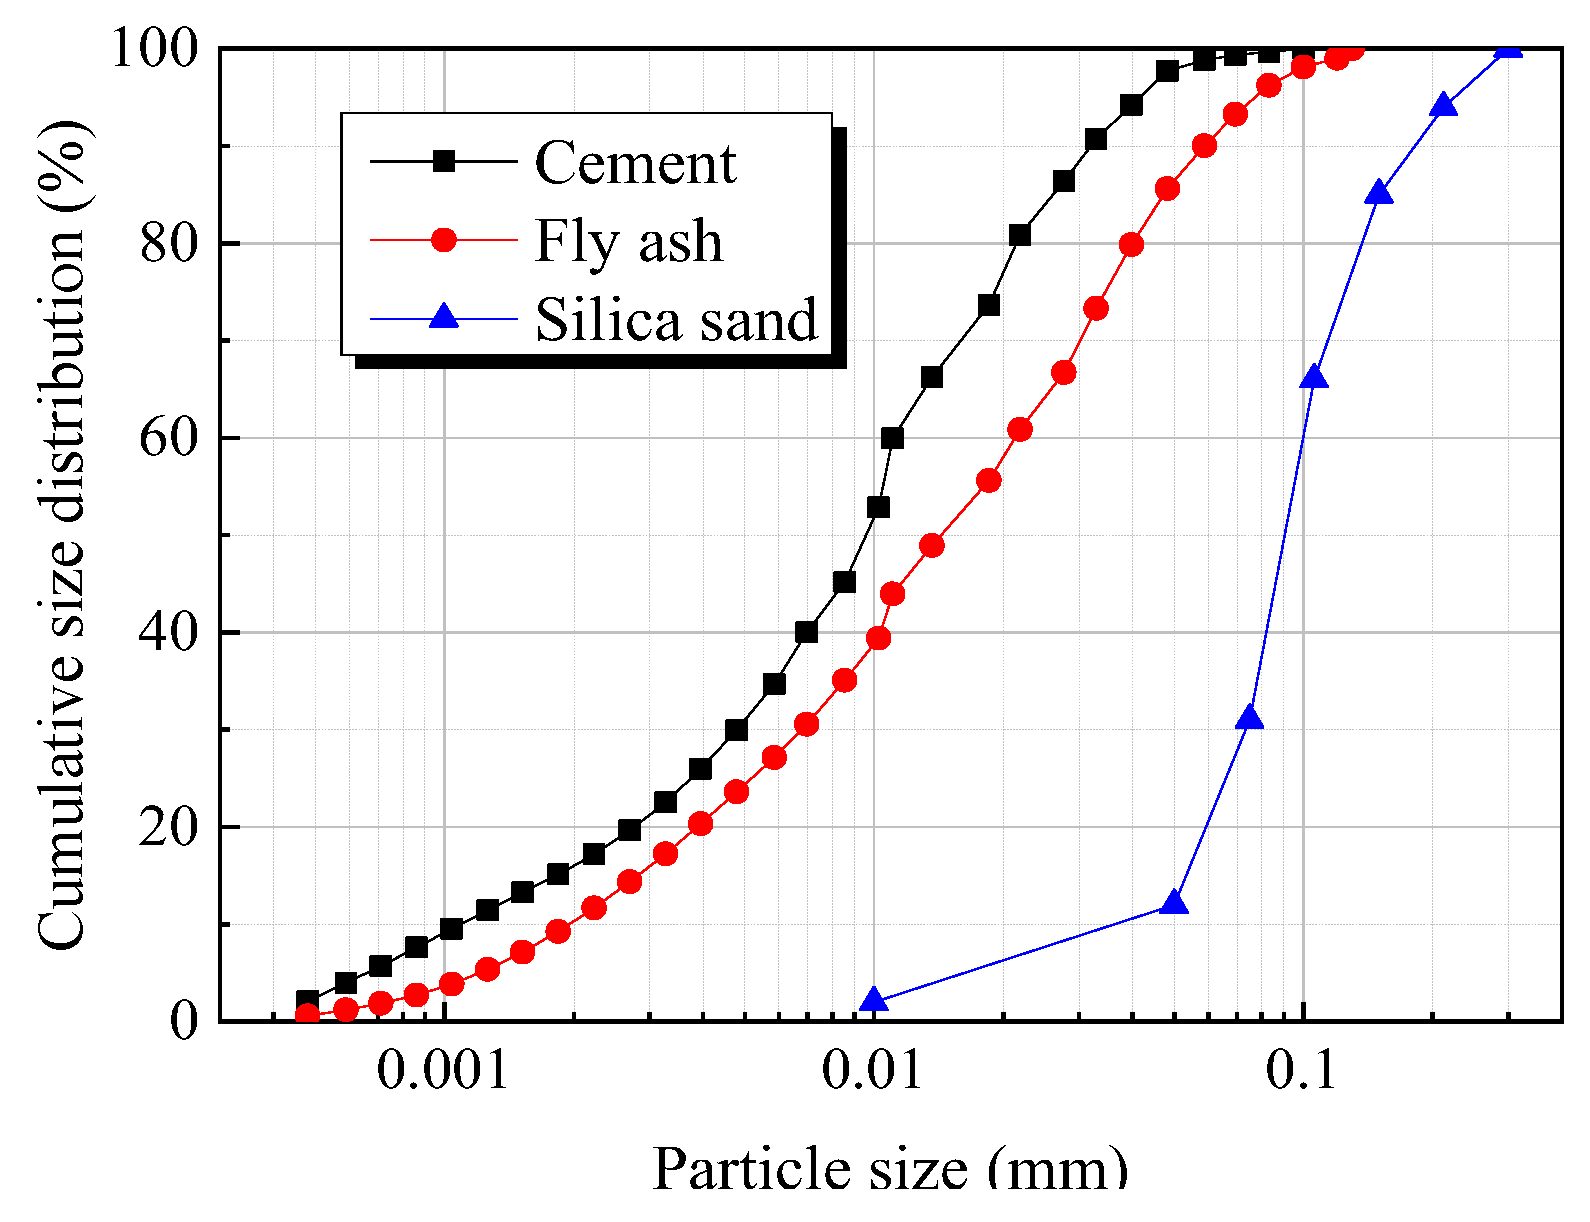
2.3. Particle Size Distribution (PSD) Optimization
3. Experiments
3.1. Mix Proportions
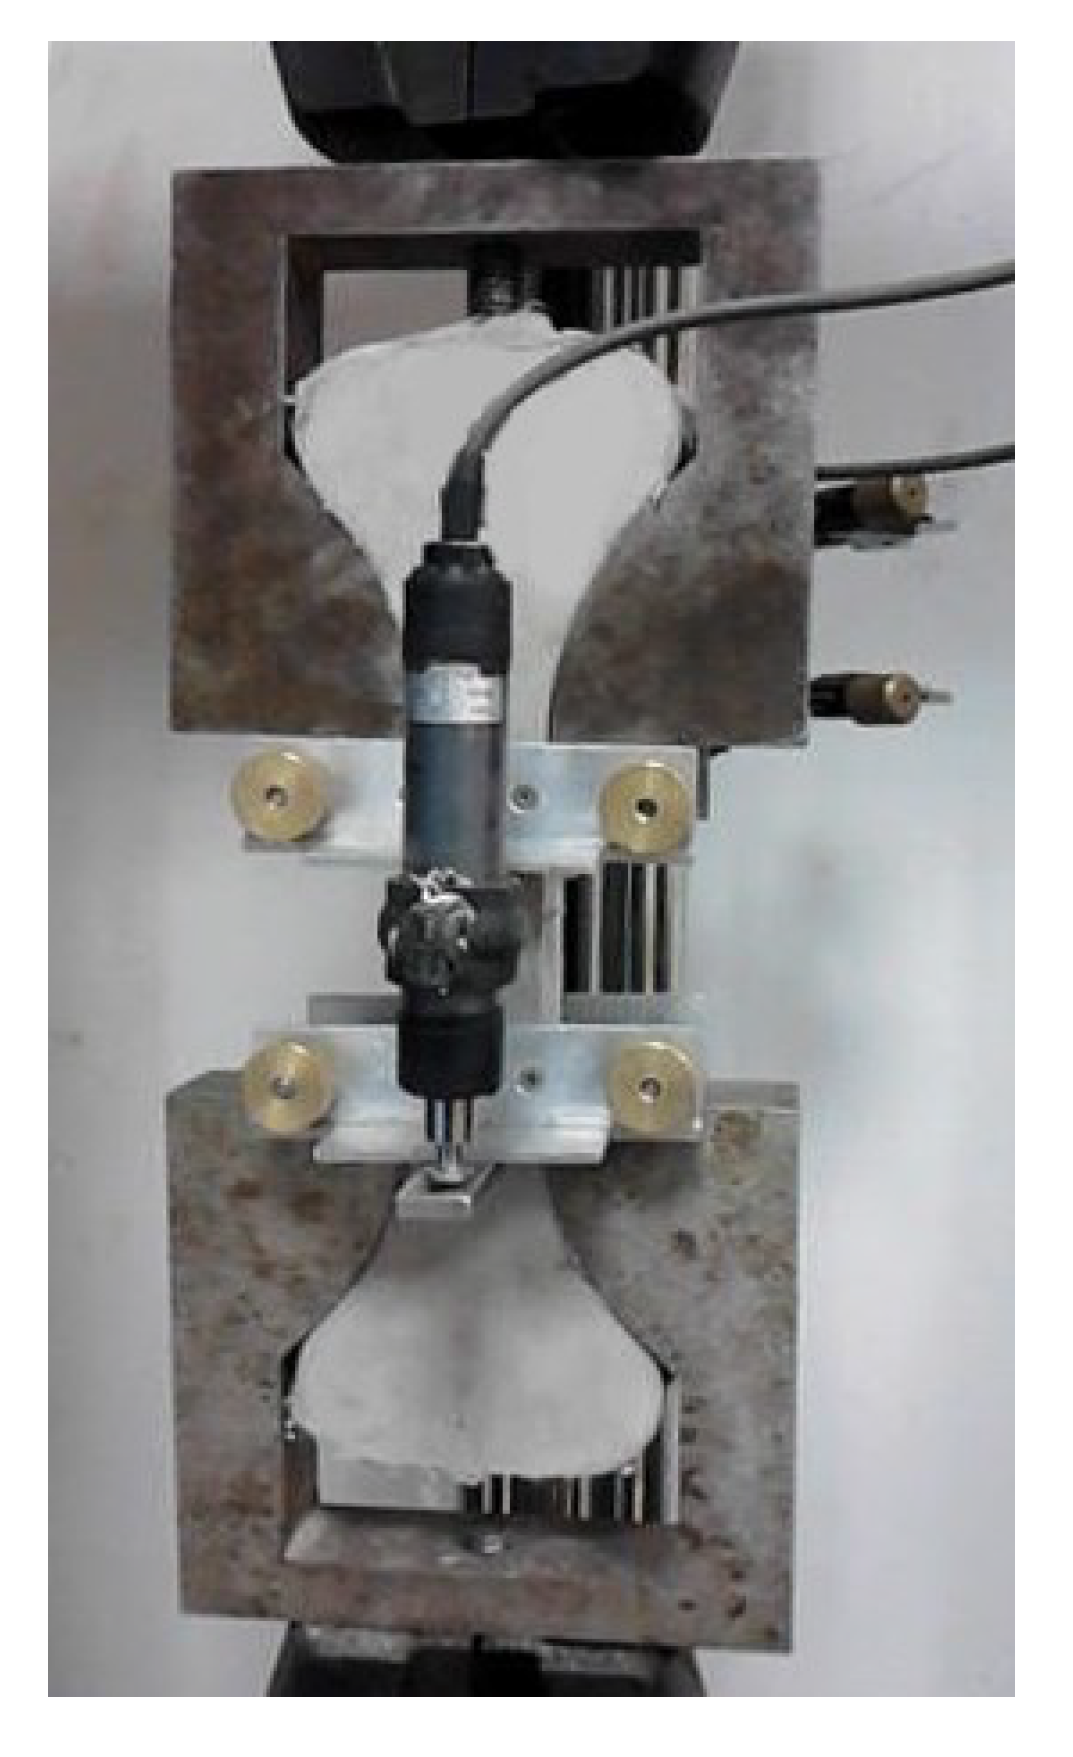
3.2. Uniaxial Tensile Test
3.2.1. Test Preparation for Uniaxial Tensile Test
3.2.2. Test Results of Uniaxial Tensile Test
3.3. Uniaxial Compressive Test
3.3.1. Test Preparation for Uniaxial Compressive Test
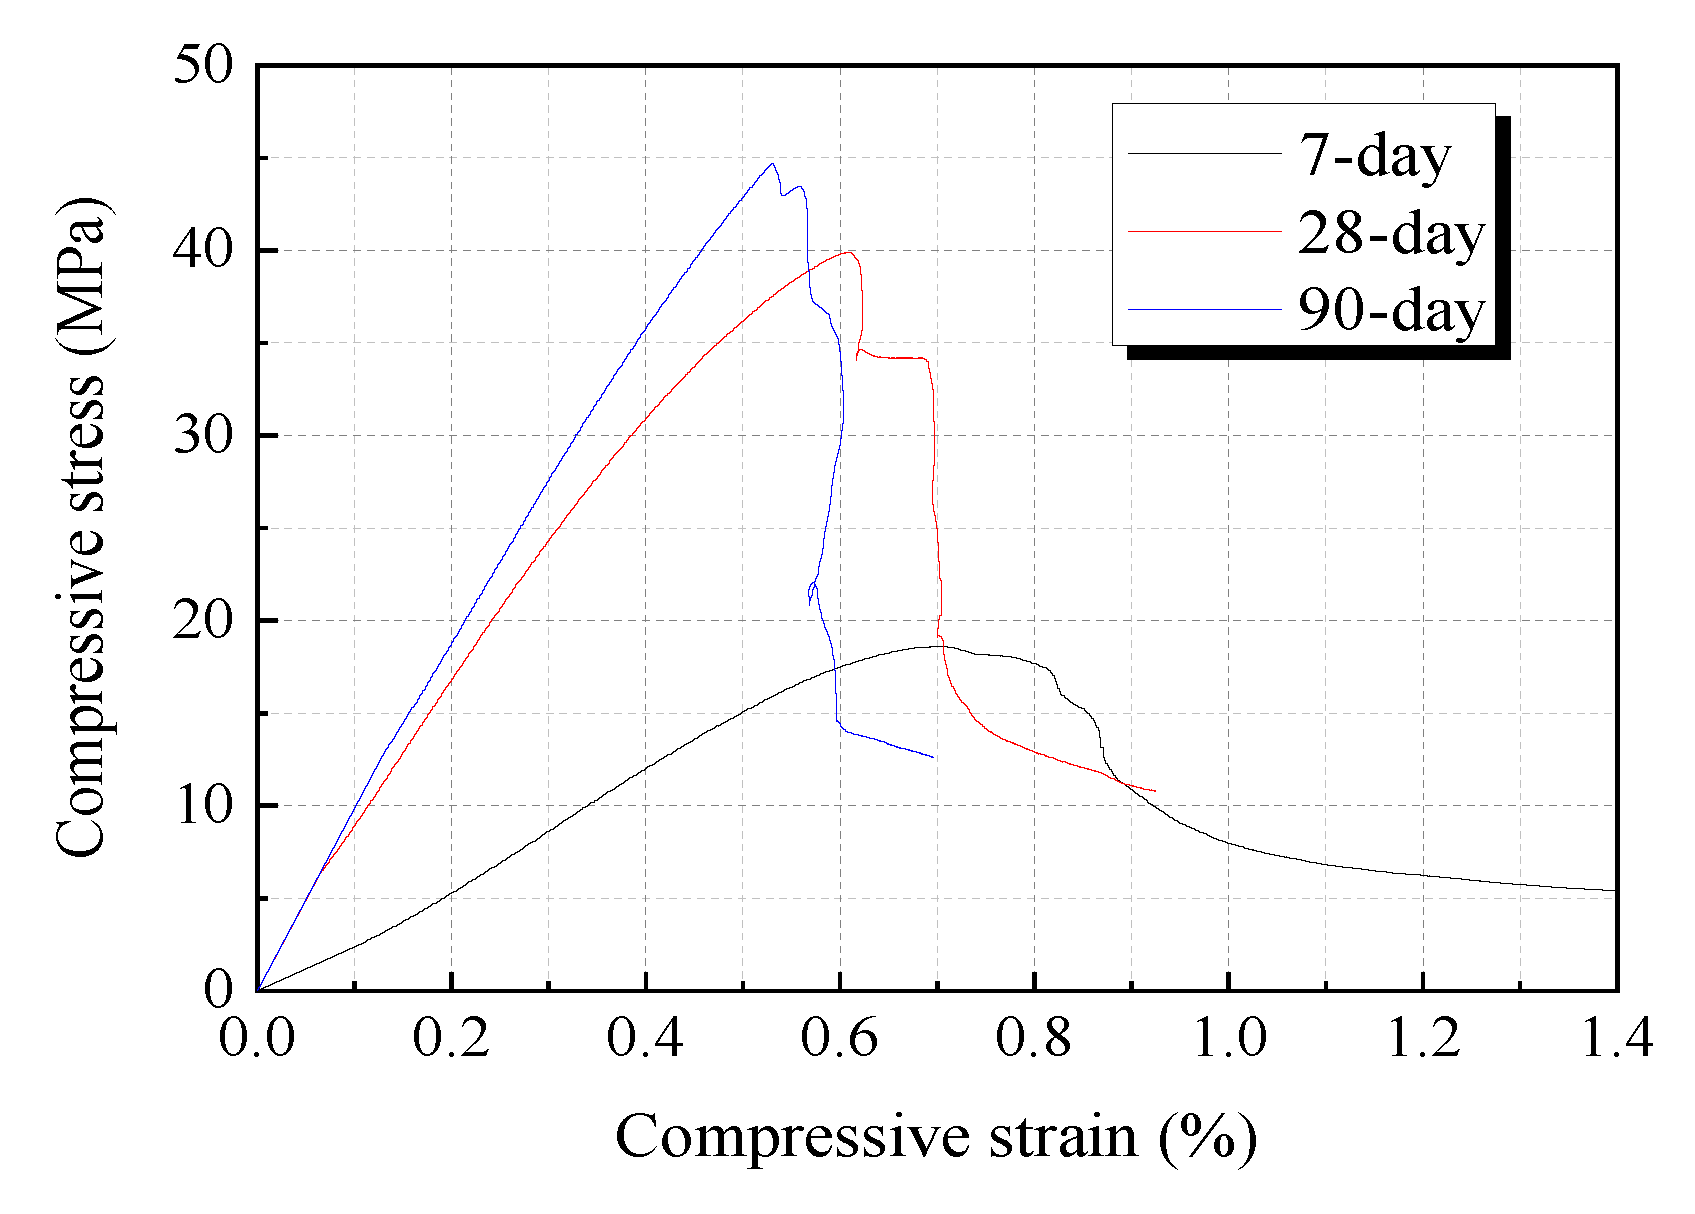
3.3.2. Test Results of Uniaxial Compressive Test
3.4. Four-Point Bending Test
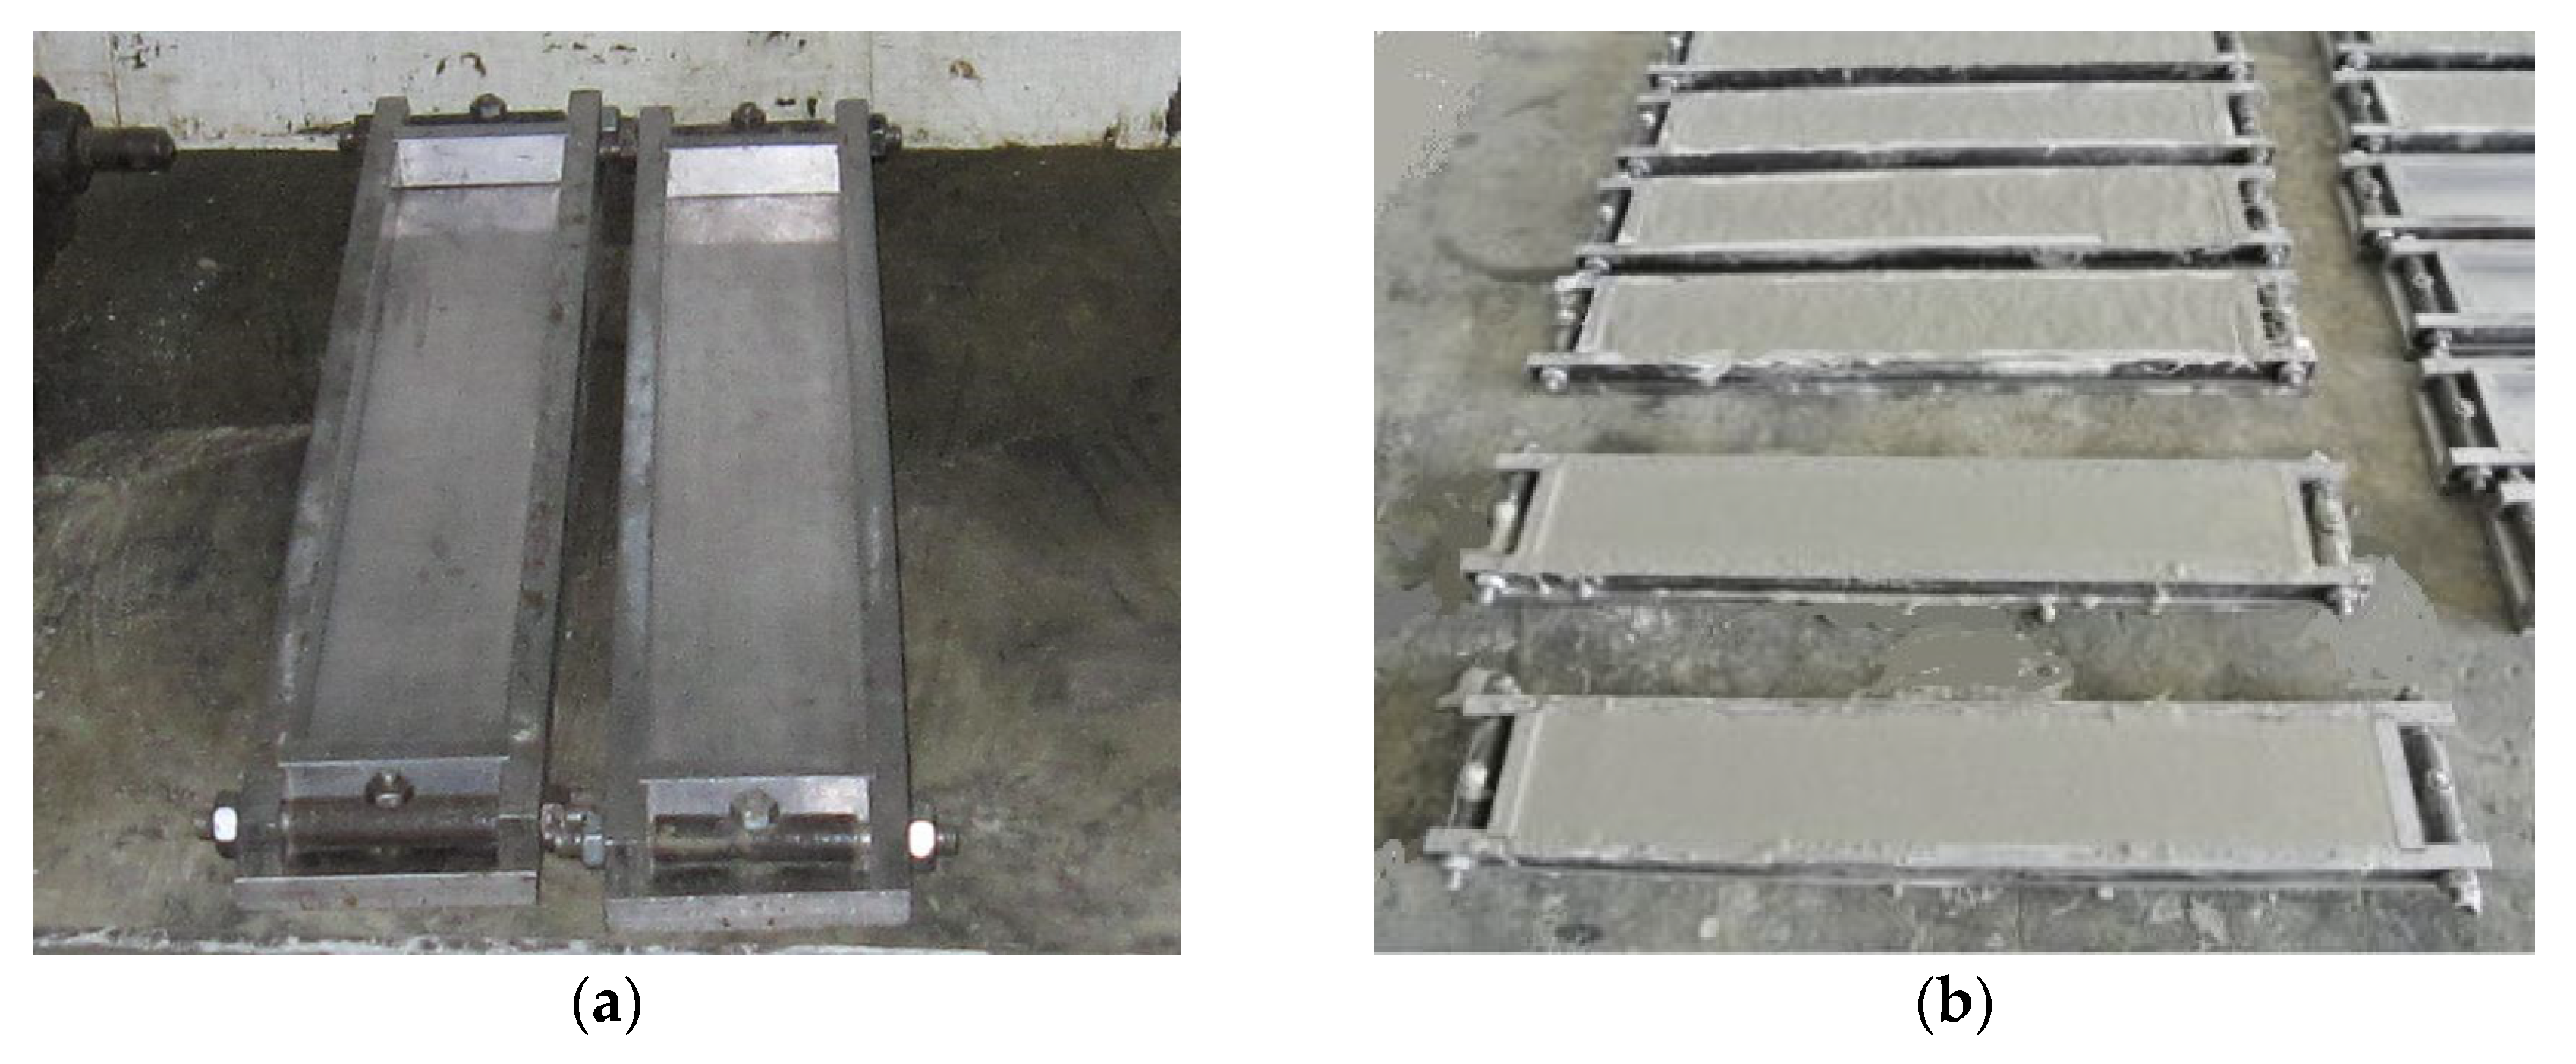
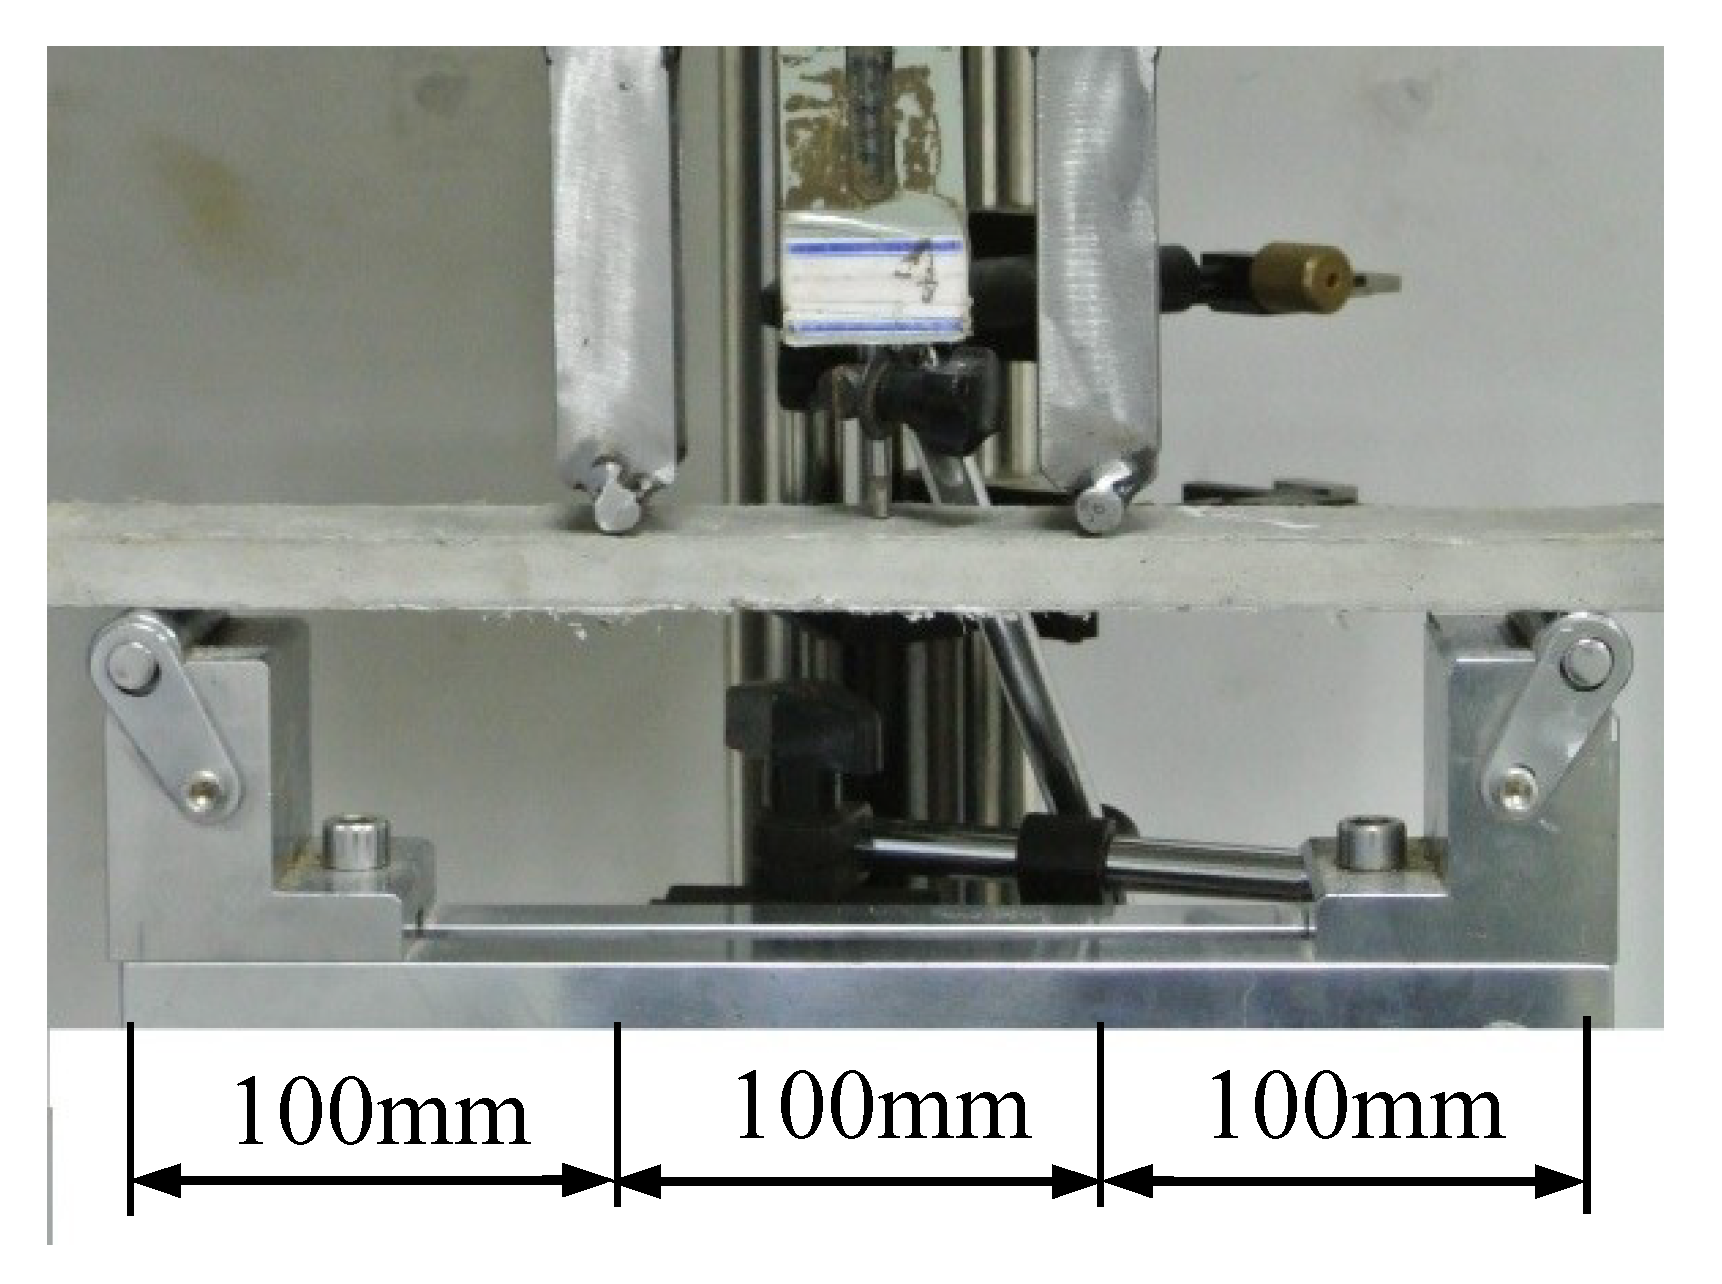
3.4.1. Test Preparation for Four-Point Bending Test
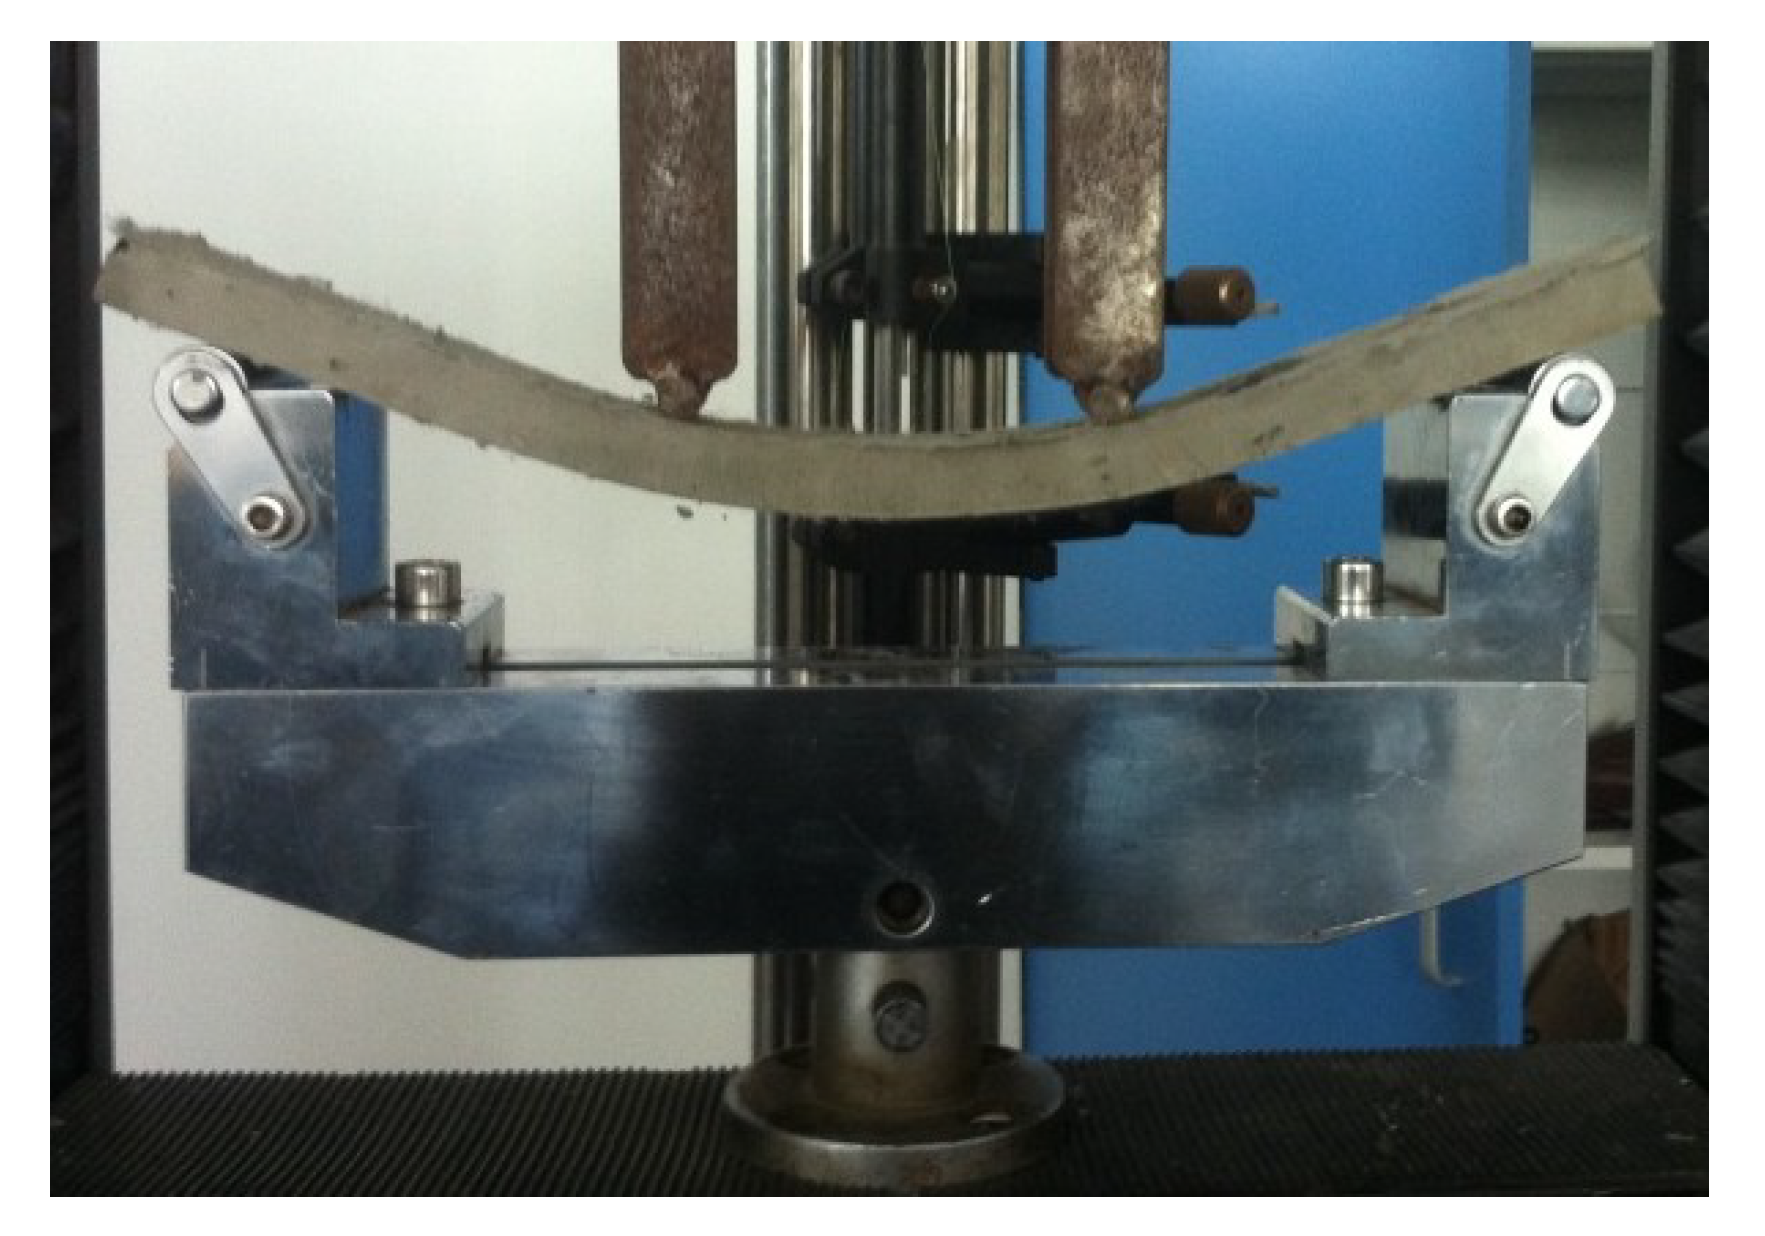
3.4.2. Test Results of Four-Point Bending Test
4. Conclusions
- (1)
- Based on the analysis, a higher volume of fiber can provide more complementary energy, however, excessive fibers may negatively affect the workability and fiber dispersion. Chemical and frictional bonds should not be too strong, otherwise, the complementary energy will be insufficient to meet the energy criterion for SHCC. Properly increasing the water to binder ratio and the fly ash to cement ratio can decrease both the bond strength of the interface and the fracture toughness of the matrix, which is beneficial to the formation of strain hardening and multiple cracking.
- (2)
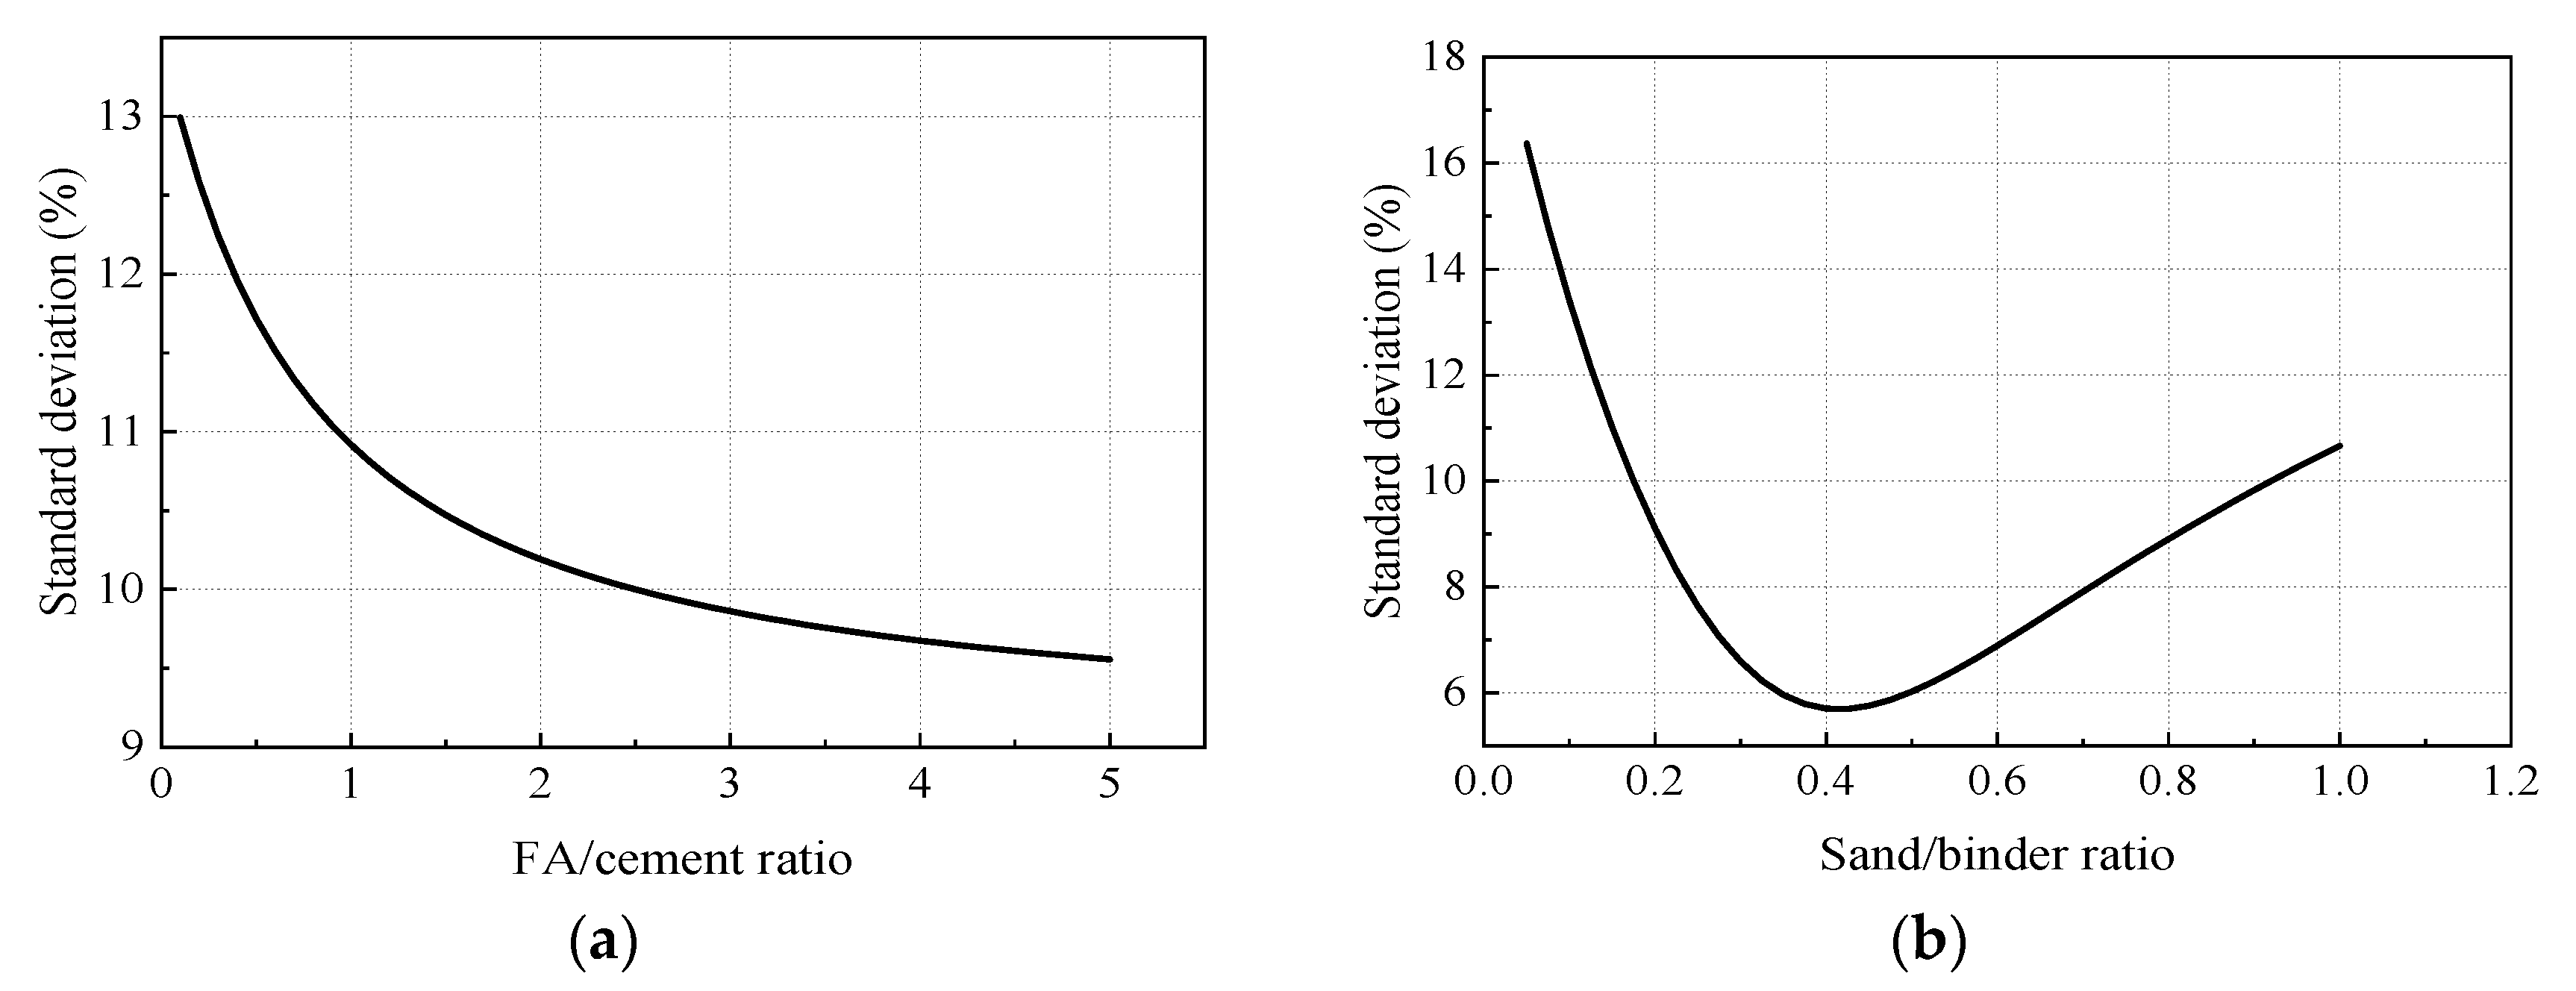
- Based on the PSD optimization, the standard deviation between PSD curve of the designed mixture and the optimal grading curve calculated from the A&A model was less than 10%, and became more steady when the FA to cement ratio exceeded 2.4. The minimal standard deviation appeared when the sand to binder ratio was around 0.4.
- (3)
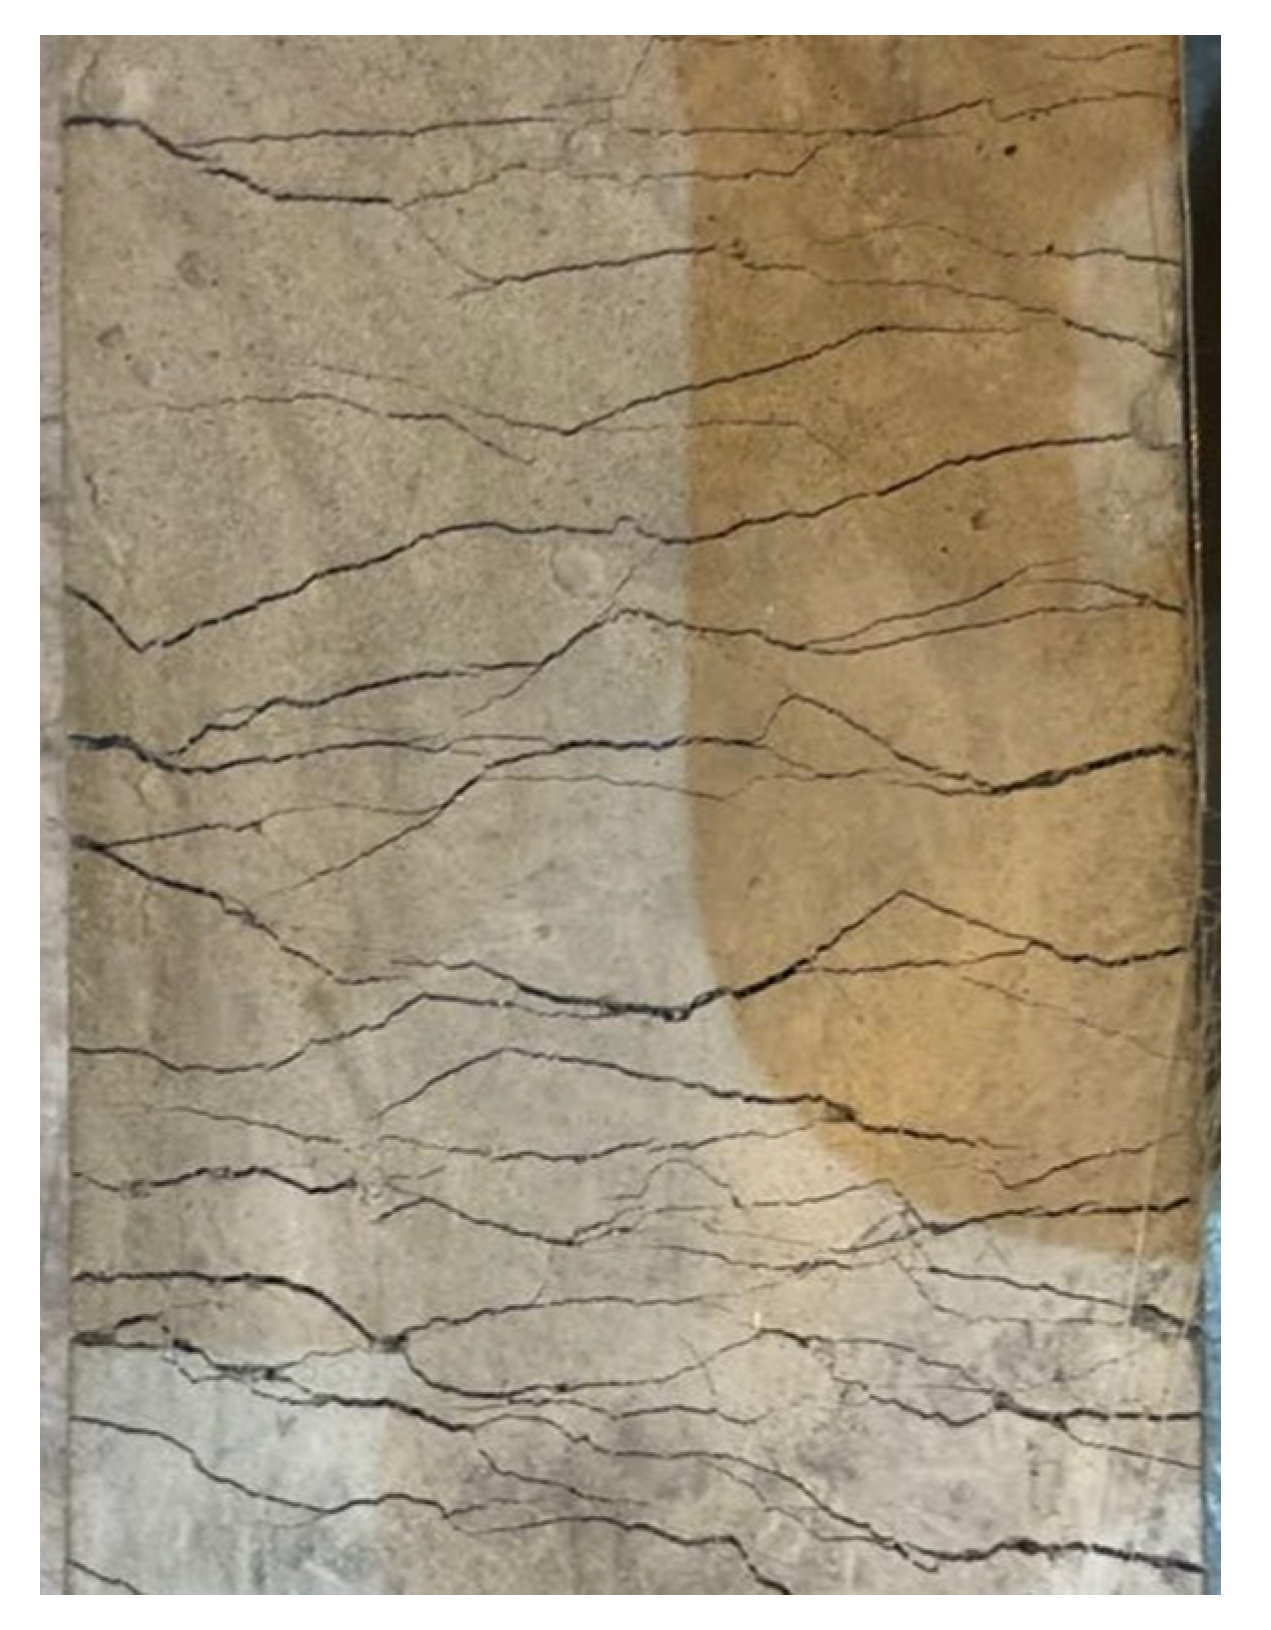
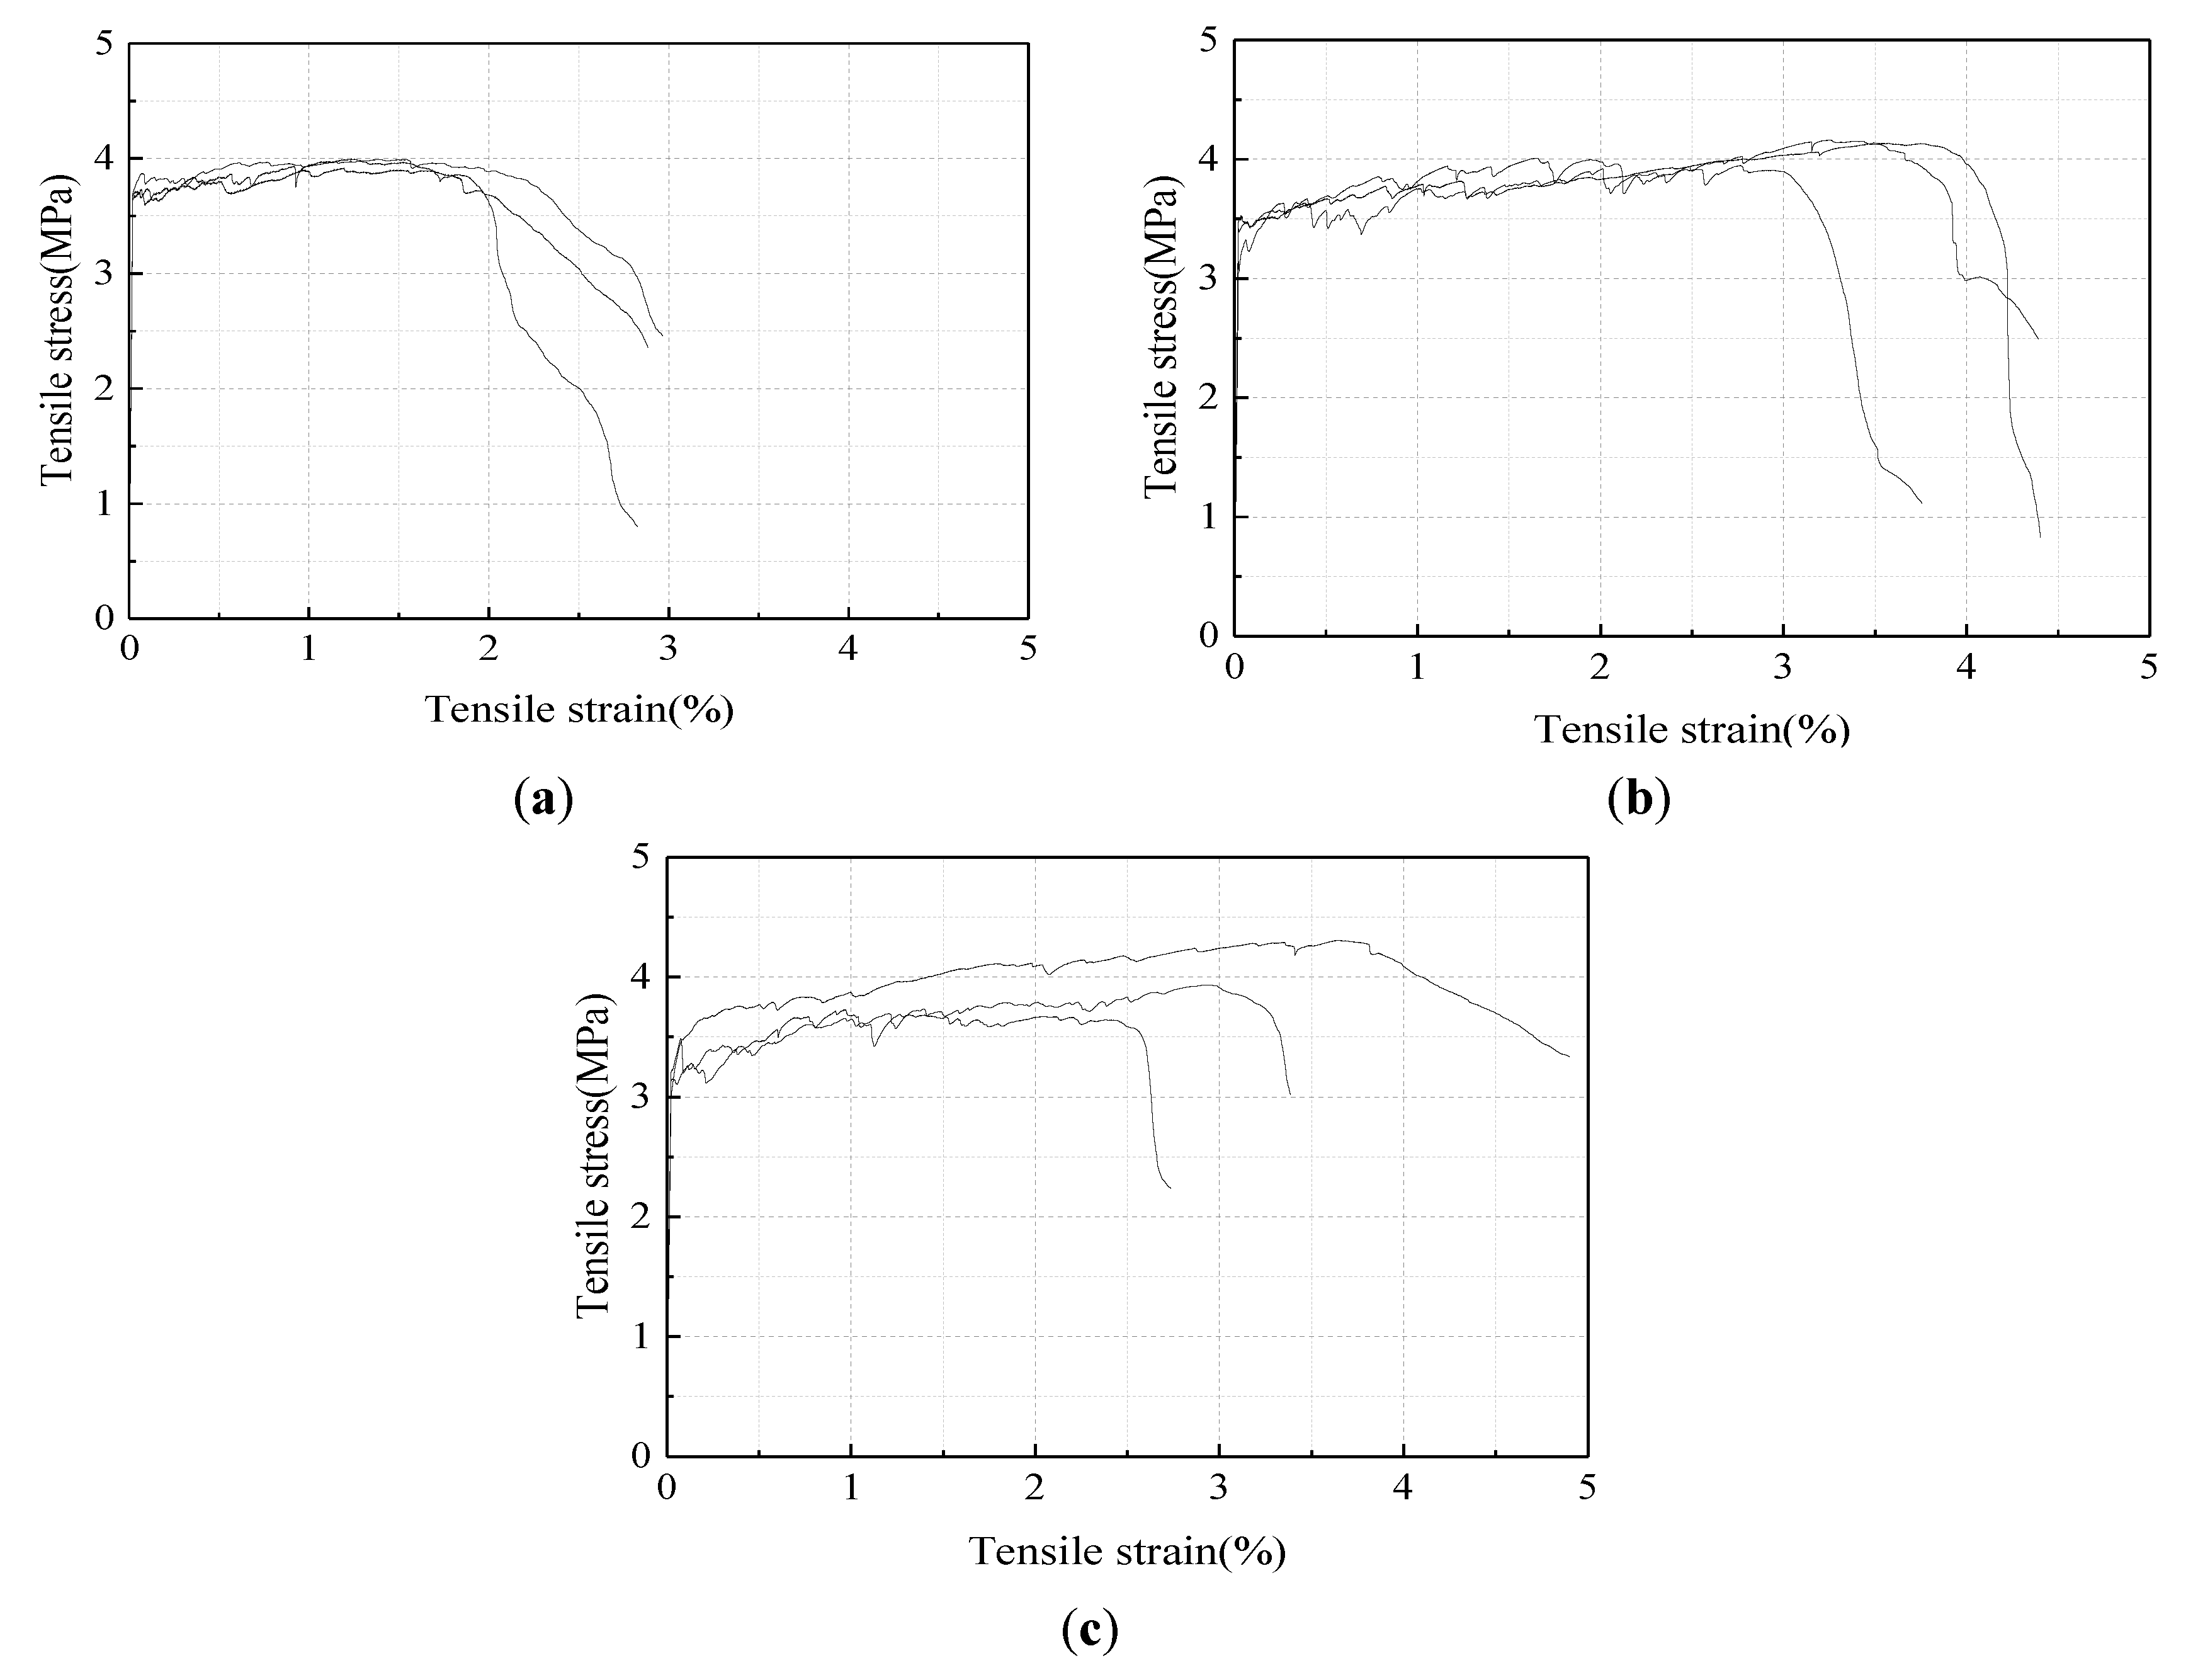
- Specimens under direct tension tested in this study exhibited obvious multiple cracking and strain-hardening behavior, if the specimens were well aligned. The measured specimens reached tensile strain capacities near or over 2%. When the FA to cement ratio increased from 2.4 to 3.2, the tensile strain capacity increased by 78%; however, when the FA to cement ratio increased from 3.2 to 4.4, the stability reduced while the tensile strain capacity decreased by 10%.
- (4)
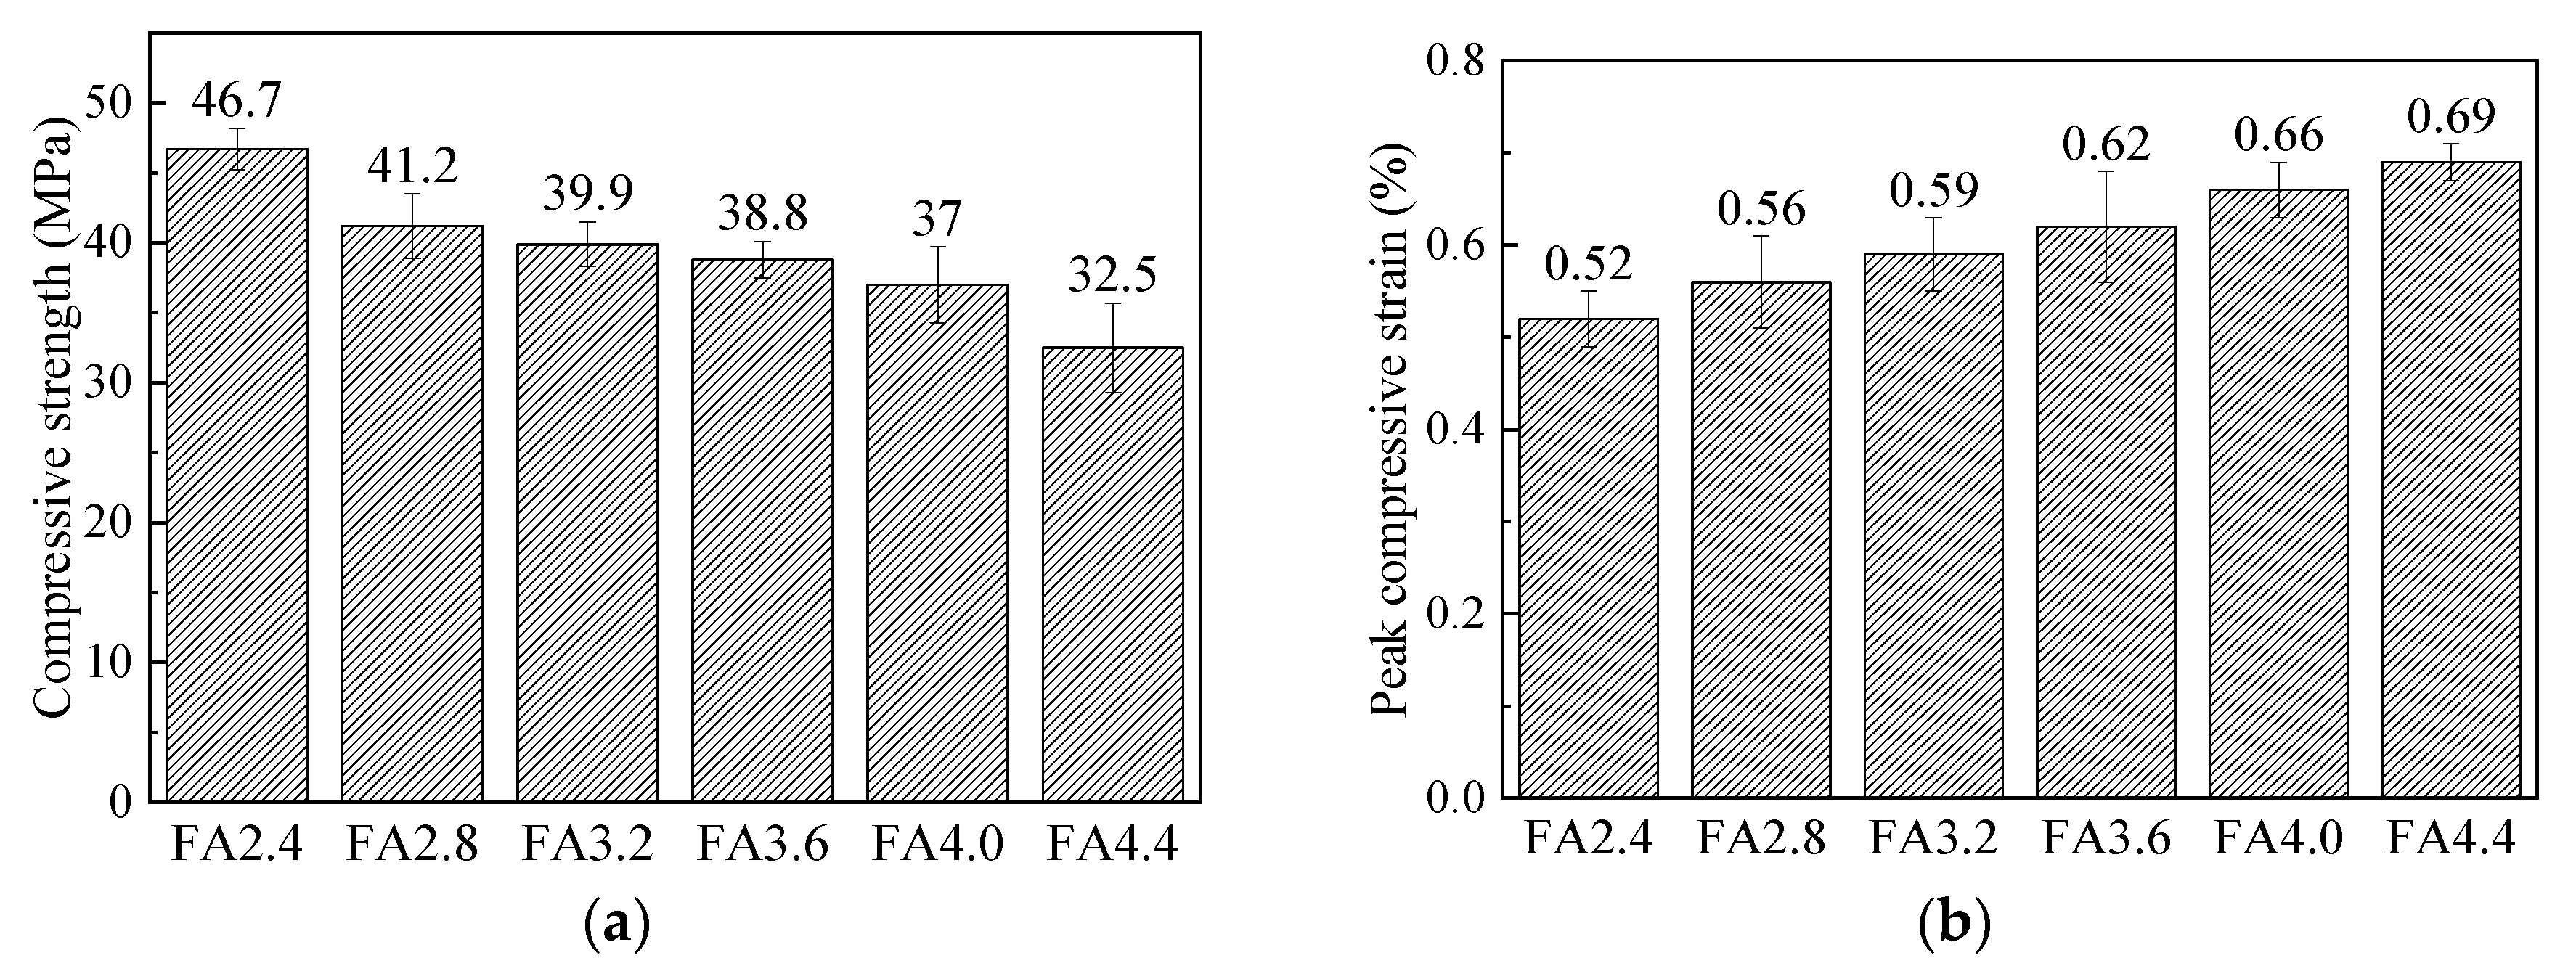
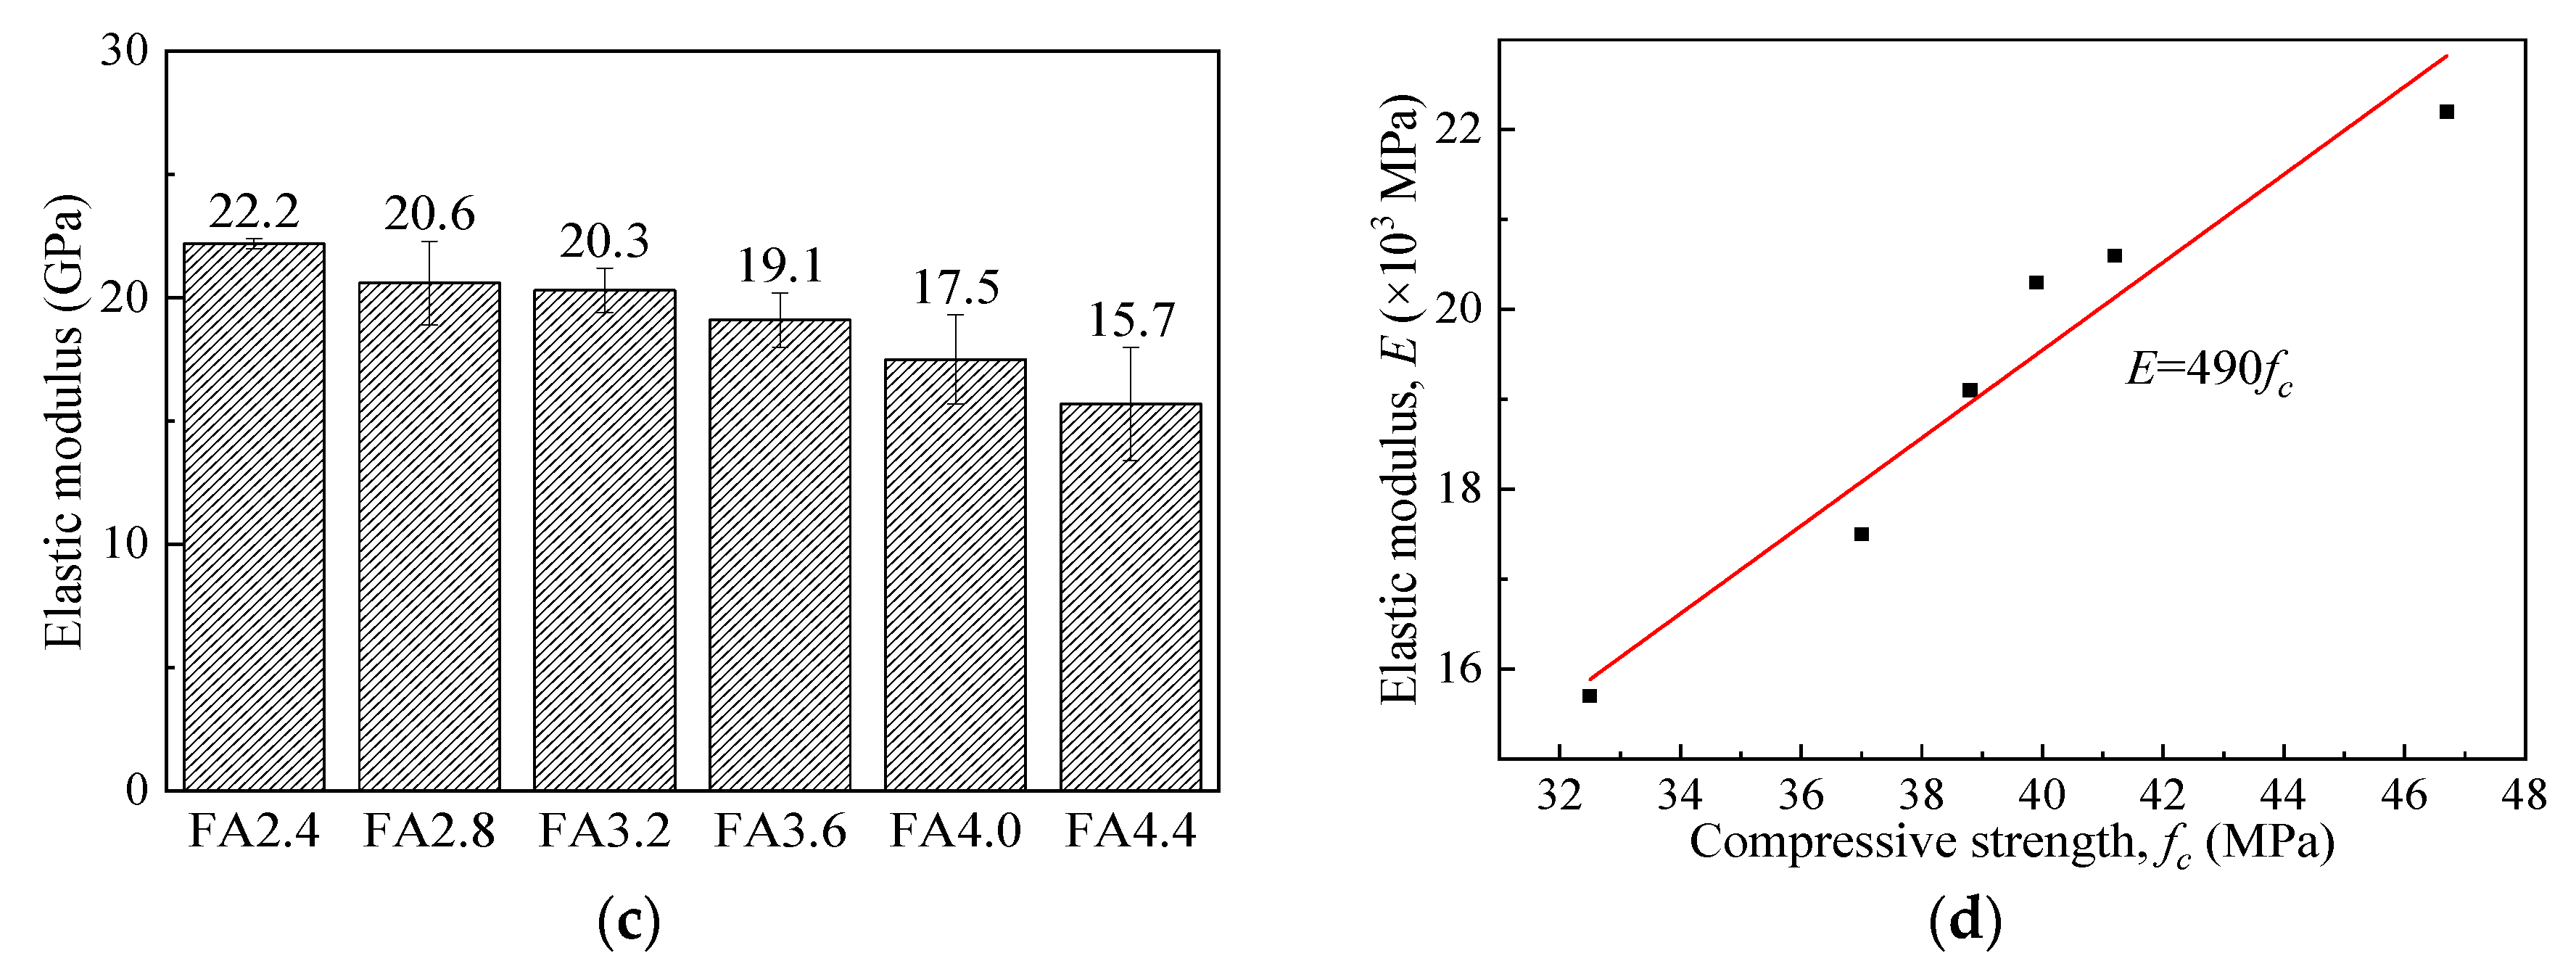
- The 7 day compressive strength and elastic modulus of HVFA-SHCCs were relatively lower than those of normal concrete, and prominently decreased with the increase of FA to cement ratio. For Mix FA3.2, the 7 day strength was only 46.6% of that at the age of 28 days, indicating that the initial strength decreased with the addition of a large amount of fly ash. However, all mixes used in this study could exceed the target compressive strength of 30 MPa at 28 days.
- (5)
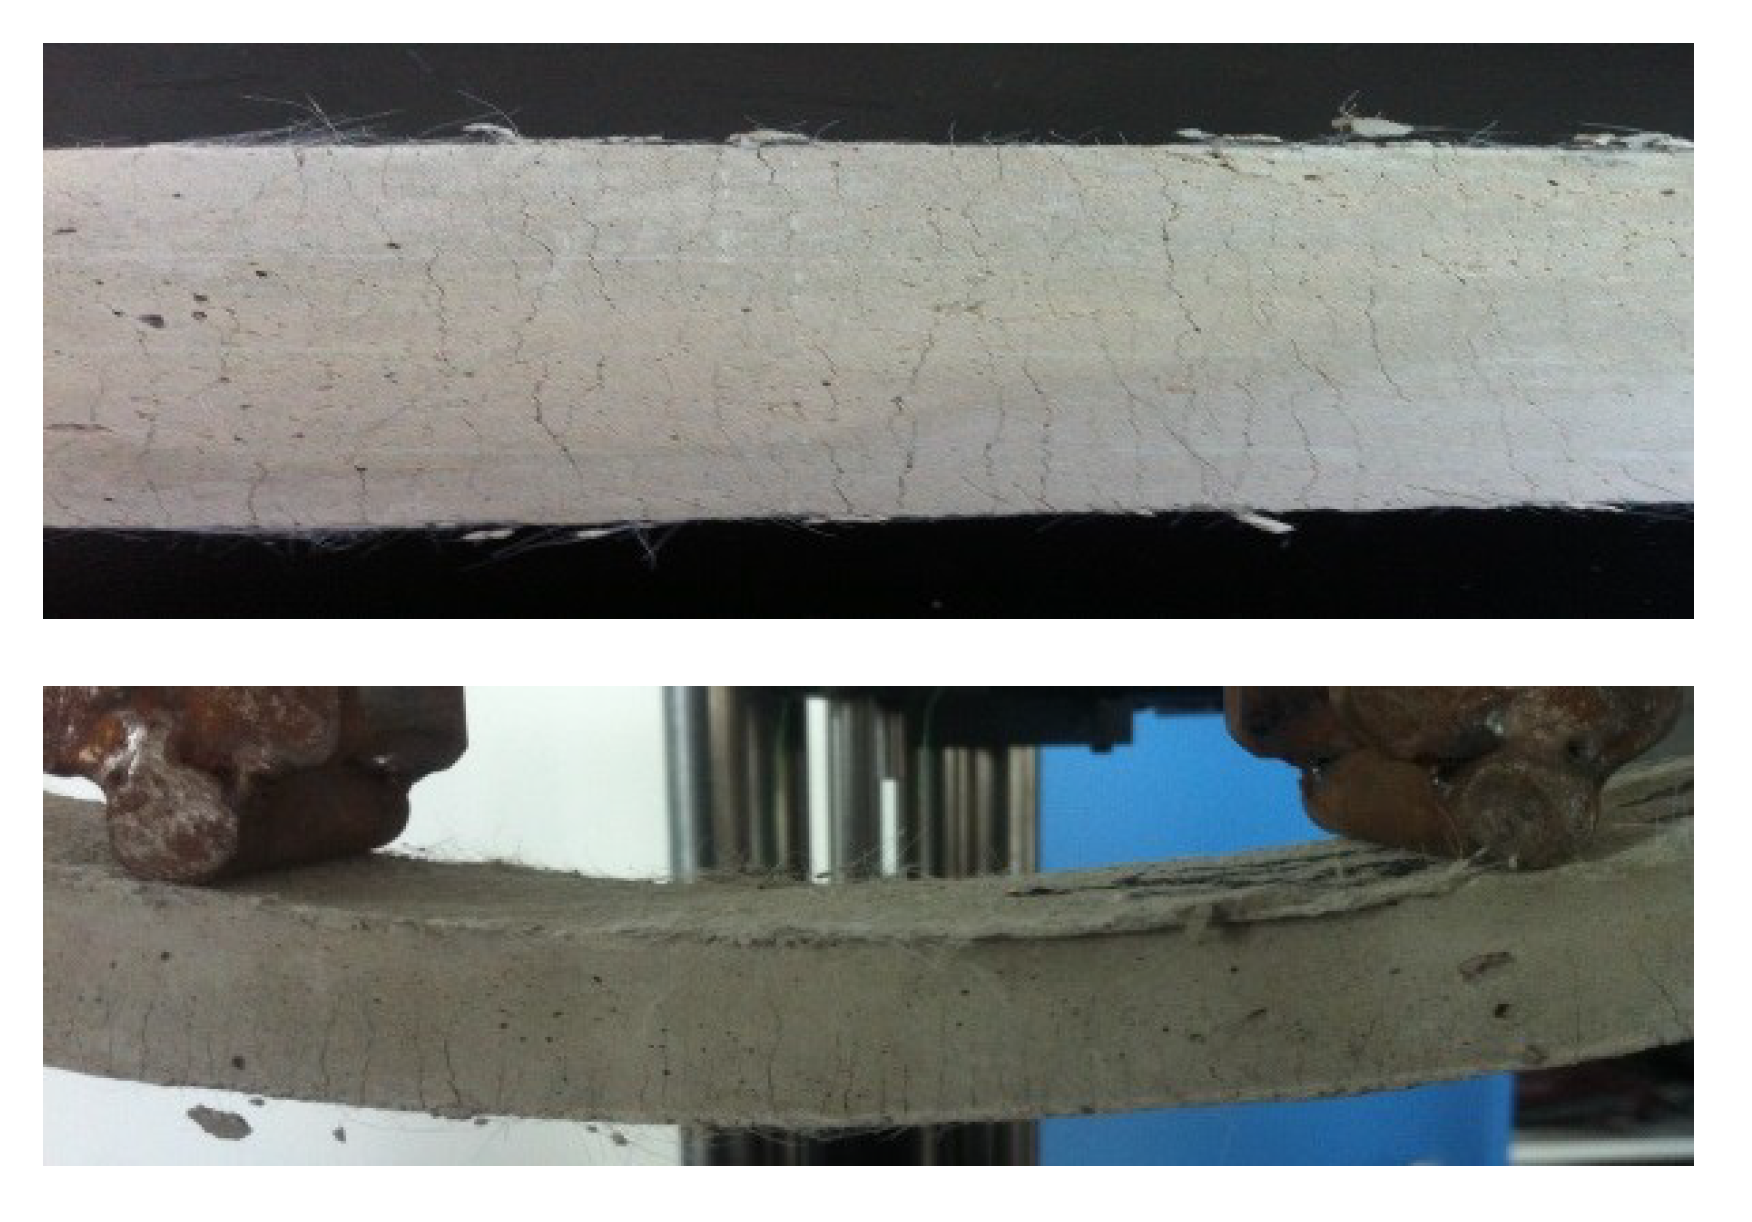
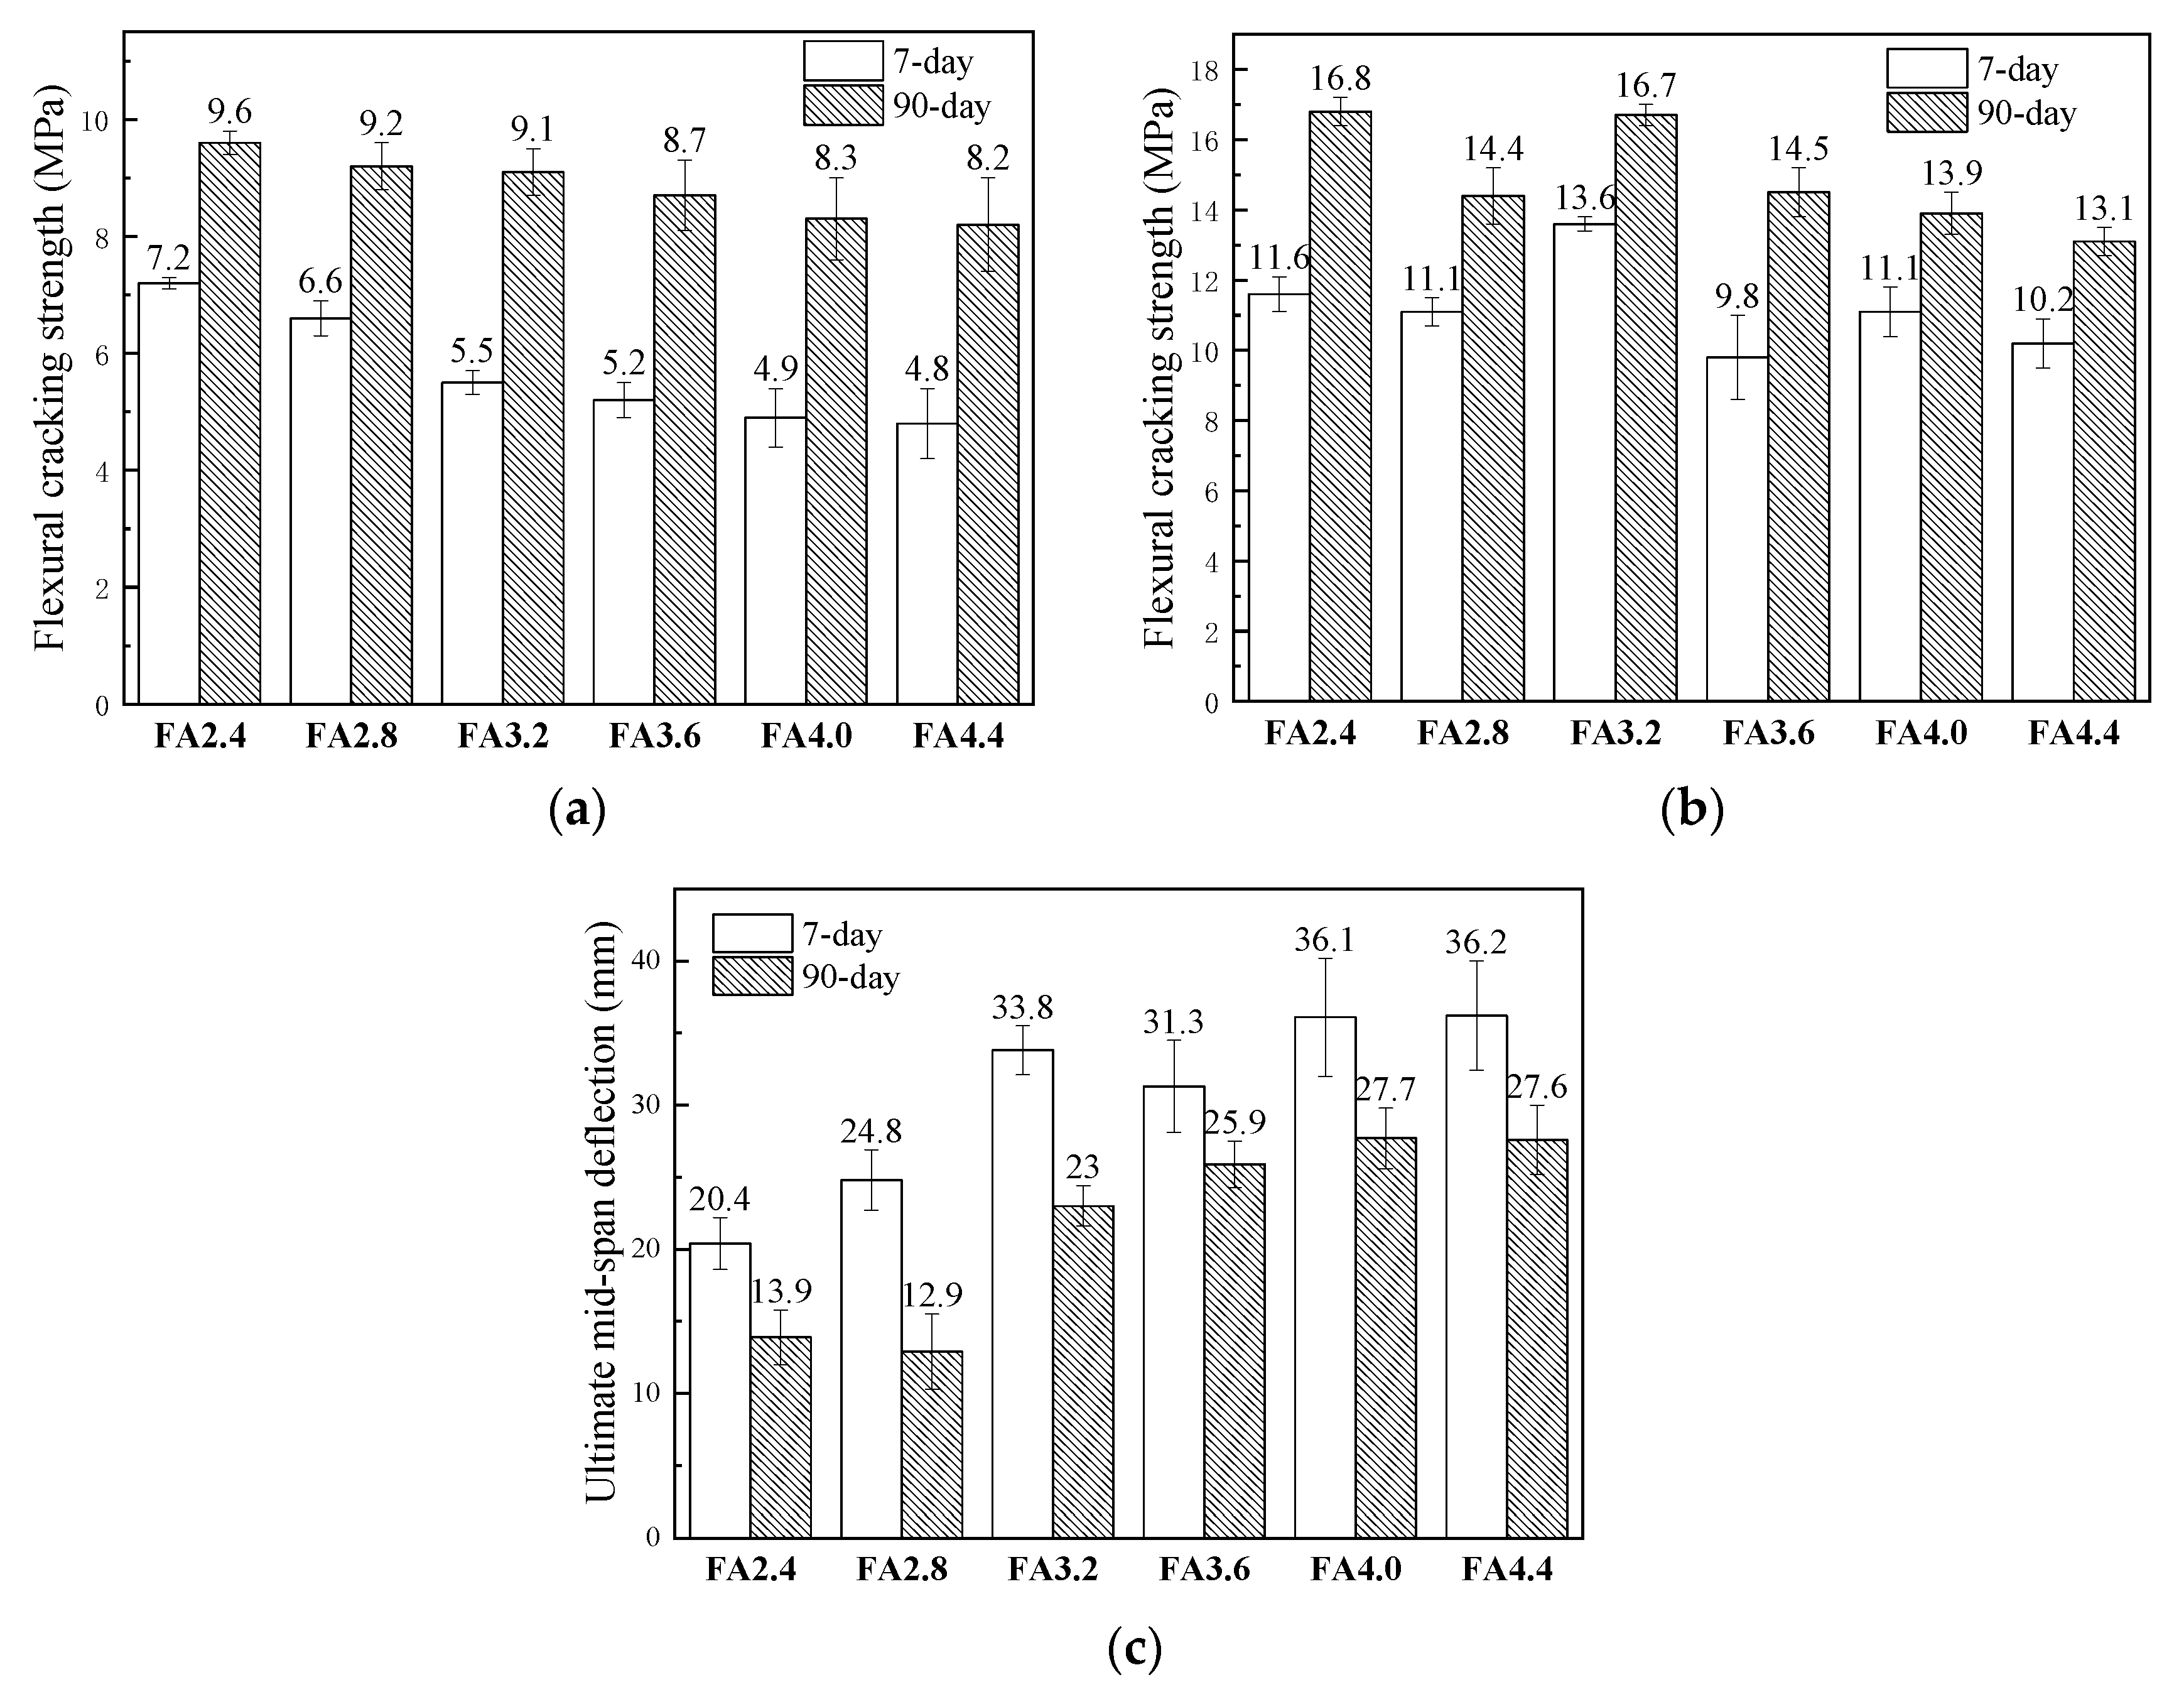
- Distributed multiple cracks were observed on the prepared HVFA-SHCC specimens during the four-point tests. The first cracking strengths of HVFA-SHCC specimens linearly decreased with increasing fly ash content, while their flexural strengths did not absolutely decrease with the increase of fly ash content, since the flexural strength was influenced not only by the matrix strength, but also by the deformation ability. The ultimate mid-span deflection initially grew with rising content of fly ash, but the increase of fly ash no longer improved the flexural ductility of the material significantly after the replacement rate of fly ash to cement was over 76%.
- (6)
- After taking a full account of the tensile, compressive, and flexural performance of the specimens, HVFA-SHCC mix FA3.2 (with fly ash to cement ratio of 3.2 or fly ash to binder ratio of about 76%) is suggested for structural application.
Author Contributions
Funding
Acknowledgments
Conflicts of Interest
References
- National Development and Reform Commission of China. Annual Report on Comprehensive Utilization of Resources 2014; National Development and Reform Commission of China: Beijing, China, 2014. [Google Scholar]
- Yao, Z.T.; Ji, X.S.; Sarker, P.K.; Tang, J.H.; Ge, L.Q.; Xia, M.S.; Xi, Y.Q. A comprehensive review on the applications of coal fly ash. Earth Sci. Rev. 2015, 141, 105–121. [Google Scholar] [CrossRef] [Green Version]
- Fernández-Jiménez, A.; Palomo, A.; Criado, M. Microstructure development of alkali-activated fly ash cement: A descriptive model. Cem. Concr. Res. 2005, 35, 1204–1209. [Google Scholar] [CrossRef]
- Rashad, A.M. A brief on high-volume Class F fly ash as cement replacement—A guide for Civil Engineers. Int. J. Sustain. Built Environ. 2015, 4, 278–306. [Google Scholar] [CrossRef]
- Tang, S.W.; Cai, X.H.; He, Z.; Shao, H.Y.; Li, Z.J.; Chen, E. Hydration process of fly ash blended cement pastes by impedance measurement. Constr. Build. Mater. 2016, 113, 939–950. [Google Scholar] [CrossRef]
- Environmental Protection Agency. Regulatory Determination on Wastes from the Combustion of Fossil Fuels; Final Rule, Part III; Environmental Protection Agency: Washing, DC, USA, 2000. [Google Scholar]
- Dermatas, D.; Meng, X. Utilization of fly ash for stabilization/solidification of heavy metal contaminated soils. Eng. Geol. 2003, 70, 377–394. [Google Scholar] [CrossRef]
- Yu, J.; Lu, C.; Leung, C.K.Y.; Li, G. Mechanical properties of green structural concrete with ultrahigh-volume fly ash. Constr. Build. Mater. 2017, 147, 510–518. [Google Scholar] [CrossRef]
- Li, G. Properties of high-volume fly ash concrete incorporating nano-SiO2. Cem. Concr. Res. 2004, 34, 1043–1049. [Google Scholar] [CrossRef]
- Yang, E.H.; Yang, Y.; Li, V.C. Use of high volumes of fly ash to improve ECC mechanical properties and material greenness. ACI Mater. J. 2007, 104, 620–628. [Google Scholar]
- Wang, A.; Zhang, C.; Sun, W. Fly ash effects: III. The microaggregate effect of fly ash. Cem. Concr. Res. 2004, 34, 2061–2066. [Google Scholar] [CrossRef]
- Wang, A.; Zhang, C.; Sun, W. Fly ash effects: I. The morphological effect of fly ash. Cem. Concr. Res. 2003, 33, 2023–2029. [Google Scholar] [CrossRef]
- Li, Z. Advanced Concrete Technology; John Wiley & Sons: Hoboken, NJ, USA, 2011. [Google Scholar]
- Lam, L.; Wong, Y.L.; Poon, C.S. Degree of hydration and gel/space ratio of high-volume fly ash/cement systems. Cem. Concr. Res. 2000, 30, 747–756. [Google Scholar] [CrossRef]
- Yu, J.; Mishra, D.K.; Wu, C.; Leung, C.K.Y. Very high volume fly ash green concrete for applications in India. Waste Manag. Res. 2018, 36, 520–526. [Google Scholar] [CrossRef] [PubMed] [Green Version]
- Li, V.C.; Leung, C.K.Y. Steady state and multiple cracking of short random fiber composites. J. Eng. Mech. ASCE 1992, 188, 2246–2264. [Google Scholar] [CrossRef]
- Li, V.C.; Stang, H.; Krenchel, H. Micromechanics of crack bridging in fiber reinforced concrete. Mater. Struct. 1993, 26, 486–494. [Google Scholar] [CrossRef]
- Li, V.C. Engineered Cementitious Composites—Tailored Composites through Micromechanical Modeling. In Fiber-Reinforced Concrete: Present and the Future; Banthia, N., Bentur, A., Mufri, A., Eds.; Canadian Society for Civil Engineering: Montreal, QC, Canada, 1998; pp. 64–97. [Google Scholar]
- Li, V.C. Engineered Cementitious Composite (ECC)-Material, Structure and Durability Performance. In Concrete Construction Engineering Handbook; Nawy, E.G., Ed.; CRC Press: Boca Raton, FL, USA, 2008; Chapter 24. [Google Scholar]
- Wittmann, F.H.; Wilhelm, T.; Beltzung, F.; Grübl, P. Multi-crack formation in strain hardening cement-based composites. In Fifth International RILEM Workshop on High Performance Fiber Reinforced Cement Composites (HPFRCC5); Reinhardt, H.W., Naaman, A.E., Eds.; RILEM Publications: Paris, France, 2007; pp. 125–134. [Google Scholar]
- Szeląg, M. Evaluation of cracking patterns of cement paste containing polypropylene fibers. Compos. Struct. 2019, 220, 402–411. [Google Scholar] [CrossRef]
- Szeląg, M. Influence of specimen’s shape and size on the thermal cracks’ geometry of cement paste. Constr. Build. Mater. 2018, 189, 1155–1172. [Google Scholar] [CrossRef]
- National Standard of China. Code for Design of Concrete Structures (GB50010-2010); Building Industry Press: Beijing, China, 2010. [Google Scholar]
- Li, V.C.; Leung, C.K.Y. Theory of Steady State and Multiple Cracking of Random Discontinuous Fiber Reinforced Brittle Matrix Composites. J. Eng. Mech. 1992, 118, 2246–2264. [Google Scholar] [CrossRef]
- Lin, Z.; Kanda, T.; Li, V.C. On Interface Property Characterization and Performance of Fiber Reinforced Cementitious Composites. J. Concr. Sci. Eng. 1999, 1, 173–184. [Google Scholar]
- Li, V.C.; Wu, H.C. Conditions for pseudo strain-hardening in fiber reinforced brittle matrix composites. Appl. Mech. Rev. 1992, 45, 390–398. [Google Scholar] [CrossRef]
- Yang, E.H.; Wang, S.; Yang, Y.; Li, V.C. Fiber-bridging constitutive law of engineered cementitious composites. J. Adv. Concr. Technol. 2008, 6, 181–193. [Google Scholar] [CrossRef]
- Kanda, T.; Li, V.C. Multiple cracking sequence and saturation in fiber reinforced cementitious composite. Concr. Res. Technol. JCI 1998, 9, 19–33. [Google Scholar] [CrossRef]
- Li, V.C.; Wu, C.; Wang, S.X.; Ogawa, A.; Saito, T. Interface tailoring for strain-hardening Polyvinyl Alcohol-Engineered Cementitious Composite (PVA-ECC). ACI Mater. J. 2002, 99, 463–472. [Google Scholar]
- Brouwers, H.J.H.; Radix, H.J. Self-compacting concrete: The role of the particle size distribution. In Proceedings of the First International Symposium on Design, Performance and Use of Self-Consolidating Concrete, Changsha, China, 26–28 May 2005. [Google Scholar]
- Brouwers, H.J.H.; Radix, H.J. Self-compacting concrete: Theoretical and experimental study. Cem. Concr. Res. 2005, 35, 2116–2136. [Google Scholar] [CrossRef]
- Lepech, M.D.; Li, V.C. Large-Scale Processing of Engineered Cementitious Composites. ACI Mater. J. 2008, 105, 358–366. [Google Scholar]
- Funk, J.E.; Dinger, D.R. Particle Packing, Part VI—Applications of Particle Size Distribution Concepts. Interceram 1994, 43, 350–353. [Google Scholar]
- Ferrara, L.; Park, Y.D.; Shah, S.P. A method for mix-design of fiber-reinforced self-compacting concrete. Cem. Concr. Res. 2007, 37, 957–971. [Google Scholar] [CrossRef]
- Hunger, M. An Integral Design Concept for Ecological Self-Compacting Concrete. Ph.D. Thesis, Eindhoven University of Technology, Eindhoven, The Netherlands, 2010. [Google Scholar]
- Yu, Q.L.; Spiesz, P.; Brouwers, H.J.H. Development of cement-based lightweight composites—Part 1: Mix design methodology and hardened properties. Cem. Concr. Compos. 2013, 44, 17–29. [Google Scholar] [CrossRef]
- Hüsken, G. A Multifunctional Design Approach for Sustainable Concrete: With Application to Concrete Mass Products. Ph.D. Thesis, Technische Universiteit Eindhoven, Eindhoven, The Netherlands, 2010. [Google Scholar]
- National Standard of China. Standard for Test Method of Mechanical Properties on Ordinary Concrete (GB/T 50081-2002); Building Industry Press: Beijing, China, 2002. [Google Scholar]

| Df (μm) | Lf (mm) | Ef (GPa) | Vf (%) | τ0 (MPa) | Gd (J/m2) | ff (MPa) |
|---|---|---|---|---|---|---|
| 39 | 12 | 22 | 2.0 | 1.0 | 1.5 | 1092 |
| Sample | Cement (kg) | FA (kg) | S/B Ratio * | W/B Ratio ** | Vf (%) | SP (kg) |
|---|---|---|---|---|---|---|
| FA2.4 | 1.0 | 2.4 | 0.36 | 0.25 | 2.0 | 0.0082 |
| FA2.8 | 1.0 | 2.8 | 0.36 | 0.25 | 2.0 | 0.0062 |
| FA3.2 | 1.0 | 3.2 | 0.36 | 0.25 | 2.0 | 0.0071 |
| FA3.6 | 1.0 | 3.6 | 0.36 | 0.25 | 2.0 | 0.0068 |
| FA4.0 | 1.0 | 4.0 | 0.36 | 0.25 | 2.0 | 0.0047 |
| FA4.4 | 1.0 | 4.4 | 0.36 | 0.25 | 2.0 | 0.0042 |
| Materials | SiO2 (%) | Al2O3 (%) | Fe2O3 (%) | CaO (%) | MgO (%) | K2O (%) | Na2O (%) | SO3 (%) | LOI (%) |
|---|---|---|---|---|---|---|---|---|---|
| Fly ash | 49.29 | 27.8 | 6.63 | 7.22 | 0.84 | 1.21 | 0.45 | 0.71 | 3.99 |
| Cement | 20.35 | 4.38 | 3.37 | 63.85 | 2.13 | 0.38 | 0.11 | 4.26 | 1.17 |
| Type | Diameter (μm) | Length (mm) | Elongation (%) | Density (g/cm3) | Elastic Modulus (MPa) | Nominal Strength (MPa) |
|---|---|---|---|---|---|---|
| REC-15 | 39 | 12 | 7 | 1.3 | 42.8 | 1620 |
| Sample | εfc (%) | σfc (MPa) | εtu (%) | σtp (MPa) |
|---|---|---|---|---|
| FA2.4 | 0.019 | 3.67 | 1.92 | 3.97 |
| FA3.2 | 0.020 | 3.34 | 3.42 | 4.10 |
| FA4.4 | 0.022 | 3.26 | 3.07 | 3.99 |
© 2019 by the authors. Licensee MDPI, Basel, Switzerland. This article is an open access article distributed under the terms and conditions of the Creative Commons Attribution (CC BY) license (http://creativecommons.org/licenses/by/4.0/).
Share and Cite
Jin, C.; Wu, C.; Feng, C.; Zhang, Q.; Shangguan, Z.; Pan, Z.; Meng, S. Mechanical Properties of High-Volume Fly Ash Strain Hardening Cementitious Composite (HVFA-SHCC) for Structural Application. Materials 2019, 12, 2607. https://doi.org/10.3390/ma12162607
Jin C, Wu C, Feng C, Zhang Q, Shangguan Z, Pan Z, Meng S. Mechanical Properties of High-Volume Fly Ash Strain Hardening Cementitious Composite (HVFA-SHCC) for Structural Application. Materials. 2019; 12(16):2607. https://doi.org/10.3390/ma12162607
Chicago/Turabian StyleJin, Chenhua, Chang Wu, Chengcheng Feng, Qingfang Zhang, Ziheng Shangguan, Zuanfeng Pan, and Shaoping Meng. 2019. "Mechanical Properties of High-Volume Fly Ash Strain Hardening Cementitious Composite (HVFA-SHCC) for Structural Application" Materials 12, no. 16: 2607. https://doi.org/10.3390/ma12162607