Influence of Hospital Volume of Procedures by Year on the Risk of Revision of Total Hip and Knee Arthroplasties: A Propensity Score-Matched Cohort Study

 , ,
, ,
Abstract
:1. Introduction
2. Experimental Section
2.1. Design and Study Population
2.2. Study Variables
2.3. Data Analysis
3. Results
4. Discussion
Author Contributions
Funding
Acknowledgments
Conflicts of Interest
References
- Dy, C.J.; Marx, R.G.; Bozic, K.J.; Pan, T.J.; Padgett, D.E.; Lyman, S. Risk factors for revision within 10 years of total knee arthroplasty. Clin. Orthop. Relat. Res. 2014, 472, 1198–1207. [Google Scholar] [CrossRef] [PubMed]
- Bozic, K.J.; Lau, E.; Ong, K.; Chan, V.; Kurtz, S.; Vail, T.P.; Rubash, H.E.; Berry, D.J. Risk factors for early revision after primary TKA in medicare patients. Clin. Orthop. Relat. Res. 2014, 472, 232–237. [Google Scholar] [CrossRef] [PubMed]
- Australian Orthopaedic Association National Joint Replacement Registry (AOANJRR). Hip, Knee & Shoulder Arthroplasty: 2017 Annual Report; AOA: Adelaide, Australia, 2017. [Google Scholar]
- Bozic, K.J.; Kurtz, S.M.; Lau, E.; Ong, K.; Vail, T.P.; Berry, D.J. The Epidemiology of Revision Total Hip Arthroplasty in the United States. J. Bone Jt. Surg. Am. Vol. 2009, 91, 128–133. [Google Scholar] [CrossRef] [PubMed] [Green Version]
- Jasper, L.L.; Jones, C.A.; Mollins, J.; Pohar, S.L.; Beaupre, L.A. Risk factors for revision of total knee arthroplasty: A scoping review. BMC Musculoskelet. Disord. 2016, 17, 182. [Google Scholar] [CrossRef] [PubMed]
- Pamilo, K.J.; Peltola, M.; Paloneva, J.; Mäkelä, K.; Häkkinen, U.; Remes, V. Hospital volume affects outcome after total knee arthroplasty. Acta Orthop. 2015, 86, 41–47. [Google Scholar] [CrossRef] [PubMed] [Green Version]
- Glassou, E.N.; Hansen, T.B.; Mäkelä, K.; Havelin, L.I.; Furnes, O.; Badawy, M.; Kärrholm, J.; Garellick, G.; Eskelinen, A.; Pedersen, A.B. Association between hospital procedure volume and risk of revision after total hip arthroplasty: A population-based study within the Nordic Arthroplasty Register Association database. Osteoarthr. Cartil. 2016, 24, 419–426. [Google Scholar] [CrossRef] [PubMed]
- Judge, A.; Chard, J.; Learmonth, I.; Dieppe, P. The effects of surgical volumes and training centre status on outcomes following total joint replacement: Analysis of the Hospital Episode Statistics for England. J. Public Health (Oxf). 2006, 28, 116–124. [Google Scholar] [CrossRef] [PubMed]
- Manley, M.; Ong, K.; Lau, E.; Kurtz, S.M. Effect of Volume on Total Hip Arthroplasty Revision Rates in the United States Medicare Population. J. Bone Jt. Surg. Am. Vol. 2008, 90, 2446–2451. [Google Scholar] [CrossRef] [PubMed]
- Manley, M.; Ong, K.; Lau, E.; Kurtz, S.M. Total Knee Arthroplasty Survivorship in the United States Medicare Population. J. Arthroplast. 2009, 24, 1061–1067. [Google Scholar] [CrossRef] [PubMed]
- Paterson, J.M.; Williams, J.I.; Kreder, H.J.; Mahomed, N.N.; Gunraj, N.; Wang, X.; Laupacis, A. Provider volumes and early outcomes of primary total joint replacement in Ontario. Can. J. Surg. 2010, 53, 175–183. [Google Scholar] [PubMed]
- Badawy, M.; Espehaug, B.; Indrekvam, K.; Engesæter, L.B.; Havelin, L.I.; Furnes, O. Influence of Hospital Volume on Revision Rate After Total Knee Arthroplasty with Cement. J. Bone Jt. Surg. 2013, 95, e131. [Google Scholar] [CrossRef] [PubMed]
- Le Cossec, C.; Colas, S.; Zureik, M. Relative impact of hospital and surgeon procedure volumes on primary total hip arthroplasty revision: A nationwide cohort study in France. Arthroplast. Today 2017, 3, 176–182. [Google Scholar] [CrossRef] [PubMed]
- Katz, J.N.; Losina, E.; Barrett, J.; Phillips, C.B.; Mahomed, N.N.; Lew, R.A.; Guadagnoli, E.; Harris, W.H.; Poss, R.; Baron, J.A. Association between hospital and surgeon procedure volume and outcomes of total hip replacement in the United States medicare population. J. Bone Joint Surg. Am. 2001, 83–A, 1622–1629. [Google Scholar] [CrossRef]
- Arias-de la Torre, J.; Valderas, J.M.; Evans, J.; Martín, V.; Molina, A.J.; Muñoz, L.; Pons-Cabrafiga, M.; Espallargues, M. Differences in risk of revision and mortality between total and unicompartmental knee arthroplasty. The influence of hospital volume. J. Arthroplast. 2019, 34, 865–871. [Google Scholar] [CrossRef] [PubMed]
- Cook, J.A.; Ranstam, J. Statistical models and confounding adjustment. Br. J. Surg. 2017, 104, 786–787. [Google Scholar] [CrossRef] [PubMed] [Green Version]
- Johnson, S.R.; Tomlinson, G.A.; Hawker, G.A.; Granton, J.T.; Feldman, B.M. Propensity Score Methods for Bias Reduction in Observational Studies of Treatment Effect. Rheum. Dis. Clin. North Am. 2018, 44, 203–213. [Google Scholar] [CrossRef] [PubMed]
- Domingo, L.; Arias, J.; Martínez, O.; Espallargues, M. On behalf of the Executive Commitee and the Advisory Commitee of the RACat. In Catalan Arthroplasty Register. Third Report (2005–2014); Agency for Health Quality and Assessment of Catalonia. Catalan Health Ministry. Government of Catalonia: Barcelona, Spain, 2017. [Google Scholar]
- StataCorp. Stata Statistical Software: Release 14; StataCorp: College Station, TX, USA, 2015. [Google Scholar]
- De Steiger, R.N.; Lorimer, M.; Solomon, M. What Is the Learning Curve for the Anterior Approach for Total Hip Arthroplasty? Clin. Orthop. Relat. Res. 2015, 473, 3860–3866. [Google Scholar] [CrossRef] [PubMed] [Green Version]
- Ravi, B.; Croxford, R.; Austin, P.C.; Hollands, S.; Paterson, J.M.; Bogoch, E.; Kreder, H.; Hawker, G.A. Increased Surgeon Experience With Rheumatoid Arthritis Reduces the Risk of Complications Following Total Joint Arthroplasty. Arthritis Rheumatol. 2014, 66, 488–496. [Google Scholar] [CrossRef] [PubMed] [Green Version]
- Baker, P.; Jameson, S.; Critchley, R.; Reed, M.; Gregg, P.; Deehan, D. Center and surgeon volume influence the revision rate following unicondylar knee replacement an analysis of 23,400 medial cemented unicondylar knee replacements. J. Bone Jt. Surg. Ser. A 2013, 95, 702–709. [Google Scholar] [CrossRef] [PubMed]

| Pre-Matching | Post-Matching | |||||||||
|---|---|---|---|---|---|---|---|---|---|---|
| Higher Volume (n = 11,132) | Lower Volume (n = 7151) | Higher Volume (n = 6886) | Lower Volume (n = 6886) | |||||||
| n | % | n | % | p | n | % | n | % | p | |
| Sex | 0.044 | 0.495 | ||||||||
| Men | 5,439 | 48.86 | 3,603 | 50.38 | 3,426 | 49.75 | 3,466 | 50.33 | ||
| Women | 5,693 | 51.14 | 3,548 | 49.62 | 3,460 | 50.25 | 3,420 | 49.67 | ||
| Age | 0.015 | 0.416 | ||||||||
| <65 | 3,317 | 29.80 | 2,047 | 28.63 | 2,014 | 29.25 | 2,001 | 29.06 | ||
| 65–74 | 3,822 | 34.33 | 2,464 | 34.46 | 2,331 | 33.85 | 2,372 | 34.45 | ||
| 75–84 | 3,562 | 32.00 | 2,408 | 33.67 | 2,287 | 33.21 | 2,293 | 33.30 | ||
| ≥85 | 431 | 3.87 | 232 | 3.24 | 254 | 3.69 | 220 | 3.19 | ||
| Comorbidity (Elixhauser) | 0.020 | 0.821 | ||||||||
| no comorbidity | 4,351 | 39.09 | 2,65 | 37.06 | 2,565 | 37.25 | 2,583 | 37.51 | ||
| 1–2 comorbidities | 5,8 | 52.10 | 3,866 | 54.06 | 3,723 | 54.07 | 3,690 | 53.59 | ||
| 3 or more comorbidities | 981 | 8.81 | 635 | 8.88 | 598 | 8.68 | 613 | 8.90 | ||
| Year of intervention | 0.993 | |||||||||
| 2005/2007 | 982 | 8.82 | 1,116 | 15.61 | 875 | 12.71 | 868 | 12.61 | ||
| 2008/2010 | 2,999 | 26.94 | 2,038 | 28.50 | 2,025 | 29.41 | 2,035 | 29.55 | ||
| 2011/2013 | 3,871 | 34.77 | 2,253 | 31.51 | 2,258 | 32.79 | 2,248 | 32.65 | ||
| 2014/2016 | 3,280 | 29.46 | 1,744 | 24.39 | 1,728 | 25.09 | 1,735 | 25.20 | ||
| Type of fixation | <0.001 | 0.700 | ||||||||
| Cemented | 906 | 8.14 | 719 | 10.05 | 666 | 9.67 | 636 | 9.24 | ||
| Cementless | 7,561 | 67.92 | 4,93 | 68.94 | 4,762 | 69.15 | 4,786 | 69.50 | ||
| Hybrid | 2,512 | 22.57 | 1,397 | 19.54 | 1,388 | 20.16 | 1,384 | 20.10 | ||
| Reverse hybrid | 106 | 0.95 | 93 | 1.30 | 70 | 1.02 | 80 | 1.16 | ||
| Not specified | 47 | 0.42 | 12 | 0.17 | . | . | . | . | ||
| Number of hospitals | 28 | 46 | 28 | 46 | ||||||
| Median follow-up (IQR) | 4.6 (4.5) | 4.8 (4.7) | ||||||||
| Pre-Matching | Post-Matching | |||||||||
|---|---|---|---|---|---|---|---|---|---|---|
| Higher Volume (n = 24,683) | Lower Volume (n = 20,870) | Higher Volume (n = 18,158) | Lower Volume (n = 18,158) | |||||||
| n | % | n | % | p | n | % | n | % | p | |
| Sex | <0.001 | 0.709 | ||||||||
| Men | 6,971 | 28.24 | 6,220 | 29.80 | 5,140 | 28.31 | 5,108 | 28.13 | ||
| Women | 17,712 | 71.76 | 14,65 | 70.20 | 13,018 | 71.69 | 13,050 | 71.87 | ||
| Age | <0.001 | 0.950 | ||||||||
| <65 | 4,02 | 16.29 | 3,608 | 17.29 | 3,117 | 17.17 | 3,157 | 17.39 | ||
| 65–74 | 10,747 | 43.54 | 9,151 | 43.85 | 8,015 | 44.14 | 7,976 | 43.93 | ||
| 75–84 | 9,363 | 37.93 | 7,767 | 37.22 | 6,729 | 37.06 | 6,729 | 37.06 | ||
| ≥85 | 553 | 2.24 | 344 | 1.65 | 297 | 1.64 | 296 | 1.63 | ||
| Comorbidity (Elixhauser) | <0.001 | 0.886 | ||||||||
| no comorbidity | 6,633 | 26.87 | 6,533 | 31.30 | 5,154 | 28.38 | 5,115 | 28.17 | ||
| 1–2 comorbidities | 14,871 | 60.25 | 12,01 | 57.55 | 10,860 | 59.81 | 10,904 | 60.05 | ||
| 3 or more comorbidities | 3,179 | 12.88 | 2,327 | 11.15 | 2,144 | 11.81 | 2,139 | 11.78 | ||
| Year of intervention | <0.001 | 0.756 | ||||||||
| 2005/2007 | 2,994 | 12.13 | 3,287 | 15.75 | 2,328 | 12.82 | 2,388 | 13.15 | ||
| 2008/2010 | 6,846 | 27.74 | 6,097 | 29.21 | 5,493 | 30.25 | 5,428 | 29.89 | ||
| 2011/2013 | 7,136 | 28.91 | 6,36 | 30.47 | 5,711 | 31.45 | 5,700 | 31.39 | ||
| 2014/2016 | 7,707 | 31.22 | 5,126 | 24.56 | 4,626 | 25.48 | 4,642 | 25.56 | ||
| Type of fixation | <0.001 | 0.292 | ||||||||
| Cemented | 18,901 | 76.57 | 16,769 | 80.35 | 15,619 | 86.02 | 15,616 | 86.00 | ||
| Cementless | 205 | 0.83 | 152 | 0.73 | 91 | 0.50 | 148 | 0.82 | ||
| Hybrid | 3,491 | 14.14 | 2,545 | 12.19 | 2,421 | 13.33 | 2,367 | 13.04 | ||
| Reverse hybrid | 184 | 0.75 | 30 | 0.14 | 27 | 0.15 | 27 | 0.15 | ||
| Not specified | 1,902 | 7.71 | 1,374 | 6.58 | . | . | . | |||
| Number of hospitals | 30 | 49 | 30 | 49 | ||||||
| Median follow-up (IQR) | 4.8 (5.0) | 4.9 (4.7) | ||||||||
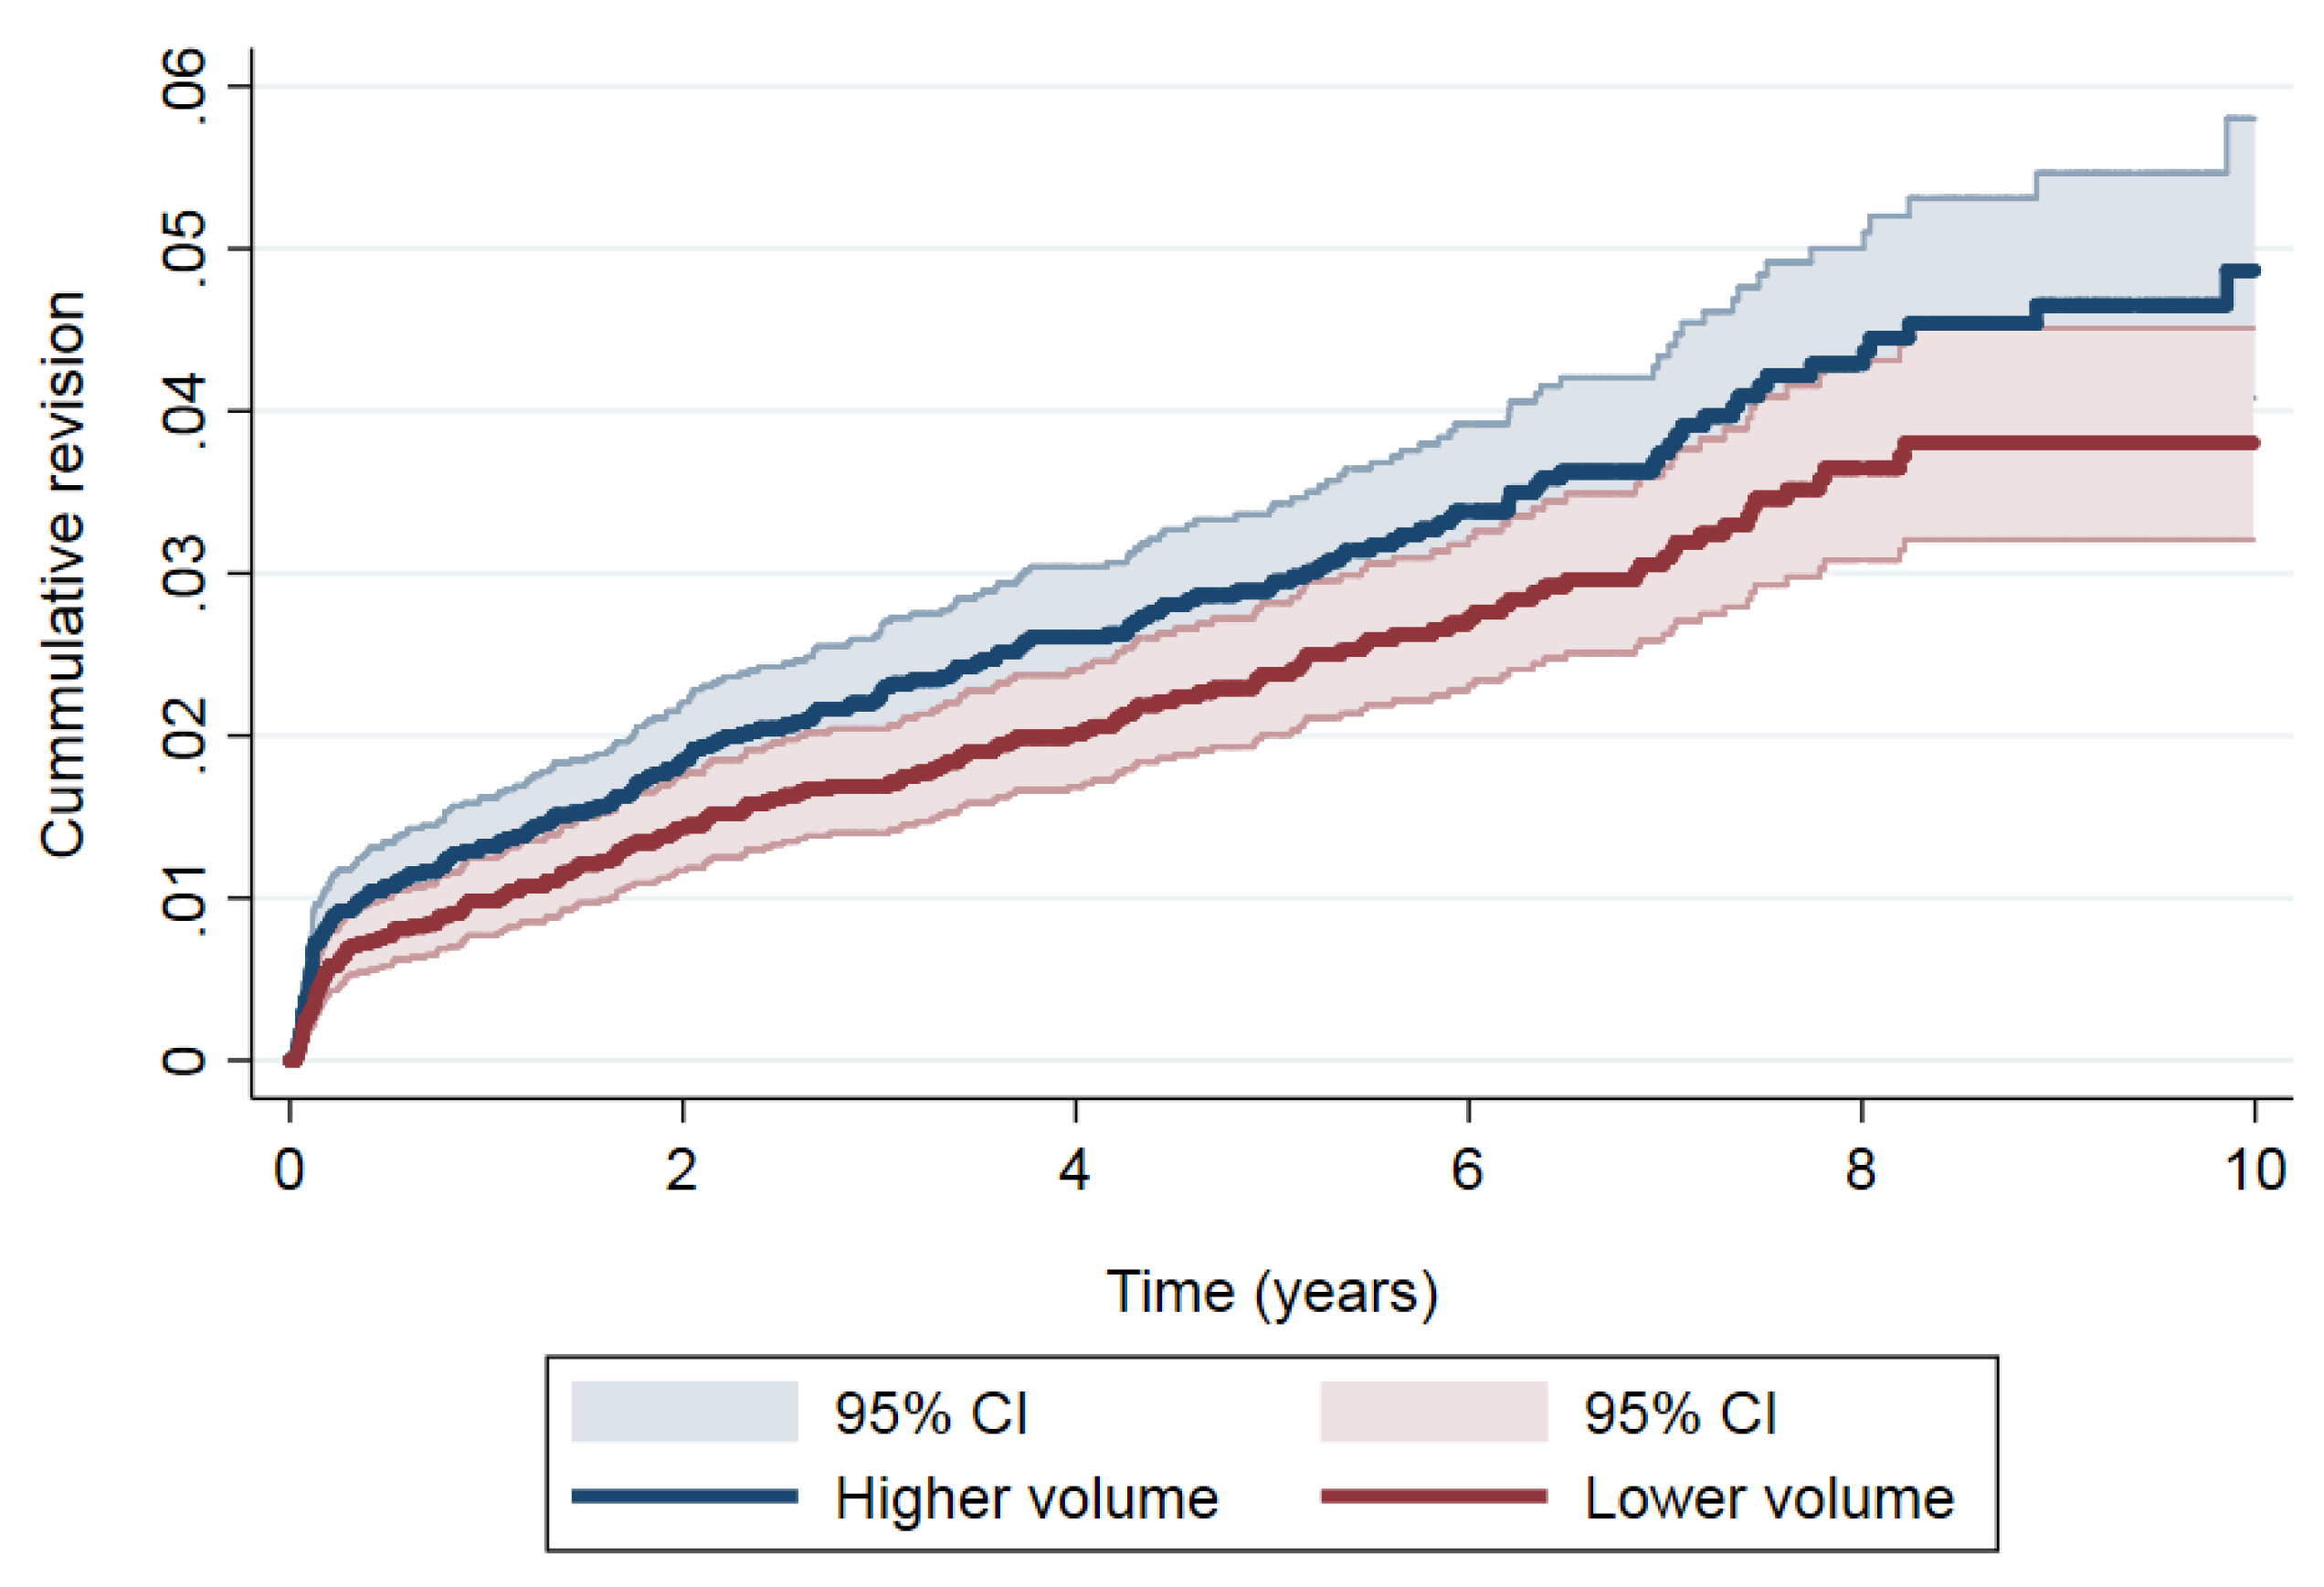
| Time (in Years) | At Risk | Revisions | Cum. Failure (95% CI) | SHR (95% CI) |
|---|---|---|---|---|
| Lower volume | 1.00 | |||
| 1 | 6,258 | 66 | 0.97 (0.76–1.23) | |
| 5 | 3,353 | 70 | 2.32 (1.95–2.74) | |
| 10 | 352 | 32 | 3.63 (3.06–4.27) | |
| Higher volume | 1.25 (1.02–1.53) | |||
| 1 | 6,239 | 89 | 1.31 (1.06–1.61) | |
| 5 | 3,214 | 82 | 2.85 (2.45–3.31) | |
| 10 | 389 | 36 | 4.61 (3.88–5.43) |
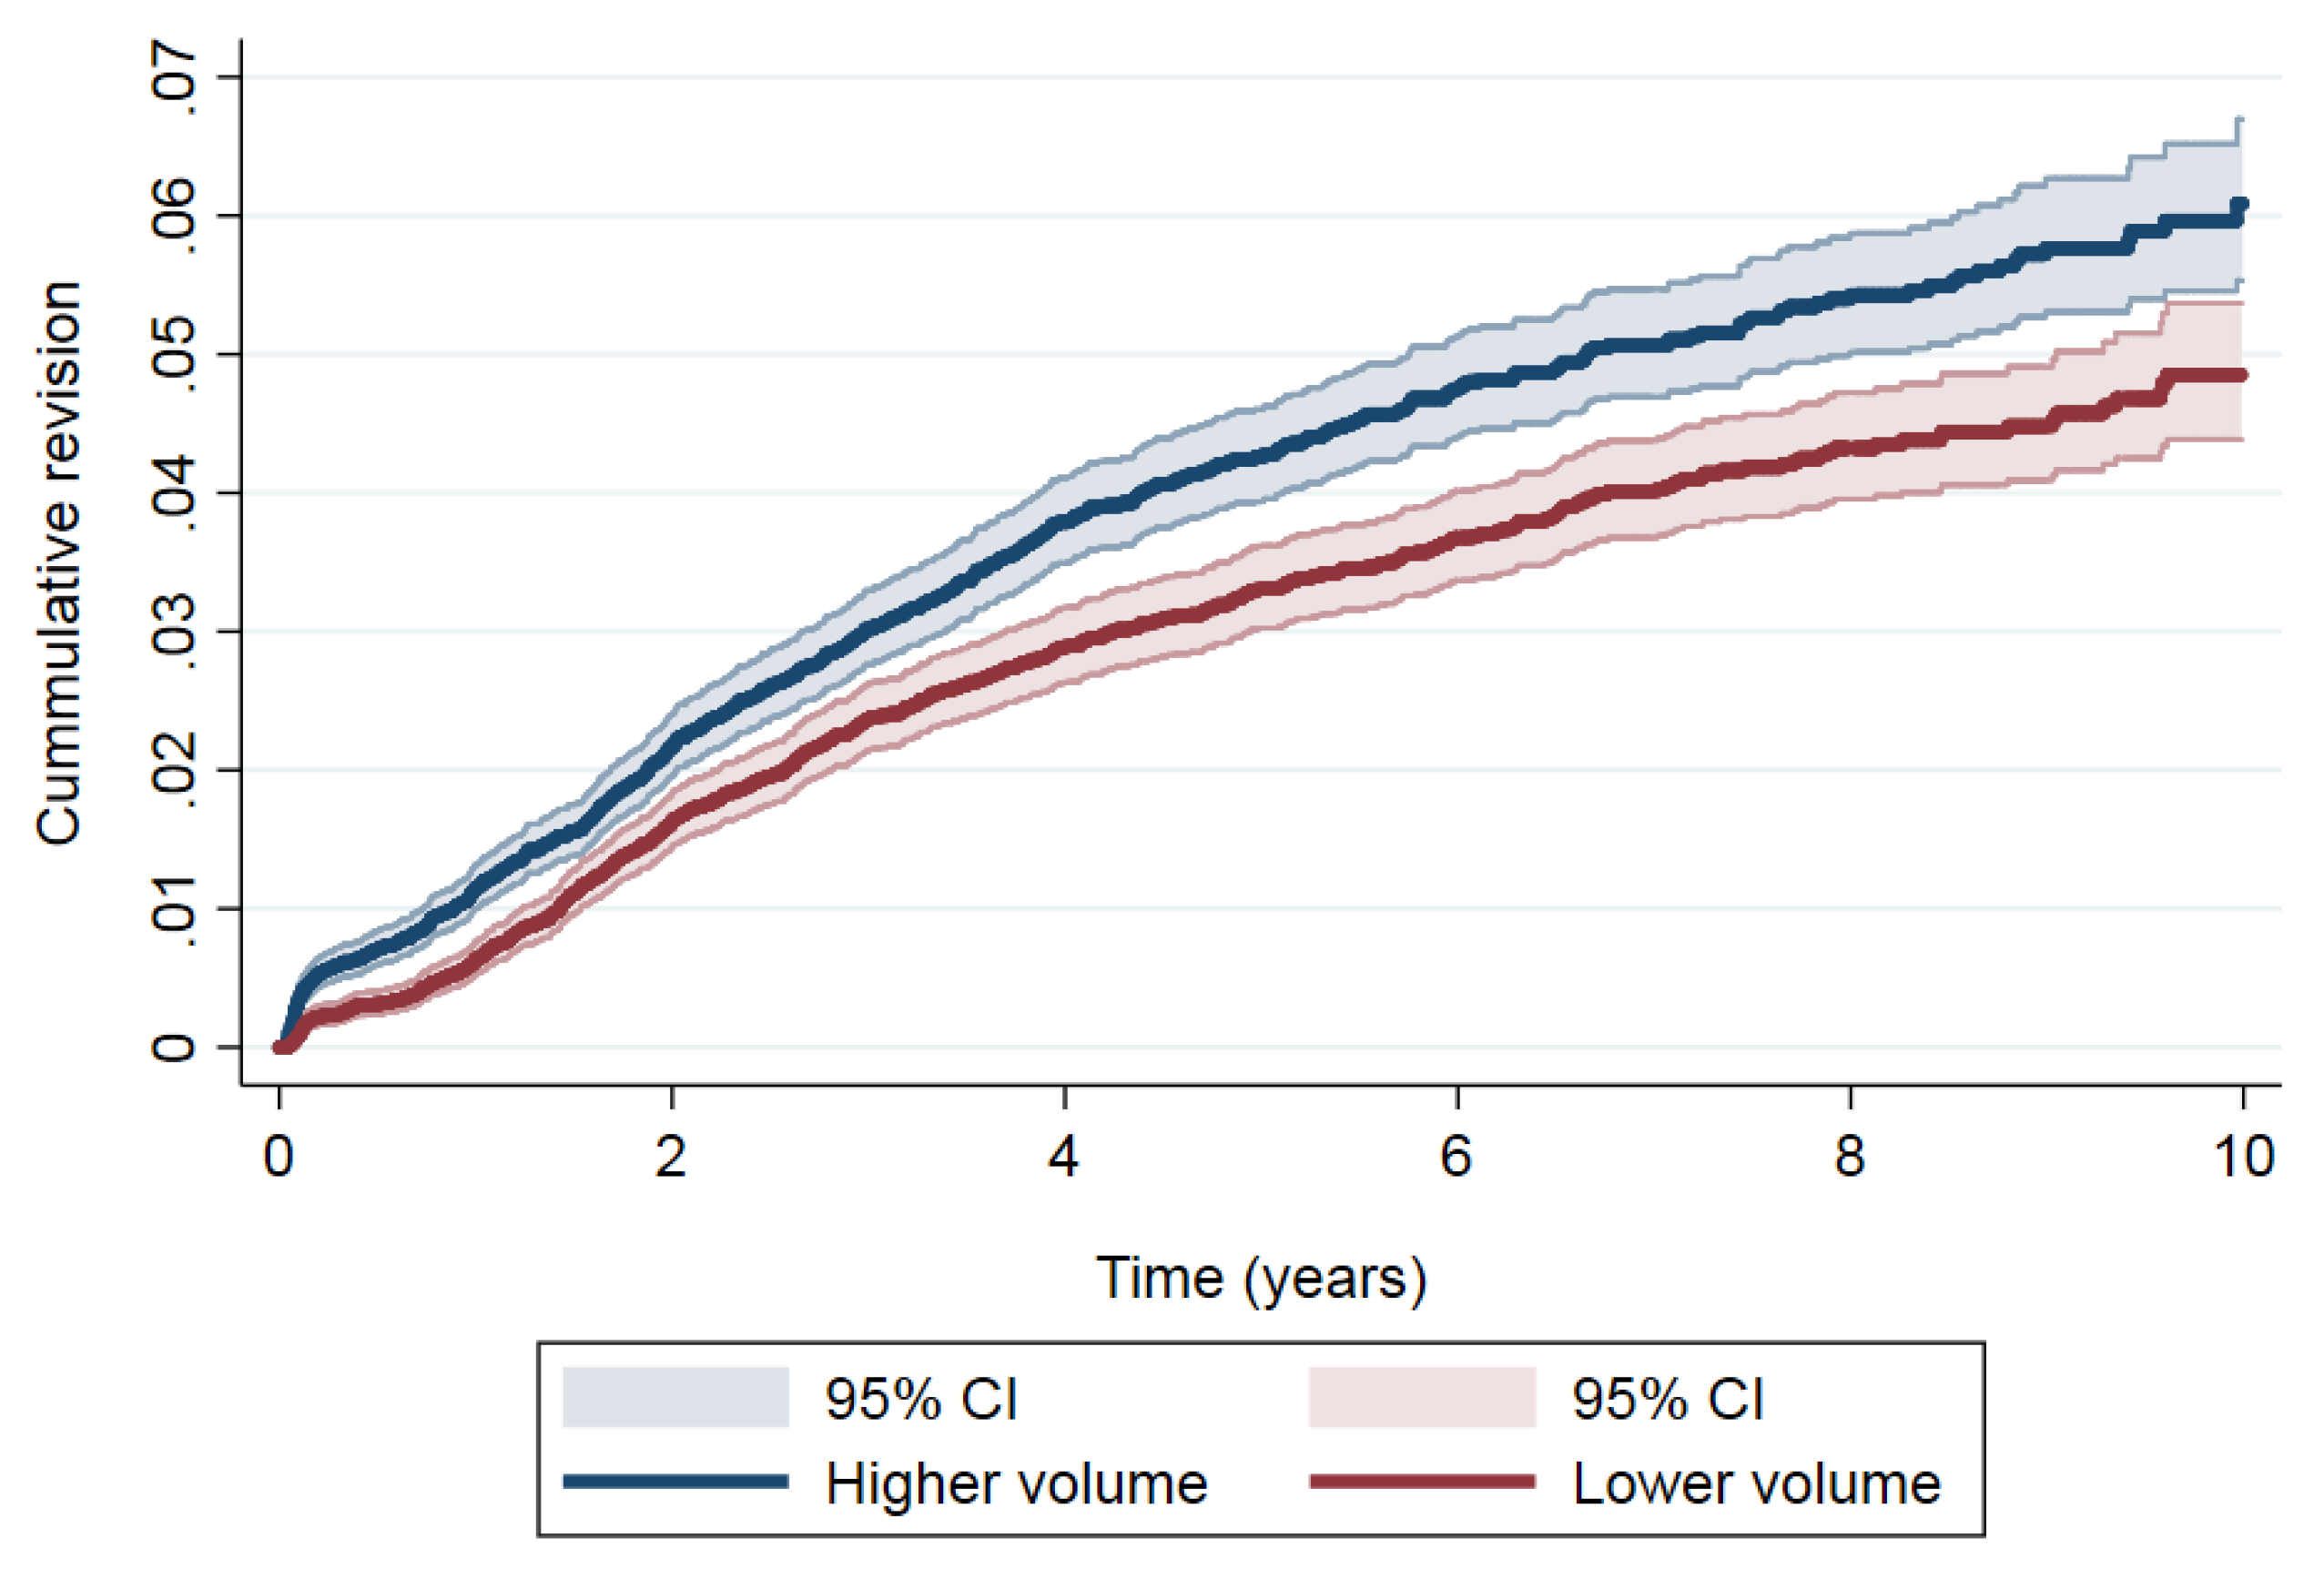
| Time (in Years) | At Risk | Revisions | Cum. Failure (95% CI) | SHR (95% CI) |
|---|---|---|---|---|
| Lower volume | 1.00 | |||
| 1 | 16,594 | 112 | 0.64 (0.53–0.77) | |
| 5 | 9,064 | 366 | 3.24 (2.96–3.53) | |
| 10 | 1,217 | 80 | 4.66 (4.21–5.13) | |
| Higher volume | 1.29 (1.16–1.44) | |||
| 1 | 16,293 | 202 | 1.15 (1.00–1.32) | |
| 5 | 8,673 | 422 | 4.17 (3.85–4.50) | |
| 10 | 744 | 89 | 5.84 (5.33–6.39) |
© 2019 by the authors. Licensee MDPI, Basel, Switzerland. This article is an open access article distributed under the terms and conditions of the Creative Commons Attribution (CC BY) license (http://creativecommons.org/licenses/by/4.0/).
Share and Cite
Arias-de la Torre, J.; Pons-Cabrafiga, M.; Valderas, J.M.; Evans, J.P.; Martín, V.; Molina, A.J.; Pallisó, F.; Smith, K.; Martinez, O.; Espallargues, M. Influence of Hospital Volume of Procedures by Year on the Risk of Revision of Total Hip and Knee Arthroplasties: A Propensity Score-Matched Cohort Study. J. Clin. Med. 2019, 8, 670. https://doi.org/10.3390/jcm8050670
Arias-de la Torre J, Pons-Cabrafiga M, Valderas JM, Evans JP, Martín V, Molina AJ, Pallisó F, Smith K, Martinez O, Espallargues M. Influence of Hospital Volume of Procedures by Year on the Risk of Revision of Total Hip and Knee Arthroplasties: A Propensity Score-Matched Cohort Study. Journal of Clinical Medicine. 2019; 8(5):670. https://doi.org/10.3390/jcm8050670
Chicago/Turabian StyleArias-de la Torre, Jorge, Miquel Pons-Cabrafiga, Jose M. Valderas, Jonathan P Evans, Vicente Martín, Antonio J Molina, Francesc Pallisó, Kayla Smith, Olga Martinez, and Mireia Espallargues. 2019. "Influence of Hospital Volume of Procedures by Year on the Risk of Revision of Total Hip and Knee Arthroplasties: A Propensity Score-Matched Cohort Study" Journal of Clinical Medicine 8, no. 5: 670. https://doi.org/10.3390/jcm8050670