
Association of Plasminogen Activator Inhibitor-1 (PAI-1) Gene Polymorphisms with Osteoporotic Vertebral Compression Fractures (OVCFs) in Postmenopausal Women

 and
and
Abstract
:1. Introduction
2. Results
2.1. Genotype Frequencies of the PAI-1 Polymorphisms
2.2. Haplotype Analysis
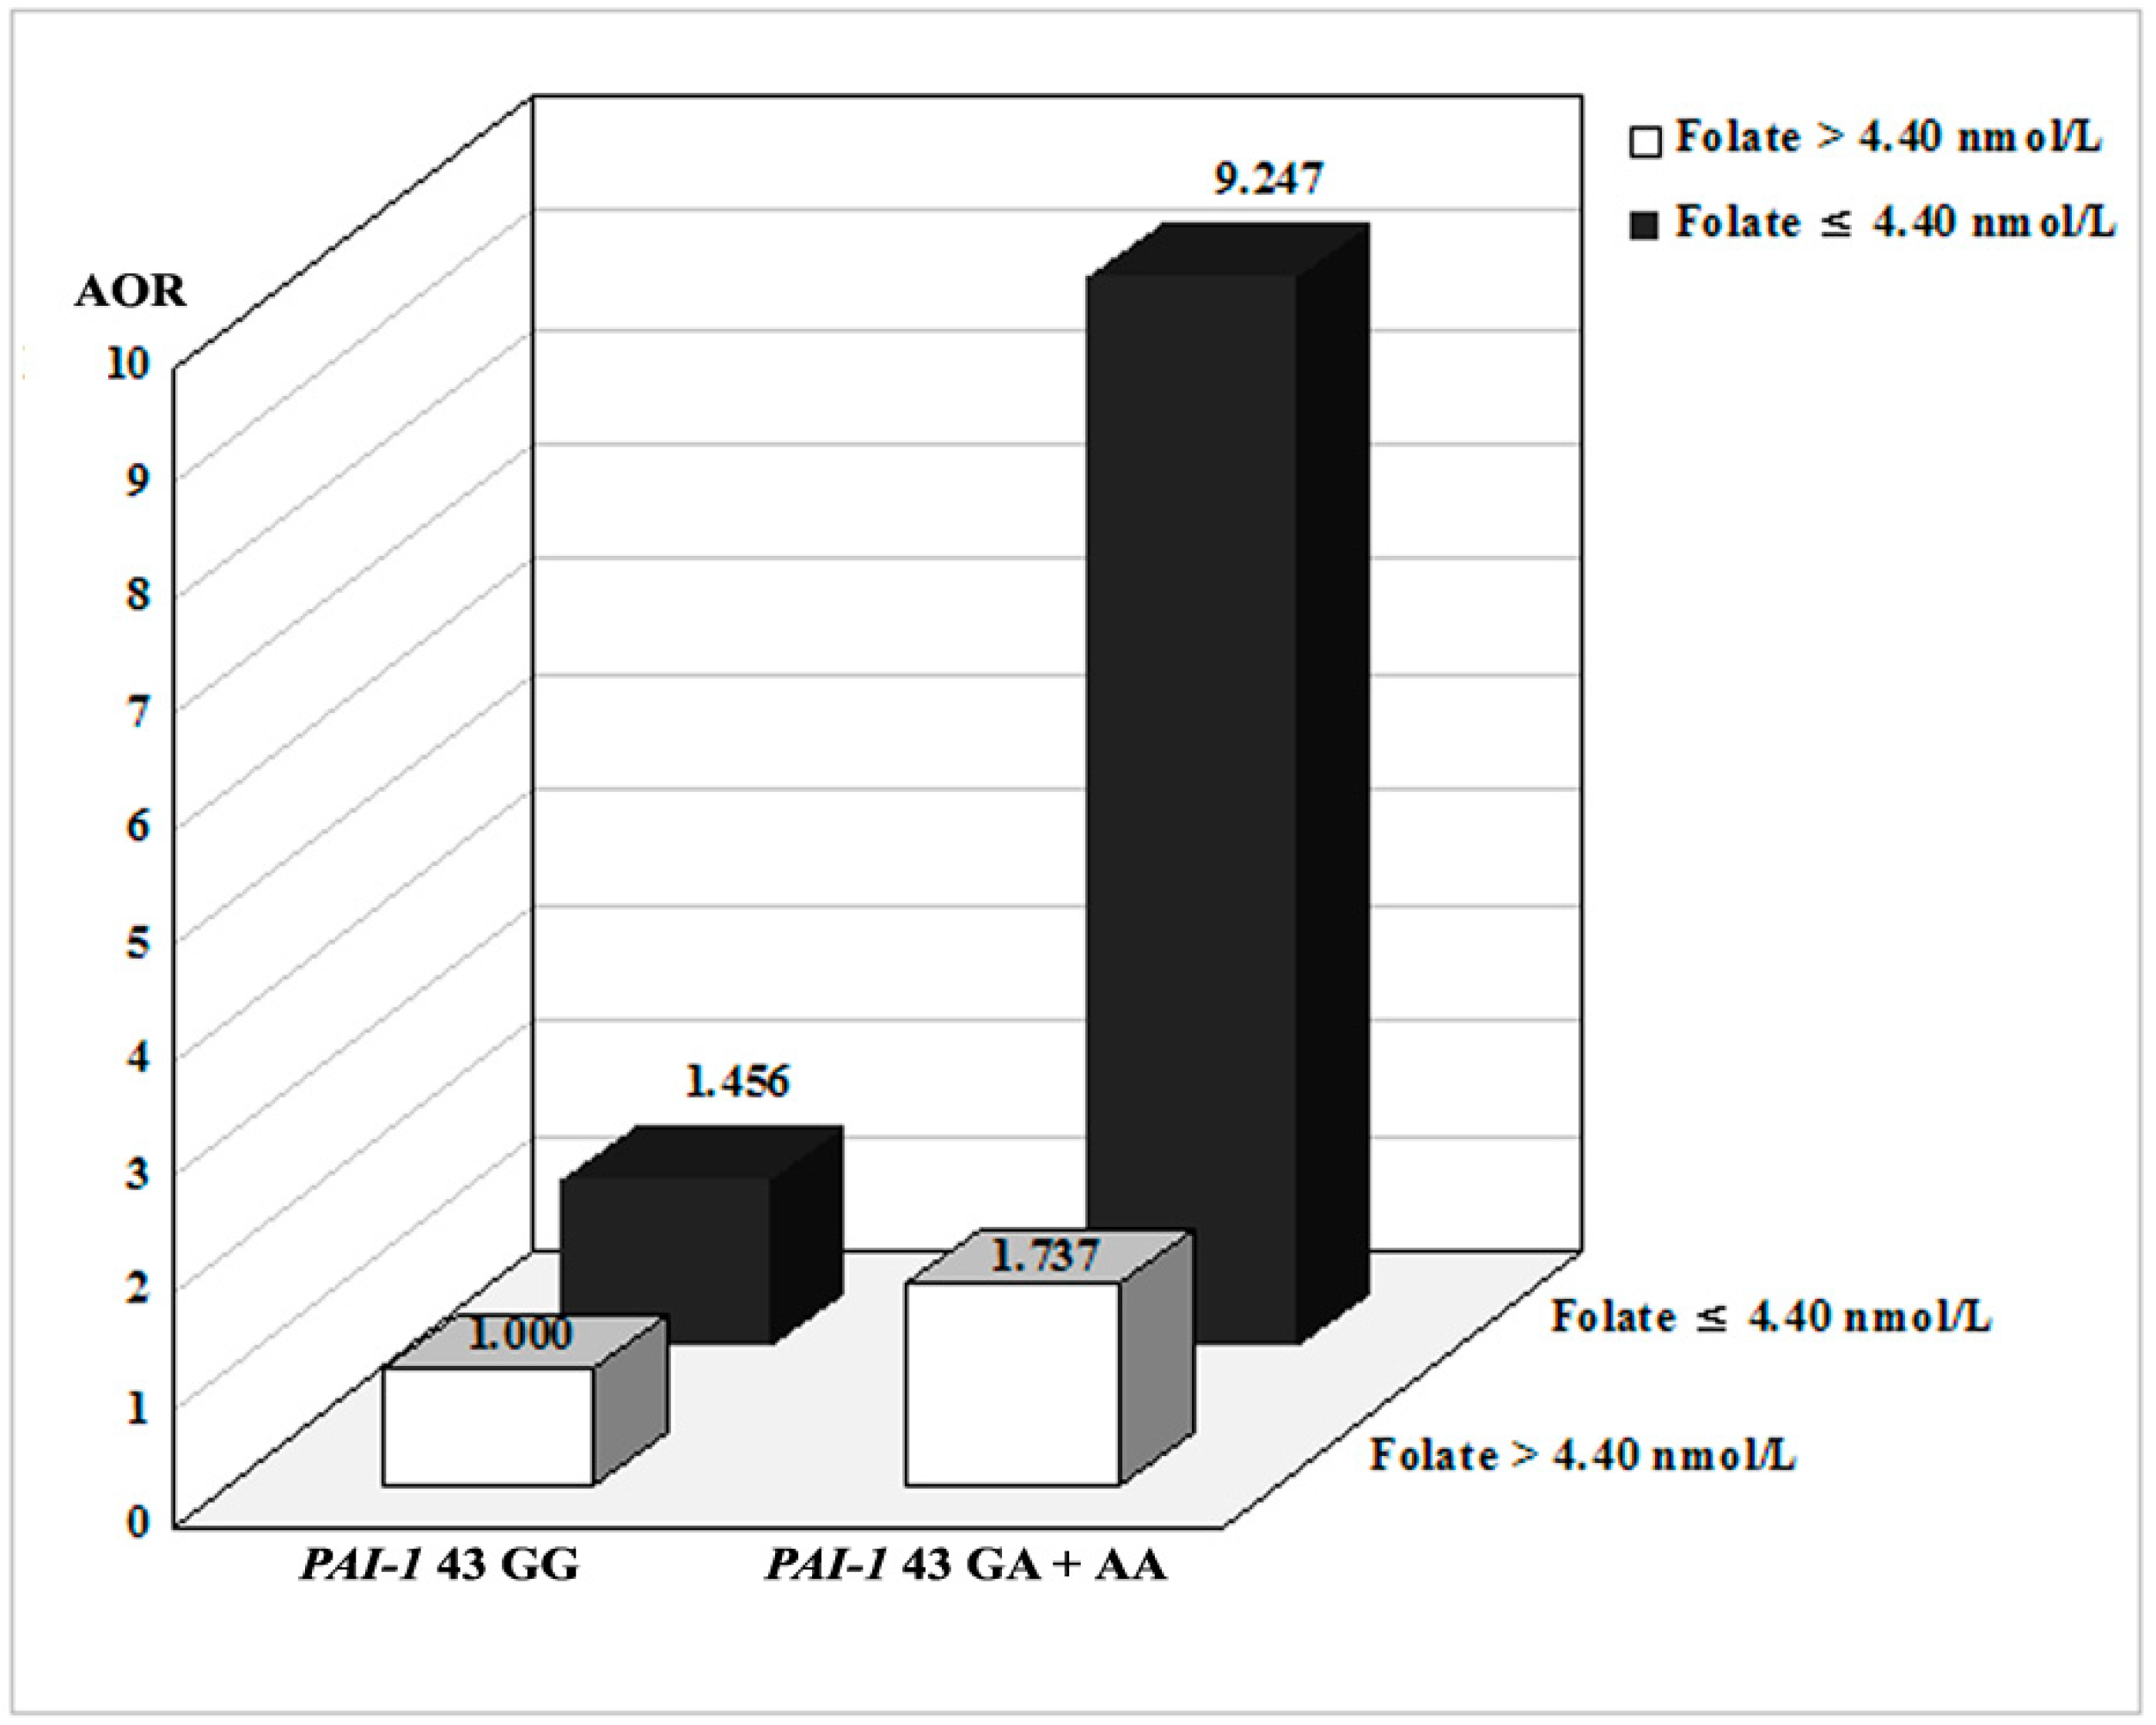
2.3. Combined Effects between PAI-1 Polymorphisms and Environmental Factors
3. Discussion
4. Materials and Methods
4.1. Study Population
4.2. Genotyping
4.3. Bone Measurements
4.4. Measurement of Vitamin B12, Plasma Total Homocysteine (tHcy), and Folate Levels
4.5. Statistical Analysis
5. Conclusions
Supplementary Materials
Acknowledgments
Author Contributions
Conflicts of Interest
References
- Center, J.R.; Nguyen, T.V.; Schneider, D.; Sambrook, P.N.; Eisman, J.A. Mortality after all major types of osteoporotic fracture in men and women: An observational study. Lancet 1999, 353, 878–882. [Google Scholar] [CrossRef]
- Anne, K.; Lucile, A.-C.; Tamsen, B.; Steven, N.B.; Scott, D.B.; Kay, D.; David, R.G.; Lou, G.; Steven, R.G.; Keith, H.; et al. Osteoporosis prevention, diagnosis, and therapy. JAMA 2001, 285, 785–795. [Google Scholar]
- Dawson-Hughes, B.; National Osteoporosis Foundation Guide Committee. A revised clinician’s guide to the prevention and treatment of osteoporosis. J. Clin. Endocrinol. Metab. 2008, 93, 2463–2465. [Google Scholar] [CrossRef] [PubMed]
- Costa, N.; Paramanathan, S.; Mac Donald, D.; Wierzbicki, A.S.; Hampson, G. Factors regulating circulating vascular endothelial growth factor (VEGF): Association with bone mineral density (BMD) in post-menopausal osteoporosis. Cytokine 2009, 46, 376–381. [Google Scholar] [CrossRef] [PubMed]
- Francesco, M.; Jean, Y.R.; Maria, L.B. Genetics of menopause-associated diseases. Maturitas 2001, 40, 103–116. [Google Scholar]
- Pouilles, J.M.; Tremollieres, F.; Bonneu, M.; Ribot, C. Influence of early age at menopause on vertebral bone mass. J. Bone Miner. Res. 1994, 9, 311–315. [Google Scholar] [CrossRef] [PubMed]
- Urano, T.; Inoue, S. Genetics of osteoporosis. Biochem. Biophys. Res. Commun. 2014, 452, 287–293. [Google Scholar] [CrossRef] [PubMed]
- Flicker, L.; Hopper, J.L.; Rodgers, L.; Kaymakci, B.; Green, R.M.; Wark, J.D. Bone density determinants in elderly women: A twin study. J. Bone Miner. Res. 1995, 10, 1607–1613. [Google Scholar] [CrossRef] [PubMed]
- Smith, D.M.; Nance, W.E.; Kang, K.W.; Christian, J.C.; Johnston, C.C., Jr. Genetic factors in determining bone mass. J. Clin. Investig. 1973, 52, 2800–2808. [Google Scholar] [CrossRef] [PubMed]
- Young, D.; Hopper, J.L.; Nowson, C.A.; Green, R.M.; Sherwin, A.J.; Kaymakci, B.; Smid, M.; Guest, C.S.; Larkins, R.G.; Wark, J.D. Determinants of bone mass in 10- to 26-year-old females: A twin study. J. Bone Miner. Res. 1995, 10, 558–567. [Google Scholar] [CrossRef] [PubMed]
- Nelson, D.A.; Kleerekoper, M. The search for the osteoporosis gene. J. Clin. Endocrinol. Metab. 1997, 82, 989–990. [Google Scholar] [CrossRef] [PubMed]
- Vidal, C.; Brincat, M.; Anastasi, A.X. TNFRSF11B gene variants and bone mineral density in postmenopausal women in Malta. Maturitas 2006, 53, 386–395. [Google Scholar] [CrossRef] [PubMed]
- Firat, S.C.; Cetin, Z.; Samanci, N.; Aydin, F.; Balci, N.; Gungor, F.; Firat, M.Z.; Luleci, G.; Karauzum, S.B. Evaluation of eNOS gene polymorphisms in relation to BMD in postmenopausal women. Maturitas 2009, 63, 352–356. [Google Scholar] [CrossRef] [PubMed]
- Singh, M.; Singh, P.; Singh, S.; Juneja, P.K.; Kaur, T. A susceptible haplotype within APOE gene influences BMD and intensifies the osteoporosis risk in postmenopausal women of Northwest India. Maturitas 2010, 67, 239–244. [Google Scholar] [CrossRef] [PubMed]
- Mencej-Bedrač, S.; Preželj, J.; Marc, J. TNFRSF11B gene polymorphisms 1181G > C and 245T > G as well as haplotype CT influence bone mineral density in postmenopausal women. Maturitas 2011, 69, 263–267. [Google Scholar] [CrossRef] [PubMed]
- Marshall, A.L.; Thomas, J.K.; Uri, S. Williams Hematology, 8th ed.; McGraw-Hill Education: Columbus, OH, USA, 2010; pp. 2742–2743. [Google Scholar]
- Dellas, C.; Loskutoff, D.J. Historical analysis of PAI-1 from its discovery to its potential role in cell motility and disease. Thromb. Haemost. 2005, 93, 631–640. [Google Scholar] [CrossRef] [PubMed]
- Lijnen, H.R. Pleiotropic functions of plasminogen activator inhibitor-1. J. Thromb. Haemost. 2005, 3, 35–45. [Google Scholar] [CrossRef] [PubMed]
- Daci, E.; Verstuyf, A.; Moermans, K.; Bouillon, R.; Carmeliet, G. Mice lacking the plasminogen activator inhibitor 1 are protected from trabecular bone loss induced by estrogen deficiency. J. Bone Miner. Res. 2000, 15, 1510–1516. [Google Scholar] [CrossRef] [PubMed]
- Tamura, Y.; Kawao, N.; Okada, K.; Yano, M.; Okumoto, K.; Matsuo, O.; Kaji, H. Plasminogen activator inhibitor-1 is involved in streptozotocin-induced bone loss in female mice. Diabetes 2013, 62, 3170–3179. [Google Scholar] [CrossRef] [PubMed]
- Mao, L.; Kawao, N.; Tamura, Y.; Okumoto, K.; Okada, K.; Yano, M.; Matsuo, O.; Kaji, H. Plasminogen activator inhibitor-1 is involved in impaired bone repair associated with diabetes in female mice. PLoS ONE 2014, 9, e92686. [Google Scholar] [CrossRef] [PubMed]
- Kawao, N.; Tamura, Y.; Okumoto, K.; Yano, M.; Okada, K.; Matsuo, O.; Kaji, H. Plasminogen plays a crucial role in bone repair. J. Bone Miner. Res. 2013, 28, 1561–1574. [Google Scholar] [CrossRef] [PubMed]
- Voormolen, M.H.; van Rooij, W.J.; van der Graaf, Y.; Lohle, P.N.; Lampmann, L.E.; Juttmann, J.R.; Sluzewski, M. Bone marrow edema in osteoporotic vertebral compression fractures after percutaneous vertebroplasty and relation with clinical outcome. AJNR Am. J. Neuroradiol. 2006, 27, 983–988. [Google Scholar] [PubMed]
- Zofkova, I. Role of genetics in prediction of osteoporosis risk. Vnitr. Lek. 2011, 57, 78–84. [Google Scholar] [PubMed]
- Mosaad, Y.M.; Hammad, E.M.; Fawzy, Z.; Abdal Aal, I.A.; Youssef, H.M.; ElSaid, T.O.; Monir, R.; El-Deek, B.S. Vitamin D receptor gene polymorphism as possible risk factor in rheumatoid arthritis and rheumatoid related osteoporosis. Hum. Immunol. 2014, 75, 452–461. [Google Scholar] [CrossRef] [PubMed]
- Chung, Y.S.; Jeon, Y.J.; Shin, D.E.; Min, K.T.; Shin, Y.S.; Won, K.S.; Koh, Y.C.; Hong, S.H.; Kim, N.K. Methylenetetrahydrofolate reductase (MTHFR) and thymidylate synthase (TS) polymorphisms with osteoporotic vertebral compression fracture (OVCF) in postmenopausal Korean women. Genes Genom. 2012, 34, 257–263. [Google Scholar] [CrossRef]
- Jin, H.S.; Kim, B.Y.; Kim, J.; Hong, K.W.; Jung, S.Y.; Lee, Y.S.; Huh, D.; Oh, B.; Chung, Y.S.; Jeong, S.Y. Association between the SPRY1 gene polymorphism and obesity-related traits and osteoporosis in Korean women. Mol. Genet. Metab. 2013, 108, 95–101. [Google Scholar] [CrossRef] [PubMed]
- Lei, S.F.; Papasian, C.J.; Deng, H.W. Polymorphisms in predicted miRNA binding sites and osteoporosis. J. Bone Miner. Res. 2011, 26, 72–78. [Google Scholar] [CrossRef] [PubMed]
- Romer, J.; Lund, L.R.; Eriksen, J.; Ralfkiaer, E.; Zeheb, R.; Gelehrter, T.D.; Danø, K.; Kristensen, P. Differential expression of urokinase-type plasminogen activator and its type-1 inhibitor during healing of mouse skin wounds. J. Investig. Dermatol. 1991, 97, 803–811. [Google Scholar] [CrossRef] [PubMed]
- Rundle, C.H.; Wang, X.; Wergedal, J.E.; Mohan, S.; Lau, K.H. Fracture healing in mice deficient in plasminogen activator inhibitor-1. Calcif. Tissue Int. 2008, 83, 276–284. [Google Scholar] [CrossRef] [PubMed]
- Daci, E.; Everts, V.; Torrekens, S.; van Herck, E.; Tigchelaar-Gutterr, W.; Bouillon, R.; Carmeliet, G. Increased bone formation in mice lacking plasminogen activators. J. Bone Miner. Res. 2003, 18, 1167–1176. [Google Scholar] [CrossRef] [PubMed]
- Morange, P.E.; Saut, N.; Alessi, M.C.; Yudkin, J.S.; Margaglione, M.; di Minno, G.; Hamsten, A.; Humphries, S.E.; Tregouet, D.A.; Juhan-Vague, I. Association of plasminogen activator inhibitor (PAI)-1 (SERPINE1) SNPs with myocardial infarction, plasma PAI-1, and metabolic parameters: The HIFMECH study. Arterioscler. Thromb. Vasc. Biol. 2007, 27, 2250–2257. [Google Scholar] [CrossRef] [PubMed]
- Ozgen, M.; Cosan, D.T.; Doganer, F.; Soyocak, A.; Armagan, O.; Gunes, H.V.; Degirmenci, I.; Ozkara, G.O.; Mutlu, F.S. Relationship between plasminogen activator inhibitor type-1 (PAI-1) gene polymorphisms and osteoporosis in Turkish women. Clinics 2012, 67, 1299–1302. [Google Scholar] [CrossRef]
- Muñoz-Valle, J.F.; Ruiz-Quezada, S.L.; Oregón-Romero, E.; Navarro-Hernández, R.E.; Castañeda-Saucedo, E.; De la Cruz-Mosso, U.; Illades-Aguiar, B.; Leyva-Vázquez, M.A.; Castro-Alarcón, N.; Parra-Rojas, I. PAI-1 mRNA expression and plasma level in rheumatoid arthritis: Relationship with 4G/5G PAI-1 polymorphism. Rheumatol. Int. 2012, 32, 3951–3956. [Google Scholar] [CrossRef] [PubMed]
- Lima, L.M.; Carvalho, M.D.; Fonseca Neto, C.P.; Garcia, J.C.; Sousa, M.O. PAI-1 4G/5G polymorphism and plasma levels association in patients with coronary artery disease. Arq. Bras. Cardiol. 2011, 97, 462. [Google Scholar] [CrossRef] [PubMed]
- Choi, J.W.; Lee, J.H.; Park, H.S.; Kim, Y.S. PAI-1 expression and its regulation by promoter 4G/5G polymorphism in clear cell renal cell carcinoma. J. Clin. Pathol. 2011, 64, 893–897. [Google Scholar] [CrossRef] [PubMed]
- Liguori, R.; Quaranta, S.; di Fiore, R.; Elce, A.; Castaldo, G.; Amato, F. A novel polymorphism in the PAI-1 gene promoter enhances gene expression. A novel pro-thrombotic risk factor? Thromb. Res. 2014, 134, 1229–1233. [Google Scholar] [CrossRef] [PubMed]
- Villadsen, M.M.; Bunger, M.H.; Carstens, M.; Stenkjaer, L.; Langdahl, B.L. Methylenetetrahydrofolate reductase (MTHFR) C677T polymorphism is associated with osteoporotic vertebral fractures, but is a weak predictor of BMD. Osteoporos. Int. 2005, 16, 411–416. [Google Scholar] [CrossRef] [PubMed]
- Gjesdal, C.G.; Vollset, S.E.; Ueland, P.M.; Refsum, H.; Drevon, C.A.; Gjessing, H.K.; Tell, G.S. Plasma total homocysteine level and bone mineral density: The Hordaland Homocysteine Study. Arch. Intern. Med. 2006, 166, 88–94. [Google Scholar] [CrossRef] [PubMed]
- WHO Europe: A declaration on the promotion of patients’ rights in Europe. Eur. J. Health Law 1994, 1, 279–291.
- Jeon, Y.J.; Kim, Y.R.; Lee, B.E.; Choi, Y.S.; Kim, J.H.; Shin, J.E.; Rah, H.; Cha, S.H.; Lee, W.S.; Kim, N.K. Genetic association of five plasminogen activator inhibitor-1 (PAI-1) polymorphisms and idiopathic recurrent pregnancy loss in Korean women. Thromb. Haemost. 2013, 110, 742–750. [Google Scholar] [CrossRef] [PubMed]


| Characteristic | Controls (n = 197) | Osteoporosis (n = 158) | p | OVCF (n = 87) | p | Non-OVCF (n = 71) | p |
|---|---|---|---|---|---|---|---|
| Age (years, mean ± SD) | 66.11 ± 8.93 | 70.50 ± 8.24 | <0.0001 | 70.23 ± 9.44 | 0.001 | 70.83 ± 6.53 | <0.0001 |
| Hypertension (%) | 92 (46.7) | 57 (36.1) | 0.196 | 37 (42.5) | 0.760 | 20 (28.2) | 0.087 |
| SBP (mmHg, mean ± SD) | 134.98 ± 18.13 | 128.42 ± 15.27 | 0.0005 | 129.99 ± 16.51 | 0.041 | 126.66 ± 13.65 | 0.001 |
| DBP (mmHg, mean ± SD) | 80.69 ± 12.22 | 76.13 ± 10.44 | 0.0003 | 77.63 ± 10.57 | 0.049 | 74.45 ± 10.10 | 0.0001 |
| Diabetes mellitus (%) | 25 (12.7) | 28 (17.7) | 0.324 | 11 (12.6) | 0.992 | 17 (23.9) | 0.062 |
| FBS (mg/dL, mean ± SD) | 110.46 ± 33.98 | 125.80 ± 44.48 | <0.0001 | 135.89 ± 53.96 | <0.0001 | 114.30 ± 26.15 | 0.025 |
| Hcy (μmol/L, mean ± SD) | 9.38 ± 2.89 | 9.81 ± 4.06 | 0.056 | 10.01 ± 3.85 | 0.022 | 9.57 ± 4.31 | 0.316 |
| Folate (ng/mL, mean ± SD) | 9.67 ± 9.25 | 8.12 ± 4.78 | 0.054 | 6.54 ± 4.03 | 0.003 | 10.19 ± 4.91 | 0.027 |
| BMI (kg/m2, mean ± SD) | 24.51 ± 3.30 | 23.88 ± 4.04 | 0.169 | 23.87 ± 5.02 | 0.286 | 23.89 ± 2.75 | 0.180 |
| HDL-cholesterol (mg/dL, mean ± SD) | 47.83 ± 12.05 | 44.60 ± 14.24 | 0.201 | 44.39 ± 15.95 | 0.249 | 44.83 ± 12.24 | 0.250 |
| LDL-cholesterol (mg/dL, mean ± SD) | 131.09 ± 44.47 | 106.74 ± 39.49 | 0.001 | 117.87 ± 42.82 | 0.161 | 95.02 ± 32.02 | <0.0001 |
| TG (mg/dL, mean ± SD) | 150.29 ± 88.98 | 140.66 ± 80.11 | 0.324 | 147.62 ± 74.17 | 0.824 | 132.23 ± 86.68 | 0.176 |
| Vitamin B12 (pg/mL, mean ± SD) | 788.25 ± 821.74 | 710.69 ± 591.37 | 0.015 | 973.11 ± 1024.37 | 0.361 | 639.46 ± 384.93 | 0.006 |
| 25-(OH) Vitamin D (ng/mL, mean ± SD) | - | 24.02 ± 21.50 | - | 41.97 ± 34.20 | - | 18.57 ± 11.62 | - |
| Osteocalcin (ng/mL, mean ± SD) | - | 7.83 ± 6.39 | - | 7.83 ± 6.39 | - | - | - |
| DPD (nMDP/mMcre, mean ± SD) | - | 8.41 ± 5.55 | - | 8.41 ± 5.55 | - | - | - |
| BMD (g/cm2, mean ± SD) | - | −3.06 ± 0.97 | - | −2.98 ± 1.26 | - | −3.06 ± 0.97 | - |
| Genotypes | Controls (n = 197) | Osteoporosis (n = 158) | AOR (95% CI) * | p | Non-OVCF (n = 71) | AOR (95% CI) * | p | OVCF (n = 87) | AOR (95% CI) * | p |
|---|---|---|---|---|---|---|---|---|---|---|
| PAI-1 −844 | - | - | - | - | - | - | - | - | - | - |
| GG | 70 (35.5) | 40 (25.3) | 1.000 (reference) | - | 22 (31.0) | 1.000 (reference) | - | 18 (20.7) | 1.000 (reference) | - |
| GA | 91 (46.2) | 89 (56.3) | 1.584 (0.951–2.640) | 0.077 | 33 (46.5) | 1.168 (0.604–2.256) | 0.645 | 56 (64.4) | 2.244 (1.164–4.326) | 0.016 |
| AA | 36 (18.3) | 29 (18.4) | 1.263 (0.647–2.467) | 0.494 | 16 (22.5) | 1.460 (0.641–3.327) | 0.368 | 13 (14.9) | 1.052 (0.415–2.664) | 0.915 |
| Dominant (GG vs. GA + AA) | - | - | 1.496 (0.919–2.435) | 0.105 | - | 1.252 (0.677–2.318) | 0.474 | - | 1.918 (1.016–3.621) | 0.044 |
| Recessive (GG + GA vs. AA) | - | - | 0.949 (0.528–1.705) | 0.860 | - | 1.342 (0.657–2.740) | 0.420 | - | 0.620 (0.278–1.385) | 0.244 |
| HWE-P | 0.502 | 0.097 | - | - | - | - | - | - | - | - |
| PAI-1 −675 4G5G | - | - | - | - | - | - | - | - | - | - |
| 4G4G | 113 (57.4) | 69 (43.7) | 1.000 (reference) | 33 (46.5) | 1.000 (reference) | - | 36 (41.4) | 1.000 (reference) | - | |
| 4G5G | 75 (38.1) | 70 (44.3) | 1.550 (0.967–2.485) | 0.069 | 32 (45.1) | 1.316 (0.716–2.419) | 0.376 | 38 (43.7) | 1.653 (0.921–2.968) | 0.092 |
| 5G5G | 9 (4.6) | 19 (12.0) | 3.032 (1.224–7.512) | 0.017 | 6 (8.5) | 1.769 (0.552–5.665) | 0.337 | 13 (14.9) | 4.646 (1.625–13.29) | 0.004 |
| Dominant (4G4G vs. 4G5G + 5G5G) | - | - | 1.727 (1.102–2.706) | 0.017 | - | 1.366 (0.764–2.441) | 0.293 | - | 1.969 (1.130–3.430) | 0.017 |
| Recessive (4G4G + 4G5G vs. 5G5G) | - | - | 2.510 (1.056–5.968) | 0.037 | - | 1.584 (0.516–4.864) | 0.422 | - | 3.378 (1.301–8.769) | 0.012 |
| HWE-P | 0.435 | 0.847 | - | - | - | - | - | - | - | - |
| PAI-1 +43 | - | - | - | - | - | - | - | - | - | - |
| GG | 180 (91.4) | 132 (83.5) | 1.000 (reference) | - | 61 (85.9) | 1.000 (reference) | - | 71 (81.6) | 1.000 (reference) | - |
| GA | 16 (8.1) | 24 (15.2) | 2.006 (0.963–4.175) | 0.063 | 8 (11.3) | 1.598 (0.596–4.284) | 0.352 | 16 (18.4) | 2.421 (1.057–5.546) | 0.037 |
| AA | 1 (0.5) | 2 (1.3) | 3.188 (0.270–37.664) | 0.358 | 2 (2.8) | 7.504 (0.561–100.480) | 0.128 | 0 (0.0) | N/A | 0.998 |
| Dominant (GG vs. GA + AA) | - | - | 2.087 (1.027–4.241) | 0.042 | - | 1.941 (0.775–4.860) | 0.157 | - | 2.292 (1.009–5.206) | 0.048 |
| Recessive (GG + GA vs. AA) | - | - | 2.972 (0.251–35.212) | 0.388 | - | 7.202 (0.531–97.693) | 0.138 | - | N/A | 0.998 |
| HWE-P | 0.336 | 0.454 | - | - | - | - | - | - | - | - |
| PAI-1 +9785 | - | - | - | - | - | - | - | - | - | - |
| GG | 182 (92.4) | 148 (93.7) | 1.000 (reference) | - | 68 (95.8) | 1.000 (reference) | - | 80 (92.0) | 1.000 (reference) | - |
| GA | 14 (7.1) | 10 (6.3) | 1.072 (0.437–2.633) | 0.879 | 3 (4.2) | 0.946 (0.252–3.549) | 0.934 | 7 (8.0) | 1.324 (0.477–3.669) | 0.590 |
| AA | 1 (0.5) | 0 (0.0) | N/A | 0.995 | 0 (0.0) | N/A | 0.998 | 0 (0.0) | N/A | 0.998 |
| Dominant (GG vs. GA + AA) | - | - | 1.005 (0.414–2.440) | 0.991 | - | 0.898 (0.241–3.344) | 0.872 | - | 1.227 (0.447–3.365) | 0.691 |
| Recessive (GG + GA vs. AA) | - | - | N/A | 0.995 | - | N/A | 0.998 | - | N/A | 0.998 |
| HWE-P | 0.217 | 0.681 | - | - | - | - | - | - | - | - |
| PAI-1 +11053 | - | - | - | - | - | - | - | - | - | - |
| TT | 54 (27.4) | 33 (20.9) | 1.000 (reference) | 15 (21.1) | 1.000 (reference) | - | 18 (20.7) | 1.000 (reference) | - | |
| TG | 101 (51.3) | 85 (53.8) | 1.347 (0.768–2.362) | 0.298 | 36 (50.7) | 1.036 (0.493–2.176) | 0.926 | 49 (56.3) | 1.647 (0.814–3.334) | 0.166 |
| GG | 42 (21.3) | 40 (25.3) | 1.655 (0.858–3.190) | 0.133 | 20 (28.2) | 1.920 (0.825–4.470) | 0.130 | 20 (23.0) | 1.521 (0.664–3.483) | 0.322 |
| Dominant (TT vs. TG + GG) | - | - | 1.429 (0.842–2.428) | 0.186 | - | 1.253 (0.632–2.483) | 0.518 | - | 1.593 (0.814–3.116) | 0.174 |
| Recessive (TT + TG vs. GG) | - | - | 1.285 (0.762–2.165) | 0.347 | - | 1.499 (0.773–2.907) | 0.231 | - | 1.108 (0.581–2.114) | 0.755 |
| HWE-P | 0.682 | 0.326 | - | - | - | - | - | - | - | - |
| Haplotype | Overall (n = 355) | Control (n = 197) | Case (n = 158) | OR (95% CI) | p a | Non-OVCF (n = 71) | OR (95% CI) | p a | OVCF (n = 87) | OR (95% CI) | p a |
|---|---|---|---|---|---|---|---|---|---|---|---|
| PAI-1 −844/−675/+43/+9785/+11053 | - | - | - | - | - | - | - | - | - | ||
| G-4G-G-G-T | 0.179 | 0.237 | 0.098 | 1.000 (reference) | - | 0.107 | 1.000 (reference) | - | 0.133 | 1.000 (reference) | - |
| G-4G-G-G-G | 0.092 | 0.099 | 0.092 | 2.231 (1.189–4.187) | 0.015 | 0.127 | 2.862 (1.311–6.247) | 0.013 | 0.099 | 1.763 (0.849–3.658) | 0.177 |
| G-4G-G-A-T | 0.008 | 0.019 | 0.000 | 0.198 (0.011–3.567) | 0.197 | 0.000 | 0.402 (0.022–7.408) | 0.592 | 0.002 | 0.265 (0.015–4.816) | 0.346 |
| G-4G-G-A-G | 0.006 | 0.007 | 0.000 | 0.424 (0.023–8.443) | 1.000 | 0.000 | 0.862 (0.042–17.52) | 1.000 | 0.015 | 4.043 (0.765–21.36) | 0.110 |
| G-4G-A-G-T | 0.007 | 0.000 | 0.032 | 62.33 (3.547–109.5) | <0.0001 | 0.008 | 18.10 (0.704–465.0) | 0.147 | 0.012 | 19.89 (0.923–428.8) | 0.044 |
| G-4G-A-G-G | 0.021 | 0.007 | 0.025 | 8.000 (1.996–32.06) | 0.002 | 0.000 | 0.862 (0.042–17.52) | 1.000 | 0.000 | 0.568 (0.028–11.40) | 1.000 |
| G-4G-A-A-T | 0.004 | 0.000 | 0.004 | 8.905 (0.353–224.4) | 0.256 | 0.000 | N/A | - | 0.006 | 11.94 (0.471–302.7) | 0.205 |
| G-5G-G-G-T | 0.157 | 0.158 | 0.168 | 2.565 (1.483–4.434) | 0.001 | 0.173 | 2.500 (1.221–5.118) | 0.013 | 0.140 | 1.565 (0.812–3.017) | 0.184 |
| G-5G-G-G-G | 0.029 | 0.018 | 0.043 | 5.571 (2.039–15.22) | 0.001 | 0.047 | 6.200 (1.903–20.20) | 0.004 | 0.058 | 5.776 (1.984–16.82) | 0.001 |
| G-5G-G-A-T | 0.009 | 0.006 | 0.000 | 0.594 (0.028–12.71) | 1.000 | 0.013 | 6.200 (0.810–47.44) | 0.109 | 0.004 | 2.022 (0.176–23.29) | 0.495 |
| G-5G-G-A-G | 0.002 | 0.003 | 0.000 | 0.989 (0.039–24.93) | 1.000 | 0.001 | 2.011 (0.078–51.66) | 1.000 | 0.001 | 1.326 (0.052–33.63) | 1.000 |
| G-5G-A-G-T | 0.042 | 0.027 | 0.062 | 5.455 (2.353–12.64) | <0.0001 | 0.067 | 5.636 (2.042–15.56) | 0.001 | 0.061 | 4.043 (1.560–10.48) | 0.006 |
| G-5G-A-G-G | 0.007 | 0.003 | 0.007 | 6.000 (0.526–68.51) | 0.165 | 0.001 | 2.011 (0.078–51.66) | 1.000 | 0.001 | 1.326 (0.052–33.63) | 1.000 |
| G-5G-A-A-T | 0.000 | 0.003 | 0.000 | 0.989 (0.039–24.93) | 1.000 | 0.001 | 2.011 (0.078–51.66) | 1.000 | 0.001 | 1.326 (0.052–33.63) | 1.000 |
| A-4G-G-G-T | 0.062 | 0.076 | 0.056 | 1.800 (0.883–3.668) | 0.132 | 0.079 | 2.273 (0.943–5.483) | 0.089 | 0.028 | 0.674 (0.236–1.928) | 0.621 |
| A-4G-G-G-G | 0.310 | 0.311 | 0.283 | 2.195 (1.346–3.580) | 0.002 | 0.361 | 2.571 (1.361–4.855) | 0.004 | 0.329 | 1.874 (1.077–3.261) | 0.032 |
| A-4G-G-A-T | 0.006 | 0.003 | 0.005 | 6.000 (0.526–68.51) | 0.165 | 0.008 | 6.200 (0.368–104.6) | 0.271 | 0.010 | 8.087 (0.702–93.16) | 0.111 |
| A-4G-A-G-T | 0.009 | 0.003 | 0.000 | 0.989 (0.039–24.93) | 1.000 | 0.001 | 2.011 (0.078–51.66) | 1.000 | 0.001 | 1.326 (0.052–33.63) | 1.000 |
| A-4G-A-G-G | 0.014 | 0.003 | 0.046 | 45.00 (5.706–354.9) | <0.0001 | 0.001 | 2.011 (0.078–51.66) | 1.000 | 0.001 | 1.326 (0.052–33.63) | 1.000 |
| A-5G-G-G-T | 0.011 | 0.000 | 0.020 | 38.59 (2.112–705.1) | 0.0004 | 0.000 | N/A | - | 0.076 | 107.4 (6.156–1875) | <0.0001 |
| A-5G-G-G-G | 0.011 | 0.018 | 0.006 | 0.857 (0.169–4.347) | 1.000 | 0.000 | 0.402 (0.022–7.408) | 0.592 | 0.011 | 1.155 (0.225–5.937) | 1.000 |
| A-5G-A-G-T | 0.013 | 0.000 | 0.029 | 56.40 (3.188–997.7) | <0.0001 | 0.010 | 18.100 (0.704–465.0) | 0.147 | 0.013 | 19.89 (0.923–428.8) | 0.044 |
© 2016 by the authors; licensee MDPI, Basel, Switzerland. This article is an open access article distributed under the terms and conditions of the Creative Commons Attribution (CC-BY) license (http://creativecommons.org/licenses/by/4.0/).
Share and Cite
Kim, J.O.; Han, S.H.; Lee, Y.H.; Ahn, T.K.; Lim, J.J.; Chung, Y.S.; Shin, D.E.; Lee, W.S.; Han, I.B.; Kim, N.K. Association of Plasminogen Activator Inhibitor-1 (PAI-1) Gene Polymorphisms with Osteoporotic Vertebral Compression Fractures (OVCFs) in Postmenopausal Women. Int. J. Mol. Sci. 2016, 17, 2062. https://doi.org/10.3390/ijms17122062
Kim JO, Han SH, Lee YH, Ahn TK, Lim JJ, Chung YS, Shin DE, Lee WS, Han IB, Kim NK. Association of Plasminogen Activator Inhibitor-1 (PAI-1) Gene Polymorphisms with Osteoporotic Vertebral Compression Fractures (OVCFs) in Postmenopausal Women. International Journal of Molecular Sciences. 2016; 17(12):2062. https://doi.org/10.3390/ijms17122062
Chicago/Turabian StyleKim, Jung Oh, Soo Hong Han, Yeon Ho Lee, Tae Keun Ahn, Jae Joon Lim, Young Sun Chung, Dong Eun Shin, Woo Sik Lee, In Bo Han, and Nam Keun Kim. 2016. "Association of Plasminogen Activator Inhibitor-1 (PAI-1) Gene Polymorphisms with Osteoporotic Vertebral Compression Fractures (OVCFs) in Postmenopausal Women" International Journal of Molecular Sciences 17, no. 12: 2062. https://doi.org/10.3390/ijms17122062