Article

Rapid Population Growth throughout Asia’s Earthquake-Prone Areas: A Multiscale Analysis

1
Center for Human-Environment System Sustainability (CHESS), State Key Laboratory of Earth Surface Processes and Resource Ecology (ESPRE), Beijing Normal University, Beijing 100875, China
2
Academy of Disaster Reduction and Emergency Management, Faculty of Geographical Science, Beijing Normal University, Beijing 100875, China
3
School of Natural Resources, Faculty of Geographical Science, Beijing Normal University, Beijing 100875, China
4
Key Laboratory of Environmental Changes and Natural Disaster, Ministry of Education, Beijing Normal University, Beijing 100875, China
5
State Key Laboratory of Earth Surface Processes and Resource Ecology (ESPRE), Beijing Normal University, Beijing 100875, China
*
Author to whom correspondence should be addressed.
Int. J. Environ. Res. Public Health 2018, 15(9), 1893; https://doi.org/10.3390/ijerph15091893
Submission received: 30 July 2018 / Revised: 24 August 2018 / Accepted: 27 August 2018 / Published: 31 August 2018

Abstract

:
Assessing the changes of the population living throughout the most seismically hazardous area (MSHA) constitutes an important foundation for seismic risk assessment. However, the changes of the population living in the MSHA of Asia, which exhibits the highest number of earthquake related fatalities, were poorly understood. Therefore, this study analyzed the changes of the population in the MSHA between 2000 and 2015 at the continental, subcontinental, and national scales. We found that the population, especially the vulnerable population (i.e., children under or equal to the age of 14 and elderly people over or equal to the age of 65), in Asia’s MSHA increased rapidly between 2000 and 2015. The population in the MSHA increased by 185.88 million with a growth rate of 20.93%, which was 3.38% greater than that in the non-MSHA region. Meanwhile, the vulnerable population in the MSHA increased by 63.65 million with a growth rate of 19.73%. The increase of the vulnerable population in the MSHA was 19.93% greater than that in the non-MSHA region. We also found that urban population growth was a major factor impacting the increase in both the population and the vulnerable population throughout Asia’s MSHA. Therefore, attention should be paid to the changes of the population in Asia’s MSHA, whilst it is imperative to execute strict building codes and select the development location more carefully in the MSHA.

1. Introduction

The most seismically hazardous area (MSHA) represents a region where earthquakes that could cause casualties and property damage may occur [1,2,3]. The MSHA is a region where earthquake destruction and related losses concentrate [2,4]. It constitutes the main region of seismic risk concern [3,5,6,7]. The population living in the MSHA is a vital component of earthquake exposure, and changes of it can lead to the changes in seismic risk [1,2,3,8,9]. Among the people living in the MSHA, children and elderly people are more susceptible than others to an earthquake disaster and require extra earthquake disaster risk management measures to have the same level of risk as others [10]. Therefore, the children and the elderly people in the MSHA can be defined as vulnerable people as they are less physically capable to avoid earthquake disasters and/or recover from earthquake disasters [11,12].
Asia is the most populous continent in the world. In 2015, the total population of Asia accounted for nearly 60% of the global population [13]. Meanwhile, Asia is also the continent with the highest earthquake related fatalities [14,15]. Between 1970 and 2008, 84% of global earthquake related fatalities were reported in Asia [14]. Recently, Asia has been undergoing rapid urbanization. The percentage of the population living in urban areas increased at an annual average rate of 0.71% from 2000 to 2015, which was the highest in the world [13]. The amount, demographic structure, and spatial distribution of the population living in Asia’s MSHA have altered substantially in the context of urbanization [16]. A previous study found that the population of Asia living in areas with an earthquake intensity of greater than or equal to VII (under the Modified Mercali Intensity of VII to X, the shaking intensity varies from very strong to extreme and the damage to built structures ranges from considerable to completely destroyed [17]) increased by 44.09% from 1990 to 2015 [18]. Therefore, a timely and accurate assessment of the changes of the population throughout Asia’s MSHA has become a critical scientific issue for seismic risk prevention.
Several researchers have estimated the status and changes of the population within Asia’s MSHA at multiple scales. In terms of the population distribution, Nojima et al. [19] found that 80% of the county-level population in Japan was living in areas characterized by high seismic hazards in 2005. In terms of population changes, He et al. [20] found that the population in China’s MSHA increased by 33.63% from 1990 to 2010, which was twice the average growth rate of the population of China. Freire et al. [16] found that there was an increasing population trend in seismically hazardous areas across 11 megacities in Asia from 1950 to 2010.
However, the changes in the population, particularly with regard to the vulnerable people living in Asia’s MSHA, remained poorly understood. The research gap is primarily due to the incomparability of the population data among different countries and the lack of age structure information in those population data [21,22,23,24]. Thus, it was impossible to analyze the changes of the vulnerable population living in Asia’s MSHA. The recently published WorldPop datasets have provided an important data source for studying the changes of the population in Asia’s MSHA [25]. Covering the entire continent of Asia, the WorldPop version 2 dataset published in 2017 provides estimates of the population from 2000 to 2020 with a spatial resolution of 1 km [26]. The accuracies of the spatial population distributions in the WorldPop version 2 dataset were significantly improved since the version 1 dataset was produced in 2011 using the downscaling method, which aggregates each element in the population data within a 100-m spatial resolution [27]. Moreover, compared with other freely available population data, the WorldPop datasets include, not only total population data, but also demographic data for different ages, including elderly people, adults, and children [26]. The new dataset has been successfully applied to relevant research at the continental and national scales during recent years [26,28,29].
The objective of this study was to analyze the changes of the population living in Asia’s MSHA from 2000 to 2015. To achieve this goal, we first analyzed the changes in the total population from 2000 to 2015 living in the MSHA at continental, subcontinental, and national scales. Then, we analyzed the changes in the vulnerable population during the same period living in the MSHA at the abovementioned three scales. Finally, we discussed the reliability, causes, consequences, and implications of the results. Such an investigation plays an essential role in understanding the population changes in Asia’s MSHA and evaluating earthquake disaster losses.

2. Materials and Methods
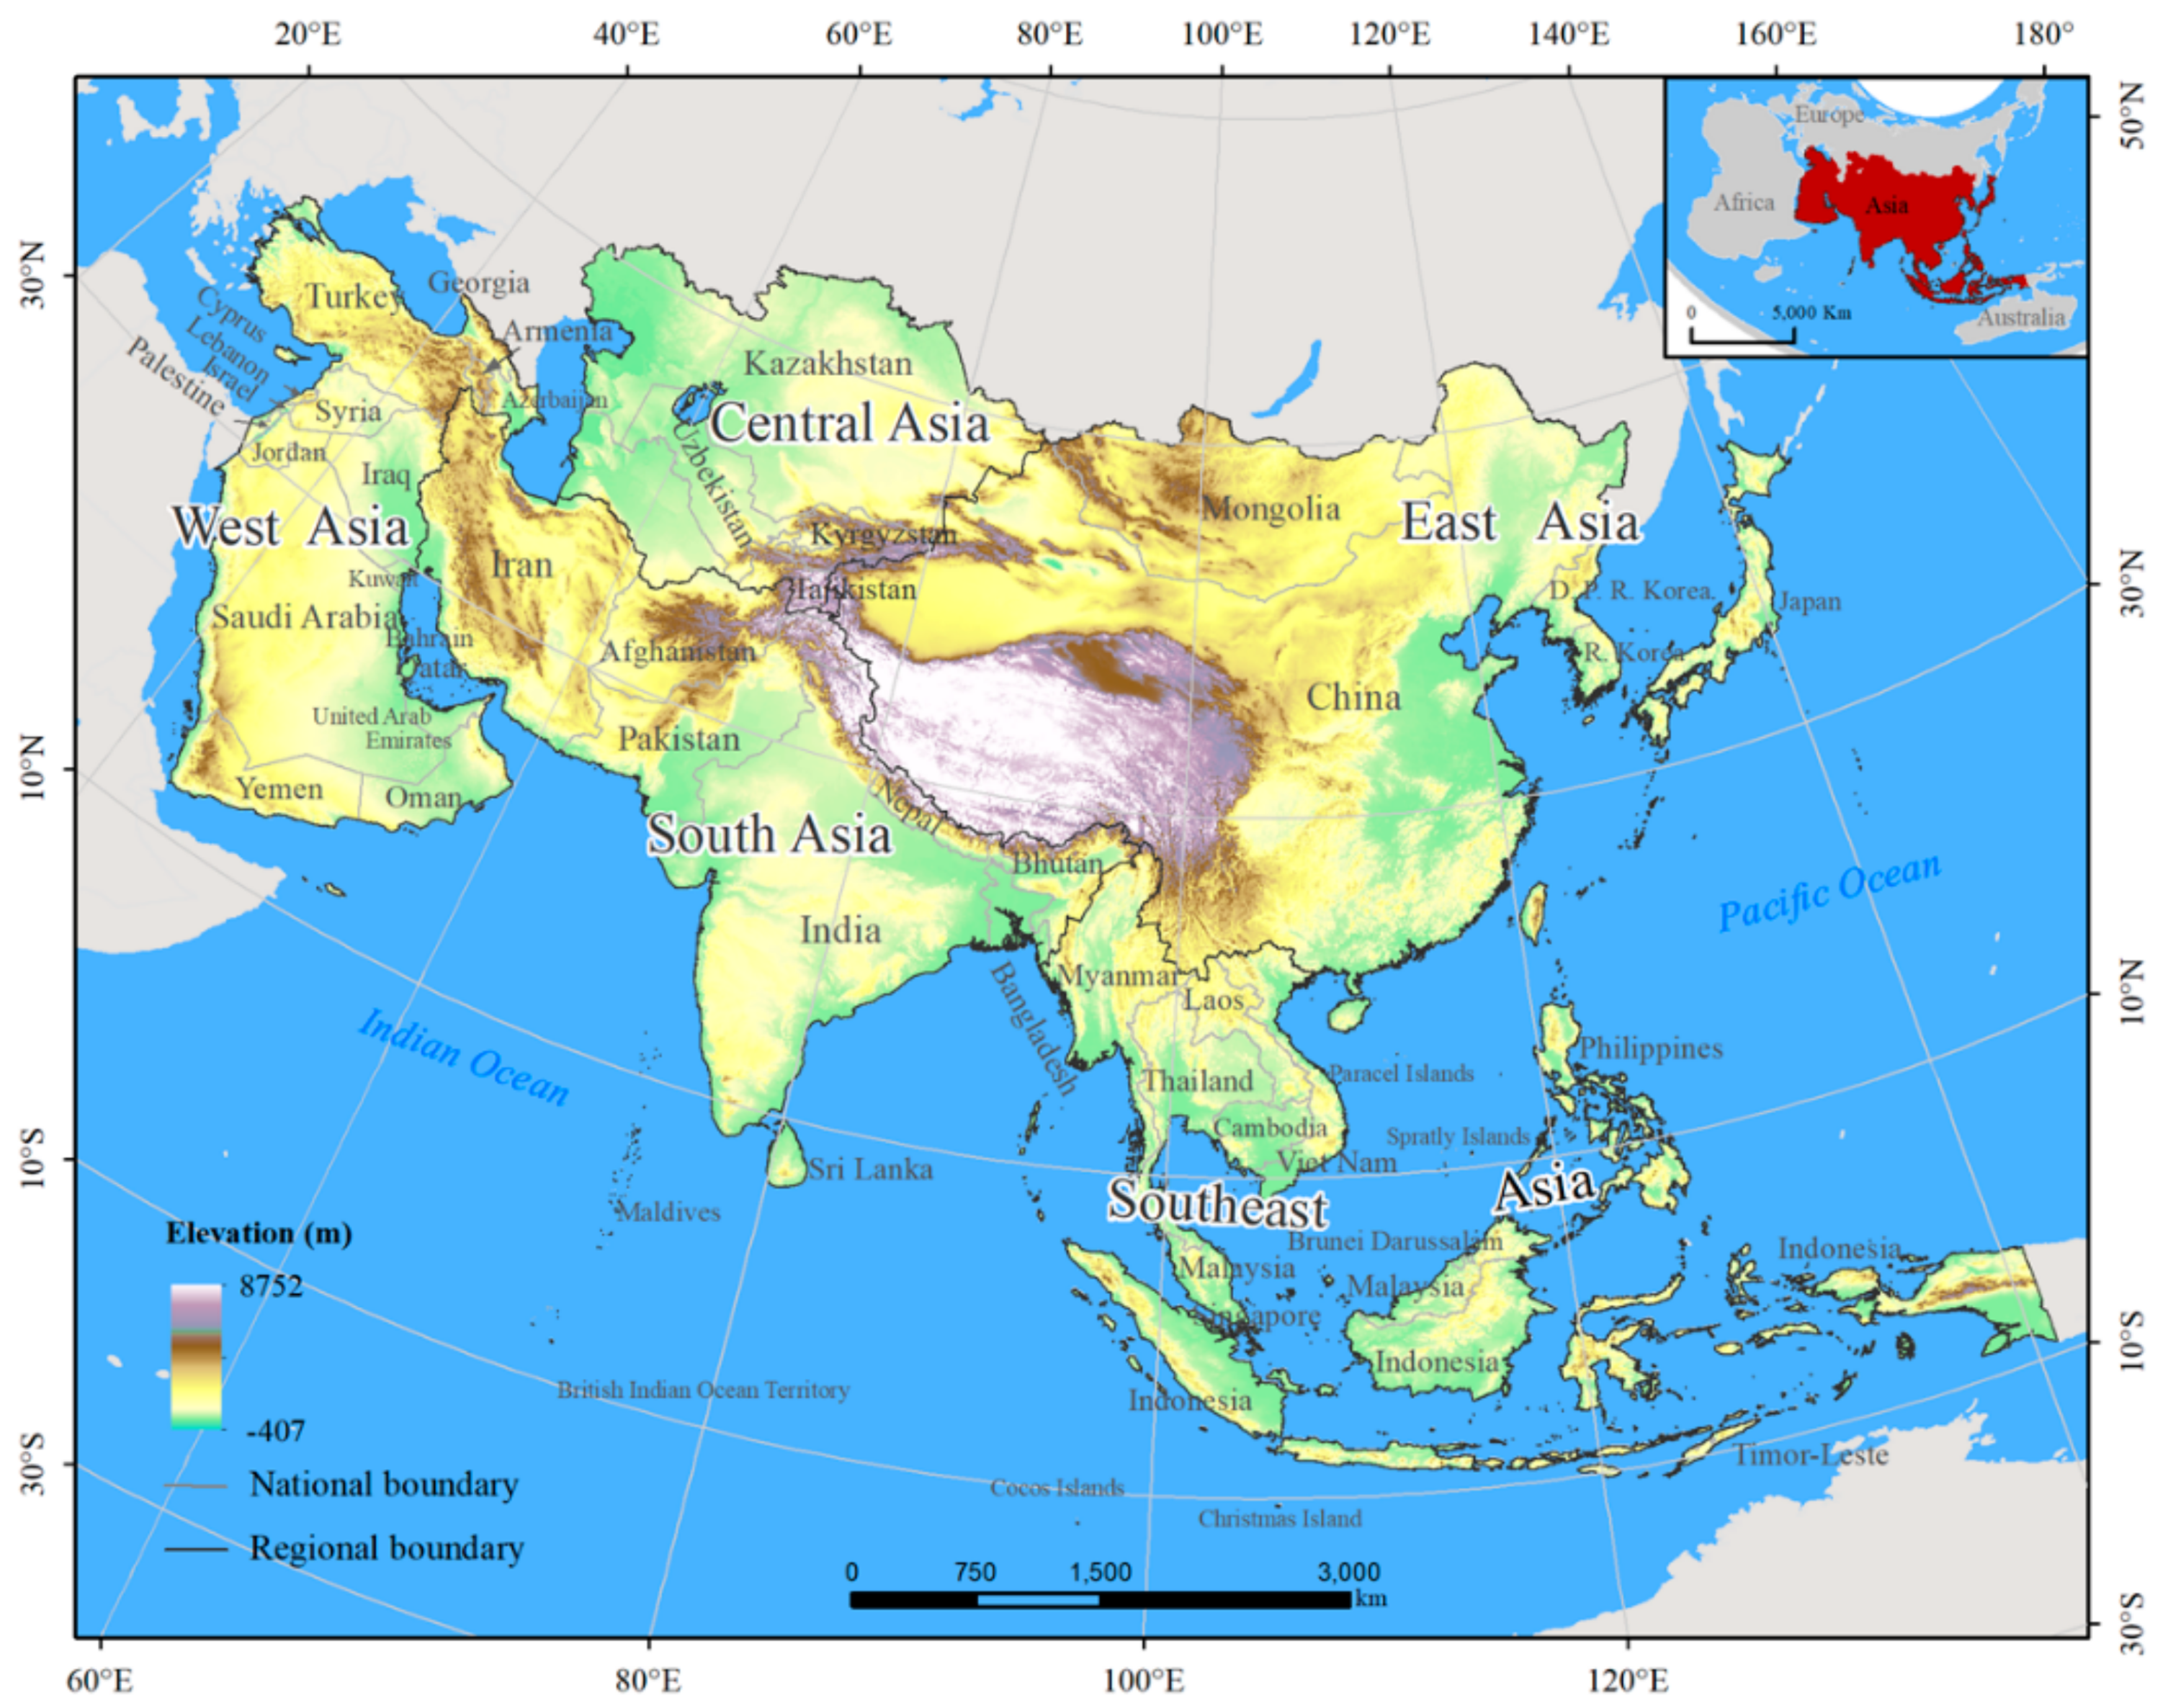
2.1. Study Area

The study area, which extends from 145°48′ W to 25°41′ E and from 55°27′ N to 11°7′ S, is composed of the continent of Asia and consists of East Asia, Central Asia, South Asia, West Asia, and Southeast Asia (Figure 1). The subcontinental and national boundaries are from the Data Center for Resources and Environmental Sciences, Chinese Academy of Sciences (http://www.resdc.cn) [30]. At the national scale, we focused on 53 countries and regions throughout Asia, including five countries in East Asia (e.g., China, Japan, and Mongolia), five countries in Central Asia (e.g., Kazakhstan, Turkmenistan, and Kyrgyzstan), 10 countries and regions in South Asia (e.g., Afghanistan, Nepal, and Iran), 18 countries in West Asia (e.g., Turkey, the United Arab Emirates, and Azerbaijan), and 15 countries and regions in Southeast Asia (e.g., Indonesia, the Philippines, and Timor-Leste). Because Russia stretches over the European and Asian continents, it was not included in the study area [30]. The terrain is dominated by plateaus and mountains, and the central part is higher than the surrounding areas [31]. The continent of Asia is primarily located among the Pacific plate, the Eurasian plate, and the Indian plate and exhibits some of the most frequent and strong earthquakes worldwide [32].

2.2. Data

In this study, we used five types of data. First, the population data of Asia between 2000 and 2015 were obtained from the WorldPop version 2 dataset published by the GeoData Institute of the University of Southampton in 2017. The data have a spatial resolution of 1 km (http://www.worldpop.org.uk/data/) and consist of both the total population and the population in each 5-year age group in Asia.
The second type of data comprises peak ground acceleration (PGA) data for Asia that were published in 1999 by the Global Seismic Hazard Assessment Program with the support of the International Council of Scientific Unions (ICSU) (http://www.seismo.ethz.ch/static/gshap). The PGA data are depicted with a 10% chance of exceedance in a 50-year period corresponding to a return period of 475 years. The spatial resolution of the PGA data is 0.1 degrees [33]. The PGA data were compiled using a uniform procedure based on historical earthquake data throughout Asia following the cooperation of earthquake experts among Asian countries for many years. The resulting map eliminates the boundary discrepancies in seismic hazard maps among different Asian countries, and it is the only seismic hazard map of Asia with a full coverage produced using a consistent method [34].
The third dataset comprises socioeconomic data between 2000 and 2015 for Asia that were gathered from the World Bank (http://data.worldbank.org/). These socioeconomic data include a number of socioeconomic indicators, including the population density, urban population, birth rate, infant mortality rate, gross domestic product (GDP), and GDP per capita, for Asian countries.
The fourth type of data is urban land data for Asia in 2000 and 2015 from the HYDE dataset, which was published by the PBL Netherlands Environmental Assessment Agency (ftp://ftp.pbl.nl/hyde) [35]. The new version of the HYDE dataset (version 3.2) (PBL Netherlands Environmental Assessment Agency, Bezuidenhoudseweg 30, the Netherlands), which includes land use data, was published in 2016 [36]. The period of coverage is 10 000 BCE to 2015 CE. Urban land data is also provided, and the spatial resolution of the data is 0.083 degrees. After collecting all of the data, we resampled these data on an Albers projection to a spatial resolution of 1 km.

2.3. Methods

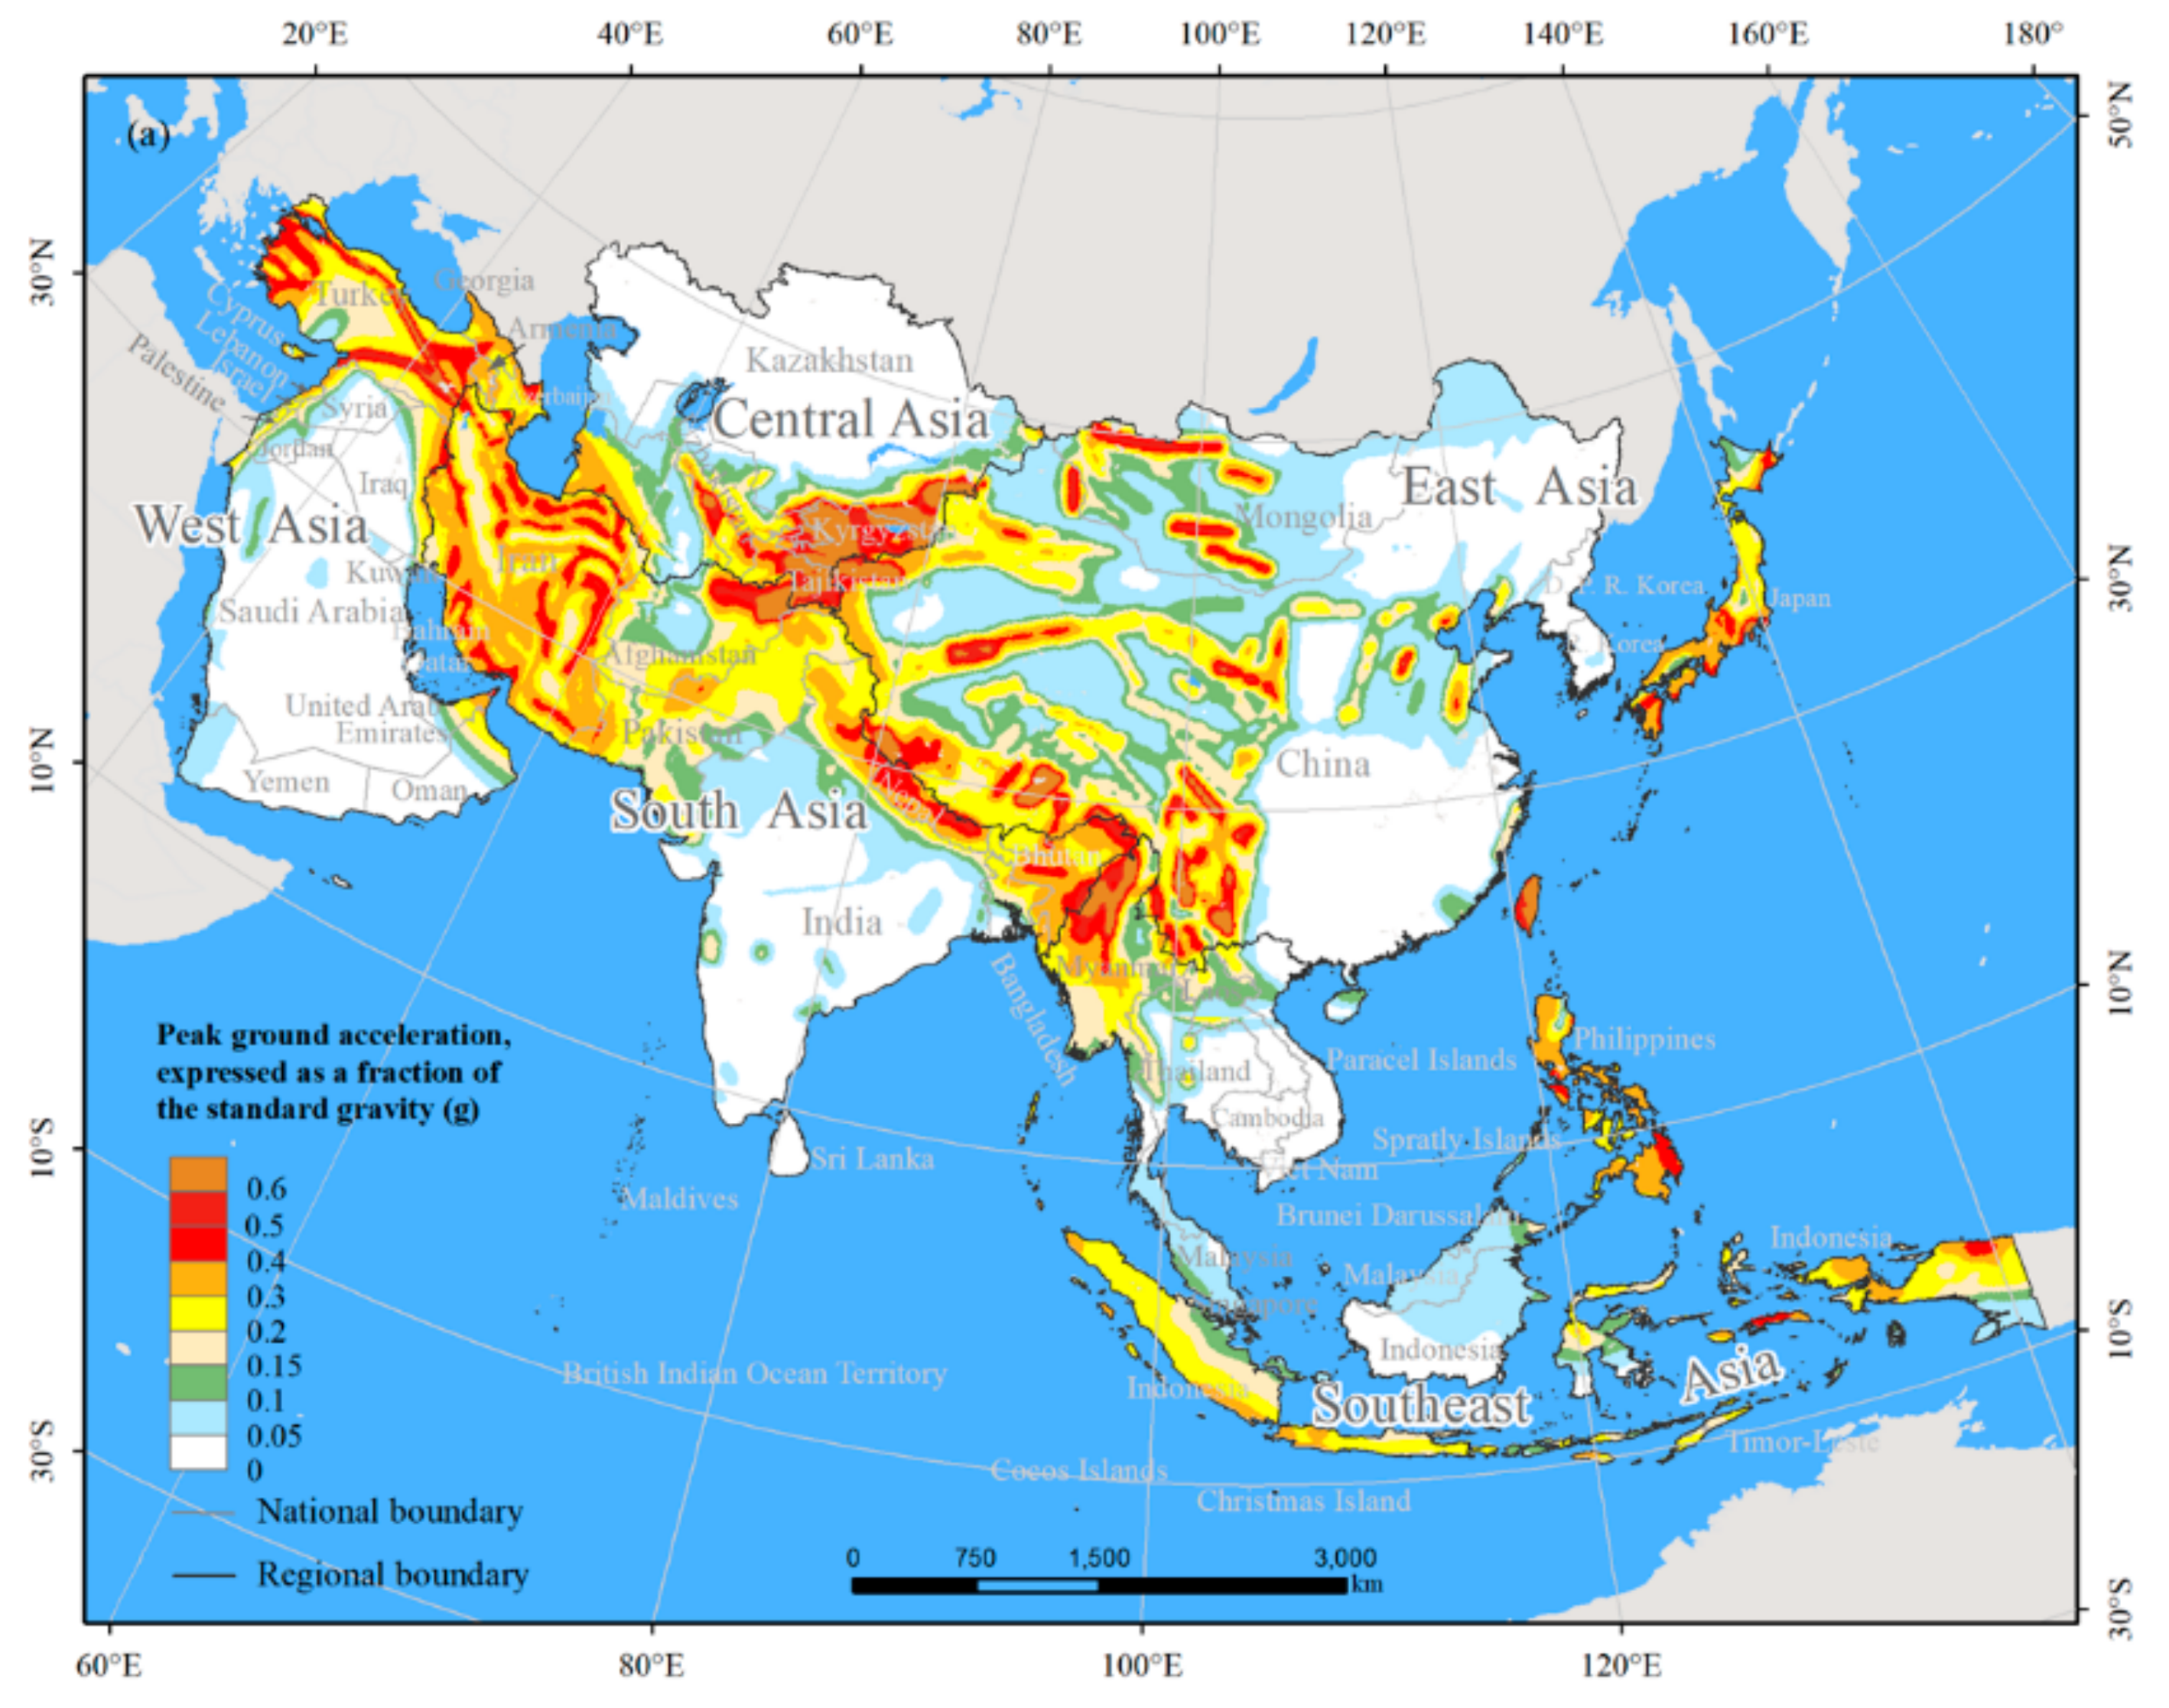
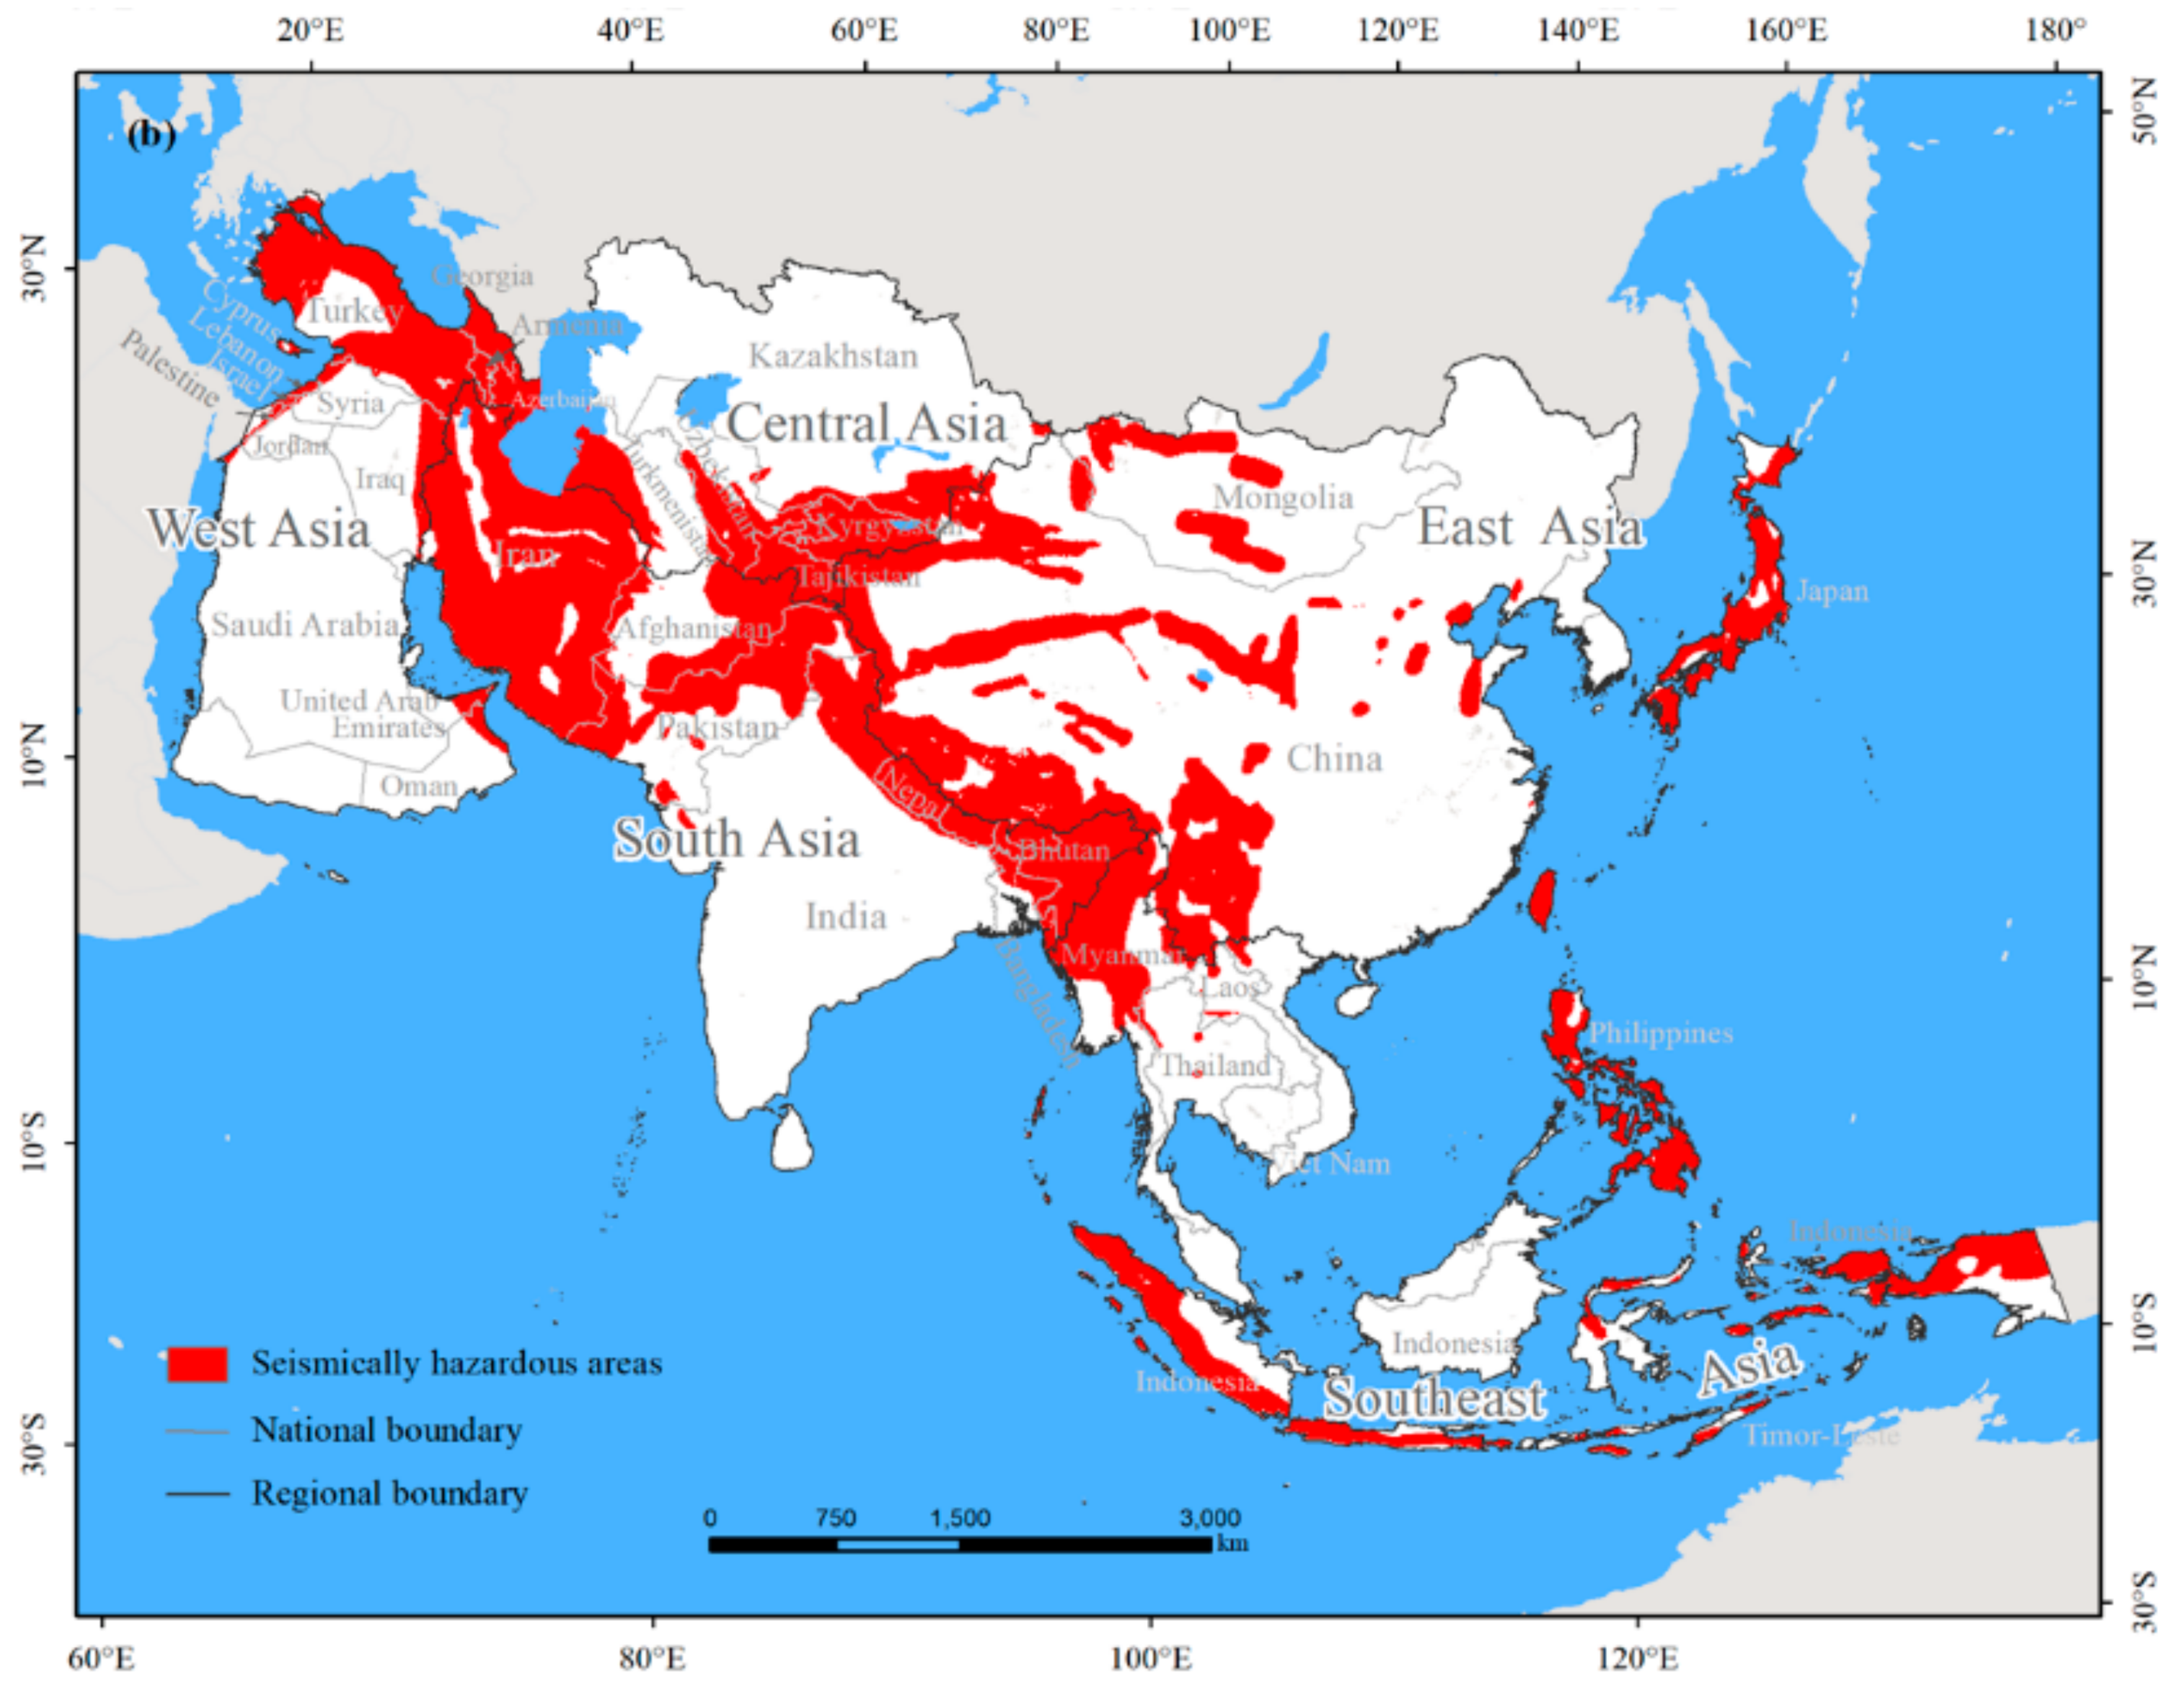
2.3.1. Determining the MSHA

At present, there are mainly two methods for determining the MSHA [2,19,37,38]. One method was based on the seismic intensity. For example, Nojima et al. [19] regarded the MSHA as the areas with a 3% probability of exceeding seismic intensity 6 lower for 30 years defined by Japan’s Meteorological Agency. Jaiswal et al. [38] defined that the MSHA were the areas with the Modified Mercalli Intensity greater than or equal to VII. However, the extent of the MSHA determined by the seismic intensity are not comparable among countries, since different countries adopted different measures for seismic intensity. The other method was based on the PGA value. This method was widely used for determining the MSHA [2,20,39], because it eliminated the discrepancies in seismic intensity among different countries. Therefore, in this study, the spatial distribution of the MSHA was determined using the PGA data. According to the criterion used by Holzer and Savage [2], the MSHA was defined as the areas with PGA values greater than or equal to 0.2 g (Figure 2). The MSHA corresponds to the areas with a value of VII on the instrumental seismic intensity scale according to the United States Geological Survey [17].

2.3.2. Analyzing the Changes in the Total Population in the MSHA

Based on the spatial distributions of the MSHA and the population data, we calculated the changes in the total population (Pop(∆k, MSHA)) living in the MSHA between 2000 and 2015 using the below equation,
Pop(∆k, MSHA) = (Ʃi=1n pop(k2, i) − Ʃi=1n pop(k1, i)) × D(MSHA, i)
where Pop(∆k, MSHA) denotes the changes in the total population living in the MSHA from the year k1 to the year k2; pop(k1, i) and pop(k2, i) refer to the total population in the ith pixel in the year k1 and k2, respectively; and D(MSHA, i) represents the class value, which is set to 1 if the ith pixel is located in the MSHA and is otherwise set to 0.

2.3.3. Analyzing the Changes in the Vulnerable Population in the MSHA

The vulnerable population refers to persons or groups whose characteristics and situations will affect their capacities to anticipate, cope with, resist, and recover from the impact of a natural hazard [10,39]. Because children and elderly persons are prone to injury or death during an earthquake, they are usually regarded as the vulnerable population [40,41,42]. In this paper, persons aged between 0 and 14 were regarded as children, and persons aged 65 and above were regarded as the elderly population [43]. The equations used to calculate the changes in the vulnerable population in the MSHA (Vul(∆k, MSHA)) are as follows,
Vul(∆k, MSHA) = Chil(∆k, MSHA) + Eld(∆k, MSHA)
of which,
Chil(∆k, MSHA) = (Ʃi=1n Chil(k2, i) − Ʃi=1n Chil(k1, i)) × D(MSHA,i)
Eld(∆k, MSHA) = (Ʃi=1n Eld(k2, i) − Ʃi=1n Eld(k1, i)) × D(MSHA,i)
where Chil(∆k, MSHA) and Eld(∆k, MSHA) refer to the changes in the child population and elderly population, respectively, living in the MSHA from the year k1 to the year k2; Chil(k1, i) and Chil(k2, i) are the child populations in the ith pixel in the years k1 and k2, respectively; and Eld(k1, i) and Eldl(k2, i) are the elderly populations in the ith pixel in the years k1 and k2, respectively.
Then, we analyzed the changes in the total population in the MSHA at the continental, subcontinental, and national scales. At the subcontinental scale, the total population changes in the MSHA of East Asia, Central Asia, South Asia, West Asia, and Southeast Asia were analyzed. At the national scale, the national administrative boundaries were overlapped with the boundaries of the MSHA. After this overlap, the MSHA was detected within 36 countries throughout Asia. Then, we analyzed the changes in the total population in the MSHA across these 36 countries. In addition, we further evaluated the changes in the vulnerable population in the MSHA at the abovementioned three scales.

3. Results

3.1. Features of the MSHA in Asia

The total area of the MSHA in Asia was 8.99 million km2, which accounts for 28.85% of Asia’s total land area (Figure 2b, Table 1). The MSHA was concentrated in South and East Asia. The MSHA in South Asia was the largest at the subcontinental scale with a total area of 3.04 million km2, followed by the area of East Asia MSHA of 2.72 million km2. The total area of the MSHA in these two regions accounted for approximately 60% of the total area of the MSHA in Asia. The areas of the MSHA in Southeast Asia, West Asia, and Central Asia were 1.38 million, 9.64 million, and 0.88 million km2, accounting for 15.31%, 10.72%, and 9.84% of the total area of the MSHA in Asia, respectively (Table 1).
At the national scale, the areas of the MSHA in China, Iran, Indonesia, Turkey, and India individually exceeded 50 km2 (Figure 2b). The areas of the MSHA among those five countries collectively accounted for 60.40% of the total area of the MSHA in Asia. Among them, the area of the MSHA in China was the largest and reached up to 2.15 million km2, which accounted for 23.93% of the total area of the MSHA in Asia. The areas of the MSHA in Iran, Indonesia, Turkey, and India were 1.44 million, 0.71 million, 0.60 million, and 0.53 million km2, accounting for 16.02%, 7.92%, 6.62%, and 5.92% of the total area of the MSHA in Asia, respectively (Table A1).

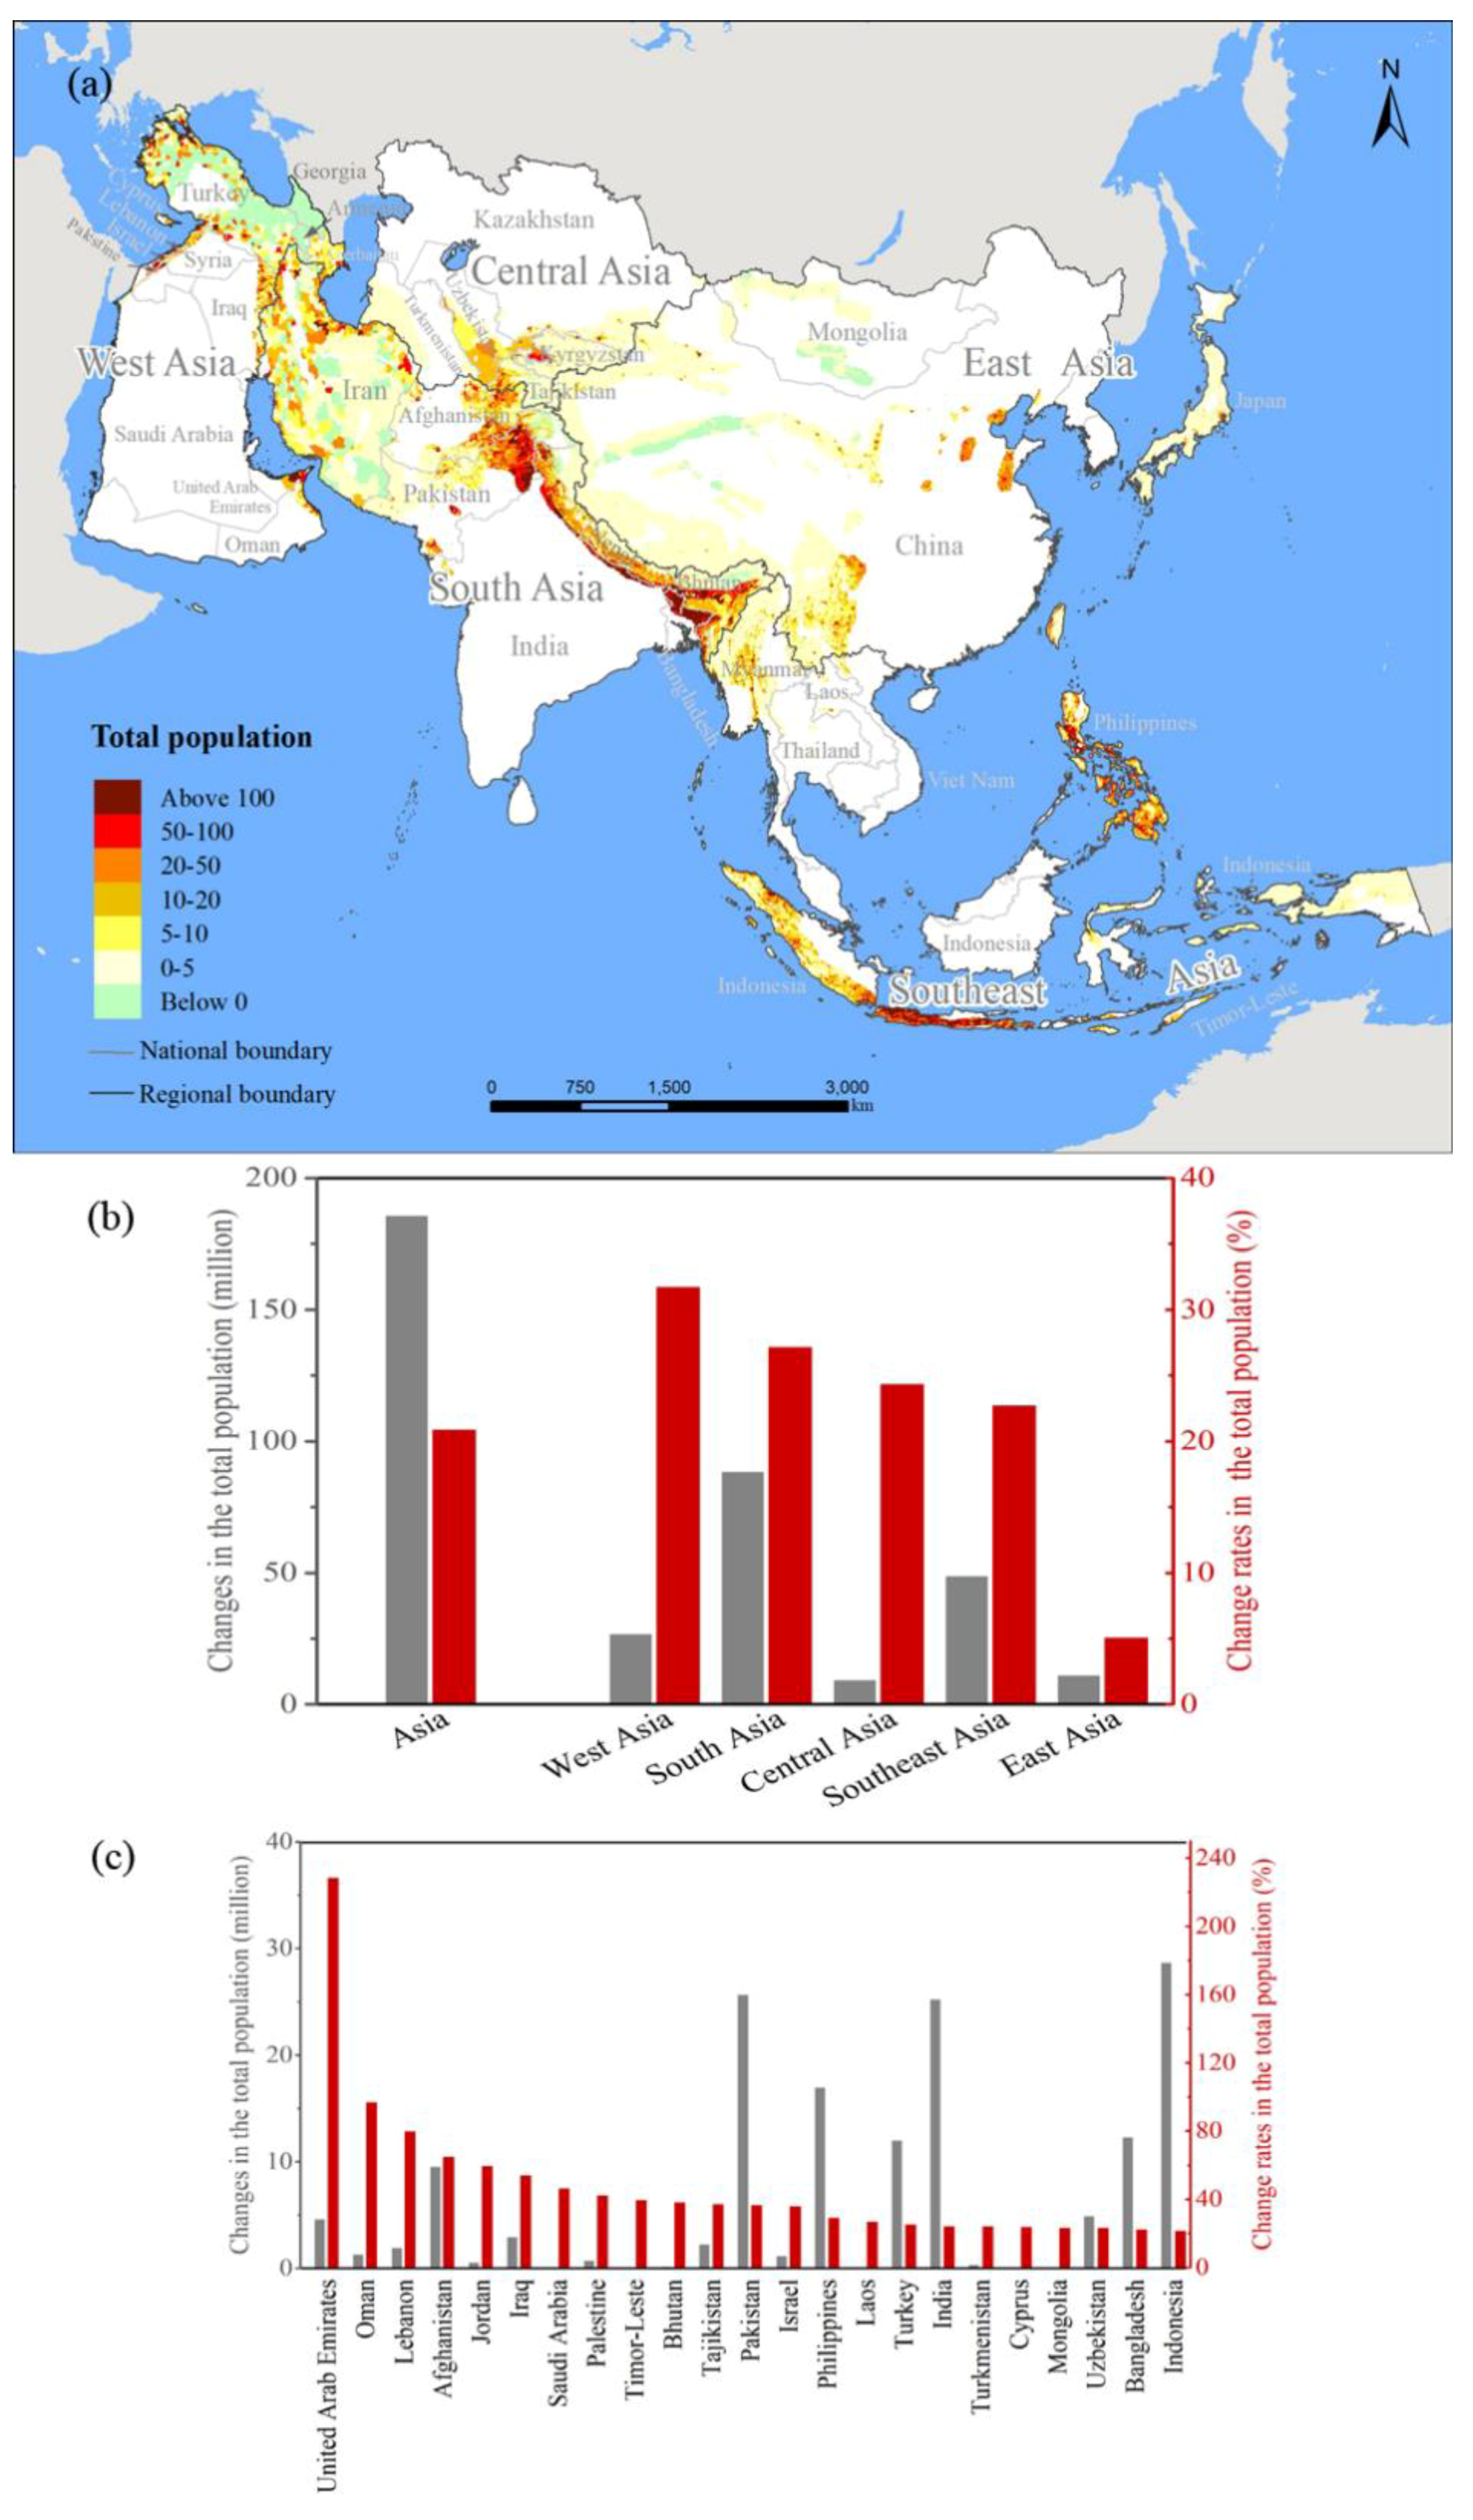
3.2. Population Changes among MSHA between 2000 and 2015

The population living in Asia’s MSHA increased rapidly from 0.88 billion people in 2000 to 1.07 billion people in 2015 with a growth rate of 20.93% (Figure 3a, Table 2). During that same period, the total population living in the non-MSHA region of Asia increased by 17.55%, from 2.80 billion people to 3.29 billion people. In other words, the increase of the former was 3.38% higher than that of the latter.
At the subcontinental scale, the increase of the population living in the MSHA of West Asia was the highest (Figure 3b, Table 2). The population in the MSHA of West Asia increased by 31.78%, from 85.16 million people in 2000 to 112.22 million people in 2015. That is, the increase of the population in the MSHA of West Asia was 1.52 times the average growth rate among the MSHA of Asia. However, the increase of the population in the MSHA of East Asia was the smallest (5.15%), as the population therein increased from 222.06 million people in 2000 to 233.47 million people in 2015 (Table 2). During that same period, the populations within the MSHA of South Asia, Central Asia and Southeast Asia increased by 27.21%, 24.41% and 22.78%, which was 88.73 million, 9.57 million and 49.11 million people, respectively (Figure 3b, Table 2).
At the national scale, the growth rates of the populations living within the MSHA of 23 countries were larger than the average growth rate of the population in the MSHA of Asia (i.e., 20.93%). Among those 23 countries, the increase of the population in the MSHA of the United Arab Emirates was the highest (Figure 3c, Table A2), as the population living therein increased from 2.03 million people in 2000 to 6.68 million people in 2015 with a growth rate of 228.41%, which was 10.91 times the average growth rate of the population in Asia’s MSHA during that period. The increase of the populations in the MSHA of seven countries, including Oman, Lebanon, and Afghanistan, ranged from 42.39% to 97.24% (Figure 3c, Table A2). The increase of the populations in the MSHA of 15 countries, including East Timor, Bhutan, and Tajikistan, fluctuated between 21.68% and 39.70%. Meanwhile, the increase of the populations living within the MSHA of 11 countries, including Azerbaijan, Nepal, and Kyrgyzstan, were lower than the average growth rate of the population in Asia’s MSHA and varied between 0.64% and 20.27% (Figure 3c, Table A2).

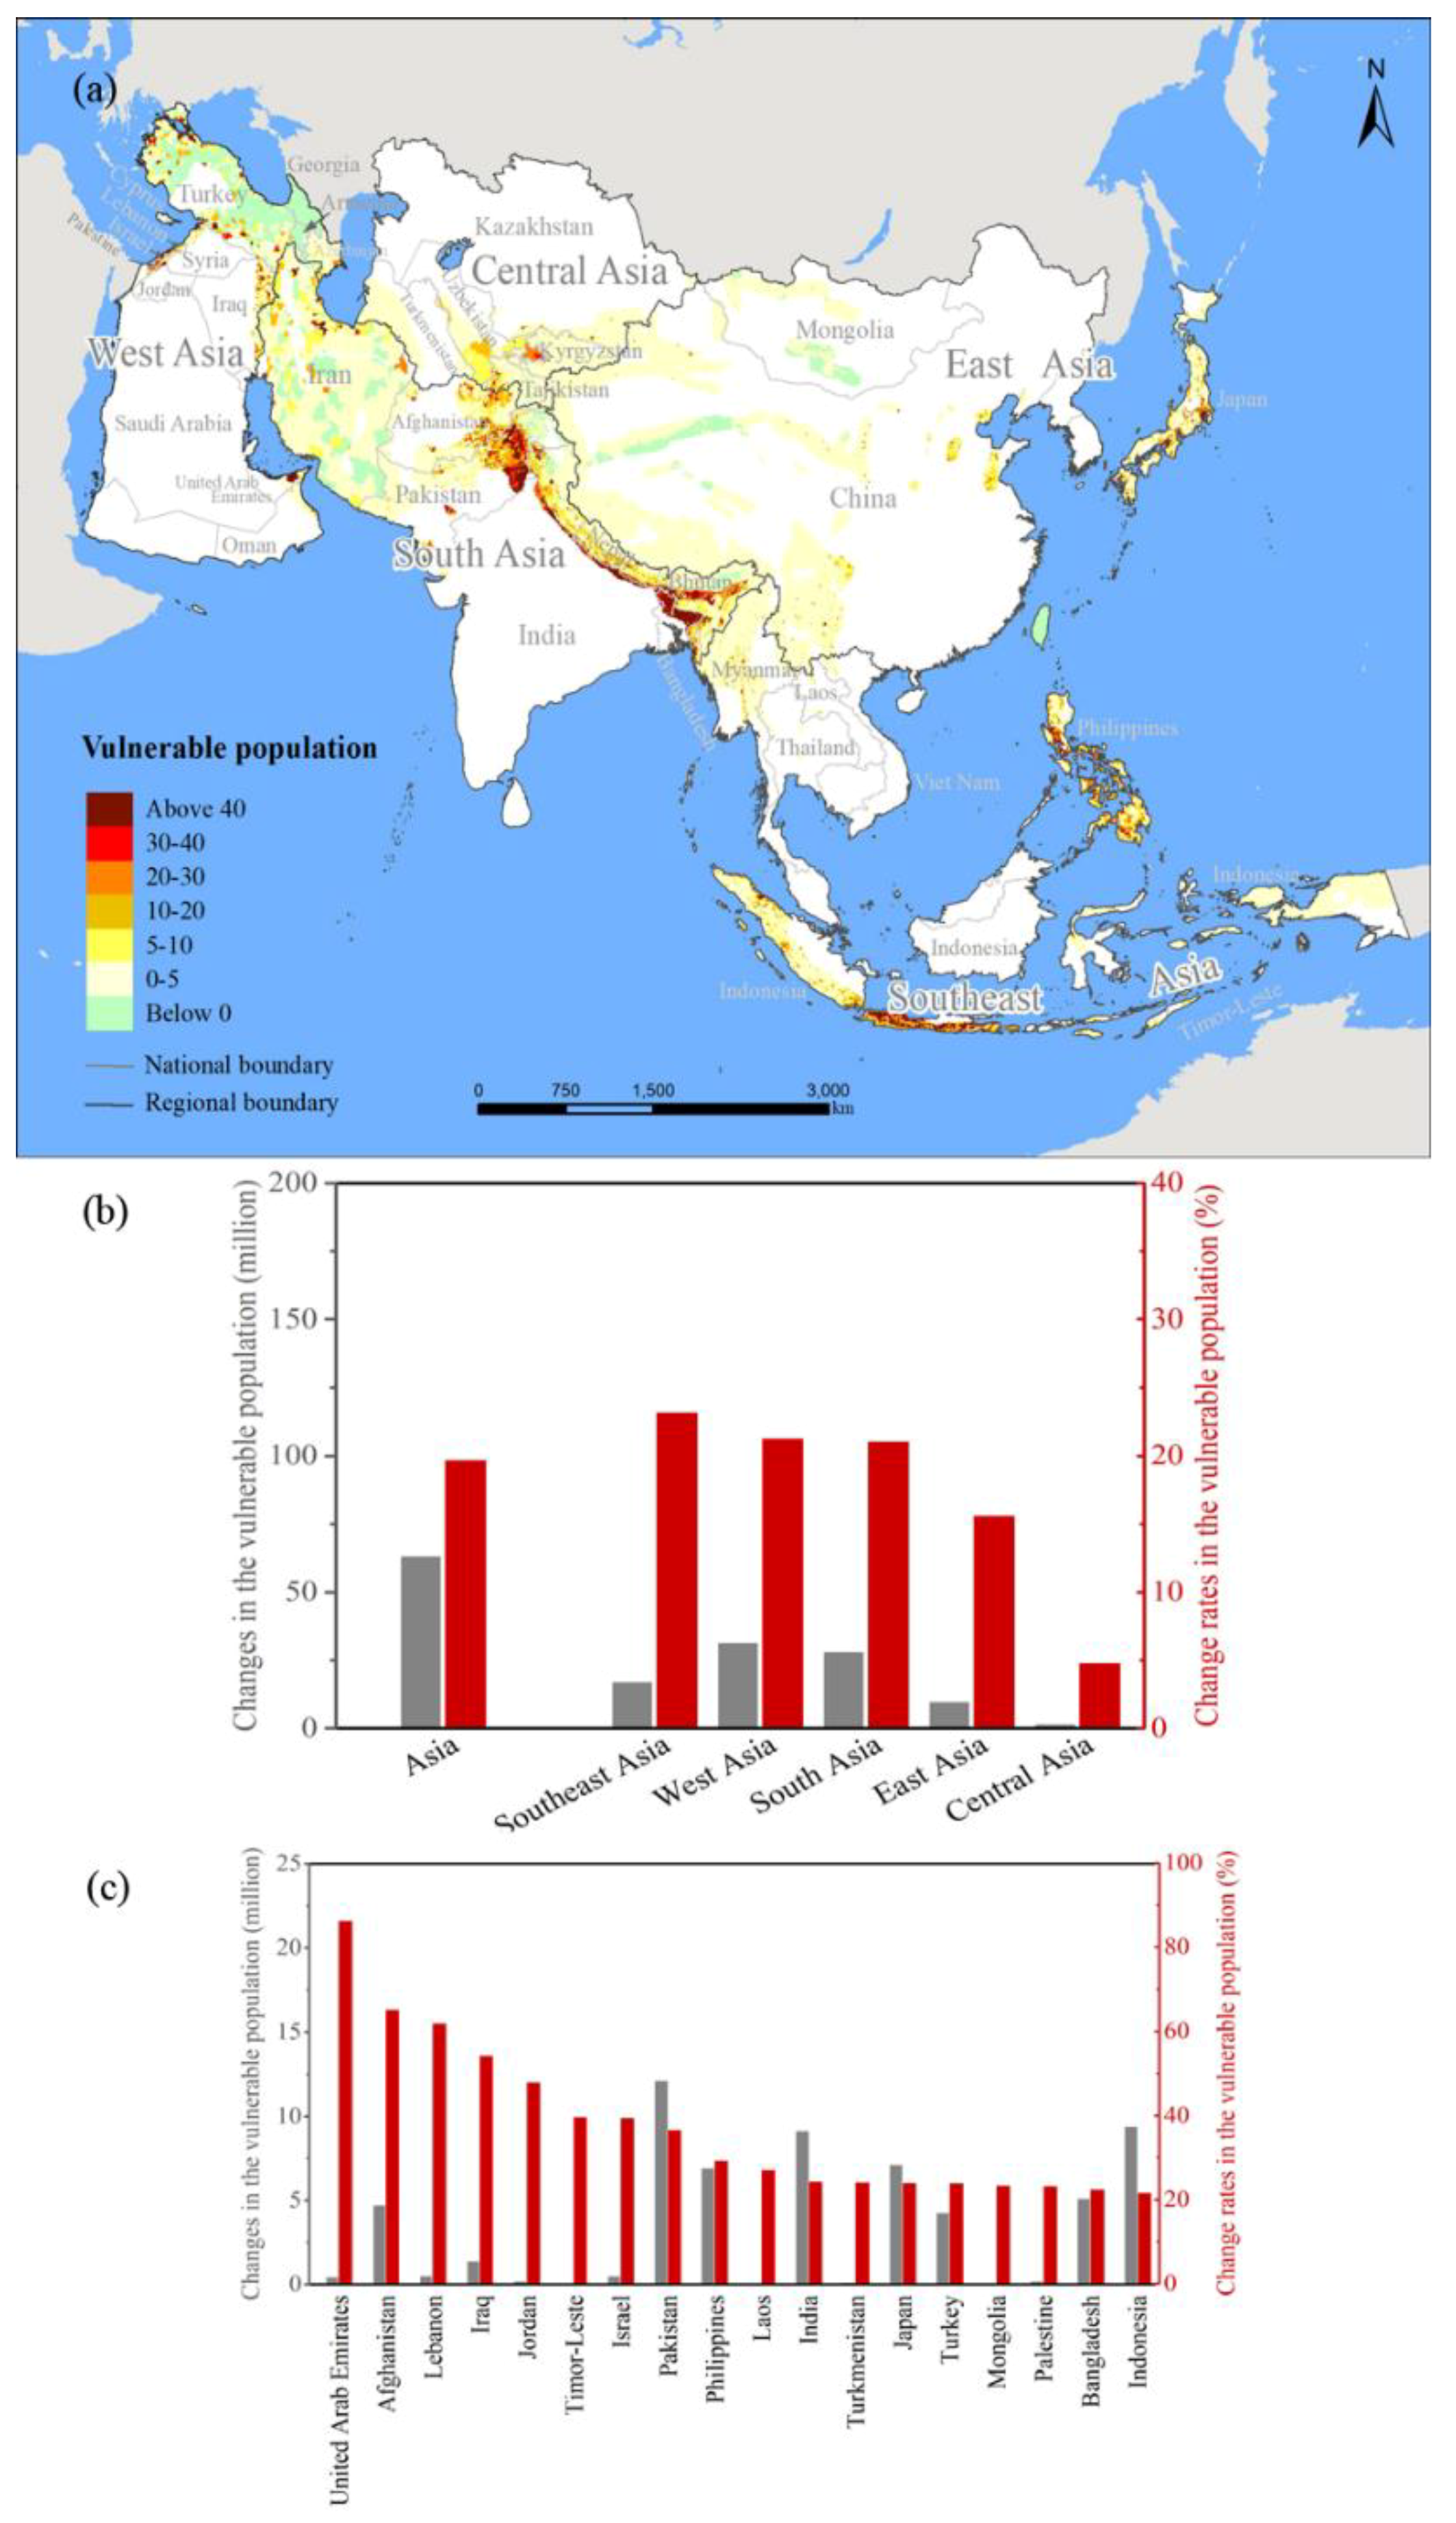
3.3. Vulnerable Population Changes among MSHA between 2000 and 2015

The vulnerable population living in Asia’s MSHA also increased rapidly from 321.94 million people in 2000 to 385.47 million people in 2015 with a growth rate of 19.73% (Figure 4a, Table 3). Meanwhile, the vulnerable population living in the non-MSHA region of Asia decreased from 1013.47 million people to 1011.40 million people with a growth rate of −0.20%. In other words, the growth rate of the former was 19.93% greater than that of the latter.
At the subcontinental scale, the increase of the vulnerable population living in the MSHA of Southeast Asia was the highest (Figure 4a, Table 3), as the vulnerable populace therein increased from 75.04 million people in 2000 to 92.47 million people in 2015 with a growth rate of 23.23%. Such a growth rate was 1.18 times the average growth rate of the vulnerable population in the MSHA of Asia during that period. However, the increase of the vulnerable population in the MSHA of Central Asia was the smallest, as the vulnerable population living therein increased from 15.92 million people in 2000 to 16.69 million people in 2015, during which period the corresponding increase reached only 4.84%. During that same period, the increase of the vulnerable populations living in the MSHA of West Asia, South Asia, and East Asia were 21.33%, 21.11%, and 15.65%, respectively, and the number of vulnerable people in each of those three regions increased by 6.93 million, 28.37 million, and 10.03 million people, respectively (Table 3).
At the national scale, the growth rates of the vulnerable populations living among the MSHA of 18 countries were larger than the average growth rate of the vulnerable population in Asia’s MSHA, which was 19.73% (Figure 4c, Table A3). Among those 18 countries, the increase of the vulnerable population in the MSHA of the United Arab Emirates was the highest (Figure 4c, Table A3), as the vulnerable population therein increased from 0.54 million people in 2000 to 1.01 million people in 2015 with a growth rate of 86.33% (Figure 4c, Table A3), which was 4.37 times the average growth rate of the vulnerable population in Asia’s MSHA during that period. The increase of the vulnerable populations in the MSHA of four countries, i.e., Afghanistan, Lebanon, Iraq, and Jordan, ranged from 47.91% to 65.16% (Figure 4c, Table A3). The increase of the vulnerable populations in the MSHA of 13 countries, e.g., Israel, Pakistan, and East Timor, fluctuated between 21.68% and 39.70%. Meanwhile, the increase of the vulnerable populations living within the MSHA of 12 countries, e.g., Kazakhstan, Vietnam, and Oman, were smaller than that of the vulnerable population in Asia’s MSHA. The vulnerable populations in the MSHA of those 12 countries grew by 1.70 thousand to 2.87 million people with growth rates between 2.40% and 18.19% (Figure 4c, Table A3).

4. Discussion

4.1. Utilizing WorldPop Datasets Allows for an Effective Analysis of the Changes of the Population in the MSHA

Adopting the WorldPop datasets to assess the changes of the population living in Asia’s MSHA has three advantages. First, the population information in the WorldPop datasets is comparable among different countries. The WorldPop datasets are acquired using a uniform method [28] to provide population distribution information across both regional and national scales [26]. In contrast, the population data in statistical datasets are less comparable among different countries, because the statistical objects of populations vary among those countries [44].
Second, the WorldPop datasets have a high level of accuracy. The WorldPop datasets, which have a spatial resolution of 0.0083 degrees (approximately 1 km), were obtained based on the downscaling method, which aggregates population data elements within a spatial resolution of 100 m, thereby improving the spatial resolution and accuracy of the population distribution data significantly [26]. However, the other freely available population datasets that cover all of Asia, including the population data with a 10 km spatial resolution from HYDE [21,36] and the population data with a spatial resolution of 5 km from the GPW database, the GRUMP database, and the GRID database [22,23], have relatively lower spatial resolutions. Therefore, these datasets cannot accurately depict the spatial distribution of the population in Asia’s MSHA.
Third, the WorldPop datasets can be used to analyze the changes of the vulnerable population in the MSHA. The WorldPop datasets include demographic data of different age groups in Asia that can be used to evaluate the changes of the vulnerable population. However, the other above-mentioned spatial population datasets do not provide this type of information [20,21,22,23,45], and consequently, they do not possess the ability to be used to analyze the changes of the vulnerable population in the MSHA.
Meanwhile, the results of our study based on the WorldPop datasets are in accordance with those of previous studies. For example, Djordjević et al. [18] found that the population living in Asia among the zones with probable maximum earthquake intensities of greater than or equal to VII increased rapidly by 23.37% between 2000 and 2015. He et al. [20] found that the population in the MSHA of China also increased by 32.52 million people between 1990 and 2010 with a rapid growth rate of 33.63%. Freire et al. [16] also found that the population living in seismically hazardous areas across the 11 megacities of Asia increased between 1950 and 2010. Therefore, based on the WorldPop datasets, the changes of the population in Asia’s MSHA over the past 15 years could be analyzed effectively and accurately.

4.2. Urban Population Growth Was a Major Factor Impacting the Increase in Both the Population and the Vulnerable Population in Asia’s MSHA

Following the methods by Tao et al. [46] and Chatterjee et al. [47], we further analyzed the relationship between the socioeconomic development and the population growth throughout Asia’s MSHA using correlation analysis and multiple general linear model (GLM) regression techniques to explore the factors associated with the rapid population growth in Asia’s MSHA. With reference to Ma et al. [48], the two methods are complementary to each other when used properly together. Specifically, the Pearson correlation can be used to scope potentially important factors and seek the best predictive models. While the stepwise multiple linear regression can be adopted to solve the problem of multicollinearity between different factors and further identify the key factors. Based on the accessibility of the data, we selected seven national-scale socioeconomic factors, including the population density, urban population, birth rate, mortality rate, urban land area, GDP, and GDP per capita.
We found that the urban population growth played a leading role in the rapid growth of the population in Asia’s MSHA over the past 15 years. The population growth in Asia’s MSHA between 2000 and 2010 was significantly correlated with the population density growth, urban population growth, and urban land area growth in Asia, and the Pearson correlation coefficients for the three factors were each larger than 0.87 (p < 0.001) (Table 4). Among those three factors, the population density growth had the largest correlation coefficient (r = 0.99, p < 0.001) (Table 4). The GLM regression results further indicated that the urban population growth accounted for 65.87% of the variation in the population living in the MSHA. Meanwhile, the population density growth, urban land area growth, and GDP growth can account for the additional 32.82%, 0.37%, and 0.06%, respectively, of the variation in the population in the MSHA (Table 4).
In addition, we found that the urban population growth also played a leading role in the rapid growth of the vulnerable population in Asia’s MSHA during the same period. The vulnerable population growth in Asia’s MSHA between 2000 and 2015 exhibited significant and positive correlations with the population density growth, urban population growth, and urban land area growth in Asia. The Pearson correlation coefficients for the three factors were each larger than 0.57 at the significance level of 0.001 (Table 4). The GLM regression results also suggested that the urban population growth accounted for 50.95% of the variation in the vulnerable population in the MSHA. The changes in the population density, urban land area, mortality rate, and GDP accounted for the additional 26.19%, 1.18%, 0.56%, and 0.11% in the variations, respectively (Table 4).
In the context of rapid urbanization in Asia, seismic risk prevention measures should be fully considered in future land use planning [49]. We suggest that Asian countries with massive and rapid population growth in the MSHA (e.g., Pakistan, Iraq, and Afghanistan, Table A2) should strengthen their building codes. Furthermore, the countries in Asia exhibited large and rapid increases in their vulnerable MSHA populations (e.g., Pakistan, Iraq, and Afghanistan, Table A3) should improve the earthquake-resistance capacity of schools and hospitals for the children and elderly people, and also equip the vulnerable population with the knowledge of seismic disaster prevention and mitigation.

4.3. More Attention Should Be Paid to Demographic Changes in the MSHA

Historical data indicated that Asia’s MSHA broadly exhibited high-frequency, high-intensity, and high-fatality earthquakes. More than 80% of the 1824 earthquakes reported throughout Asia between 1900 and 2009 with magnitudes of greater than or equal to 5.5 occurred in Asia’s MSHA (Table A4). In addition, 84.08% of the earthquakes with magnitudes of greater than or equal to seven occurred in Asia’s MSHA (Table A4). Among these earthquakes, five of the six earthquakes with death tolls larger than 50,000 people, including the 1920 Haiyuan earthquake in China, the 1948 Ashgabat earthquake in Turkmenistan, the 1976 Tangshan earthquake in China, the 1990 earthquake in western Iran, and the 2005 earthquake in Pakistan, all occurred in Asia’s MSHA. The total death toll of those five earthquakes reached over 688 thousand people [50].
More importantly, the population living throughout Asia’s MSHA is expected to grow rapidly by 57.93 million people from 2015 to 2020 with a growth rate of 5.39%, which is 0.92% greater than the estimated population growth rate in the non-MSHA region (Table A5). In addition, the people living among the MSHA of South Asia, Central Asia, Southeast Asia, and West Asia are estimated to continue to increase rapidly with growth rates of 7.22%, 7.21%, 6.04% and 6.10%, respectively, all of which will be greater than the average population growth rate in the MSHA of Asia (Table A5). Correspondingly, the populations among the MSHA of those four regions will increase by 29.96 million, 3.52 million, 15.98 million, and 6.84 million people. At the national scale, the population growth rates among the MSHA of 23 countries will be greater than the average population growth rate of the population in Asia’s MSHA (Table A2 and Table A5). The population growth rates in the MSHA among those 23 countries will range from 5.61% to 16.13%, and the amount of population growth in the MSHA of those countries will reach 47.97 million people. Among the 23 countries, the growth rates of the population in the MSHA of Palestine, Iraq, and Syria will be particularly high at 16.13%, 15.32%, and 13.59%, respectively, which will be 2.5–3 times the average growth rate of the population in Asia’s MSHA (Table A2 and Table A5).
Meanwhile, the vulnerable population living throughout Asia’s MSHA is also expected to grow rapidly by 24.20 million people between 2015 and 2020 with a growth rate of 6.28%. Such a growth rate will be 0.43% greater than that of the vulnerable population in the non-MSHA region (Table A5). In addition, the vulnerable populations living in the MSHA of Central Asia, South Asia, and West Asia will all continue to increase rapidly with growth rates of 9.70%, 7.40%, and 7.18%, respectively, all of which will be greater than the average growth rate of the vulnerable population in Asia’s MSHA (Table A5). Correspondingly, the vulnerable populations in the MSHA of those three regions will increase by 1.62 million, 12.04 million, and 2.83 million people. At the national scale, the vulnerable population growth rates in the MSHA of 20 countries will be greater than the average population growth rate in Asia’s MSHA (Table A3 and Table A5). The growth rates of the vulnerable populations among the MSHA of those 20 countries will vary between 7.14% and 23.66%, and their total vulnerable population growth in the MSHA will reach 13.49 million people. Among those 20 countries, the growth rate of the vulnerable population living in the MSHA of Oman will be the highest with a value of 23.66%, which will be 3.77 times the average growth rate of the vulnerable population in Asia’s MSHA (Table A3 and Table A5).
Therefore, more attention should be paid to the changes of the population in Asia’s MSHA. First, the monitoring scheme for the population changes in Asia’s MSHA should be enhanced. Asian countries should further strengthen their construction of real-time monitoring platforms for the populations living throughout the MSHA. This is especially true for countries such as the United Arab Emirates, Oman, and Afghanistan with rapidly increasing populations living in the MSHA as well as for countries with rapidly increasing vulnerable MSHA populations (e.g., the United Arab Emirates, Lebanon, Jordan, and Iraq).

4.4. Future Perspectives

The current study exhibits several limitations. First, the PGA data in Asia possess some limitations [34]. The PGA data for Asia were generated by using the probabilistic seismic hazard assessment method, which may underestimate the seismic hazard [51]. Second, the input model parameters for the population distribution data in the WorldPop datasets for Asia were derived from the spatial population data of numerous countries with various spatial resolutions. Therefore, the accuracy of the WorldPop data may be limited to a certain extent [28]. Third, vulnerable population also included other groups, such as people with disabilities, those who have been displaced, and refugees [10]. Due to the limitation of acquiring the data for these groups of vulnerable population, we only considered children and elderly people as vulnerable populations in this study. Besides, we simply explore the correlation between several socioeconomic factors and the changes of the population in Asia’s MSHA, while the driving mechanisms still need to be explored.
To avoid the limitations of PGA data in future studies, we will further seek to employ PGA data based on loss scenarios with the maximum credible earthquake method [7]. In addition, we will consider the use of multisource remote sensing data and geospatial data or volunteered geographic information data to obtain high-accuracy spatial population data [52,53].

5. Conclusions

The population in Asia’s MSHA increased rapidly by 185.88 million between 2000 and 2015 with a growth rate of 20.93%. The growth rate of the population in the MSHA was 3.38% greater than that in the non-MSHA region. Over that same period, the vulnerable population in Asia’s MSHA also increased rapidly by 63.65 million with a growth rate of 19.73%. The growth rate of the vulnerable population in the MSHA was 19.93% greater than that in the non-MSHA region.
Urban population growth was a major factor associated with the increase in both the population and the vulnerable population in Asia’s MSHA. The Pearson correlation coefficients between the urban population growth and the population growth in Asia’s MSHA were 0.89 (p < 0.001). The GLM regression results further indicated that the urban population growth accounted for 65.87% of the variation in the population in the MSHA. Further analysis indicated that the correlation coefficient between the urban population growth and the vulnerable population growth in Asia’s MSHA was 0.61 (p < 0.001) and that urban population growth could account for 50.95% of the variations in the vulnerable population in the MSHA.
Historical data suggested the presence of high-frequency earthquakes throughout Asia’s MSHA, and the death toll collectively in Asia’s MSHA was enormous. More importantly, the population living throughout Asia’s MSHA, especially its vulnerable population, is expected to grow rapidly in the future. Therefore, more attention should be paid to changes in the population throughout Asia’s MSHA. The monitoring of population changes in Asia’s MSHA should be strengthened. Furthermore, earthquake risk prevention techniques should be fully considered in urban planning endeavors in the future, and the vulnerable population should be equipped with the knowledge of seismic disaster prevention and mitigation practices.

Author Contributions

C.H. and Q.H. designed the study. Y.D. conducted the analysis. Y.D., Q.H. and C.H. wrote the original manuscript together. C.H., Y.D., Q.H., S.M. and Q.Z. reviewed and revised the manuscript.

Funding

This research was funded in part by the National Natural Science Foundation of China (Grant No. 41621061) and the 111 Project ‘Hazard and Risk Science Base at Beijing Normal University under Grant No. B08008 (Ministry of Education and State Administration of Foreign Expert Affairs, PRC). It was also supported by the Fundamental Research Funds for the Central Universities and the project from the State Key Laboratory of Earth Surface Processes and Resource Ecology, China.

Acknowledgments

We thank the academic editors and anonymous reviewers for their kind suggestions and valuable comments.

Conflicts of Interest

The authors declare no conflicts of interest.

Appendix A

Table A1. The areas of the MSHA in each country.
RegionCountryMSHA AreaPercentage of MSHA Area to the Area of CountryPercentage of MSHA Area in the Total MSHA Area of Asia
(104 km2)(%)(%)
West AsiaTurkey59.4876.146.62
Iraq8.4519.330.94
Azerbaijan8.3796.960.93
Georgia6.8598.080.76
Armenia2.8395.210.31
Oman2.768.970.31
United Arab Emirates2.1129.750.23
Syria1.699.110.19
Israel1.0246.400.11
Lebanon0.8685.330.10
Palestine0.5384.390.06
Cyprus0.5055.790.06
Jordan0.505.590.06
Saudi Arabia0.430.220.05
South AsiaIran144.0288.8216.02
India53.2616.895.92
Pakistan48.4955.345.39
Afghanistan33.5252.263.73
Nepal14.6999.901.63
Bangladesh6.5047.610.72
Bhutan3.9699.680.44
Southeast AsiaIndonesia71.1737.687.92
Myanmar38.3857.474.27
Philippines23.1678.252.58
Thailand1.733.370.19
Vietnam1.484.520.16
Laos1.185.140.13
Timor-Leste0.5537.200.06
Central AsiaKyrgyzstan19.2596.612.14
Uzbekistan19.0944.072.12
Turkmenistan18.4937.782.06
Kazakhstan17.466.451.94
Tajikistan14.1499.561.57
Eastern AsiaChina215.0822.9423.93
Mongolia29.4118.783.27
Japan27.5773.783.07
Table A2. Changes in the total population living among different MSHA from 2000 to 2020 in each country.
RegionCountryTotal Population in the MSHA (Million)Change Rate of the Total Population in the MSHA
200020152000–20152015–20202000–20152015–2020
West AsiaUnited Arab Emirates2.036.684.650.68228.41%10.13%
Oman1.402.761.360.2597.24%9.18%
Lebanon2.464.431.970.0380.18%0.70%
Jordan1.011.620.610.1359.82%8.13%
Iraq5.538.543.001.3154.25%15.32%
Saudi Arabia0.030.040.010.0046.64%9.59%
Palestine1.772.510.750.4142.39%16.13%
Israel3.434.661.240.3536.15%7.43%
Turkey47.4659.4912.032.6525.34%4.46%
Cyprus0.650.800.160.0324.01%4.05%
Azerbaijan8.119.751.640.4920.27%4.98%
Syria3.463.910.450.5313.06%13.59%
Armenia3.083.02−0.060.01−2.02%0.41%
Georgia4.744.00−0.74−0.03−15.62%−0.75%
South AsiaAfghanistan14.7124.299.582.9165.16%11.98%
Bhutan0.560.770.210.0538.36%5.83%
Pakistan70.1395.8525.729.9236.68%10.35%
India103.75129.0325.287.7324.36%5.99%
Bangladesh54.8767.2012.334.0522.47%6.03%
Nepal23.7528.514.761.6820.06%5.88%
Iran58.2669.0910.833.6318.60%5.25%
Southeast AsiaTimor-Leste0.200.270.080.0339.70%11.07%
Philippines57.9574.9717.025.6629.37%7.55%
Laos0.310.390.080.0427.05%8.93%
Indonesia132.41161.1228.719.0421.68%5.61%
Vietnam0.660.760.110.0415.99%5.34%
Myanmar23.5626.633.071.1713.02%4.40%
Thailand0.540.580.050.008.75%0.62%
Central AsiaTajikistan6.188.482.300.9537.25%11.18%
Turkmenistan1.591.970.390.1524.30%7.62%
Uzbekistan21.2426.184.941.6823.26%6.40%
Kyrgyzstan4.955.940.990.4520.00%7.58%
Kazakhstan5.256.200.950.3318.14%5.35%
East AsiaMongolia0.280.350.070.0323.44%7.42%
China128.45139.1910.742.708.36%1.94%
Japan93.3493.940.60−1.100.64%−1.17%
1 The change rate of the total population from 2000 to 2015 is calculated as (P2015 − P2000)/P2000 × 100%, where P2015 and P2000 refer to the total population in 2015 and 2000, respectively. 2 The change rate of the total population from 2015 to 2020 is calculated as (P2020 − P2015)/P2015 × 100%, where P2020 and P2015 refer to the total population in 2020 and 2015, respectively.
Table A3. Changes in the vulnerable population living among different MSHA from 2000 to 2020 in each country.
RegionCountryVulnerable Population in the MSHA (Million)Change Rate of the Vulnerable Population in the MSHA
200020152000–20152015–20202000–20152015–2020
West AsiaUnited Arab Emirates0.541.010.470.1786.33%17.34%
Lebanon0.881.420.54−0.0561.94%−3.23%
Iraq2.583.981.400.6154.28%15.32%
Jordan0.430.640.210.0247.91%3.72%
Israel1.311.820.520.1839.49%10.01%
Turkey17.8322.104.280.9023.98%4.08%
Palestine0.881.090.210.1423.29%13.12%
Oman0.550.640.080.1515.10%23.66%
Saudi Arabia0.010.010.000.0014.68%7.14%
Cyprus0.210.240.020.0211.73%7.85%
Syria1.531.610.080.045.37%2.43%
Azerbaijan2.972.69−0.280.47−9.54%17.62%
Armenia1.110.88−0.230.08−20.37%9.14%
Georgia1.631.25−0.380.08−23.06%6.06%
South AsiaAfghanistan7.2712.004.741.4465.16%11.98%
Pakistan33.0645.1812.124.6836.68%10.35%
India37.5646.709.142.8124.35%6.01%
Bangladesh22.8227.955.131.6822.48%6.03%
Nepal10.6410.900.26−0.262.40%−2.34%
Bhutan0.250.250.000.00−1.04%1.06%
Iran22.8019.79−3.021.69−13.22%8.55%
Southeast AsiaTimor-Leste0.100.140.040.0239.70%11.07%
Philippines23.5930.526.932.3029.38%7.55%
Laos0.130.160.030.0127.12%8.87%
Indonesia43.4552.879.422.9721.68%5.62%
Vietnam0.260.300.040.0216.07%5.28%
Myanmar7.348.300.960.3613.02%4.40%
Thailand0.170.190.020.008.75%0.62%
Central AsiaTurkmenistan0.530.660.130.0524.18%7.72%
Kazakhstan1.732.050.320.1118.19%5.31%
Tajikistan2.873.210.340.4511.84%14.02%
Kyrgyzstan2.002.120.120.295.82%13.88%
Uzbekistan8.798.66−0.130.72−1.48%8.26%
East AsiaJapan29.6936.827.141.2924.04%3.51%
Mongolia0.120.150.030.0123.43%7.42%
China34.3237.202.870.728.37%1.94%
1 The change rate of the vulnerable population from 2000 to 2015 is calculated as (V2015 − V2000)/V2000 × 100%, where V2015 and V2000 refer to the vulnerable population in 2015 and 2000, respectively. 2 The change rate of the vulnerable population from 2015 to 2020 is calculated as (V2020 − V2015)/V2015 × 100%, where V2020 and V2015 refer to the vulnerable population in 2020 and 2015, respectively.
Table A4. Earthquake events in the MSHA between 1900 and 2009.
Earthquake IntensityTotal Earthquakes in Asia (Number)Total Earthquakes in the MSHA (Number)Percentage of the Total Earthquakes in the MSHA (%)
Total1824150082.24
5.5–6.091673580.24
6.0–6.549841783.73
6.5–7.025321685.38
7.0 above15713284.08
Note: These data were acquired from the Global Instrumental Earthquake Catalogue released by the International Seismological Centre—Global Earthquake Model [47].
Table A5. Expected changes in the total population and in the vulnerable population of Asia from 2015 to 2020.
AreaRegionTotal Population ChangeChange Rate of the Total Population *Vulnerable Population ChangeChange Rate of the Vulnerable Population **
(Million)(%)(Million)(%)
MSHAAsia57.935.3924.206.28
South Asia29.967.2212.047.40
Central Asia3.527.211.629.70
West Asia6.846.102.837.18
Southeast Asia15.986.045.686.15
East Asia1.630.702.032.73
non-MSHA regionAsia146.944.4759.215.85
South Asia87.256.208.451.78
Central Asia1.075.780.8513.75
West Asia15.0410.373.847.50
Southeast Asia18.174.933.913.45
East Asia25.411.8942.1611.51
* Please refer to Table 2 for the calculation of the change rate of the total population. ** Please refer to Table 3 for the calculation of the change rate of the vulnerable population.

References

  1. Freire, S.; Aubrecht, C. Integrating population dynamics into mapping human exposure to seismic hazard. Nat. Hazards Earth Syst. 2012, 12, 3533–3543. [Google Scholar] [CrossRef] [Green Version]
  2. Holzer, T.L.; Savage, J.C. Global earthquake fatalities and population. Earthq. Spectra 2013, 29, 155–175. [Google Scholar] [CrossRef]
  3. Stahl, T.; Clark, M.K.; Zekkos, D.; Athanasopoulos-Zekkos, A.; Willis, M.; Medwedeff, W.; Knoper, L.; Townsend, K.; Jin, J. Earthquake science in resilient societies. Tectonics 2017, 36, 749–753. [Google Scholar] [CrossRef] [Green Version]
  4. Bilham, R. The seismic future of cities. Bull. Earthq. Eng. 2009, 7, 839–887. [Google Scholar] [CrossRef] [Green Version]
  5. Tucker, B.E. Reducing earthquake risk. Science 2013, 341, 1070–1072. [Google Scholar] [CrossRef] [PubMed]
  6. Wenzel, F.; Bendimerad, F.; Sinha, R. Megacities—Megarisks. Nat. Hazards 2007, 42, 481–491. [Google Scholar] [CrossRef]
  7. Wyss, M.; Rosset, P. Mapping seismic risk: The current crisis. Nat. Hazards 2013, 68, 49–52. [Google Scholar] [CrossRef]
  8. Tang, B.; Deng, Q.; Glik, D.; Dong, J.; Zhang, L. A Meta-Analysis of Risk Factors for Post-Traumatic Stress Disorder (PTSD) in Adults and Children after Earthquakes. Int. J. Environ. Res. Public Health 2017, 14, 1537. [Google Scholar] [CrossRef] [PubMed]
  9. Fujiu, M.; Morisaki, Y.; Takayama, J.; Yanagihara, K.; Nishino, T.; Sagae, M.; Hirako, K. Evaluation of Regional Vulnerability to Disasters by People of Ishikawa, Japan: A Cross Sectional Study Using National Health Insurance Data. Int. J. Environ. Res. Public Health 2018, 15, 507. [Google Scholar] [CrossRef] [PubMed]
  10. Vink, K.; Takeuchi, K. International comparison of measures taken for vulnerable people in disaster risk management laws. Int. J. Disaster Risk Reduct. 2013, 4, 63–70. [Google Scholar] [CrossRef]
  11. Tanida, N. What happened to elderly people in the great Hanshin earthquake. BMJ 1996, 313, 1133–1135. [Google Scholar] [CrossRef] [PubMed] [Green Version]
  12. Feng, C.; Zhang, H.; Liu, Q.; Liang, K. An overview of two devastating earthquakes in Afghanistan in March 2002. Rec. Dev. World Seism. 2002, 16–21. (In Chinese) [Google Scholar]
  13. United Nations. World Population Prospectives: The 2015 Revision, Volume II: Demographic Profiles; United Nations Department of Economic and Social Affairs: New York, NY, USA, 2015; pp. 21–27. ISBN 9789211515336. [Google Scholar]
  14. Guha-Sapir, D.; Vos, F. Earthquakes, an epidemiological perspective on patterns and trends. In Human Casualties in Earthquakes: Progress in Modeling and Mitigation; Spence, R., So, E., Scawthornp, C., Eds.; Springer: Dordrecht, The Netherlands; Heidelberg, Germany; London, UK; New York, NY, USA, 2011; pp. 13–24. [Google Scholar]
  15. Li, M.; Zou, Z.; Xu, G.; Shi, P. Mapping earthquake risk of the world. World Atlas Nat. Disaster Risk 2015, 25–39. [Google Scholar] [CrossRef]
  16. Freire, S.; Ehrlich, D.; Ferri, S. Assessing temporal changes in global population exposure and impacts from earthquakes. In Proceedings of the 11th International ISCRAM Conference, University Park, PA, USA, 1 May 2014; pp. 324–328. [Google Scholar]
  17. The United States Geological Survey (USGS). The Modified Mercalli Intensity Scale. Available online: https://earthquake.usgs.gov/learn/topics/mercalli.php (accessed on 24 August 2018).
  18. Djordjević, M.; Radivojević, A.; Dragović, R.; Filipović, I. Exposure to earthquakes-distribution and change of the world’s population with regard to disposition of seismic activities. J. Geogr. Inst. Jovan Cvijic SASA 2016, 66, 353–370. [Google Scholar] [CrossRef]
  19. Nojima, N.; Fujikawa, S.; Ishikawa, Y.; Okumura, T.; Fujiwara, H.; Morikawa, N. Exposure analysis using the probabilistic seismic hazard maps for Japan. J. Disaster Res. 2013, 8, 861–868. [Google Scholar] [CrossRef]
  20. He, C.; Huang, Q.; Dou, Y.; Tu, W.; Liu, J. The population in China’s earthquake-prone areas has increased by over 32 million along with rapid urbanization. Environ. Res. Lett. 2016, 11, 074028. [Google Scholar] [CrossRef] [Green Version]
  21. Goldewijk, K.K.; Beusen, A.; Janssen, P. Long-term dynamic modeling of global population and built-up area in a spatially explicit way: Hyde 3.1. Holocene 2010, 20, 565–573. [Google Scholar] [CrossRef]
  22. Balk, D.; Yetman, G. The Global Distribution of Population Evaluating the Grains in Resolution Refinement. Center for International Earth Science Information Network (CIESIN), Colunbia University, Draft Documentation for GPW v3. Available online: http://beta.sedac.ciesin.columbia.edu/gpw (accessed on 11 April 2017).
  23. Balk, D.; Pozzi, F.; Yetman, G.; Deichmann, U.; Nelson, A. The distribution of people and the dimension of place: Methodologies to improve the global estimation of urban extents. In Proceedings of the Urban Remote Sensing Conference of the International Society for the Photogrammetry and Remote Sensing, Tempe, AZ, USA, 14–16 March 2005. [Google Scholar]
  24. The United Nations Environment Programme (UNEP). Global Resource Information Database. 1990. Available online: http://na.unep.net/siouxfalls/datasets/datalist.php (accessed on 11 April 2017).
  25. Tatem, A.J. Worldpop, open data for spatial demography. Sci. Data 2017, 4, 170004. [Google Scholar] [CrossRef] [PubMed]
  26. Sorichetta, A.; Hornby, G.M.; Stevens, F.R.; Gaughan, A.E.; Linard, C.; Tatem, A.J. High-resolution gridded population datasets for Latin America and the Caribbean in 2010, 2015, and 2020. Sci. Data 2015, 2, 150045. [Google Scholar] [CrossRef] [PubMed] [Green Version]
  27. Lloyd, C.T.; Sorichetta, A.; Tatem, A.J. High resolution global gridded data for use in population studies. Sci. Data 2017, 4, 170001. [Google Scholar] [CrossRef] [PubMed]
  28. Gaughan, A.E.; Stevens, F.R.; Linard, C.; Jia, P.; Tatem, A.J. High resolution population distribution maps for Southeast Asia in 2010 and 2015. PLoS ONE 2013, 8, e55882. [Google Scholar] [CrossRef] [PubMed]
  29. Wilson, R.; Zu Erbach-Schoenberg, E.; Albert, M.; Power, D.; Tudge, S.; Gonzalez, M.; Guthrie, S.; Chamberlain, H.; Brooks, C.; Hughes, C.; et al. Rapid and near real-time assessments of population displacement using mobile phone data following disasters: The 2015 Nepal earthquake. PLoS Curr. 2016, 8, 1–25. [Google Scholar] [CrossRef] [PubMed]
  30. Data Center for Resources and Environmental Sciences Chinese Academy of Sciences (DCRES). The Subcontinental and National Boundaries. Available online: http://www.resdc.cn (accessed on 11 April 2017).
  31. Liu, D.; Li, Z.; Jiang, S.; Han, J. Asia’s Natural Geography; The Commercial Press: Beijing, China, 1996; ISBN 7100017203. (In Chinese) [Google Scholar]
  32. Zhang, P.; Yang, Z.; Gupta, H.K.; Bhatia, S.C.; Shedlock, K.M. Global seismic hazard assessment program (GSHAP) in continental Asia. Ann. Geofis. 1999, 42, 1167–1190. [Google Scholar]
  33. Giardini, D.; Grunthal, G.; Shedlock, K.M.; Zhang, P. The GSHAP global seismic hazard map. Ann. Geofis. 1999, 42, 1225–1230. [Google Scholar]
  34. Showstack, R. New map lays out global seismic hazard values. Eos Trans. Am. Geophys. Union 1999, 80, 633–635. [Google Scholar] [CrossRef]
  35. O’Neill, B.C.; Kriegler, E.; Ebi, K.L.; Kemp-Benedict, E.; Riahi, K.; Rothman, D.S.; van Ruijven, B.J.; van Vuuren, D.P.; Birkmann, J.; Kok, K.; et al. The roads ahead: Narratives for shared socioeconomic pathways describing world futures in the 21st century. Glob. Environ. Chang. 2015, 42, 169–180. [Google Scholar] [CrossRef]
  36. Goldewijk, K.K.; Beusen, A.; Doelman, J.; Stehfest, E. New anthropogenic land use estimates for the holocene; hyde 3.2. Earth Syst. Sci. Data Discuss. 2017, 9, 927–953. [Google Scholar] [CrossRef]
  37. Lin, K.H.E.; Chang, Y.C.; Liu, G.Y.; Chan, C.H.; Lin, T.H.; Yeh, C.H. An interdisciplinary perspective on social and physical determinants of seismic risk. Nat. Hazards Earth Syst. 2015, 15, 2173–2182. [Google Scholar] [CrossRef] [Green Version]
  38. Jaiswal, K.S.; Petersen, M.D.; Rukstales, K.; Leith, W.S. Earthquake shaking hazard estimates and exposure changes in the conterminous United States. Earthq. Spectra 2015, 31, 201–220. [Google Scholar] [CrossRef]
  39. Blaikie, P.M.; Cannon, T.; Davis, I.; Wisner, B. At Risk: Natural Hazards, People Vulnerability and Disasters, 2nd ed.; Routledge: London, UK, 2014; ISBN 9781135642723. [Google Scholar]
  40. Wieland, M.; Pittore, M.; Parolai, S.; Zschau, J. Exposure estimation from multi-resolution optical satellite imagery for seismic risk assessment. ISPRS Int. J. Geo-Inf. 2012, 1, 69–88. [Google Scholar] [CrossRef]
  41. The United Nations Office for Disaster Risk Reduction (UNISDR). Towards a Culture of Prevention: Disaster Risk Reduction Begins at School-Good Practices and Lessons Learned. Available online: https://www.unisdr.org/2007/campaign/wdrc-2006–2007.htm (accessed on 11 April 2017).
  42. Cutter, S.L.; Finch, C. Temporal and spatial changes in social vulnerability to natural hazards. Proc. Natl. Acad. Sci. USA 2008, 105, 2301–2306. [Google Scholar] [CrossRef] [PubMed] [Green Version]
  43. Peng, X. China’s demographic history and future challenges. Science 2011, 333, 581–587. [Google Scholar] [CrossRef] [PubMed]
  44. Tatem, A.J. Mapping the denominator: Spatial demography in the measurement of progress. Int. Health 2014, 6, 153–155. [Google Scholar] [CrossRef] [PubMed]
  45. Bhaduri, B.; Bright, E.; Coleman, P.; Urban, M.L. Landscan USA: A high-resolution geospatial and temporal modeling approach for population distribution and dynamics. GeoJournal 2007, 69, 103–117. [Google Scholar] [CrossRef]
  46. Tao, S.; Fang, J.; Zhao, X.; Zhao, S.; Shen, H.; Hu, H.; Tang, Z.; Wang, Z.; Guo, Q. Rapid loss of lakes on the Mongolian plateau. Proc. Natl. Acad. Sci. USA 2015, 112, 2281–2286. [Google Scholar] [CrossRef] [PubMed]
  47. Chatterjee, S.; Hadi, A.S.; Price, B. Regression Analysis by Example; John Wiley and Sons: New York, NY, USA, 2000; ISBN 9780471746966. [Google Scholar]
  48. Ma, Q.; He, C.; Wu, J. Behind the rapid expansion of urban impervious surfaces in China: Major influencing factors revealed by a hierarchical multiscale analysis. Land Use Policy 2016, 59, 434–445. [Google Scholar] [CrossRef]
  49. The United Nations Office for Disaster Risk Reduction (UNISDR). Sendai Framework for Disaster Risk Reduction 2015–2030. Available online: https://www.unisdr.org/we/inform/publications/43291 (accessed on 24 August 2018).
  50. Storchak, D.A.; Di Giacomo, D.; Engdahl, E.R.; Harris, J.; Bondár, I.; Lee, W.H.K.; Bormann, P.; Villaseñor, A. The ISC-GEM global instrumental earthquake catalogue (1900–2009): Introduction. Phys. Earth Planet. Inter. 2015, 239, 48–63. [Google Scholar] [CrossRef]
  51. Zuccolo, E.; Vaccari, F.; Peresan, A.; Panza, G.F. Neo-deterministic and probabilistic seismic hazard assessments: A comparison over the Italian territory. Pure Appl. Geophys. 2011, 168, 69–83. [Google Scholar] [CrossRef]
  52. Azar, D.; Engstrom, R.; Graesser, J.; Comenetz, J. Generation of fine-scale population layers using multi-resolution satellite imagery and geospatial data. Remote Sens. Environ. 2013, 130, 219–232. [Google Scholar] [CrossRef]
  53. Bakillah, M.; Liang, S.; Mobasheri, A.; Jokar Arsanjani, J.; Zipf, A. Fine-resolution population mapping using openstreetmap points-of-interest. Int. J. Geogr. Inf. Sci. 2014, 28, 1940–1963. [Google Scholar] [CrossRef]
Figure 1. The study area.
Ijerph 15 01893 g001
Figure 2. Seismic PGA map. (a) The PGA with a 10% probability of exceedance in 50 years; (b) The most seismically hazardous area (MSHA) with PGA values greater than or equal to 0.2 g.
Ijerph 15 01893 g002aIjerph 15 01893 g002b
Figure 3. Changes in the total populations living among different MSHA from 2000 to 2015. (a) The total population density, unit: people/km2; (b) The change rates in the total population in the MSHA of Asia; (c) The change rates in the total populations living in the MSHA of the selected countries. (The countries were selected when the total population in an MSHA increased from 2000 to 2015).
Ijerph 15 01893 g003
Figure 4. Changes in the vulnerable populations living among different MSHA from 2000 to 2015. (a) The vulnerable population density, unit: person/km2; (b) change rates in the vulnerable population in the MSHA of Asia; and (c) change rates in the vulnerable populations in the MSHA of the selected countries.
Ijerph 15 01893 g004
Table 1. The area of MSHA.
RegionMSHA Area (104 km2)Regional Area (104 km2)Percentages of MSHA Area to the Regional Area (%)Percentage of MSHA Area to the Total MSHA Area of Asia (%)
Asia898.963115.8428.85
South Asia304.44668.2245.5633.87
East Asia272.061153.5423.5830.26
Southeast Asia137.65445.8230.8815.31
West Asia96.38451.4221.3510.72
Central Asia88.43396.8422.289.84
Table 2. Changes in the total population of Asia from 2000 to 2015.
AreaRegion200020152000 to 2015Change Rate 1
(Million)(Million)(Million)(%)
MSHAAsia888.071073.95185.8820.93
West Asia85.16112.2227.0731.78
South Asia326.03414.7588.7327.21
Central Asia39.2048.779.5724.41
Southeast Asia215.62264.7349.1122.78
East Asia222.06233.4711.415.15
non-MSHAAsia2797.243288.09490.8517.55
West Asia99.80145.0145.2045.29
South Asia1125.911408.22282.3125.07
Central Asia15.8918.542.6516.71
Southeast Asia310.56368.7658.2018.74
East Asia1245.081347.56102.488.23
1 The change rate of the total population is calculated as (P2015 − P2000)/P2000 × 100%, whereas P2015 and P2000 refer to the total population in 2015 and 2000, respectively.
Table 3. Changes in the vulnerable population of Asia from 2000 to 2015.
AreaRegion200020152000 to 2015Change Rate 1
(Million)(Million)(Million)(%)
MSHAAsia321.94385.4763.5319.73
Southeast Asia75.0492.4717.4323.23
West Asia32.4539.386.9321.33
South Asia134.40162.7728.3721.11
East Asia64.1374.1610.0315.65
Central Asia15.9216.690.774.84
non-MSHAAsia1013.471011.40−2.07−0.20
Southeast Asia117.89113.33−4.56−3.86
West Asia42.4651.148.6920.46
South Asia447.09474.4227.336.11
East Asia399.93366.31−33.62−8.41
Central Asia6.106.190.091.48
1 The change rate of the vulnerable population is calculated as (V2015 − V2000)/V2000 × 100%, whereas V2015 and V2000 refer to the vulnerable population in 2015 and 2000, respectively.
Table 4. Selected factors associated with population changes in the MSHA from 2000 to 2015.
MethodVariableTotal Population in the MSHAVulnerable Population in the MSHA
rprp
Pearson’s CorrelationPopulation density0.9980.0000.7410.000
Urban population0.8940.0000.6070.000
GDP0.1270.4190.0370.603
GDP per capita0.3790.1830.3080.111
Urban land area0.8750.0000.5750.001
Birth rate−0.3330.245−0.2050.278
Infant mortality rate0.3990.1570.2010.287
Multiple GLM RegressionVariableMSSS, %MSSS, %
Population density1.39632.82 *0.1526.19 *
Urban population2.80265.87 *0.3050.95 *
GDP0.0030.070.000.10
Urban land area0.0160.370.011.18
Birth rate0.0040.100.000.51
Infant mortality rate0.0000.000.000.56
Residuals0.0020.770.0120.51
Note: Variables in the table represent the change rates of the factors from 2000 to 2015. The multiple GLM regression results passed the standard regression diagnostics. The variance inflation factors (VIFs) were tested as less than 8. All of the statistical analyses were conducted in R version 3.3.1 (http://www.R-project.org) (RStudio, Boston, The United States). * p < 0.05; MS: mean squares; SS: proportion of variances explained by the variables.

