Time Spent in Sedentary Behaviour as Discriminant Criterion for Frailty in Older Adults

 , , ,
, , ,
Abstract
:1. Introduction
2. Materials and Methods
2.1. Characterization of the Study and Population
2.2. Data Collection Procedures
2.2.1. Frailty Syndrome
2.2.2. Sedentary Behaviour
2.2.3. Sociodemographic Variables
2.2.4. Health Indicators
2.3. Statistical Procedures
2.4. Ethical Procedures
3. Results
4. Discussion
5. Conclusions
Author Contributions
Funding
Conflicts of Interest
References
- Ensrud, K.E.; Ewing, S.K.; Cawthon, P.M.; Fink, H.A.; Taylor, B.C.; Cauley, J.A.; Dam, T.-T.; Marshall, L.M.; Orwoll, E.S.; Cummings, S.R. Osteoporotic Fractures in Men Research Group A comparison of frailty indexes for the prediction of falls, disability, fractures, and mortality in older men. J. Am. Geriatr. Soc. 2009, 57, 492–498. [Google Scholar] [CrossRef] [PubMed]
- Fried, L.P.; Tangen, C.M.; Walston, J.; Newman, A.B.; Hirsch, C.; Gottdiener, J.; Seeman, T.; Tracy, R.; Kop, W.J.; Burke, G.; et al. Cardiovascular Health Study Collaborative Research Group Frailty in older adults: Evidence for a phenotype. J. Gerontol. A Biol. Sci. Med. Sci. 2001, 56, M146–M156. [Google Scholar] [CrossRef] [PubMed]
- Rockwood, M.R.; MacDonald, E.; Sutton, E.; Rockwood, K.; Baron, M. Canadian Scleroderma Research Group Frailty index to measure health status in people with systemic sclerosis. J. Rheumatol. 2014, 41, 698–705. [Google Scholar] [CrossRef] [PubMed]
- Chamberlain, A.M.; Finney Rutten, L.J.; Manemann, S.M.; Yawn, B.P.; Jacobson, D.J.; Fan, C.; Grossardt, B.R.; Roger, V.L.; St Sauver, J.L. Frailty Trajectories in an Elderly Population-Based Cohort. J. Am. Geriatr. Soc. 2016, 64, 285–292. [Google Scholar] [CrossRef] [PubMed] [Green Version]
- Blodgett, J.; Theou, O.; Kirkland, S.; Andreou, P.; Rockwood, K. Frailty in relation to sedentary behaviours and moderate-vigorous intensity physical activity. Rev. Clin. Gerontol. 2014, 24, 239–254. [Google Scholar] [CrossRef]
- de Carvalho Mello, A.; Engstrom, E.M.; Alves, L.C. Health-related and socio-demographic factors associated with frailty in the elderly: A systematic literature review. Cad Saude Publica 2014, 30, 1143–1168. [Google Scholar] [CrossRef]
- Rogers, C.E.; Cordeiro, M.; Perryman, E. Maintenance of physical function in frail older adults. Nurs. Clin. N. Am. 2014, 49, 147–156. [Google Scholar] [CrossRef] [PubMed]
- Rogers, N.T.; Marshall, A.; Roberts, C.H.; Demakakos, P.; Steptoe, A.; Scholes, S. Physical activity and trajectories of frailty among older adults: Evidence from the English Longitudinal Study of Ageing. PLoS ONE 2017, 12, e0170878. [Google Scholar] [CrossRef] [PubMed]
- Tremblay, M.S.; Aubert, S.; Barnes, J.D.; Saunders, T.J.; Carson, V.; Latimer-Cheung, A.E.; Chastin, S.F.M.; Altenburg, T.M.; Chinapaw, M.J.M. Sedentary Behavior Research Network (SBRN)—Terminology Consensus Project process and outcome. Int. J. Behav. Nutr. Phys. Act. 2017, 14, 75. [Google Scholar] [CrossRef] [PubMed]
- Leung, P.-M.; Ejupi, A.; van Schooten, K.S.; Aziz, O.; Feldman, F.; Mackey, D.C.; Ashe, M.C.; Robinovitch, S.N. Association between Sedentary Behaviour and Physical, Cognitive, and Psychosocial Status among Older Adults in Assisted Living. Biomed. Res. Int. 2017, 2017, 9160504. [Google Scholar] [CrossRef] [PubMed]
- Blodgett, J.; Theou, O.; Kirkland, S.; Andreou, P.; Rockwood, K. The association between sedentary behaviour, moderate-vigorous physical activity and frailty in NHANES cohorts. Maturitas 2015, 80, 187–191. [Google Scholar] [CrossRef] [PubMed]
- Katzmarzyk, P.T.; Church, T.S.; Craig, C.L.; Bouchard, C. Sitting time and mortality from all causes, cardiovascular disease, and cancer. Med. Sci. Sports Exerc. 2009, 41, 998–1005. [Google Scholar] [CrossRef] [PubMed]
- Song, J.; Lindquist, L.A.; Chang, R.W.; Semanik, P.A.; Ehrlich-Jones, L.S.; Lee, J.; Sohn, M.-W.; Dunlop, D.D. Sedentary Behavior as a Risk Factor for Physical Frailty Independent of Moderate Activity: Results from the Osteoarthritis Initiative. Am. J. Public Health 2015, 105, 1439–1445. [Google Scholar] [CrossRef] [PubMed]
- Cassou, A.C.N.; Fermino, R.; Rodriguez Añez, C.R.; Santos, M.S.; Domingues, M.R.; Reis, R.S. Barriers to physical activity among Brazilian elderly women from different socioeconomic status: A focus-group study. J. Phys. Act. Health 2011, 8, 126–132. [Google Scholar] [CrossRef] [PubMed]
- Zanchetta, L.M.; de Azevedo Barros, M.B.; César, C.L.G.; Carandina, L.; Goldbaum, M.; Alves, M.C.G.P. Physical inactivity and associated factors in adults, São Paulo, Brazil. Rev. Bras. Epidemiol. 2010, 13, 387–399. [Google Scholar] [CrossRef] [PubMed]
- Colley, R.C.; Garriguet, D.; Janssen, I.; Craig, C.L.; Clarke, J.; Tremblay, M.S. Physical activity of Canadian adults: Accelerometer results from the 2007 to 2009 Canadian Health Measures Survey. Health Rep. 2011, 22, 7–14. [Google Scholar] [PubMed]
- Dogra, S.; Stathokostas, L. Correlates of extended sitting time in older adults: An exploratory cross-sectional analysis of the Canadian Community Health Survey Healthy Aging Cycle. Int. J. Public Health 2014, 59, 983–991. [Google Scholar] [CrossRef] [PubMed]
- Manini, T.M.; Carr, L.J.; King, A.C.; Marshall, S.; Robinson, T.N.; Rejeski, W.J. Interventions to reduce sedentary behavior. Med. Sci. Sports Exerc. 2015, 47, 1306–1310. [Google Scholar] [CrossRef] [PubMed]
- Population Census. Brazilian Institute of Geography and Statistics. 2010. Available online: http://www.cidades.ibge.gov.br/xtras/perfil.php?lang=&codmun=290080&search=bahia|alcobaca (accessed on 15 November 2014).
- Brucki, S.M.D.; Nitrini, R.; Caramelli, P.; Bertolucci, P.H.F.; Okamoto, I.H. Suggestions for utilization of the mini-mental state examination in Brazil. Arq. Neuro Psiquiatr. 2003, 61, 777–781. [Google Scholar] [CrossRef]
- Paradela, E.M.P.; Lourenço, R.A.; Veras, R.P. Validation of geriatric depression scale in a general outpatient clinic. Rev. Saúde Publ. 2005, 39, 918–923. [Google Scholar] [CrossRef]
- Benedetti, T.R.B.; de Cesaro Antunes, P.; Rodriguez-Añez, C.R.; Mazo, G.Z.; Petroski, É.L. Reproducibility and validity of the International Physical Activity Questionnaire (IPAQ) in elderly men. Rev. Bras. Med. Esporte 2007, 13, 11–16. [Google Scholar] [CrossRef]
- Benedetti, T.B.; Mazo, G.Z.; Barros, M.V.G. Application of the International Physical Activity Questionnaire (IPAQ) for evaluation of elderly women: Concurrent validity and test-retest reproducibility. Rev Bras Ciênc e Mov. 2004, 12, 25–34. [Google Scholar]
- WHO World Health Organization. Global Recommendations on Physical Activity Forhealth; World Health Organization: Geneva, Switzerland, 2010; Available online: http://apps.who.int/iris/bitstream/10665/44399/1/9789241599979_eng.pdf (accessed on 4 December 2017).
- Rosenberg, D.E.; Bull, F.C.; Marshall, A.L.; Sallis, J.F.; Bauman, A.E. Assessment of sedentary behavior with the International Physical Activity Questionnaire. J. Phys. Act. Health 2008, 5 (Suppl. 1), S30–S44. [Google Scholar] [CrossRef] [PubMed]
- Lino, V.T.S.; Pereira, S.R.M.; Camacho, L.A.B.; Filho, R.; Telles, S.; Buksman, S. Cross-cultural adaptation of the Independence in Activities of Daily Living Index (Katz Index). Cad. SaúdePública 2008, 24, 103–112. [Google Scholar] [CrossRef]
- Dos Santos, R.L.; Virtuoso-Júnior, J.S. Reliability of the Brazilian version of the Scale of Instrumental Activities of Daily Living. In RBPS; 2008; Volume 24, pp. 290–296. [Google Scholar] [CrossRef]
- de Rezende, L.F.M.; Rey-López, J.P.; Matsudo, V.K.R.; do Carmo Luiz, O. Sedentary behavior and health outcomes among older adults: A systematic review. BMC Public Health 2014, 14, 333. [Google Scholar] [CrossRef] [PubMed] [Green Version]
- Hamilton, M.T.; Hamilton, D.G.; Zderic, T.W. Role of low energy expenditure and sitting in obesity, metabolic syndrome, type 2 diabetes, and cardiovascular disease. Diabetes 2007, 56, 2655–2667. [Google Scholar] [CrossRef] [PubMed]
- Owen, N.; Bauman, A.; Brown, W. Too much sitting: A novel and important predictor of chronic disease risk? Br. J. Sports Med. 2009, 43, 81–83. [Google Scholar] [CrossRef] [PubMed]
- van der Ploeg, H.P.; Chey, T.; Korda, R.J.; Banks, E.; Bauman, A. Sitting time and all-cause mortality risk in 222 497 Australian adults. Arch. Intern. Med. 2012, 172, 494–500. [Google Scholar] [CrossRef] [PubMed]
- Zazzetta, M.S.; Gomes, G.A.O.; Orlandi, F.S.; Gratão, A.C.M.; Vasilceac, F.A.; Gramani-Say, K.; Ponti, M.A.; Castro, P.C.; Pavarini, S.C.I.; Menezes, A.L.C.; et al. Identifying Frailty Levels and Associated Factors in a Population Living in the Context of Poverty and Social Vulnerability. J. Frailty Aging 2017, 6, 29–32. [Google Scholar] [CrossRef] [PubMed]
- Carlos, F.; Clark, P.; Galindo-Suárez, R.M.; Chico-Barba, L.G. Health care costs of osteopenia, osteoporosis, and fragility fractures in Mexico. Arch. Osteoporos. 2013, 8, 125. [Google Scholar] [CrossRef] [PubMed]
- da Silva Coqueiro, R.; de Queiroz, B.M.; Oliveira, D.S.; das Merces, M.C.; Oliveira Carneiro, J.A.; Pereira, R.; Fernandes, M.H. Cross-sectional relationships between sedentary behavior and frailty in older adults. J. Sports Med. Phys. Fit. 2017, 57, 825–830. [Google Scholar] [CrossRef]
- Virtuoso Júnior, J.S.; Roza, L.B.; Tribess, S.; Meneguci, J.; Mendes, E.L.; Pegorari, M.S.; Dias, F.A.; Tavares, D.M.S.; Sasaki, J.E. Time Spent Sitting Is Associated with Changes in Biomarkers of Frailty in Hospitalized Older Adults: A Cross Sectional Study. Front. Physiol. 2017, 8. [Google Scholar] [CrossRef] [PubMed] [Green Version]
- Theou, O.; Blodgett, J.M.; Godin, J.; Rockwood, K. Association between sedentary time and mortality across levels of frailty. CMAJ 2017, 189, E1056–E1064. [Google Scholar] [CrossRef] [PubMed] [Green Version]
- Meneguci, J.; Santos, D.A.T.; Silva, R.B.; Santos, R.G.; Sasaki, J.E.; Tribess, S.; Damião, R.; Júnior, J.S.V. Sedentary behavior: Concept, physiological implications and the assessment procedures. Motricidade 2015, 11, 160–174. [Google Scholar] [CrossRef]
- Noël-Miller, C.M. Partner Caregiving in Older Cohabiting Couples. J. Gerontol. B Psychol. Sci. Soc. Sci. 2011, 66B, 341–353. [Google Scholar] [CrossRef] [PubMed]
- Chastin, S.F.M.; Ferriolli, E.; Stephens, N.A.; Fearon, K.C.H.; Greig, C. Relationship between sedentary behaviour, physical activity, muscle quality and body composition in healthy older adults. Age Ageing 2012, 41, 111–114. [Google Scholar] [CrossRef] [PubMed]


| Variable | Non-Frail% (n) | Frail% (n) | χ2 (p) |
|---|---|---|---|
| Age group (years) | |||
| 60–69 | 62.6 (n = 223) | 30.7 (n = 31) | * 47.87 |
| 70–79 | 28.1 (n = 100) | 34.7 (n = 35) | (<0.001) |
| ≥80 | 9.3 (n = 33) | 34.7 (n = 35) | |
| Sex | |||
| Male | 39.9 (n = 142) | 29.7 (n = 30) | * 3.47 |
| Female | 60.1 (n = 214) | 70.3 (n = 71) | (0.062) |
| Years of schooling | |||
| >4 years | 35.5 (n = 126) | 19.0 (n = 19) | * 9.77 |
| ≤4 years | 64.5 (n = 229) | 81.0 (n = 81) | (0.002) |
| Home arrangement | |||
| Lives alone | 16 (n = 57) | 16.8 (n = 17) | *0.039 |
| Accompanied | 84 (n = 299) | 83.2 (n = 84) | (0.843) |
| Perception of health | |||
| Positive | 38.8 (n = 138) | 29.7 (n = 30) | * 2.77 |
| Negative | 61.2 (n = 218) | 70.3 (n = 71) | (0.096) |
| BADL | |||
| Independent | 82.6 (n = 294) | 64.4 (n = 65) | * 15.51 |
| Dependent | 17.4 (n = 62) | 35.6 (n = 36) | (<0.001) |
| IADL | |||
| Independent | 34.3 (n = 122) | 11.9 (n = 12) | * 19.03 |
| Dependent | 65.7 (n = 234) | 88.1 (n = 89) | (<0.001) |
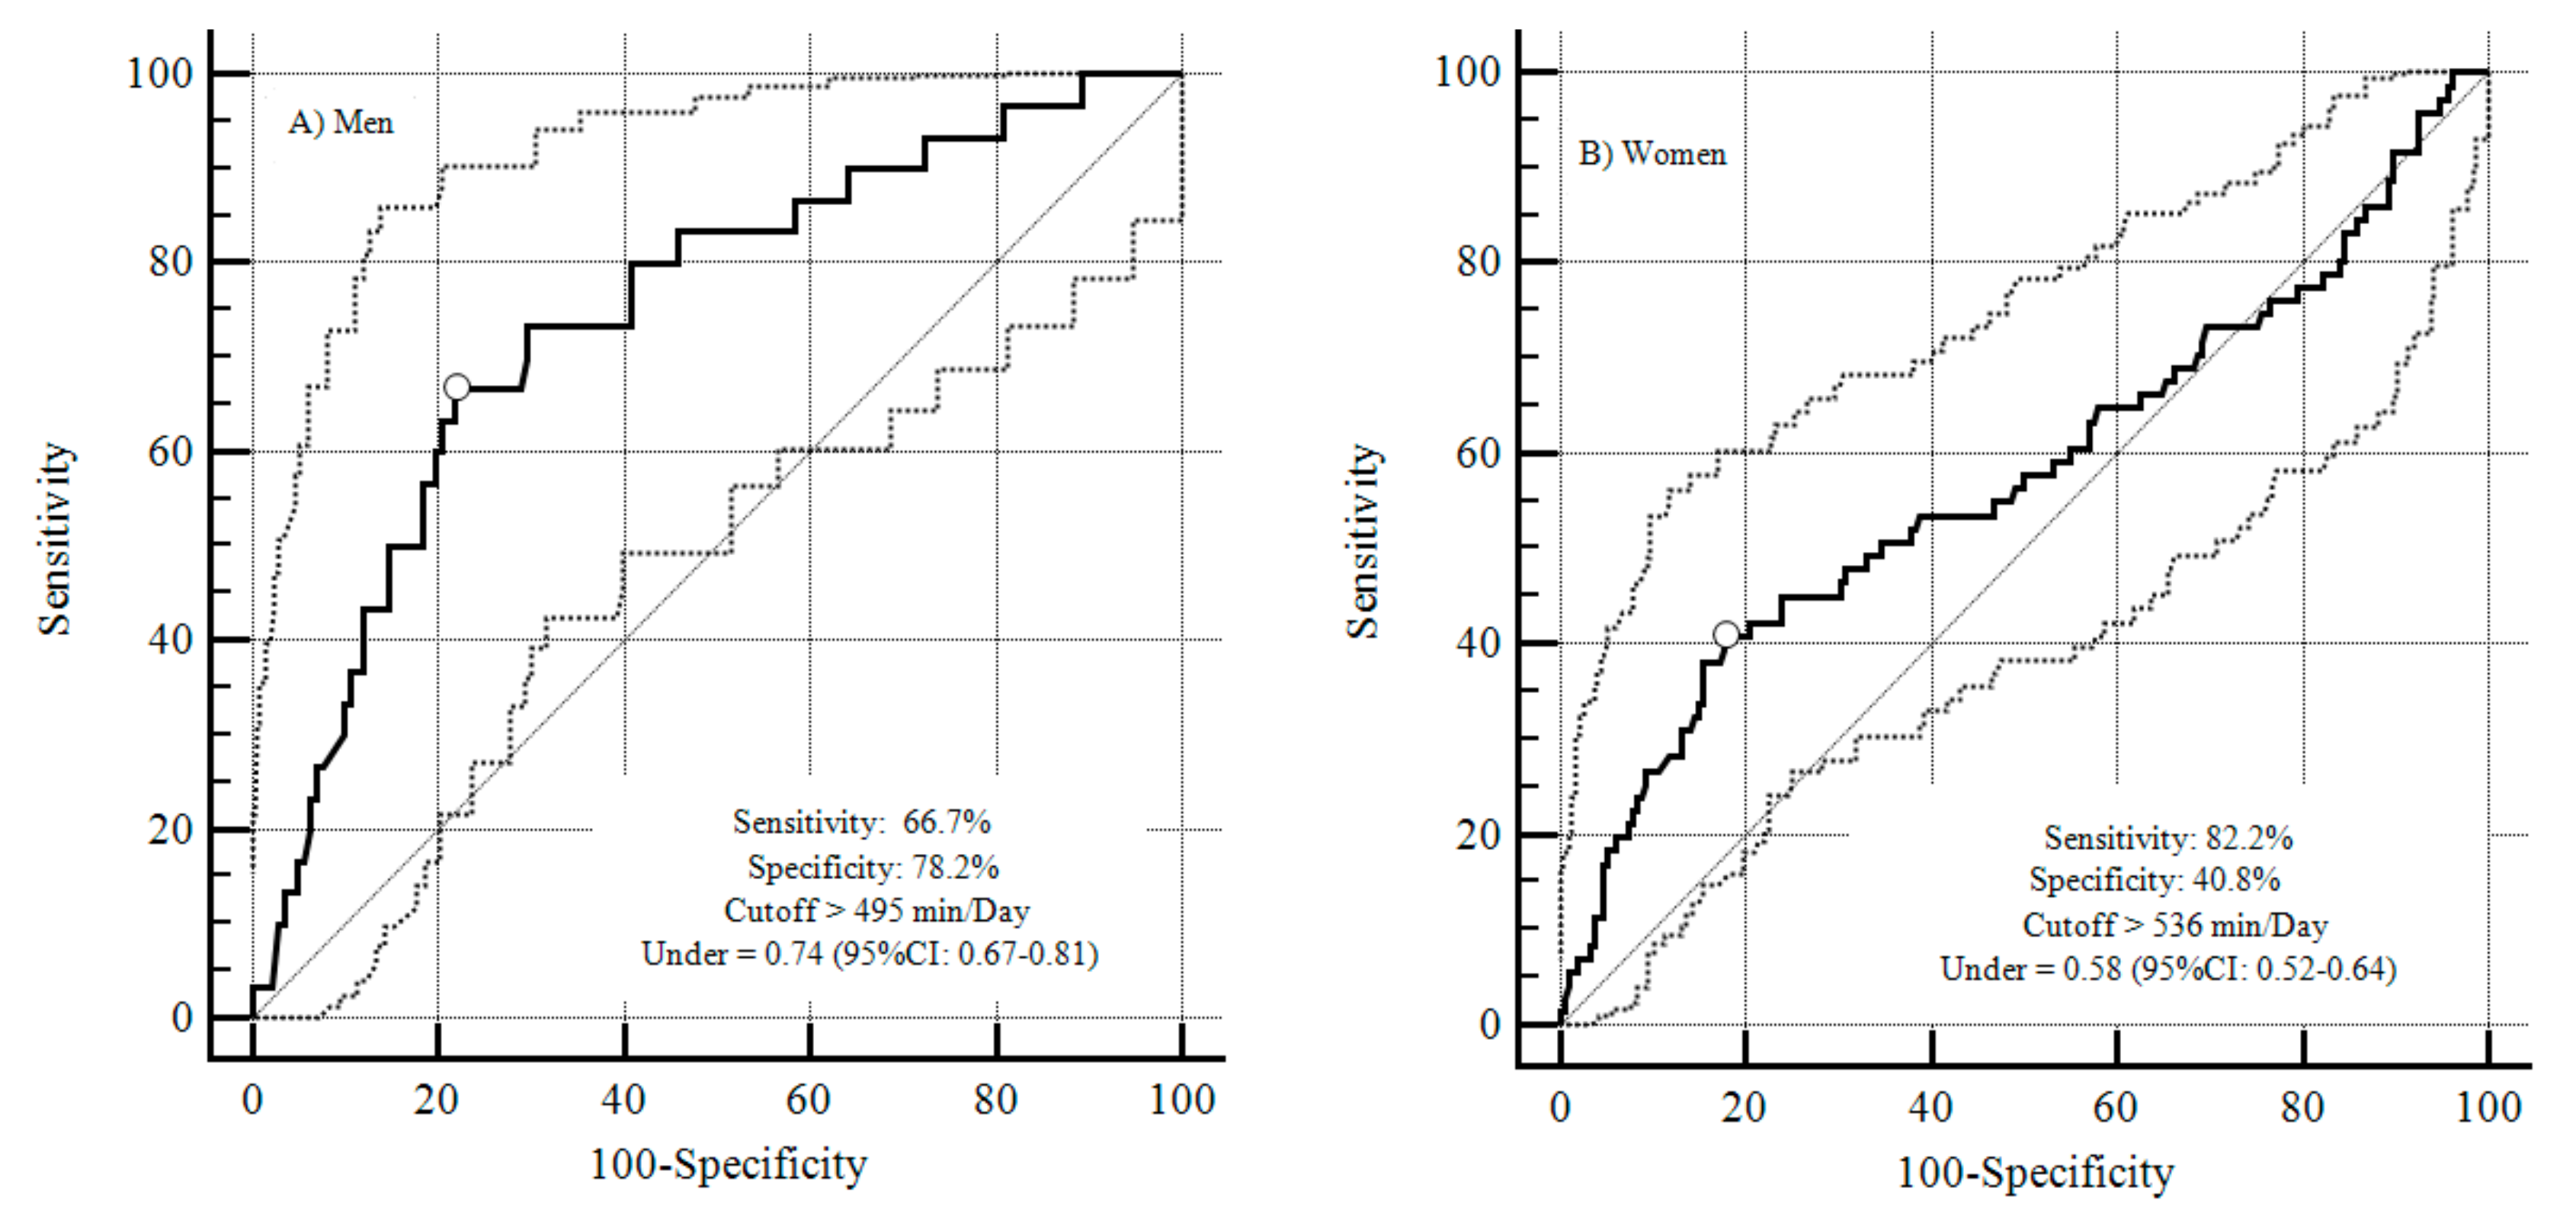
| Area under the ROC Curve | 95% CI | Sensitivity | Specificity | |
|---|---|---|---|---|
| Men | 0.74 | 0.67–0.81 | 66.7 | 78.2 |
| Women | 0.58 | 0.52–0.64 | 82.2 | 40.8 |
| Variable | Frailty | |||
|---|---|---|---|---|
| CrudeAnalysis | Adjusted Analysis | |||
| OR (95% CI) | p-Value | OR (95%CI) | p-Value | |
| Gender | 0.063 | 0.021 | ||
| Male | 1 | 1 | ||
| Female | 1.57 (0.97–2.53) | 1.91 (1.10–3.31) | ||
| Age group (years) | <0.001 | <0.001 | ||
| 60–69 | 1 | 1 | ||
| 70–79 | 2.52 (1.47–4.31) | 2.17 (1.22–3.84) | ||
| ≥80 | 7.63 (4.16–13.99) | 5.57 (2.87–10.80) | ||
| Years of schooling | 0.002 | 0.120 | ||
| >4 years | 1 | 1 | ||
| ≤4 years | 2.35 (1.36–4.04) | 1.64 (0.88–3.07) | ||
| Home arrangement | 0.843 | - | ||
| Lives alone | 1 | - | ||
| Accompanied | 0.94 (0.52–1.70) | - | ||
| Perception of health | 0.097 | 0.920 | ||
| Positive | 1 | 1 | ||
| Negative | 1.50 (0.93–2.41) | 1.03 (0.60–1.77) | ||
| BADL | <0.001 | 0.045 | ||
| Independent | 1 | 1 | ||
| Dependent | 2.62 (1.61–4.29) | 1.78 (1.01–3.13) | ||
| IADL | <0.001 | 0.169 | ||
| Independent | 1 | 1 | ||
| Dependent | 3.87 (2.04–7.34) | 1.67 (0.80–3.48) | ||
| Sedentary Behaviour (min/Day) | <0.001 | <0.001 | ||
| ≤495 for males and ≤536 for female | 1 | 1 | ||
| >495 for males and >536 for female | 3.85 (2.41–6.16) | 3.01 (1.78–5.10) | ||
© 2018 by the authors. Licensee MDPI, Basel, Switzerland. This article is an open access article distributed under the terms and conditions of the Creative Commons Attribution (CC BY) license (http://creativecommons.org/licenses/by/4.0/).
Share and Cite
Da Silva, V.D.; Tribess, S.; Meneguci, J.; Sasaki, J.E.; Santos, D.D.A.T.; Carneiro, J.A.O.; Virtuoso Júnior, J.S. Time Spent in Sedentary Behaviour as Discriminant Criterion for Frailty in Older Adults. Int. J. Environ. Res. Public Health 2018, 15, 1336. https://doi.org/10.3390/ijerph15071336
Da Silva VD, Tribess S, Meneguci J, Sasaki JE, Santos DDAT, Carneiro JAO, Virtuoso Júnior JS. Time Spent in Sedentary Behaviour as Discriminant Criterion for Frailty in Older Adults. International Journal of Environmental Research and Public Health. 2018; 15(7):1336. https://doi.org/10.3390/ijerph15071336
Chicago/Turabian StyleDa Silva, Venicius Dantas, Sheilla Tribess, Joilson Meneguci, Jeffer Eidi Sasaki, Douglas De Assis Teles Santos, José Ailton Oliveira Carneiro, and Jair Sindra Virtuoso Júnior. 2018. "Time Spent in Sedentary Behaviour as Discriminant Criterion for Frailty in Older Adults" International Journal of Environmental Research and Public Health 15, no. 7: 1336. https://doi.org/10.3390/ijerph15071336