
Association between Temperature Change and Outpatient Visits for Respiratory Tract Infections among Children in Guangzhou, China

Abstract
:1. Introduction
2. Material and Methods
2.1. Study Setting
2.2. Data Concerning Outpatient Visits for Children with Respiratory Tract Infections (RTIs)
2.3. Meteorological Data
2.4. Ethics Statement
2.5. Statistical Analyses
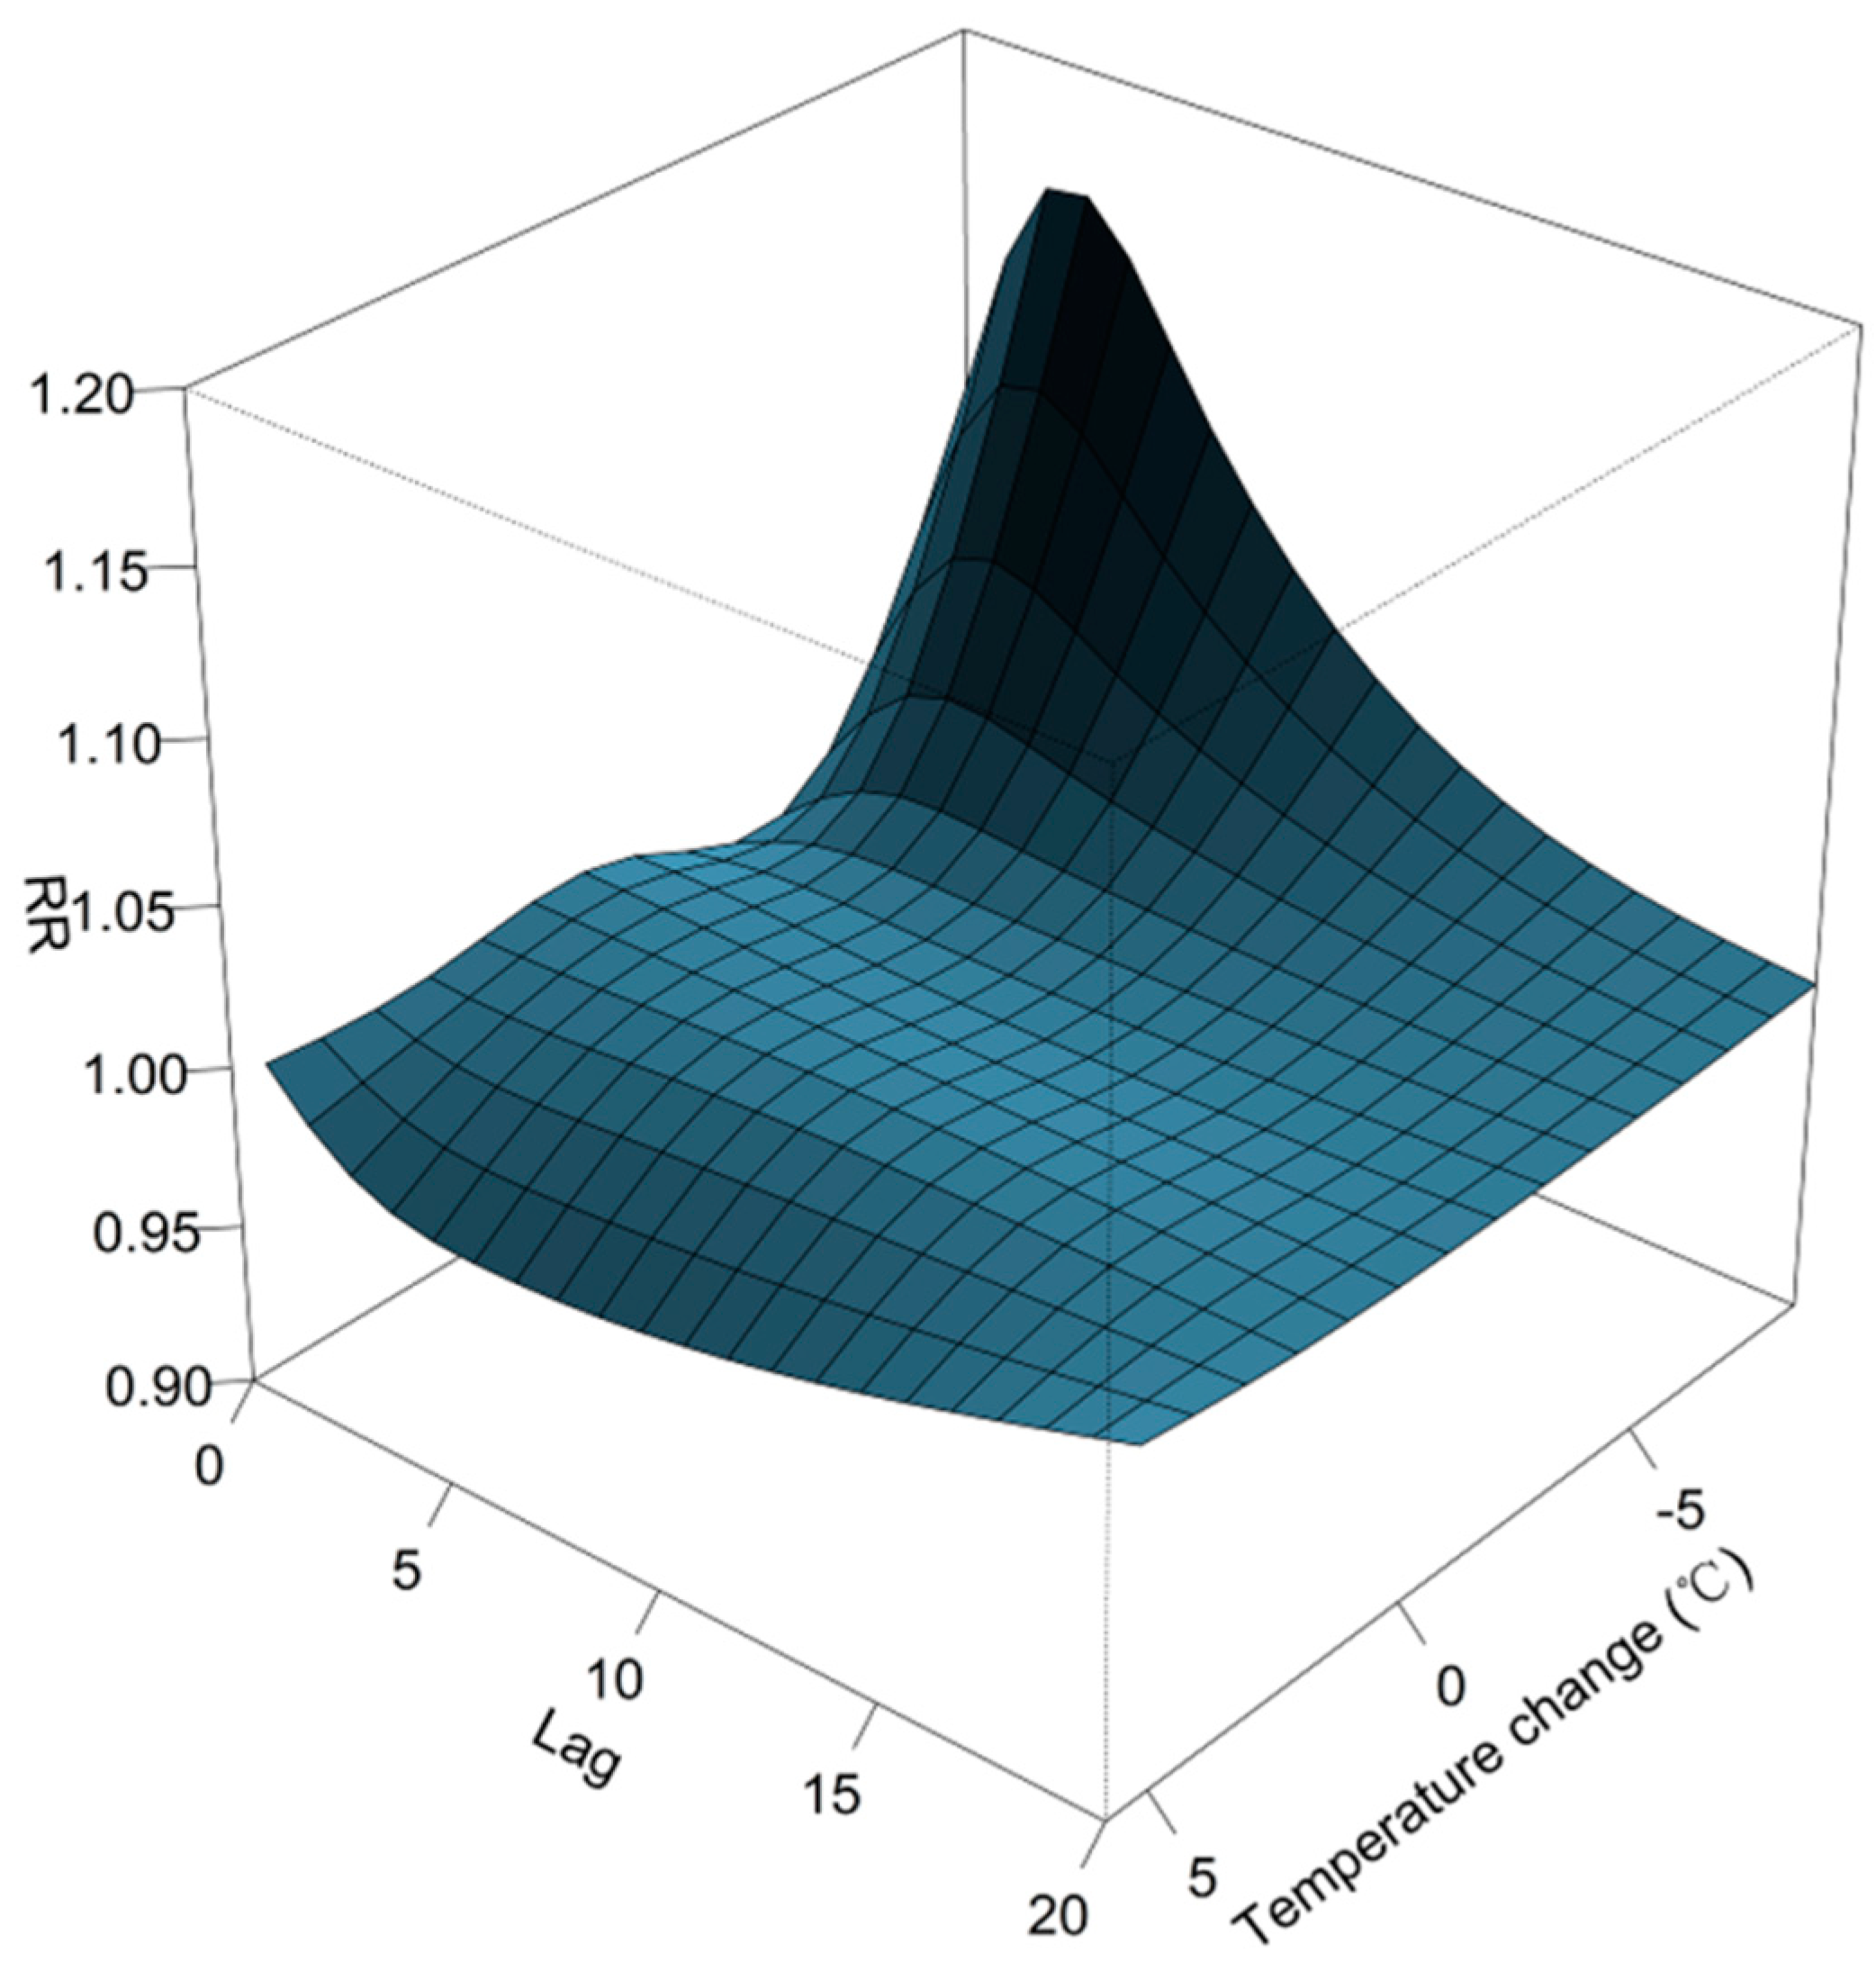
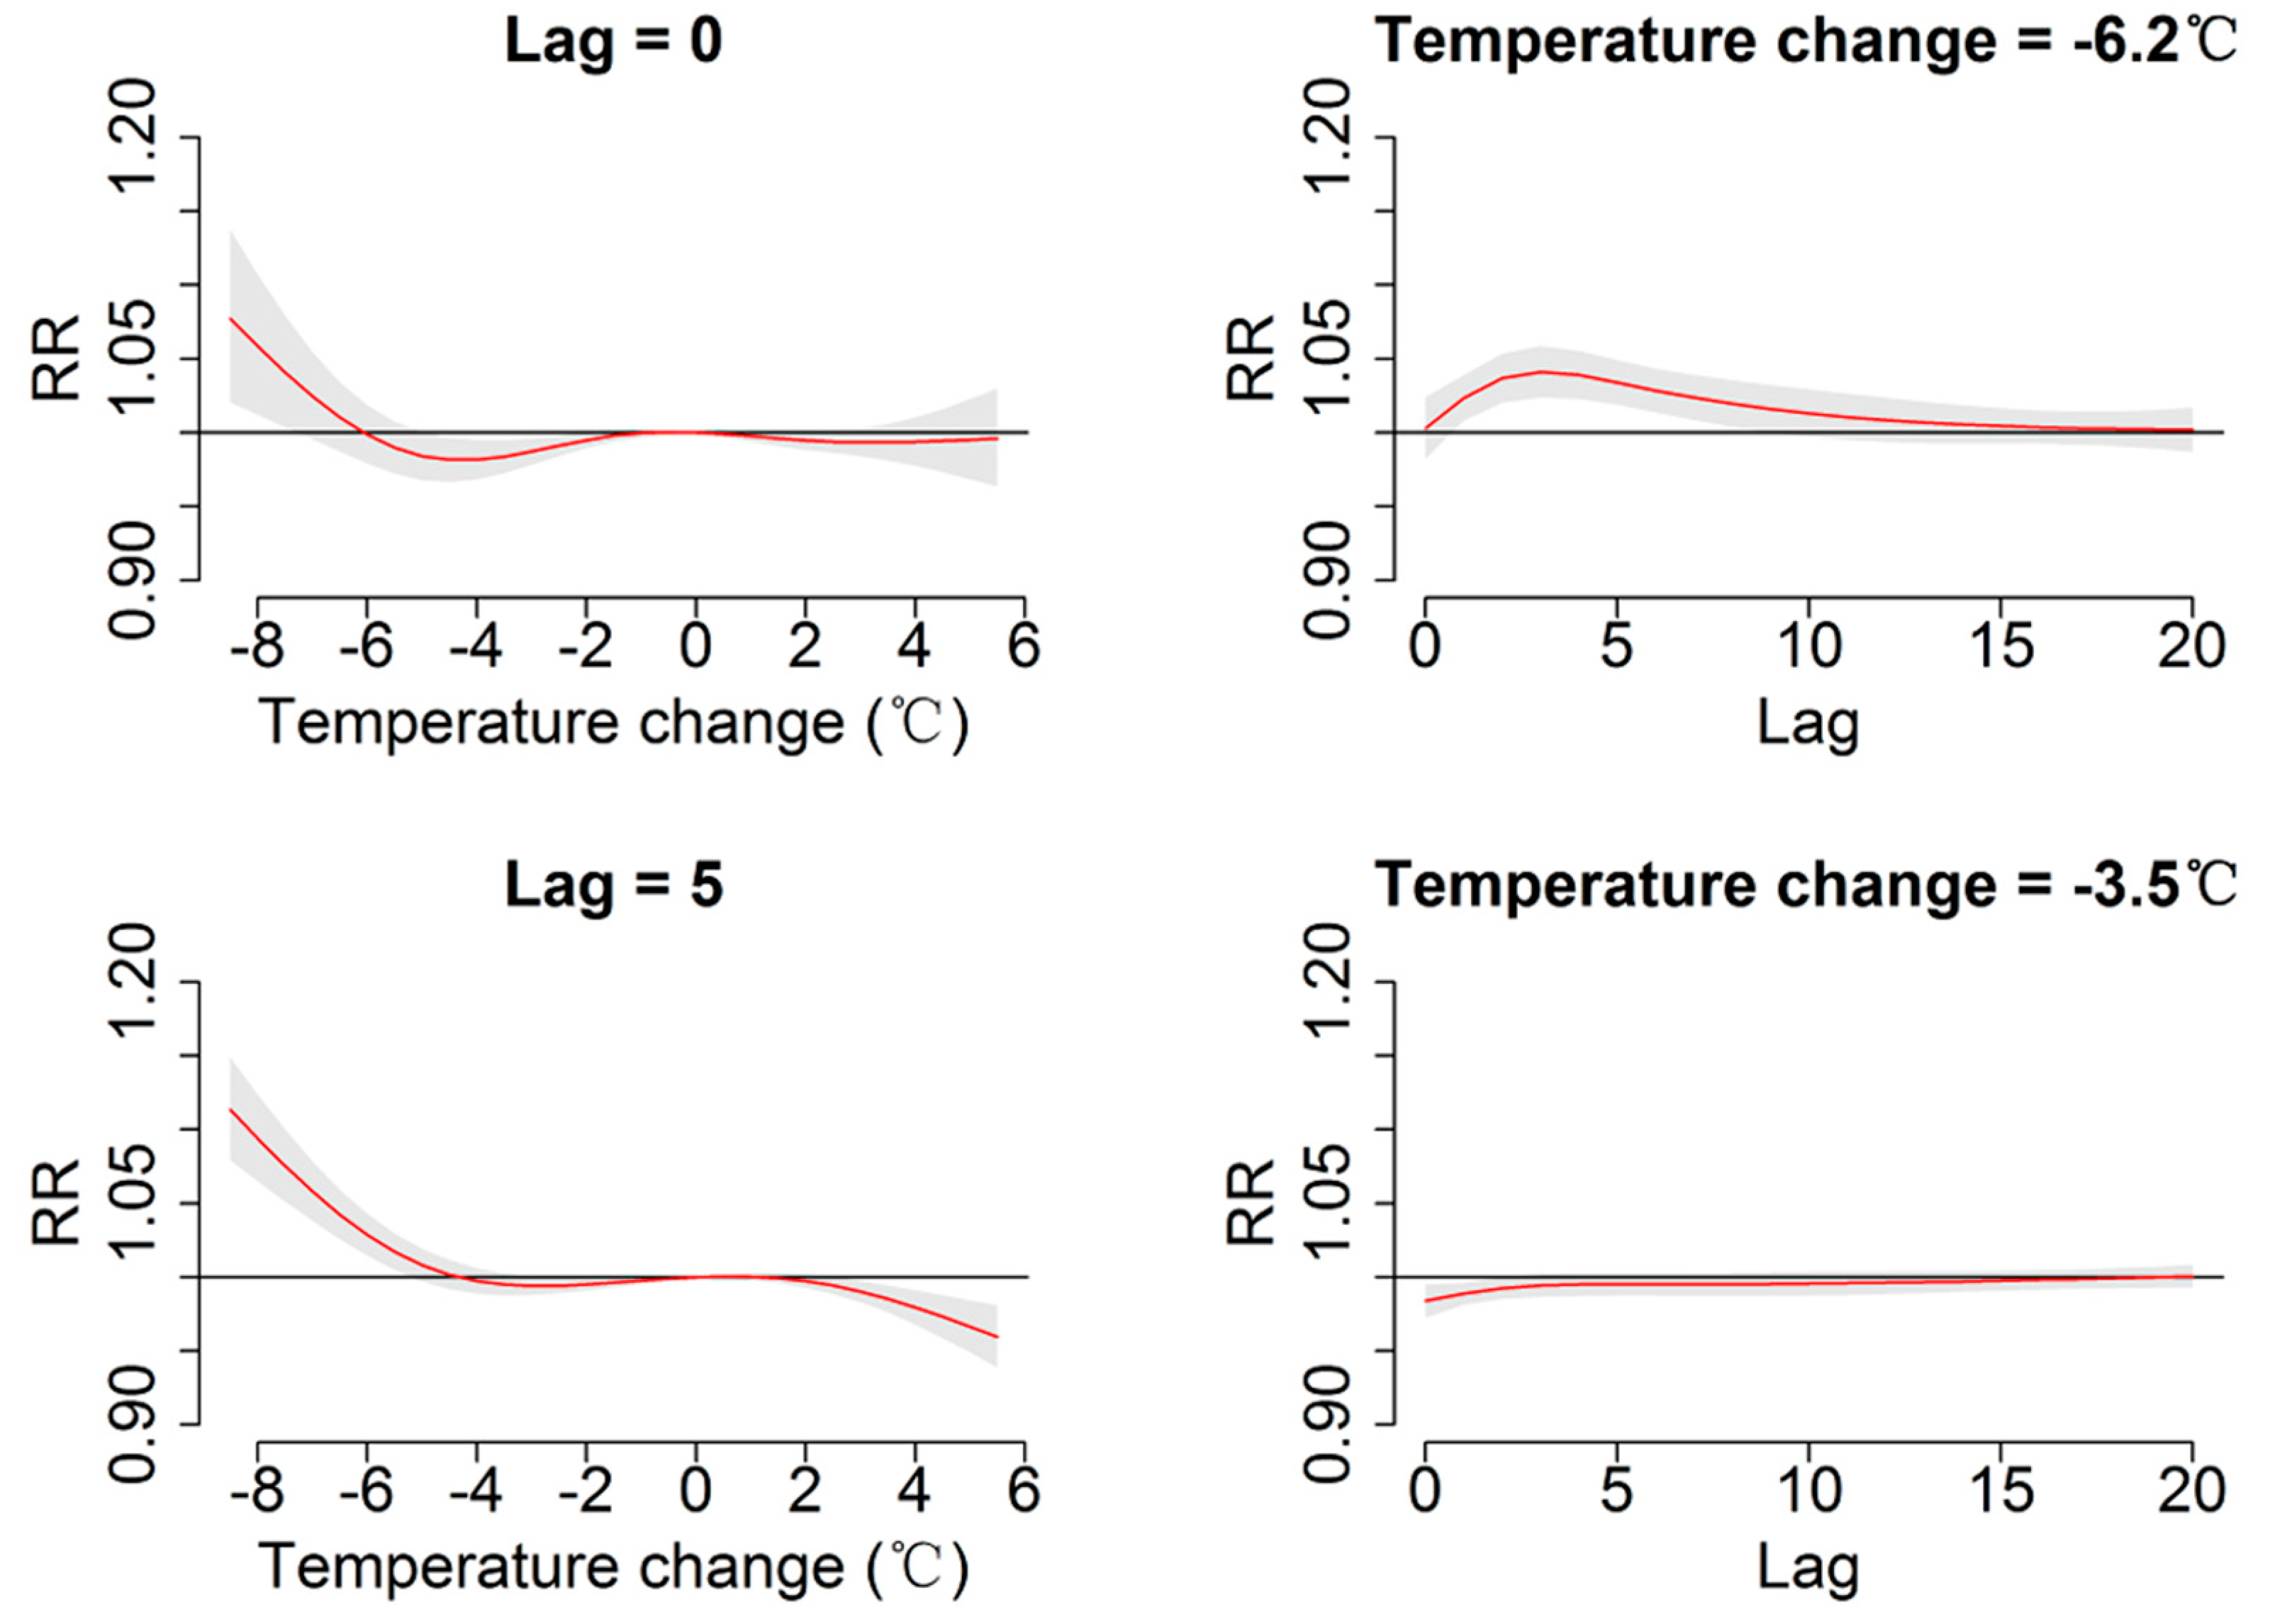
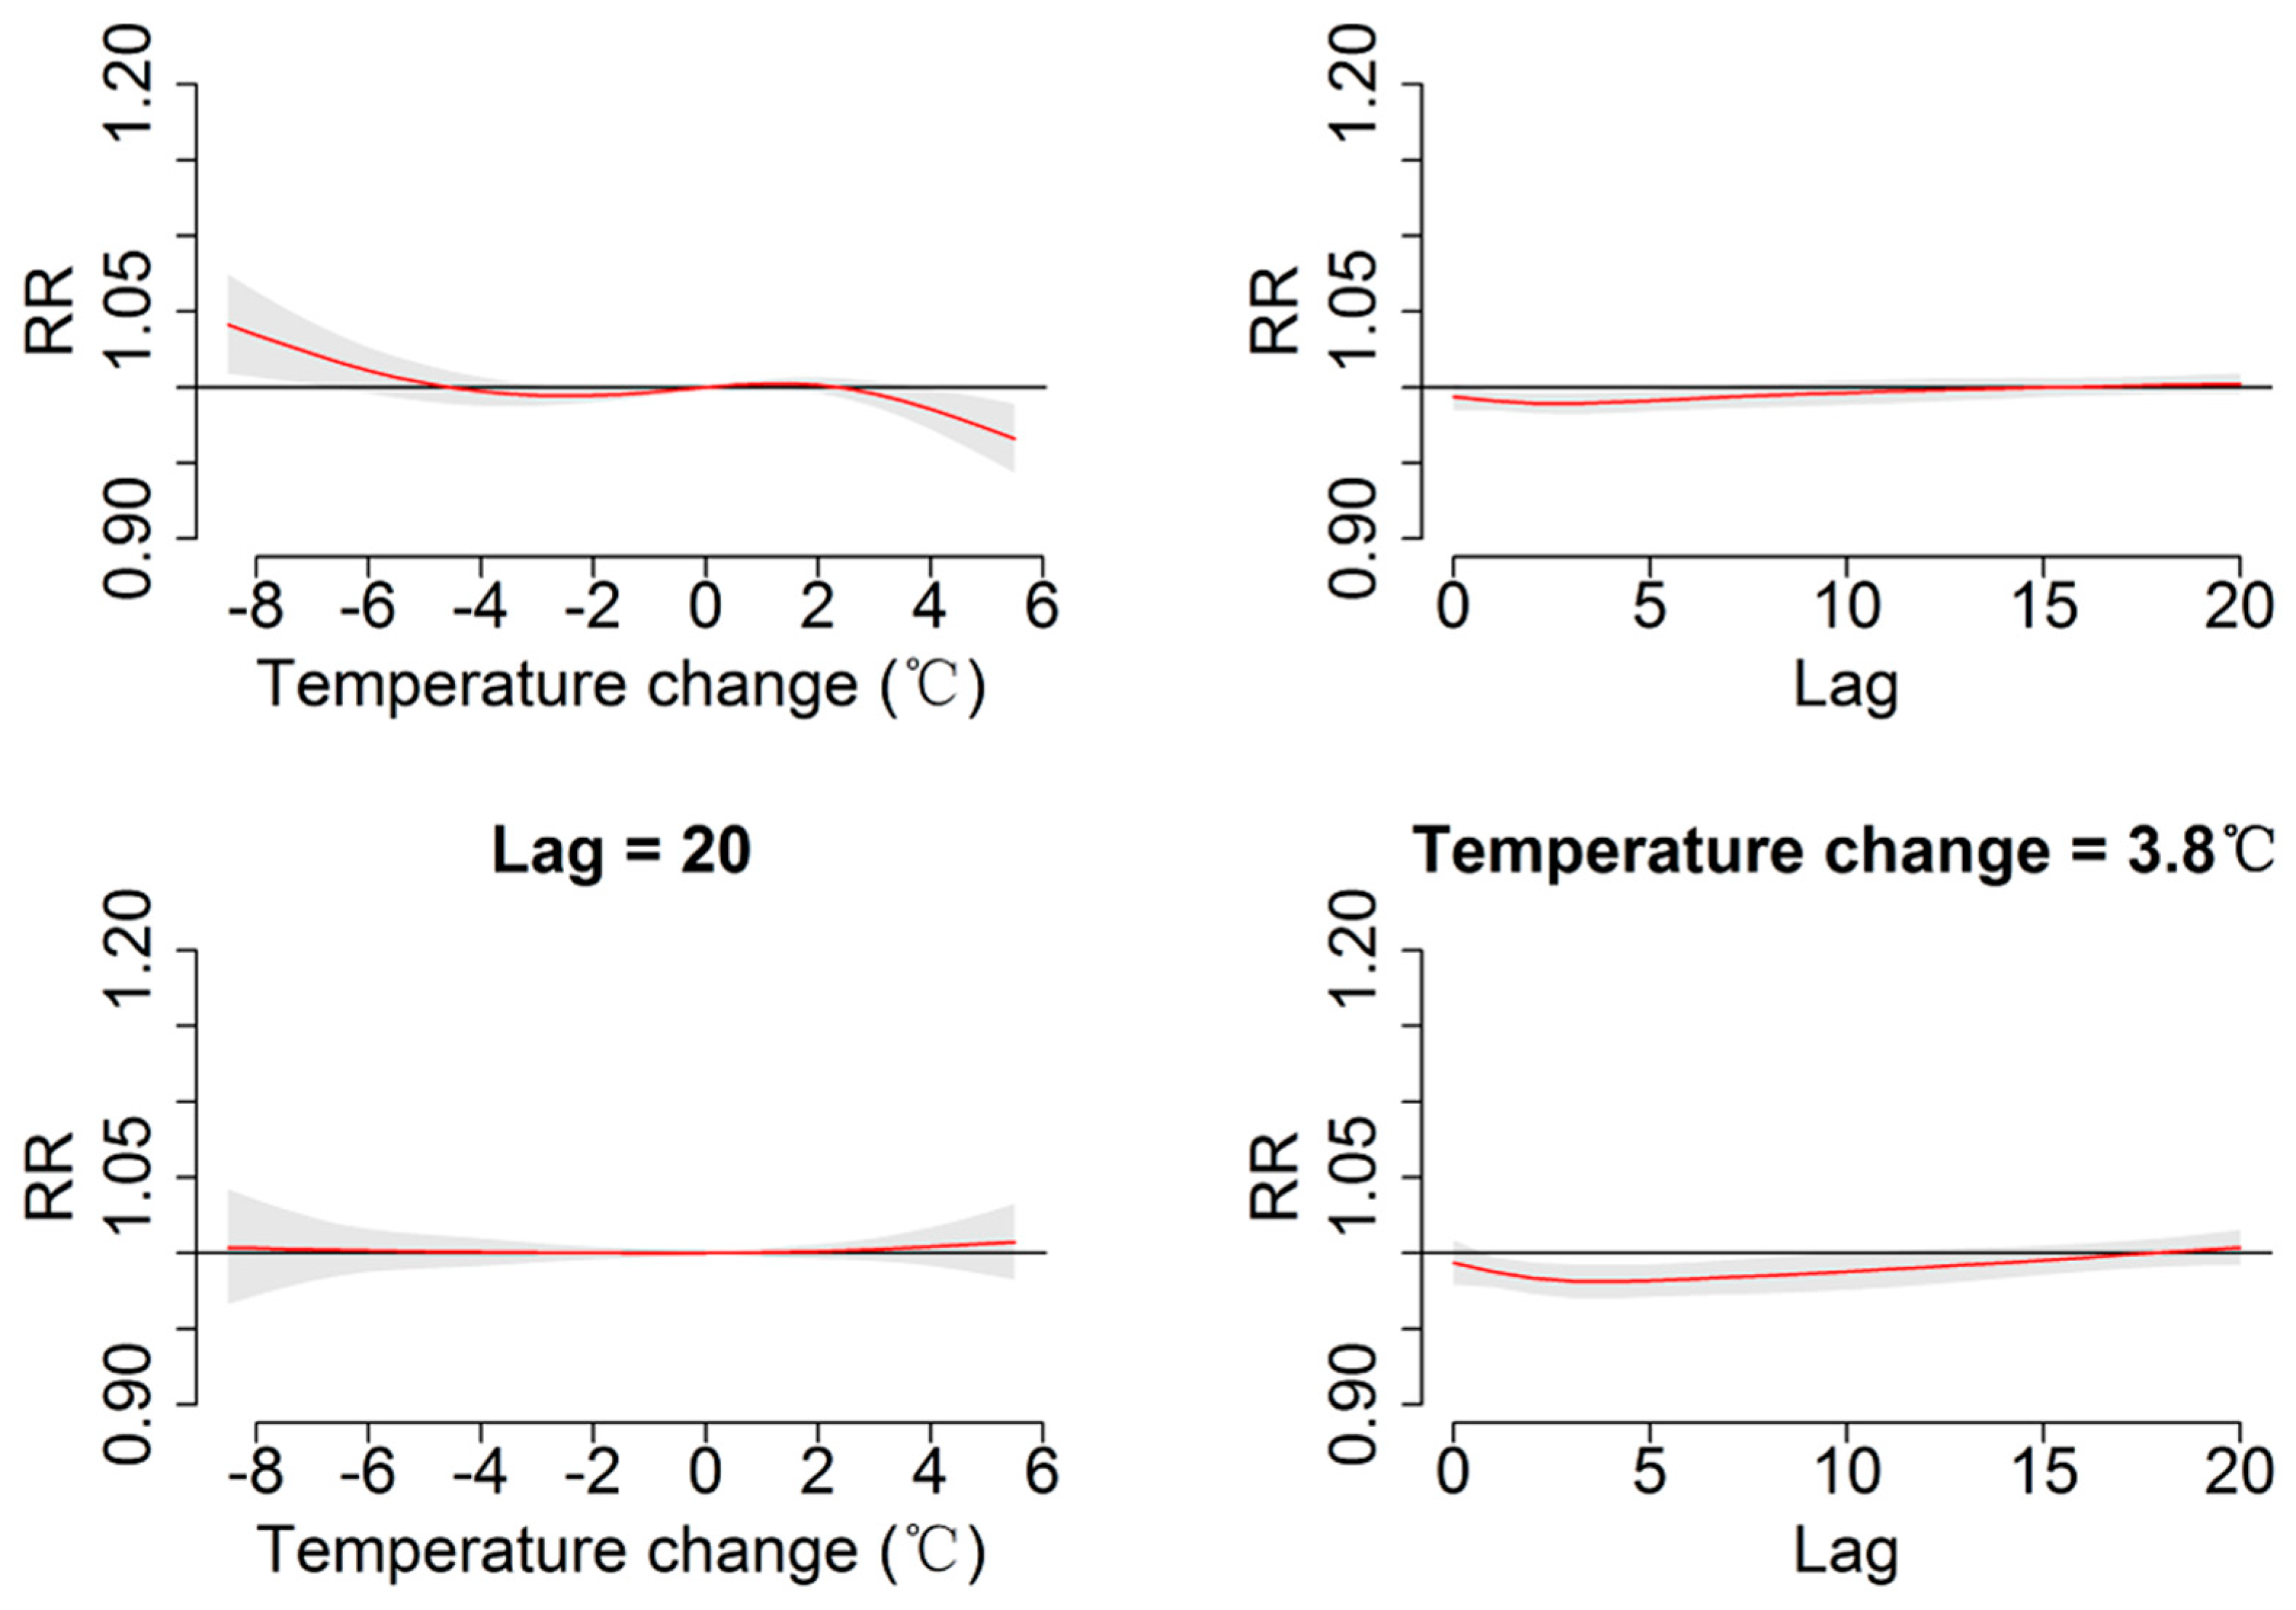
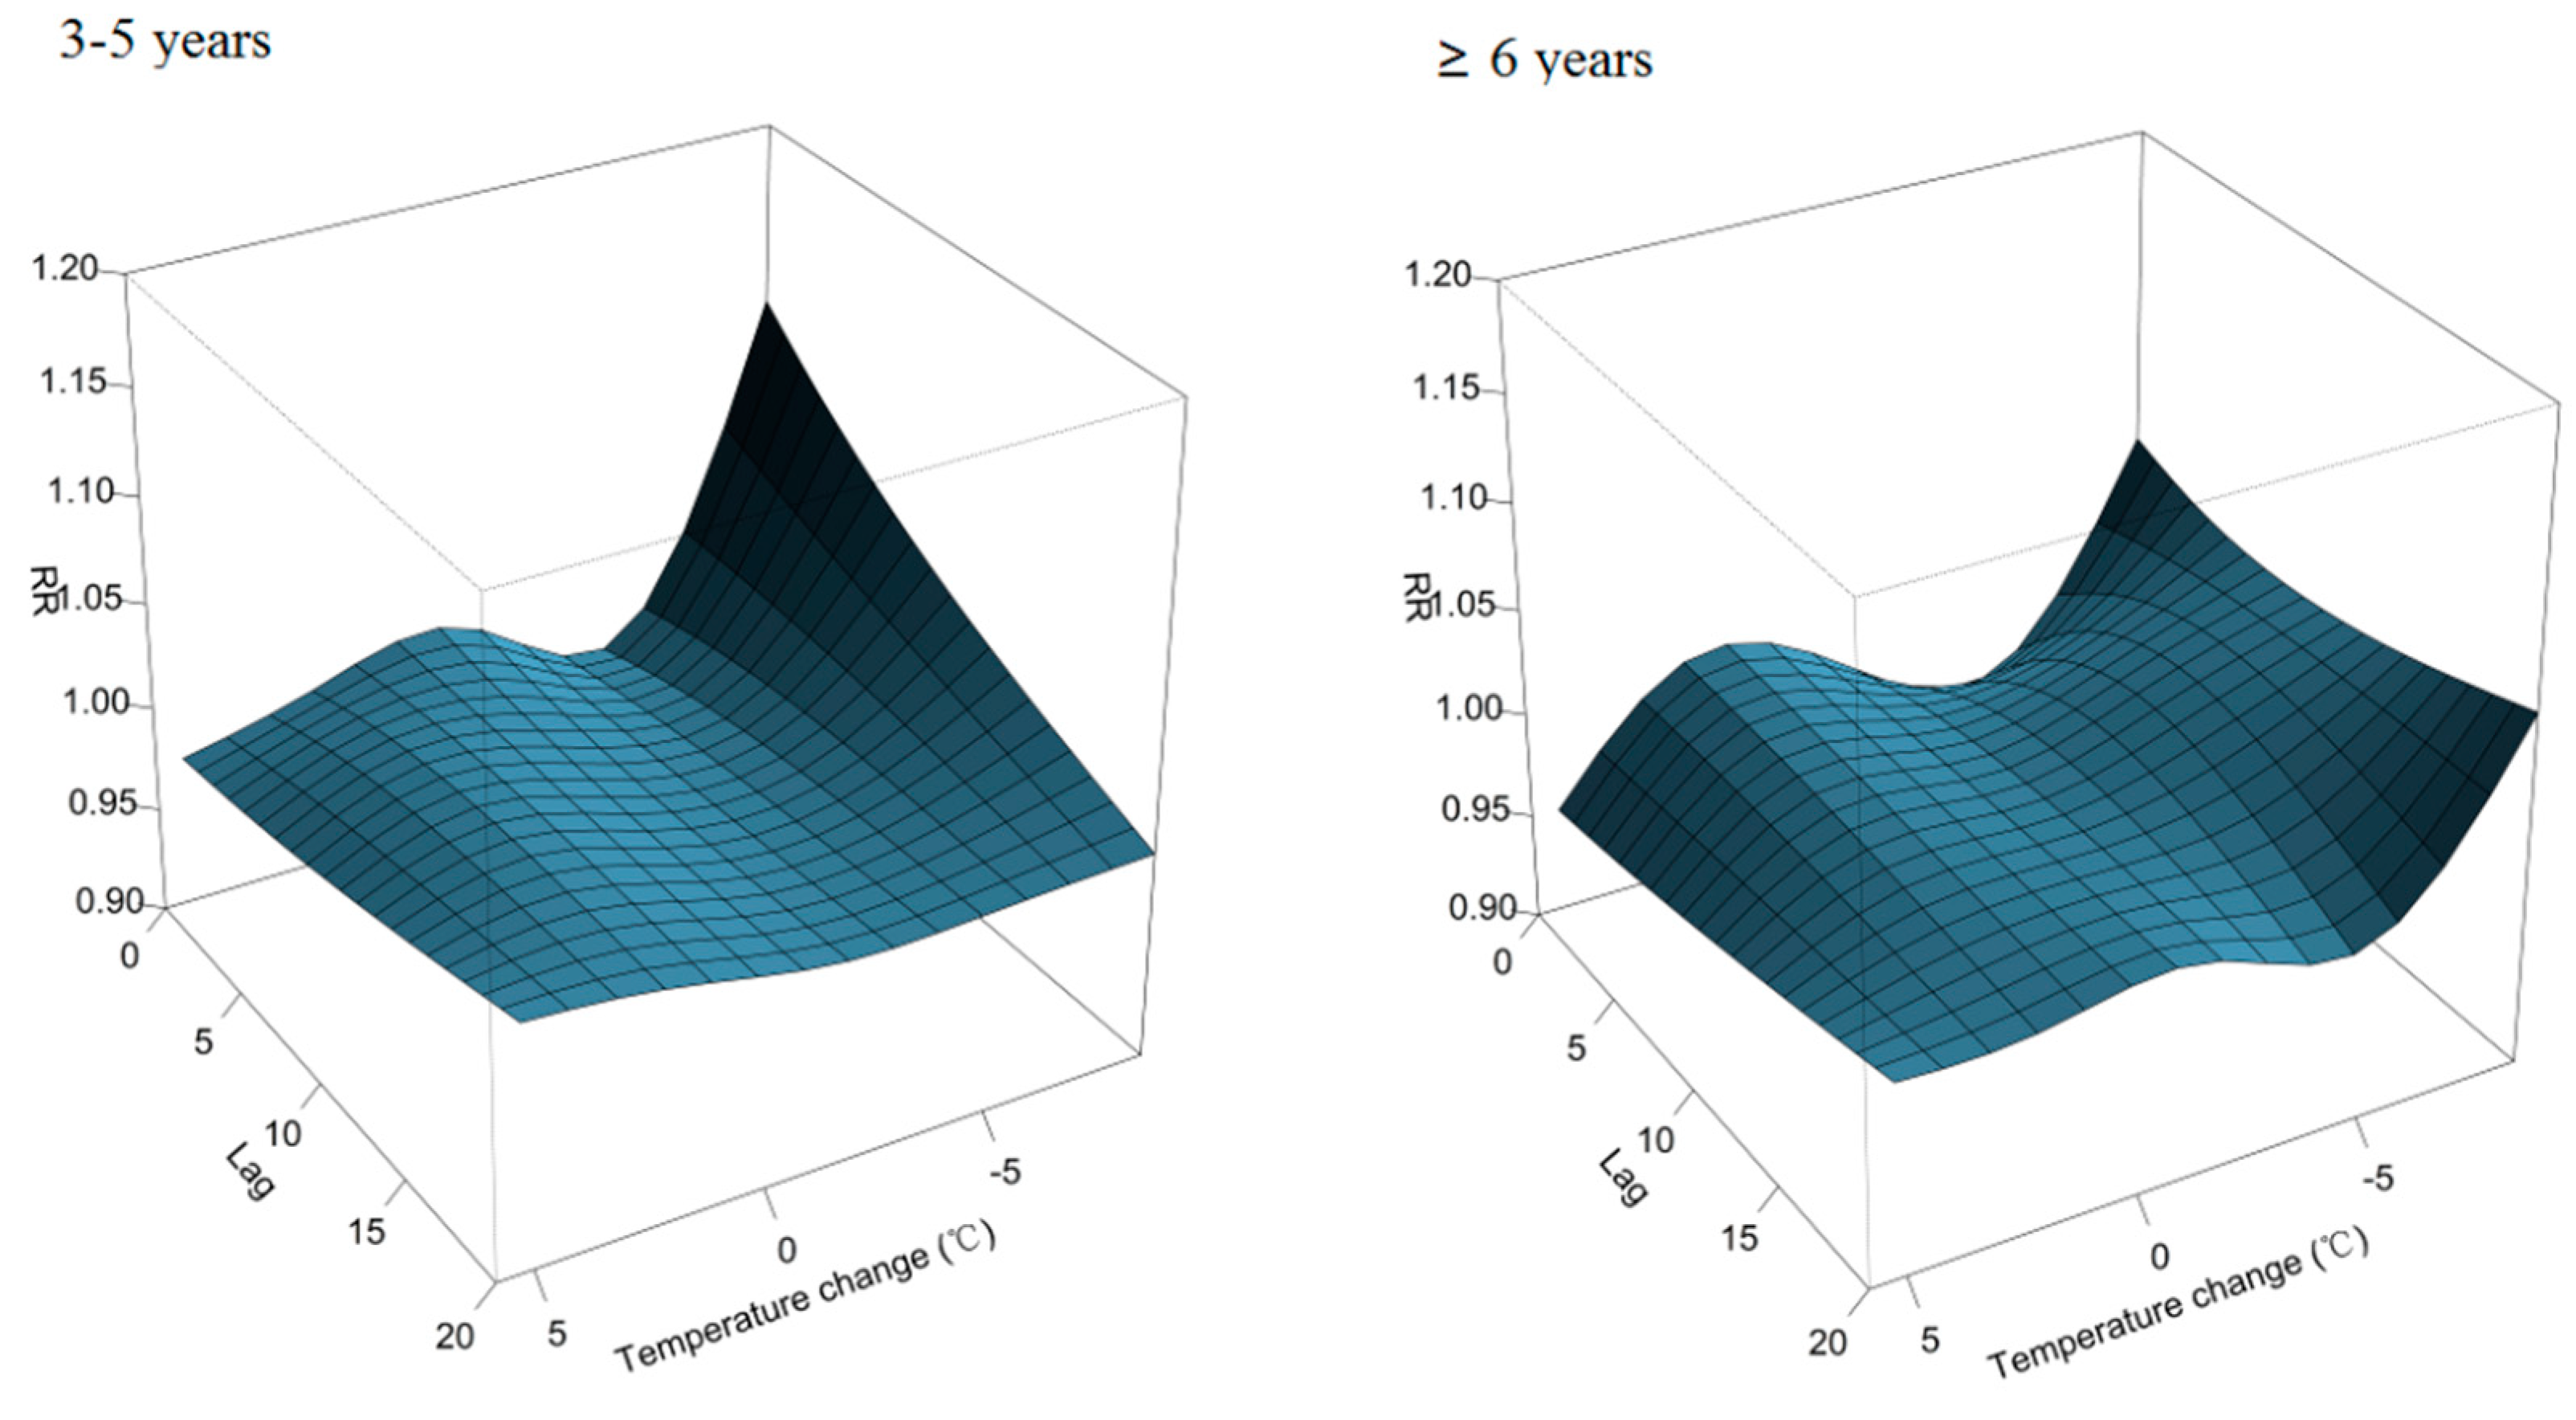
3. Results

| Variables | Mean ± SD | Minimum | P25 | Median | P75 | Maximum |
|---|---|---|---|---|---|---|
| Maximum temperature (°C) | 26.3 ± 6.5 | 7.2 | 21.9 | 27.7 | 31.5 | 36.8 |
| Minimum temperature (°C) | 18.6 ± 6.2 | 2.5 | 13 | 20 | 24.1 | 28.3 |
| Mean temperature (°C) | 21.6 ± 6.2 | 5.1 | 16.9 | 23 | 26.8 | 30.4 |
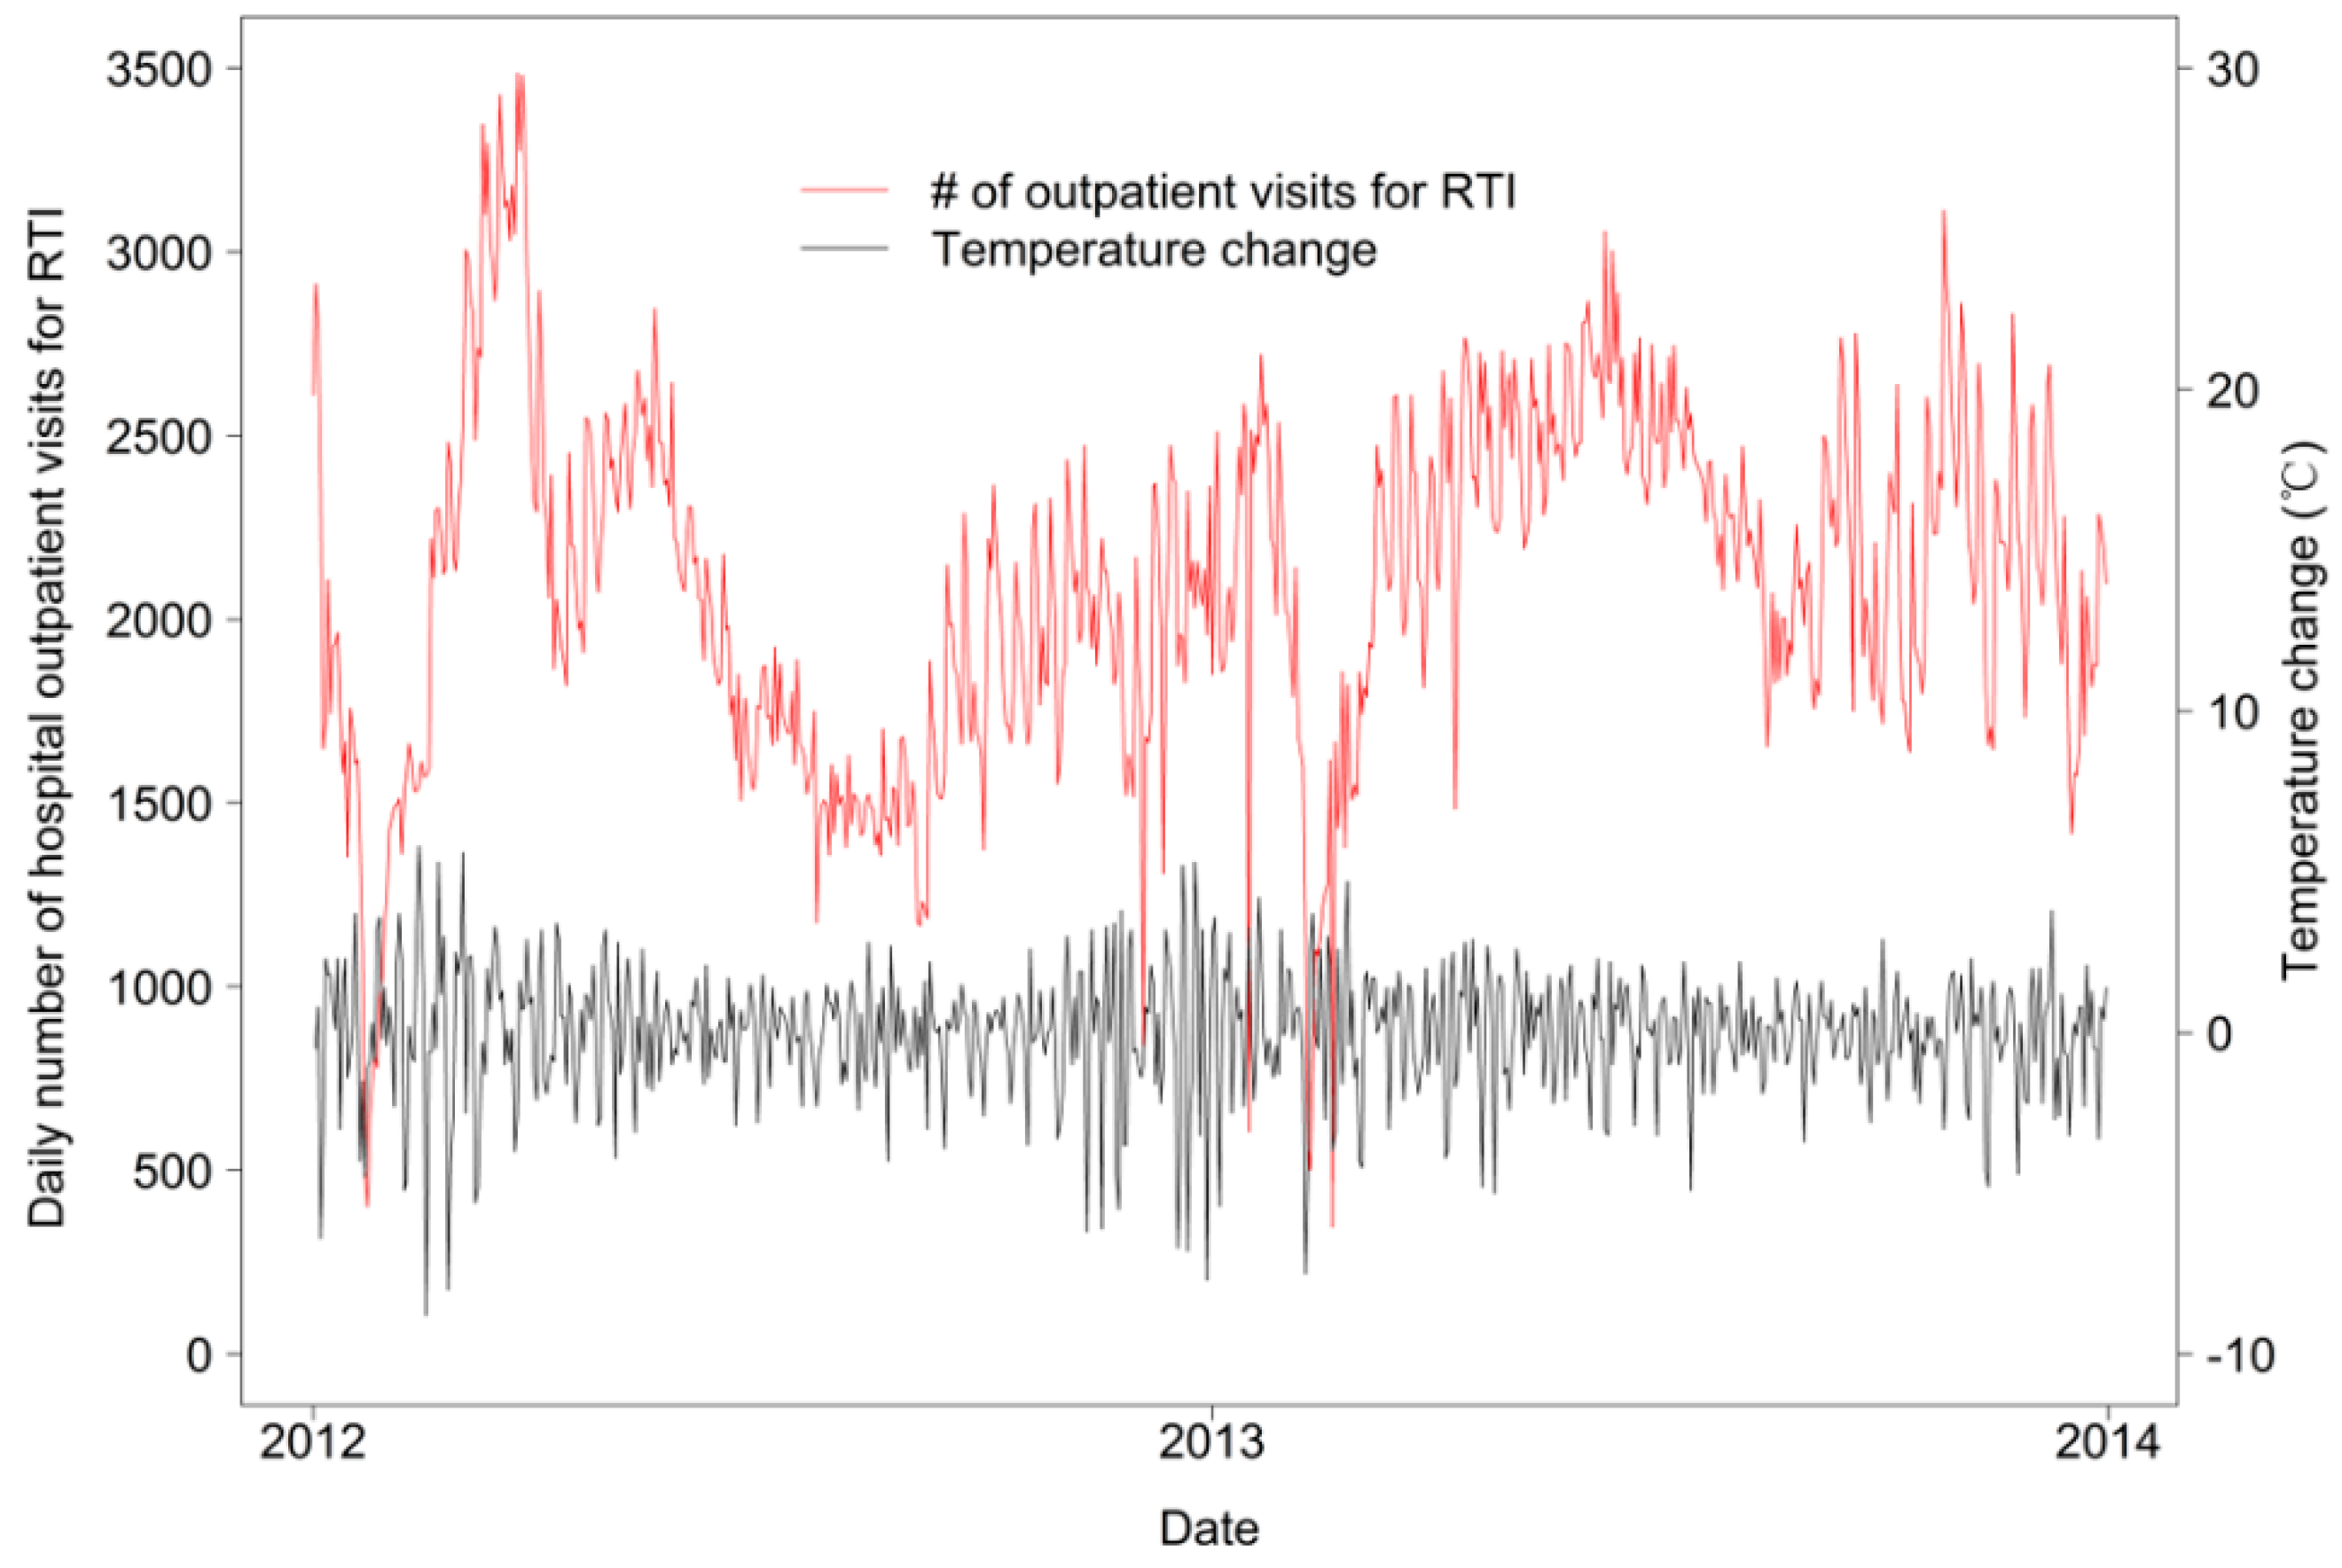
| Temperature change (°C)* | −0.01 ± 1.93 | −8.8 | −0.9 | 0.2 | 1.1 | 5.8 |
| Relative humidity (%) | 81.2 ± 10.4 | 40 | 76 | 83 | 89 | 100 |
| Daily number of hospital outpatient visits for respiratory diseases | 2092.8 ± 479.6 | 346 | 1756 | 2132 | 2431 | 3486 |
| Group by Age (years) | ||||||
| 0~ | 489.1 ± 124.0 | 103 | 401 | 481 | 572 | 1023 |
| 1~ | 664.6 ± 158.6 | 91 | 552 | 669 | 775 | 1116 |
| 3~ | 631.8 ± 172.7 | 87 | 516 | 634 | 755 | 1096 |
| 6~ | 307.4 ± 117.5 | 34 | 226 | 285 | 380 | 813 |
| Group by Gender ** | ||||||
| Male | 1271.0 ± 285.8 | 222 | 1075 | 1287 | 1468 | 2120 |
| Female | 821.6 ± 196.4 | 124 | 688 | 835 | 956 | 1411 |
| Group by Diseases | ||||||
| Upper respiratory tract infection | 1609.6 ± 375.5 | 252 | 1359 | 1620 | 1875 | 2558 |
| Lower respiratory tract infection | 483.3 ± 143.7 | 86 | 388 | 476 | 561 | 1077 |


| Lag (day) | RR (95% CI) for Temperature Change | |||
|---|---|---|---|---|
| −6.2 °C | −3.5 °C | 2.9 °C | 3.8 °C | |
| Overall | ||||
| Lag0 | 1.00(0.98, 1.02) | 0.98(0.97, 1.00) | 0.99(0.98, 1.00) | 0.99(0.98, 1.01) |
| Lag5 | 1.03(1.02, 1.05) | 1.00(0.99, 1.00) | 0.99(0.98, 1.00) | 0.98(0.97, 0.99) |
| Lag10 | 1.01(1.00, 1.03) | 1.00(0.99, 1.00) | 1.00(0.99, 1.00) | 0.99(0.98, 1.00) |
| Lag15 | 1.00(0.99, 1.02) | 1.00(0.99, 1.00) | 1.00(0.99, 1.01) | 1.00(0.99, 1.01) |
| Lag20 | 1.00(0.99, 1.02) | 1.00(0.99, 1.01) | 1.00(1.00, 1.01) | 1.00(0.99, 1.02) |
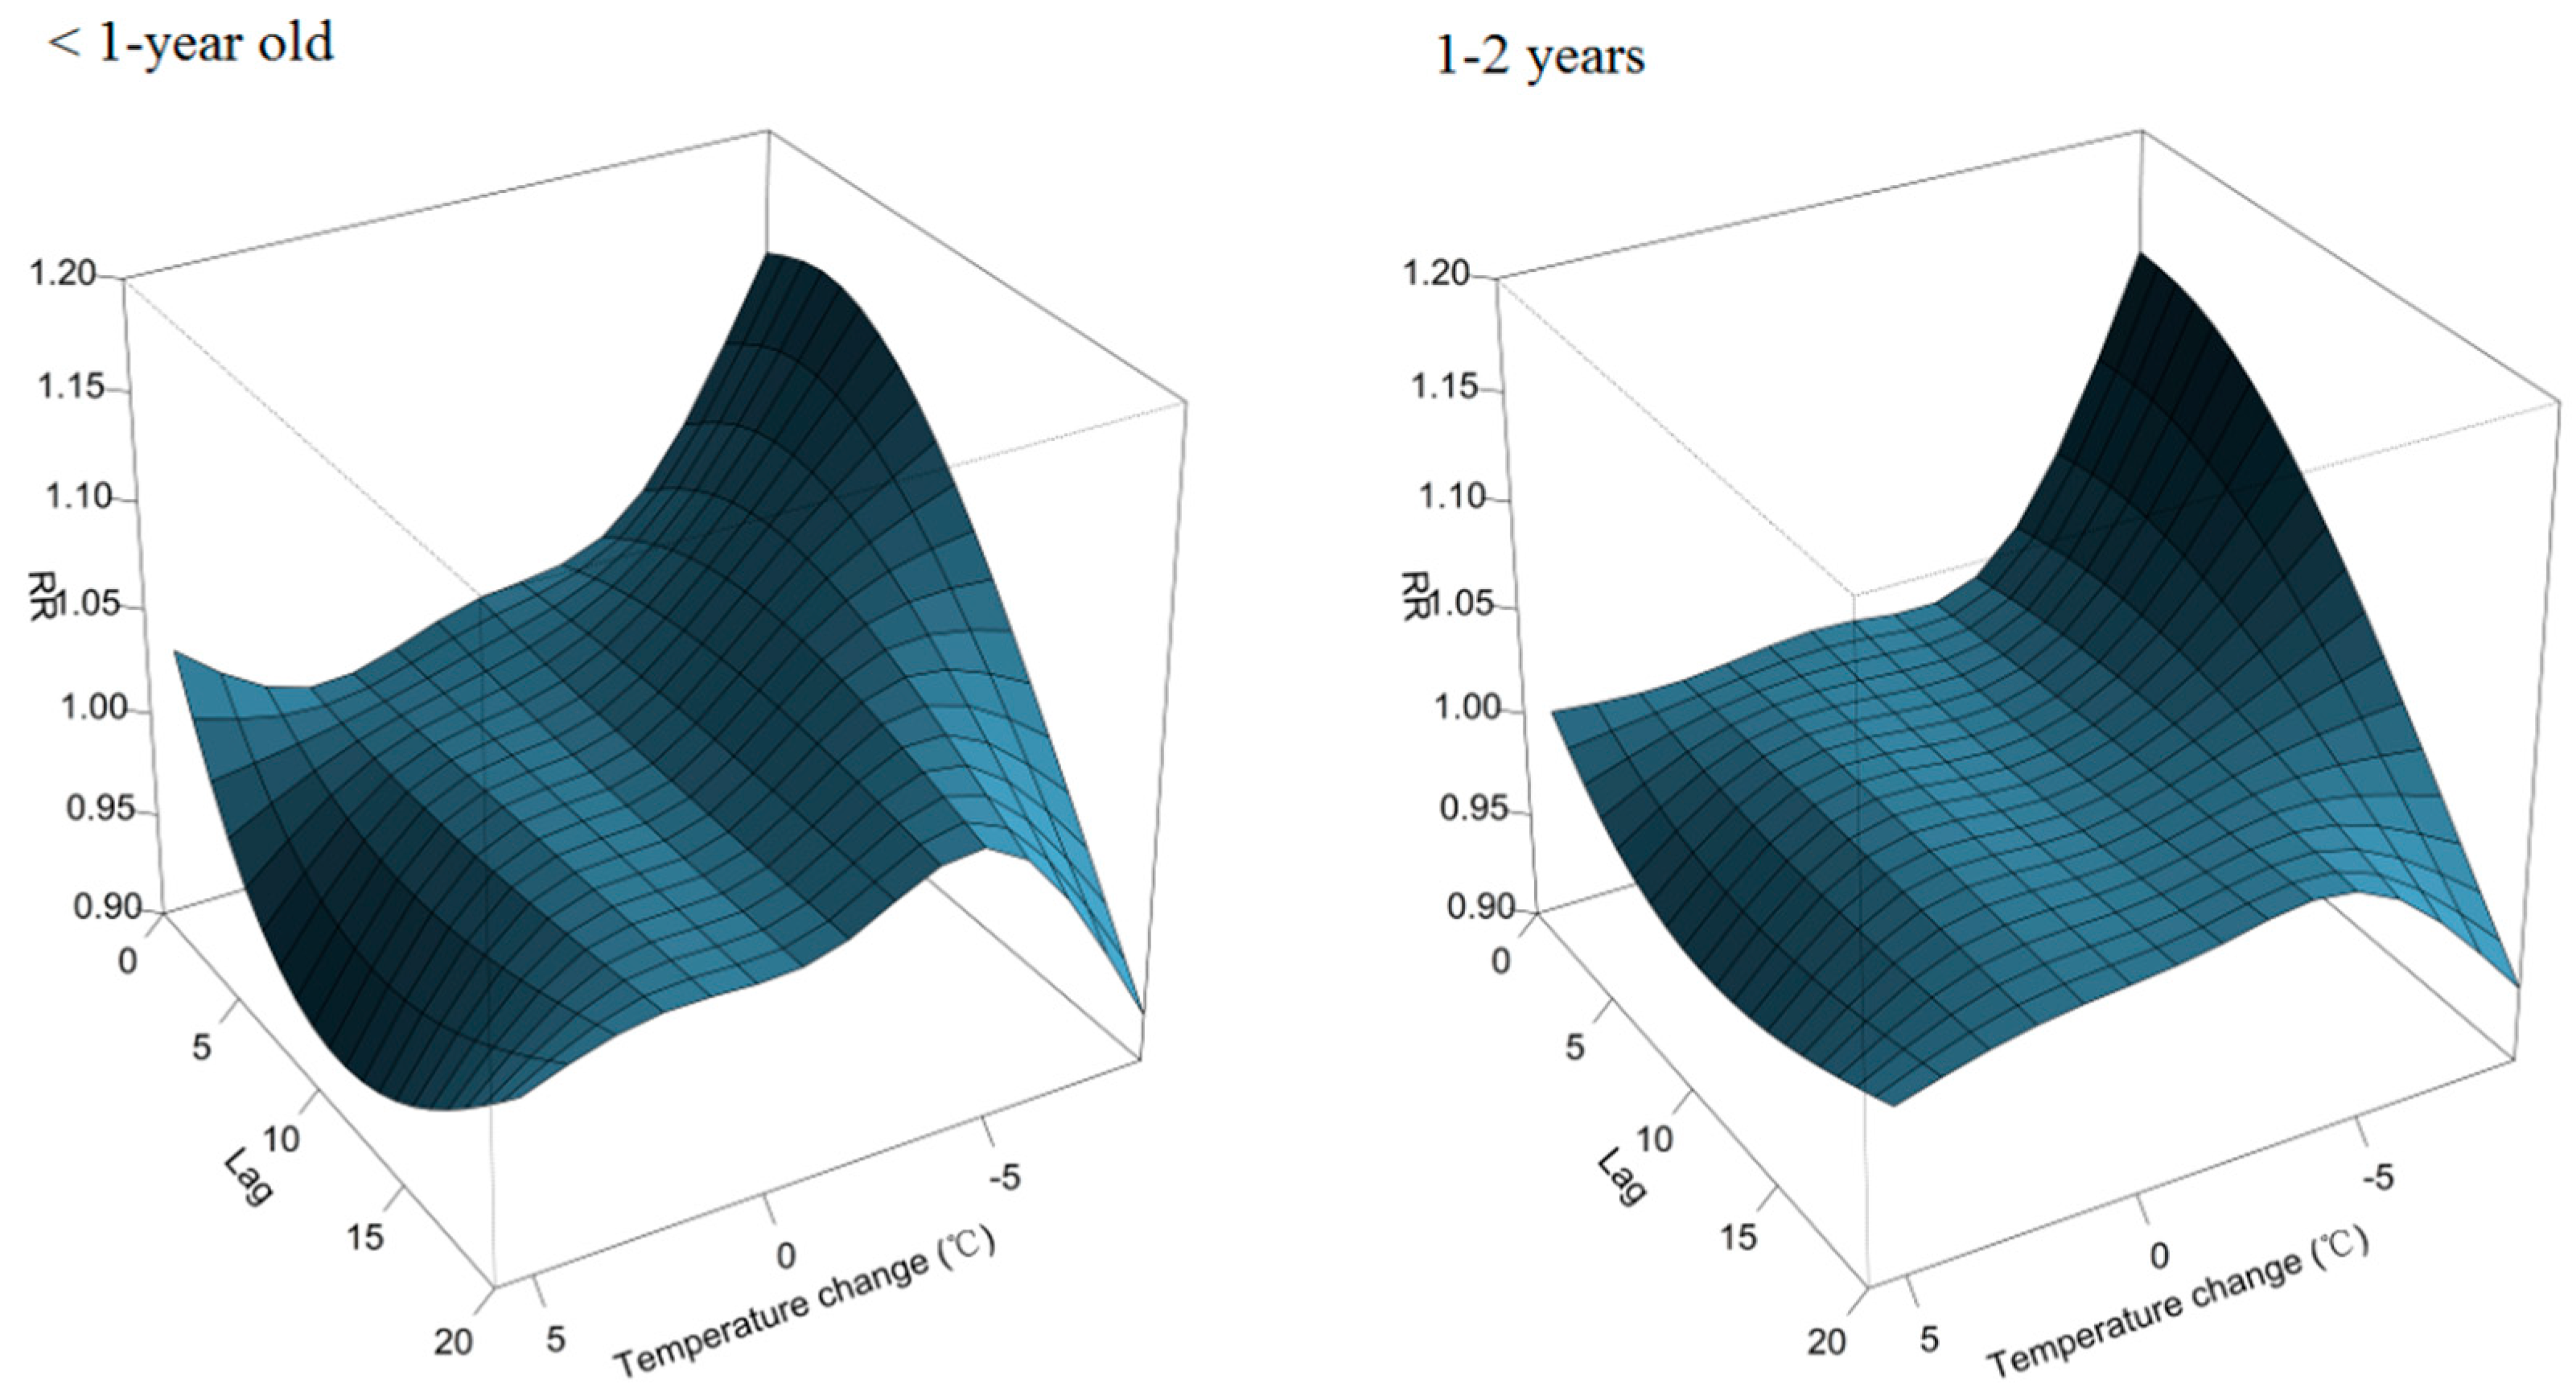
| 0 year | ||||
| Lag0 | 1.05(1.02, 1.09) | 1.02(1.00, 1.03) | 0.99(0.98, 1.01) | 1.00(0.98, 1.03) |
| Lag5 | 1.08(1.05, 1.11) | 1.03(1.01, 1.04) | 0.98(0.96, 0.99) | 0.96(0.94, 0.98) |
| Lag10 | 1.08(1.05, 1.10) | 1.03(1.02, 1.05) | 0.97(0.96, 0.99) | 0.95(0.93, 0.97) |
| Lag15 | 1.05(1.03, 1.07) | 1.03(1.02, 1.04) | 0.98(0.97, 0.99) | 0.97(0.95, 0.98) |
| Lag20 | 1.01(0.98, 1.03) | 1.02(1.01, 1.04) | 1.00(0.99, 1.01) | 0.99(0.98, 1.01) |
| 1–2 years | ||||
| Lag0 | 1.04(1.01, 1.07) | 1.00(0.98, 1.01) | 0.99(0.98, 1.01) | 0.99(0.98, 1.01) |
| Lag5 | 1.04(1.02, 1.06) | 1.00(0.99, 1.01) | 0.99(0.98, 1.00) | 0.98(0.96, 0.99) |
| Lag10 | 1.03(1.01, 1.06) | 1.00(0.99, 1.02) | 0.99(0.98, 1.00) | 0.97(0.96, 0.99) |
| Lag15 | 1.02(1.00, 1.04) | 1.01(1.00, 1.02) | 0.99(0.98, 1.00) | 0.98(0.97, 0.99) |
| Lag20 | 0.99(0.97, 1.01) | 1.01(1.00, 1.02) | 0.99(0.98, 1.00) | 0.99(0.97, 1.01) |
| 3–5 years | ||||
| Lag0 | 0.99(0.96, 1.02) | 0.97(0.96, 0.99) | 0.98(0.97, 1.00) | 0.98(0.96, 1.00) |
| Lag5 | 1.00(0.98, 1.02) | 0.98(0.97, 0.99) | 1.00(0.99, 1.01) | 0.99(0.97, 1.01) |
| Lag10 | 1.00(0.98, 1.03) | 0.98(0.97, 1.00) | 1.01(0.99, 1.02) | 1.00(0.98, 1.02) |
| Lag15 | 1.00(0.98, 1.02) | 0.99(0.98, 1.00) | 1.01(1.00, 1.02) | 1.01(0.99, 1.02) |
| Lag20 | 1.00(0.97, 1.02) | 0.99(0.98, 1.01) | 1.01(1.00, 1.02) | 1.01(1.00, 1.03) |
| 6–17 years | ||||
| Lag0 | 0.97(0.92, 1.03) | 0.96(0.93, 0.98) | 1.00(0.97, 1.02) | 0.98(0.94, 1.02) |
| Lag5 | 1.01(0.97, 1.06) | 0.99(0.97, 1.02) | 1.00(0.97, 1.02) | 0.98(0.95, 1.02) |
| Lag10 | 1.02(0.98, 1.08) | 1.01(0.98, 1.03) | 1.00(0.97, 1.02) | 0.99(0.95, 1.03) |
| Lag15 | 1.01(0.98, 1.05) | 1.00(0.98, 1.02) | 0.99(0.97, 1.01) | 0.99(0.96, 1.02) |
| Lag20 | 0.99(0.95, 1.04) | 0.98(0.96, 1.01) | 0.99(0.97, 1.01) | 0.99(0.96, 1.03) |
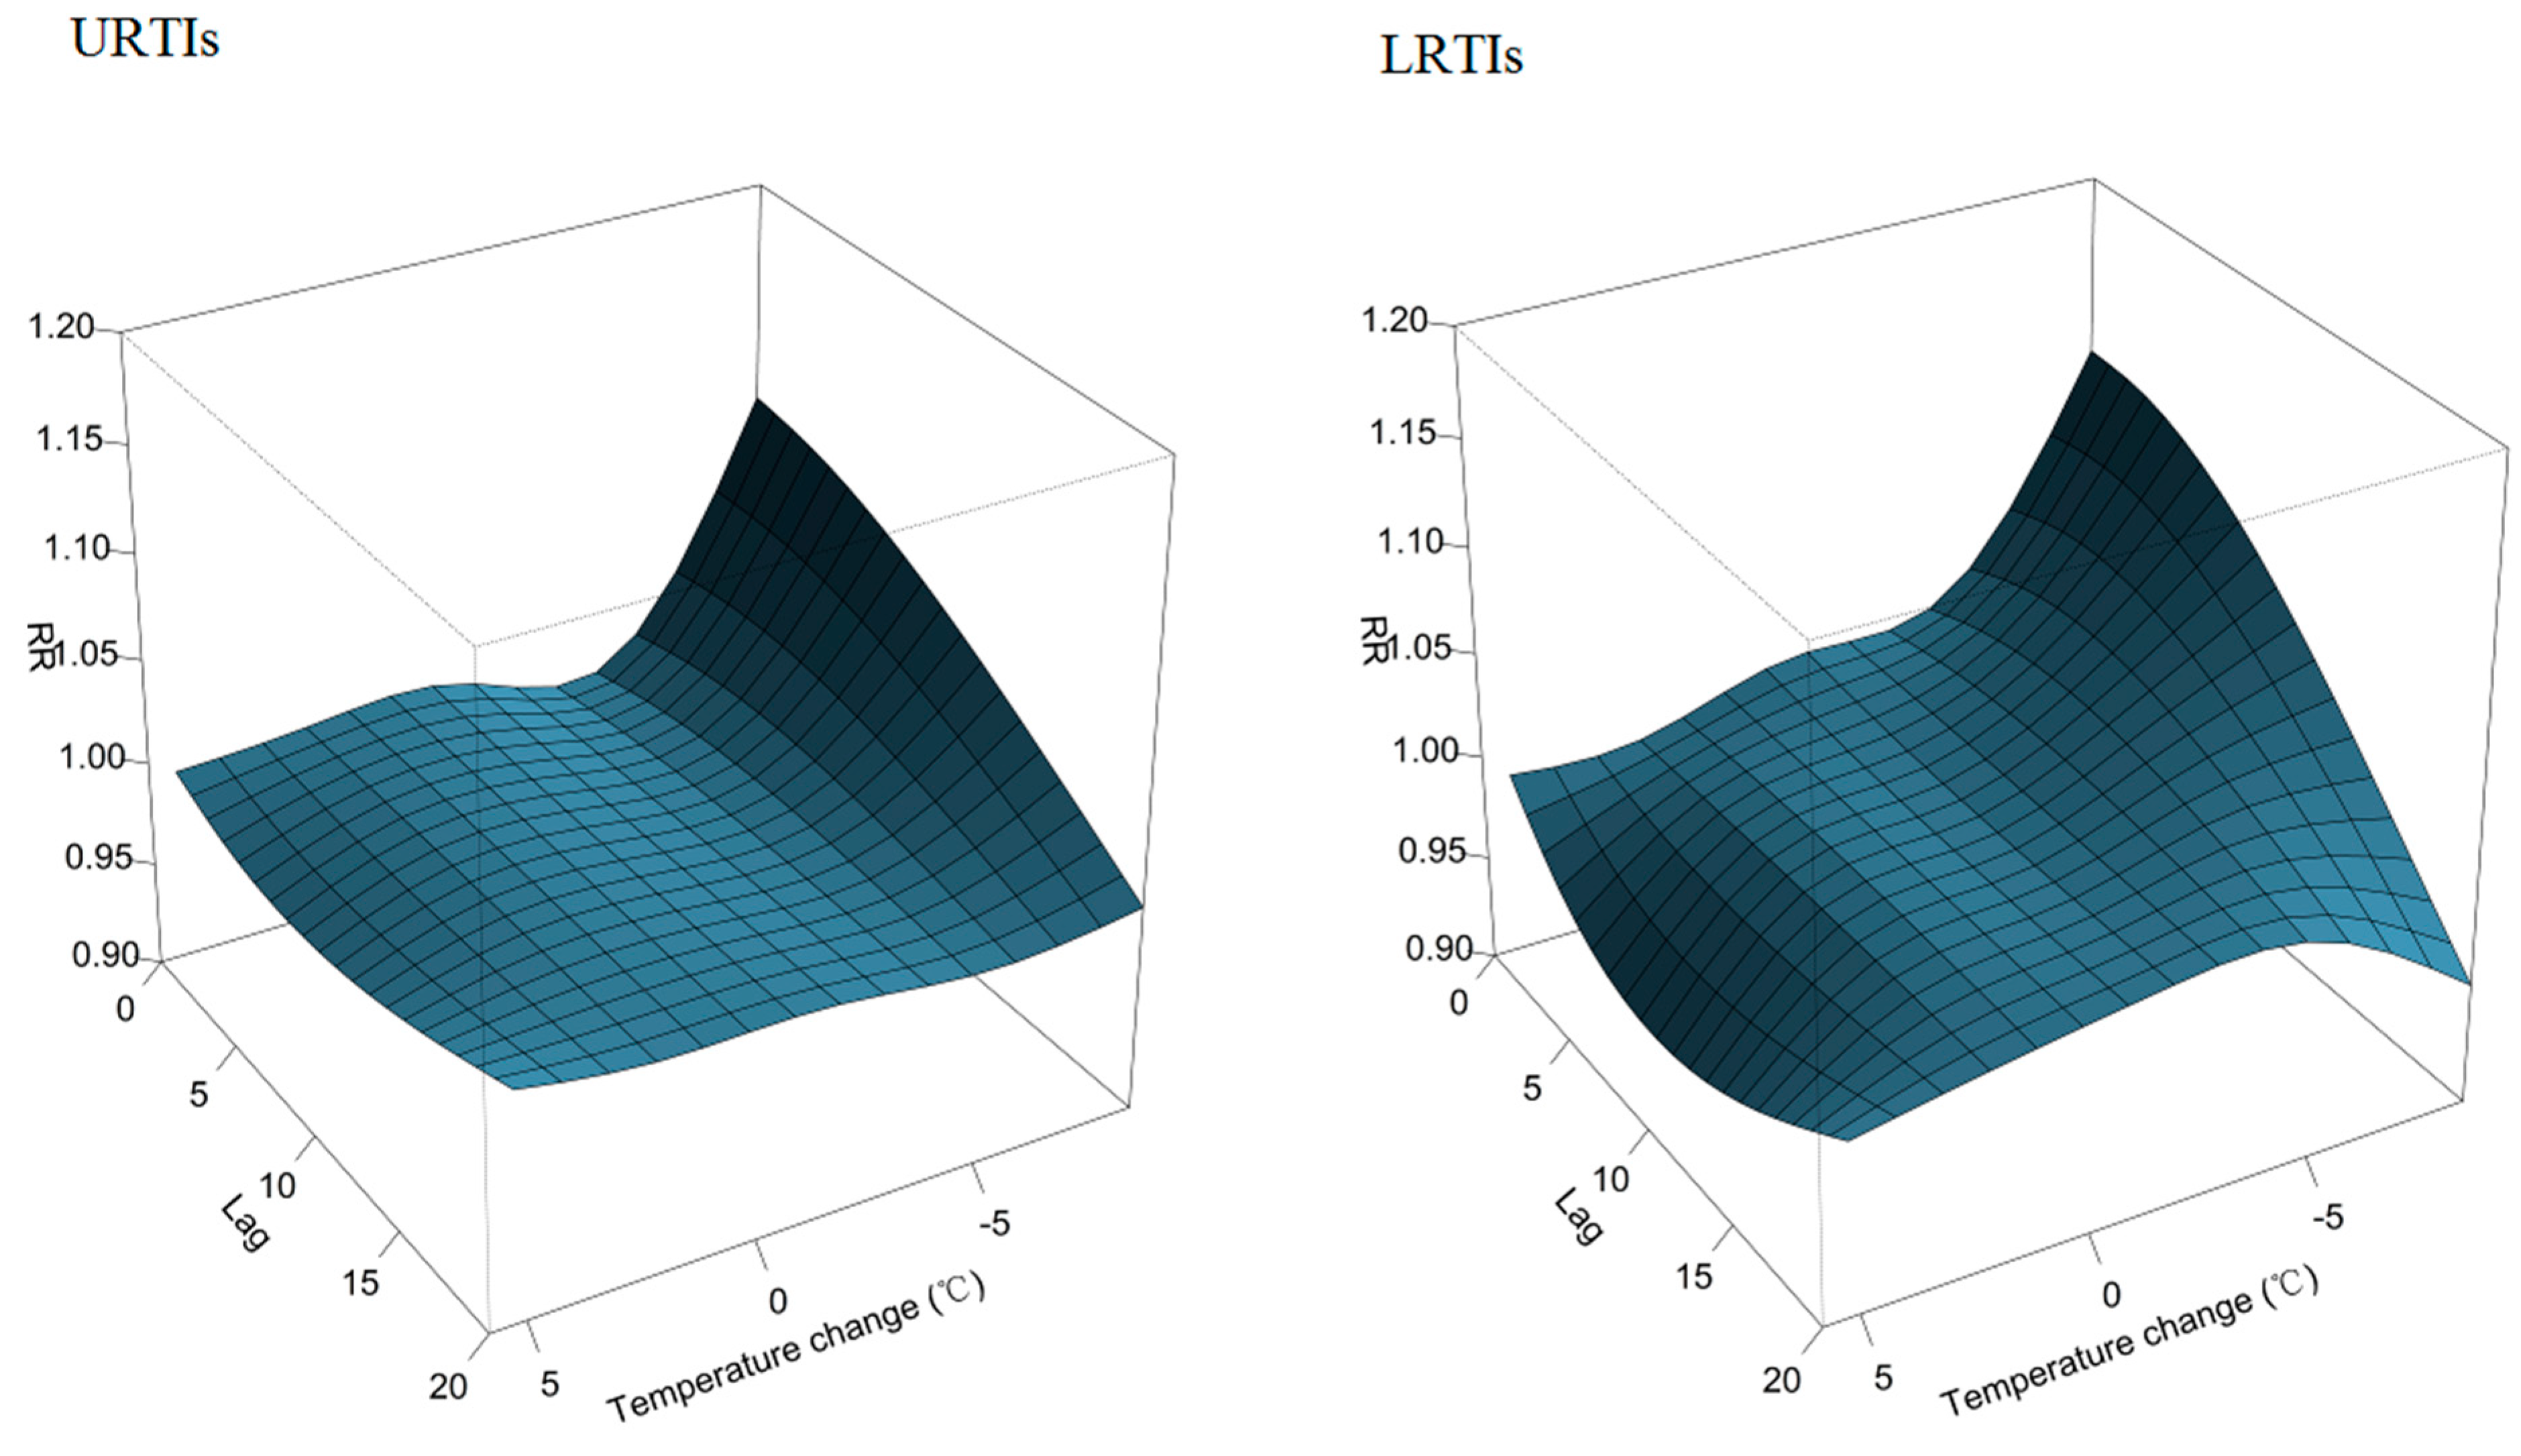
| URTIs | ||||
| Lag0 | 1.01(0.99, 1.03) | 0.98(0.97, 0.99) | 0.99(0.99, 1.00) | 0.99(0.98, 1.01) |
| Lag5 | 1.01(1.00, 1.03) | 0.99(0.98, 1.00) | 0.99(0.99, 1.00) | 0.99(0.98, 1.00) |
| Lag10 | 1.01(1.00, 1.03) | 0.99(0.98, 1.00) | 1.00(0.99, 1.00) | 0.99(0.98, 1.00) |
| Lag15 | 1.00(0.99, 1.02) | 0.99(0.99, 1.00) | 1.00(0.99, 1.00) | 1.00(0.99, 1.01) |
| Lag20 | 0.99(0.98, 1.01) | 0.99(0.99, 1.00) | 1.00(0.99, 1.01) | 1.00(0.99, 1.02) |
| LRTIs | ||||
| Lag0 | 1.04(1.01, 1.07) | 1.01(0.99, 1.02) | 0.98(0.97, 1.00) | 0.98(0.97, 1.00) |
| Lag5 | 1.05(1.03, 1.07) | 1.01(1.00, 1.03) | 0.98(0.97, 0.99) | 0.97(0.95, 0.98) |
| Lag10 | 1.04(1.02, 1.07) | 1.01(1.00, 1.03) | 0.98(0.97, 0.99) | 0.96(0.95, 0.98) |
| Lag15 | 1.02(1.00, 1.04) | 1.01(1.00, 1.02) | 0.99(0.98, 1.00) | 0.97(0.96, 0.99) |
| Lag20 | 0.99(0.97, 1.01) | 1.01(1.00, 1.02) | 0.99(0.98, 1.00) | 0.99(0.97, 1.00) |
4. Discussion

5. Conclusions
Supplementary Files
Supplementary File 1Acknowledgments
Author Contributions
Conflicts of Interest
References
- Mourtzoukou, E.G.; Falagas, M.E. Exposure to cold and respiratory tract infections. Int. J. Tuberc. Lung Dis. 2007, 11, 938–943. [Google Scholar] [PubMed]
- Nair, H.; Nokes, D.J.; Gessner, B.D.; Dherani, M.; Madhi, S.A.; Singleton, R.J.; O’Brien, K.L.; Roca, A.; Wright, P.F.; Bruce, N.; et al. Global burden of acute lower respiratory infections due to respiratory syncytial virus in young children: A systematic review and meta-analysis. Lancet 2010, 375, 1545–1555. [Google Scholar] [CrossRef]
- Mulholland, K. Global burden of acute respiratory infections in children: Implications for interventions. Pediatr. Pulmonol. 2003, 36, 469–474. [Google Scholar] [CrossRef] [PubMed]
- Du Prel, J.B.; Puppe, W.; Grondahl, B.; Knuf, M.; Weigl, J.A.; Schaaff, F.; Schmitt, H.J. Are meteorological parameters associated with acute respiratory tract infections? Clin. Infect. Dis. 2009, 49, 861–868. [Google Scholar]
- Xu, Z.; Etzel, R.A.; Su, H.; Huang, C.; Guo, Y.; Tong, S. Impact of ambient temperature on children’s health: A systematic review. Environ. Res. 2012, 117, 120–131. [Google Scholar] [CrossRef] [PubMed]
- Patz, J.A.; Campbell-Lendrum, D.; Holloway, T.; Foley, J.A. Impact of regional climate change on human health. Nature 2005, 438, 310–317. [Google Scholar] [CrossRef] [PubMed]
- Cruz, A.A.; Togias, A. Upper airways reactions to cold air. Curr. Allergy Asthma Rep. 2008, 8, 111–117. [Google Scholar] [CrossRef] [PubMed]
- Hajat, S.; Kovats, R.S.; Atkinson, R.W.; Haines, A. Impact of hot temperatures on death in london: A time series approach. J. Epidemiol. Community Health 2002, 56, 367–372. [Google Scholar] [CrossRef] [PubMed]
- Guo, Y.; Barnett, A.G.; Yu, W.; Pan, X.; Ye, X.; Huang, C.; Tong, S. A large change in temperature between neighbouring days increases the risk of mortality. PLoS One 2011, 6. [Google Scholar] [CrossRef] [PubMed] [Green Version]
- Xu, Z.; Huang, C.; Su, H.; Turner, L.R.; Qiao, Z.; Tong, S. Diurnal temperature range and childhood asthma: A time-series study. Environ. Health 2013, 12. [Google Scholar] [CrossRef]
- Ayres, J.G.; Forsberg, B.; Annesi-Maesano, I.; Dey, R.; Ebi, K.L.; Helms, P.J.; Medina-Ramon, M.; Windt, M.; Forastiere, F. Climate change and respiratory disease: European respiratory society position statement. Eur. Respir. J. 2009, 34, 295–302. [Google Scholar] [CrossRef] [PubMed]
- Shen, J.; Wang, M.; Dong, H.; Zhou, Q. Analysis of death causes among infants in guangzhou from 2010 to 2013. Zhonghua Yu Fang Yi Xue Za Zhi 2014, 48, 491–495. (In Chinese) [Google Scholar] [PubMed]
- Zhang, D.; He, Z.; Xu, L.; Zhu, X.; Wu, J.; Wen, W.; Zheng, Y.; Deng, Y.; Chen, J.; Hu, Y.; et al. Epidemiology characteristics of respiratory viruses found in children and adults with respiratory tract infections in southern china. Int. J. Infect. Dis. 2014, 25, 159–164. [Google Scholar] [CrossRef]
- Zou, L.; Zhou, J.; Li, H.; Wu, J.; Mo, Y.; Chen, Q.; Fang, L.; Wu, D.; Ke, C. Human adenovirus infection in children with acute respiratory tract disease in guangzhou, china. APMIS 2012, 120, 683–688. [Google Scholar] [CrossRef] [PubMed]
- Nelson, E.A.; Tam, J.S.; Yu, L.M.; Li, A.M.; Chan, P.K.; Sung, R.Y. Assessing disease burden of respiratory disorders in Hong Kong children with hospital discharge data and linked laboratory data. Hong Kong Med. J. 2007, 13, 114–121. [Google Scholar] [PubMed]
- Lin, H.; Zhang, Y.; Xu, Y.; Xu, X.; Liu, T.; Luo, Y.; Xiao, J.; Wu, W.; Ma, W. Temperature changes between neighboring days and mortality in summer: A distributed lag non-linear time series analysis. PLoS One 2013, 8. [Google Scholar] [CrossRef] [PubMed]
- Zeger, S.L.; Irizarry, R.; Peng, R.D. On time series analysis of public health and biomedical data. Annu. Rev. Public Health 2006, 27, 57–79. [Google Scholar] [CrossRef] [PubMed]
- Braga, A.L.; Zanobetti, A.; Schwartz, J. The lag structure between particulate air pollution and respiratory and cardiovascular deaths in 10 US cities. J. Occup. Environ. Med. 2001, 43, 927–933. [Google Scholar] [CrossRef] [PubMed]
- Gasparrini, A.; Armstrong, B.; Kenward, M.G. Distributed lag non-linear models. Stat. Med. 2010, 29, 2224–2234. [Google Scholar] [CrossRef] [PubMed]
- Gasparrini, A. Distributed lag linear and non-linear models in R: The package dlnm. J. Stat. Softw. 2011, 43, 1–20. [Google Scholar] [PubMed]
- Luo, Y.; Zhang, Y.; Liu, T.; Rutherford, S.; Xu, Y.; Xu, X.; Wu, W.; Xiao, J.; Zeng, W.; Chu, C.; et al. Lagged effect of diurnal temperature range on mortality in a subtropical megacity of china. PLoS One 2013, 8. [Google Scholar] [CrossRef]
- Lessler, J.; Brookmeyer, R.; Reich, N.G.; Nelson, K.E.; Cummings, D.A.; Perl, T.M. Identifying the probable timing and setting of respiratory virus infections. Infect. Control Hosp. Epidemiol. 2010, 31, 809–815. [Google Scholar] [CrossRef] [PubMed]
- Peng, R.D.; Dominici, F.; Louis, T.A. Model choice in time series studies of air pollution and mortality. J. R. Stat. Soc. 2006, 169, 179–203. [Google Scholar] [CrossRef]
- Figueiras, A.; Cadarso-Suarez, C. Application of nonparametric models for calculating odds ratios and their confidence intervals for continuous exposures. Am. J. Epidemiol. 2001, 154, 264–275. [Google Scholar] [CrossRef] [PubMed]
- Yang, J.; Ou, C.Q.; Ding, Y.; Zhou, Y.X.; Chen, P.Y. Daily temperature and mortality: A study of distributed lag non-linear effect and effect modification in guangzhou. Environ Health 2012, 11. [Google Scholar] [CrossRef]
- Yang, L.; Qin, G.; Zhao, N.; Wang, C.; Song, G. Using a generalized additive model with autoregressive terms to study the effects of daily temperature on mortality. BMC Med. Res. Methodol. 2012, 12. [Google Scholar] [CrossRef]
- Falagas, M.E.; Theocharis, G.; Spanos, A.; Vlara, L.A.; Issaris, E.A.; Panos, G.; Peppas, G. Effect of meteorological variables on the incidence of respiratory tract infections. Respir. Med. 2008, 102, 733–737. [Google Scholar] [CrossRef] [PubMed]
- Watson, M.; Gilmour, R.; Menzies, R.; Ferson, M.; McIntyre, P. The association of respiratory viruses, temperature, and other climatic parameters with the incidence of invasive pneumococcal disease in Sydney, Australia. Clin. Infect. Dis. 2006, 42, 211–215. [Google Scholar] [CrossRef] [PubMed]
- Li, T.; Yang, Z.; Wang, M. Diurnal temperature range may be the risk factor for respiratory tract infections among the elderly in Guangzhou, China. Int. J. Biometeorol. 2014, 58, 309–310. [Google Scholar] [CrossRef] [PubMed]
- Danielides, V.; Nousia, C.S.; Patrikakos, G.; Bartzokas, A.; Lolis, C.J.; Milionis, H.J.; Skevas, A. Effect of meteorological parameters on acute laryngitis in adults. Acta. Otolaryngol. 2002, 122, 655–660. [Google Scholar] [CrossRef] [PubMed]
- Hashimoto, M.; Fukuda, T.; Shimizu, T.; Watanabe, S.; Watanuki, S.; Eto, Y.; Urashima, M. Influence of climate factors on emergency visits for childhood asthma attack. Pediatr. Int. 2004, 46, 48–52. [Google Scholar] [CrossRef] [PubMed]
- Ueda, K.; Nitta, H.; Odajima, H. The effects of weather, air pollutants, and asian dust on hospitalization for asthma in Fukuoka. Environ. Health Prev. Med. 2010, 15, 350–357. [Google Scholar] [CrossRef] [PubMed]
- Xu, Z.; Hu, W.; Tong, S. Temperature variability and childhood pneumonia: An ecological study. Environ. Health 2014, 13. [Google Scholar] [CrossRef] [PubMed]
- Cheng, J.; Xu, Z.; Zhu, R.; Wang, X.; Jin, L.; Song, J.; Su, H. Impact of diurnal temperature range on human health: A systematic review. Int. J. Biometeorol. 2014, 58, 2011–2024. [Google Scholar] [CrossRef] [PubMed]
- Ge, W.Z.; Xu, F.; Zhao, Z.H.; Zhao, J.Z.; Kan, H.D. Association between diurnal temperature range and respiratory tract infections. Biomed. Environ. Sci. 2013, 26, 222–225. [Google Scholar] [PubMed]
- Yang, J.; Liu, H.Z.; Ou, C.Q.; Lin, G.Z.; Zhou, Q.; Shen, G.C.; Chen, P.Y.; Guo, Y. Global climate change: Impact of diurnal temperature range on mortality in Guangzhou, China. Environ. Pollut. 2013, 175, 131–136. [Google Scholar] [CrossRef] [PubMed]
- Kan, H.; London, S.J.; Chen, H.; Song, G.; Chen, G.; Jiang, L.; Zhao, N.; Zhang, Y.; Chen, B. Diurnal temperature range and daily mortality in Shanghai, China. Environ. Res. 2007, 103, 424–431. [Google Scholar] [CrossRef] [PubMed]
- Graudenz, G.S.; Landgraf, R.G.; Jancar, S.; Tribess, A.; Fonseca, S.G.; Fae, K.C.; Kalil, J. The role of allergic rhinitis in nasal responses to sudden temperature changes. J. Allergy Clin. Immunol. 2006, 118, 1126–1132. [Google Scholar] [CrossRef] [PubMed]
- Buckley, J.P.; Richardson, D.B. Seasonal modification of the association between temperature and adult emergency department visits for asthma: A case-crossover study. Environ. Health 2012, 11. [Google Scholar] [CrossRef]
- Gordon, C.J. Role of environmental stress in the physiological response to chemical toxicants. Environ. Res. 2003, 92, 1–7. [Google Scholar] [CrossRef] [PubMed]
- Larsson, K.; Tornling, G.; Gavhed, D.; Muller-Suur, C.; Palmberg, L. Inhalation of cold air increases the number of inflammatory cells in the lungs in healthy subjects. Eur. Respir. J. 1998, 12, 825–830. [Google Scholar] [CrossRef] [PubMed]
- Keatinge, W.R. Winter mortality and its causes. Int. J. Circumpolar. Health 2002, 61, 292–299. [Google Scholar] [CrossRef] [PubMed]
- Clary-Meinesz, C.F.; Cosson, J.; Huitorel, P.; Blaive, B. Temperature effect on the ciliary beat frequency of human nasal and tracheal ciliated cells. Biol. Cell 1992, 76, 335–338. [Google Scholar] [CrossRef] [PubMed]
- Koskela, H.; Tukiainen, H. Facial cooling, but not nasal breathing of cold air, induces bronchoconstriction: A study in asthmatic and healthy subjects. Eur. Respir. J. 1995, 8, 2088–2093. [Google Scholar] [CrossRef] [PubMed]
- Eccles, R. An explanation for the seasonality of acute upper respiratory tract viral infections. Acta Oto-Laryngologica 2002, 122, 183–191. [Google Scholar] [CrossRef] [PubMed]
- Welliver, R. The relationship of meteorological conditions to the epidemic activity of respiratory syncytial virus. Paediatr. Respir. Rev. 2009, 10, 6–8. [Google Scholar] [CrossRef] [PubMed]
- Handley, B.A.; Webster, A.J. Some factors affecting the airborne survival of bacteria outdoors. J. Appl. Bacteriol. 1995, 79, 368–378. [Google Scholar] [CrossRef] [PubMed]
- Xu, Z.; Huang, C.; Hu, W.; Turner, L.R.; Su, H.; Tong, S. Extreme temperatures and emergency department admissions for childhood asthma in Brisbane, Australia. Occup. Environ. Med. 2013, 70, 730–735. [Google Scholar] [CrossRef] [PubMed]
- Bunyavanich, S.; Landrigan, C.P.; McMichael, A.J.; Epstein, P.R. The impact of climate change on child health. Ambul. Pediatr. 2003, 3, 44–52. [Google Scholar] [CrossRef] [PubMed]
- Basu, R.; Ostro, B.D. A multicounty analysis identifying the populations vulnerable to mortality associated with high ambient temperature in California. Am. J. Epidemiol. 2008, 168, 632–637. [Google Scholar] [CrossRef] [PubMed]
- D’Amato, G.; Liccardi, G.; D’Amato, M.; Cazzola, M. Outdoor air pollution, climatic changes and allergic bronchial asthma. Eur. Respir. J. 2002, 20, 763–776. [Google Scholar] [CrossRef] [PubMed]
- D’Amato, G.; Cecchi, L. Effects of climate change on environmental factors in respiratory allergic diseases. Clin. Exp. Allergy 2008, 38, 1264–1274. [Google Scholar] [CrossRef] [PubMed]
- Zhang, Y.; Yan, C.; Kan, H.; Cao, J.; Peng, L.; Xu, J.; Wang, W. Effect of ambient temperature on emergency department visits in Shanghai, China: A time series study. Environ. Health 2014, 13. [Google Scholar] [CrossRef] [PubMed]
© 2015 by the authors; licensee MDPI, Basel, Switzerland. This article is an open access article distributed under the terms and conditions of the Creative Commons Attribution license (http://creativecommons.org/licenses/by/4.0/).
Share and Cite
Liu, Y.; Guo, Y.; Wang, C.; Li, W.; Lu, J.; Shen, S.; Xia, H.; He, J.; Qiu, X. Association between Temperature Change and Outpatient Visits for Respiratory Tract Infections among Children in Guangzhou, China. Int. J. Environ. Res. Public Health 2015, 12, 439-454. https://doi.org/10.3390/ijerph120100439
Liu Y, Guo Y, Wang C, Li W, Lu J, Shen S, Xia H, He J, Qiu X. Association between Temperature Change and Outpatient Visits for Respiratory Tract Infections among Children in Guangzhou, China. International Journal of Environmental Research and Public Health. 2015; 12(1):439-454. https://doi.org/10.3390/ijerph120100439
Chicago/Turabian StyleLiu, Yu, Yong Guo, Changbing Wang, Weidong Li, Jinhua Lu, Songying Shen, Huimin Xia, Jianrong He, and Xiu Qiu. 2015. "Association between Temperature Change and Outpatient Visits for Respiratory Tract Infections among Children in Guangzhou, China" International Journal of Environmental Research and Public Health 12, no. 1: 439-454. https://doi.org/10.3390/ijerph120100439