
Quantitative Assessment of Tissue Perfusion in Hepatocellular Carcinoma Using Perflubutane Dynamic Contrast-Enhanced Ultrasonography: A Preliminary Study

Abstract
:1. Introduction
2. Experimental Section
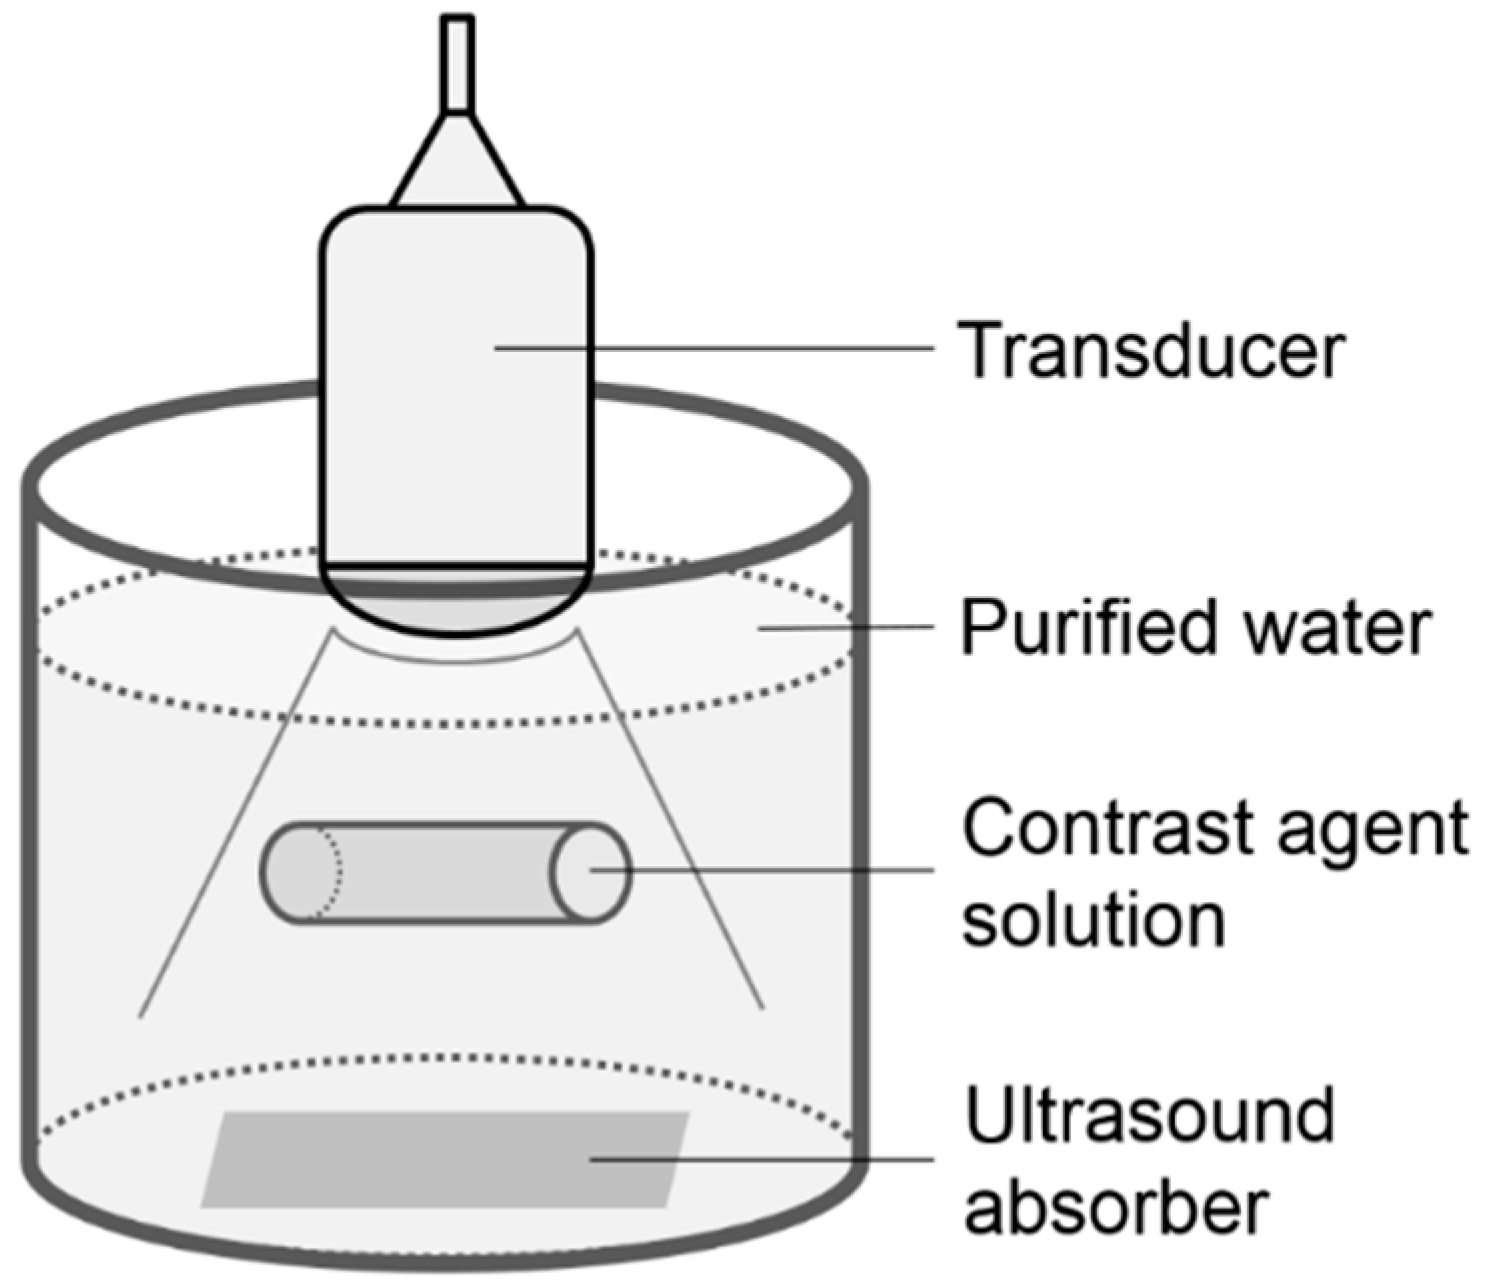
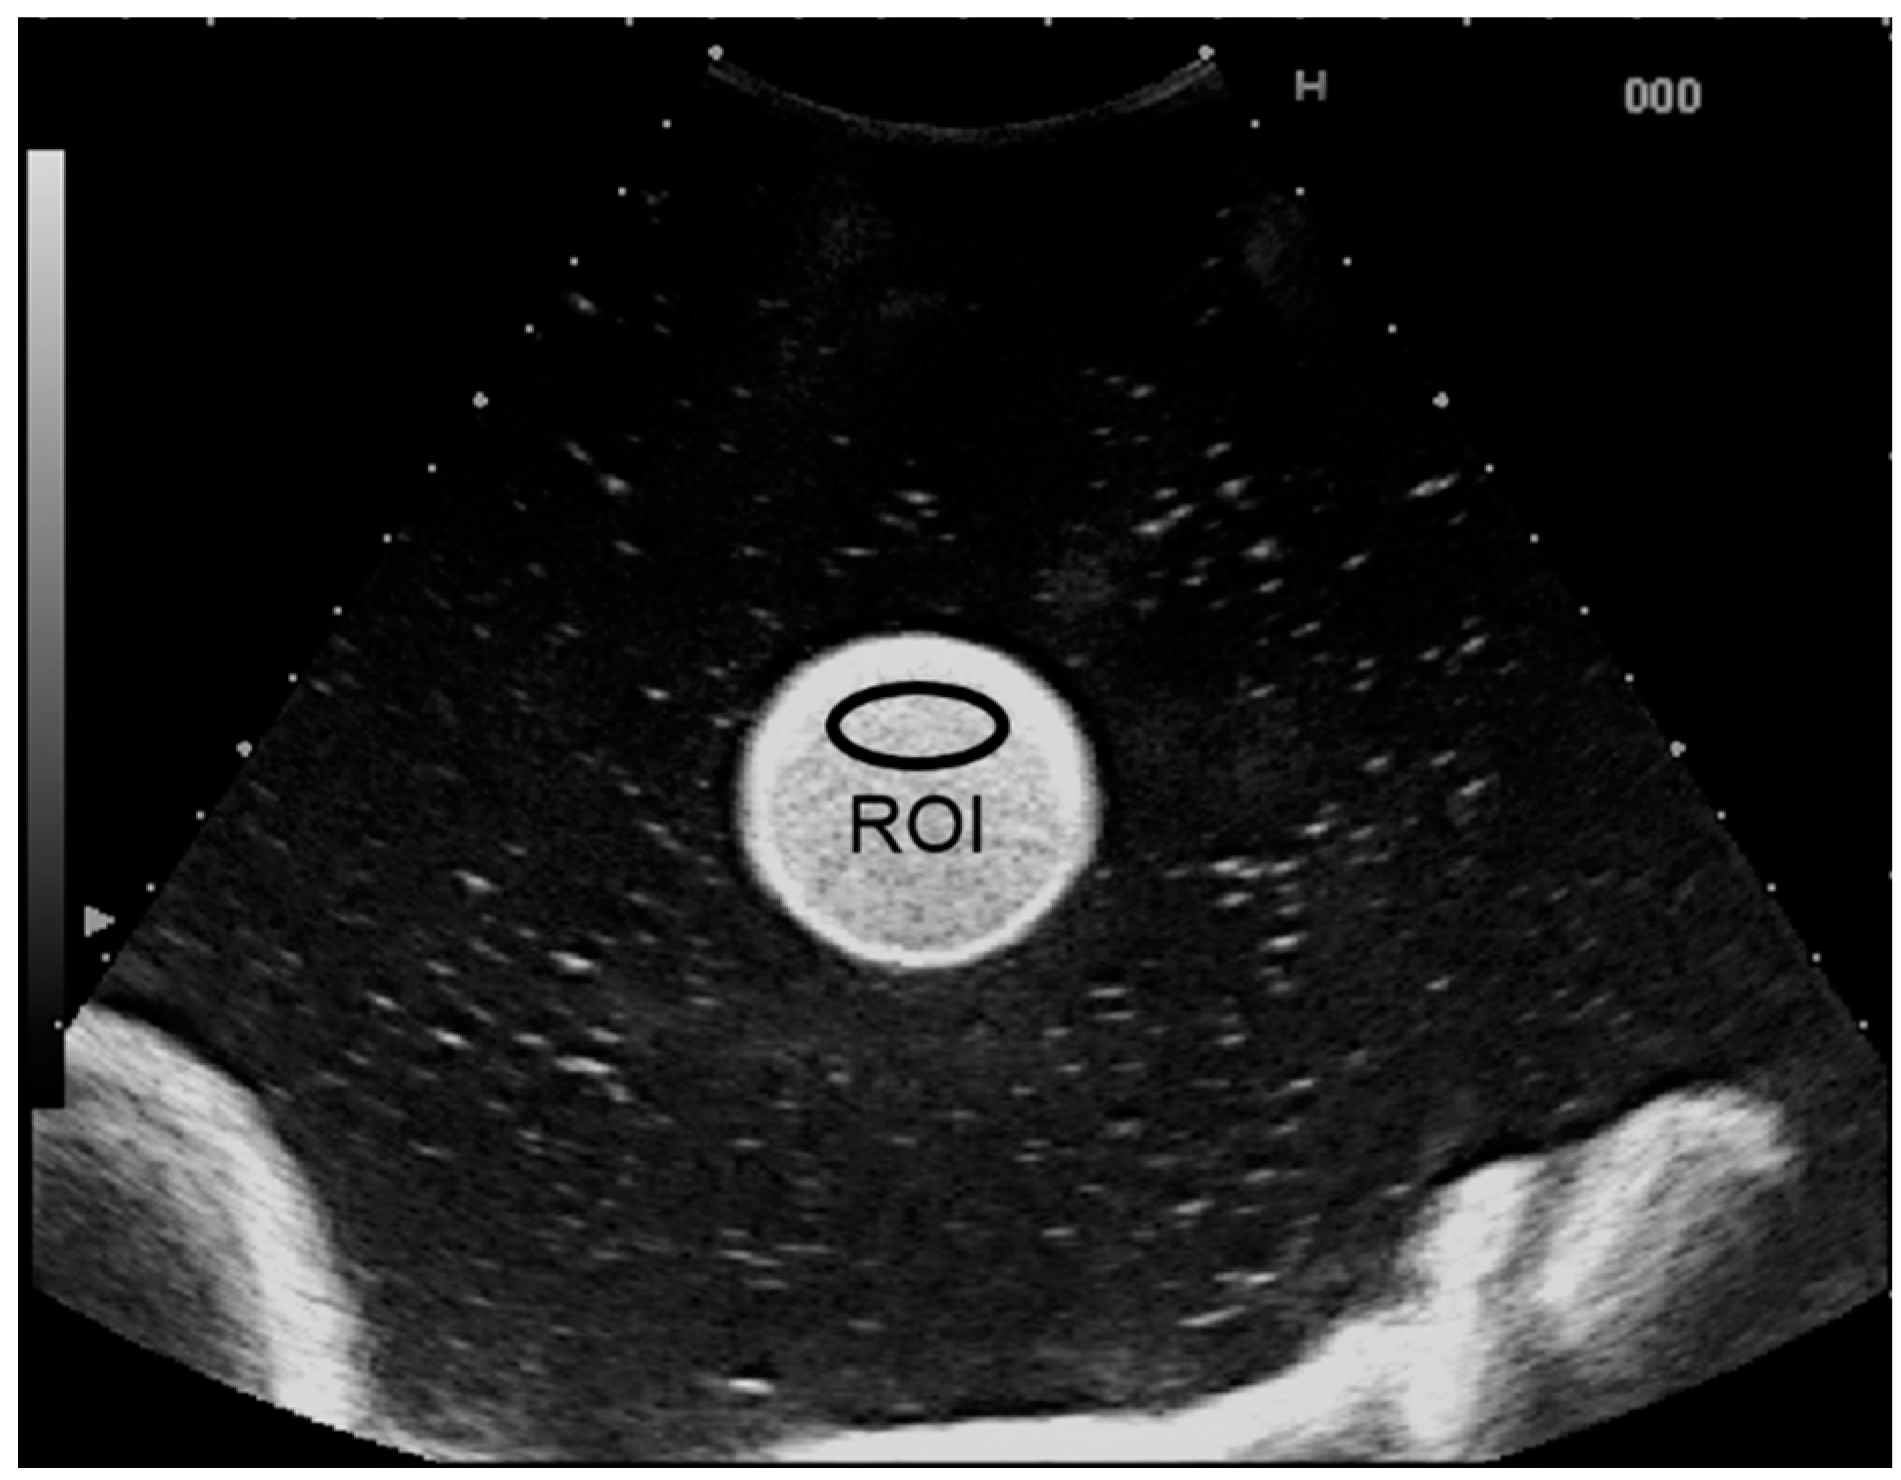
2.1. Phantom Study
2.2. Clinical Study Subjects
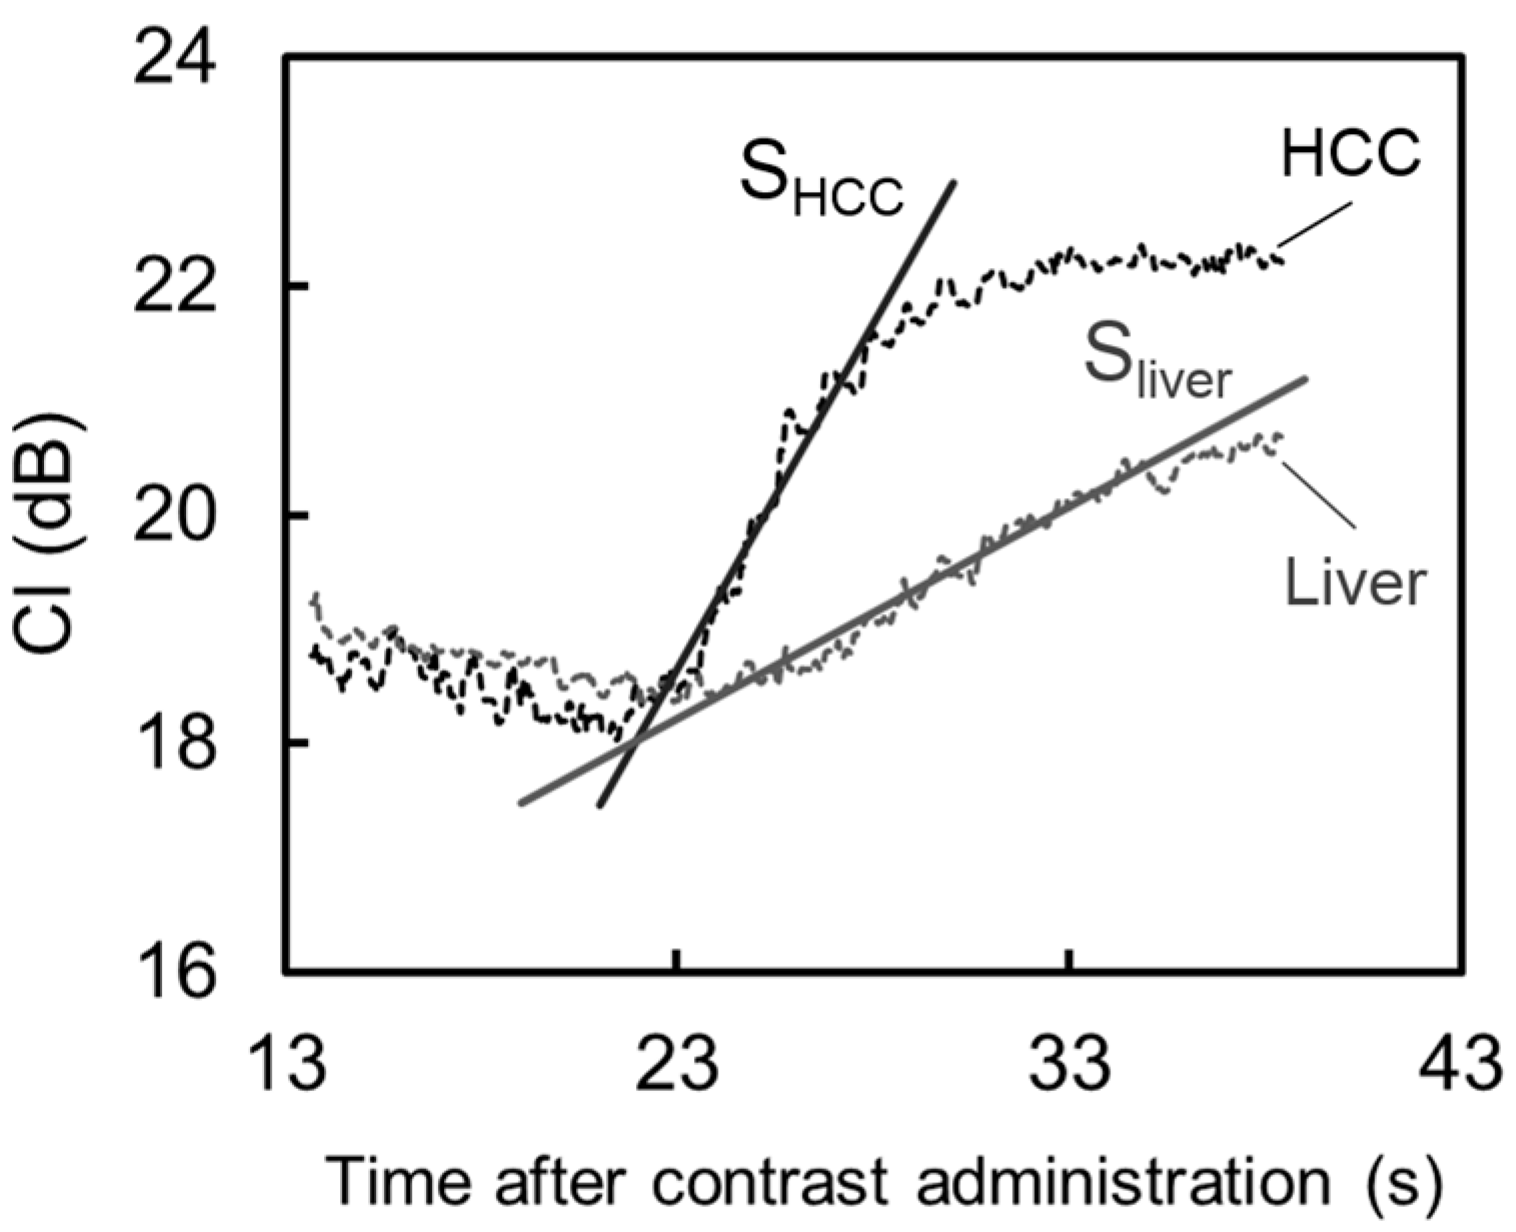
2.3. Procedure for Dynamic Contrast-Enhanced US Analysis
3. Results
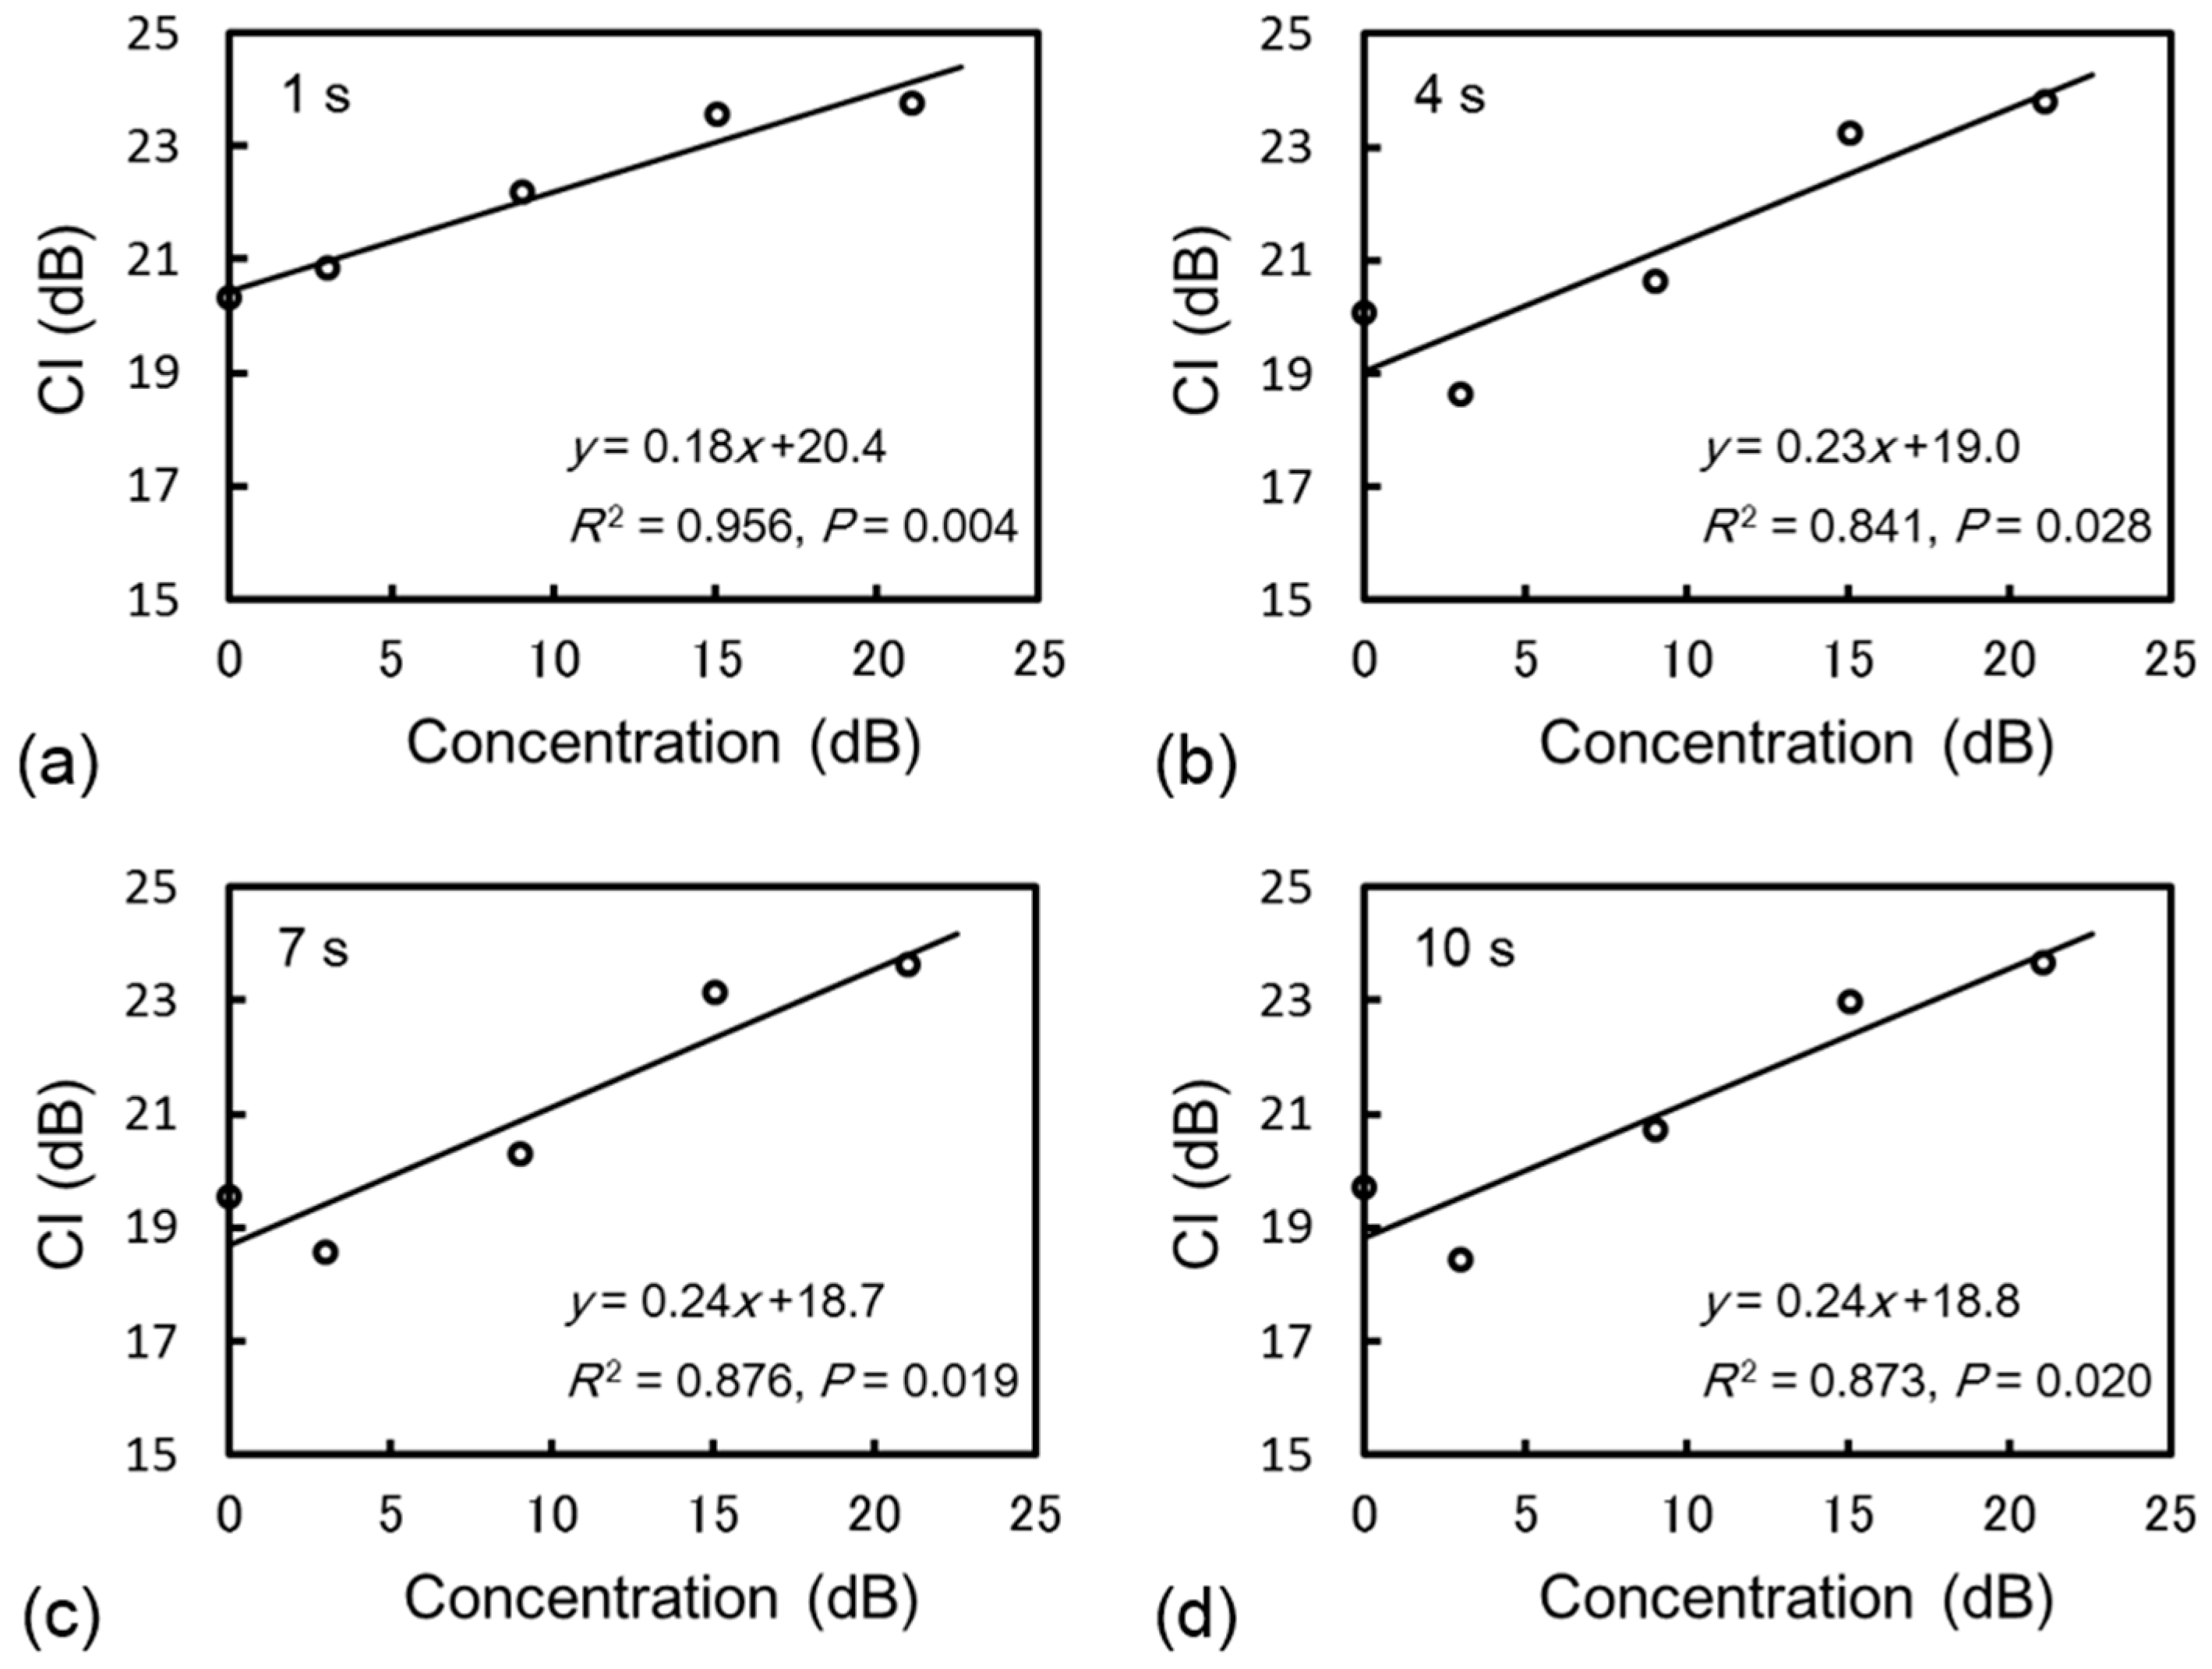
3.1. Phantom Study
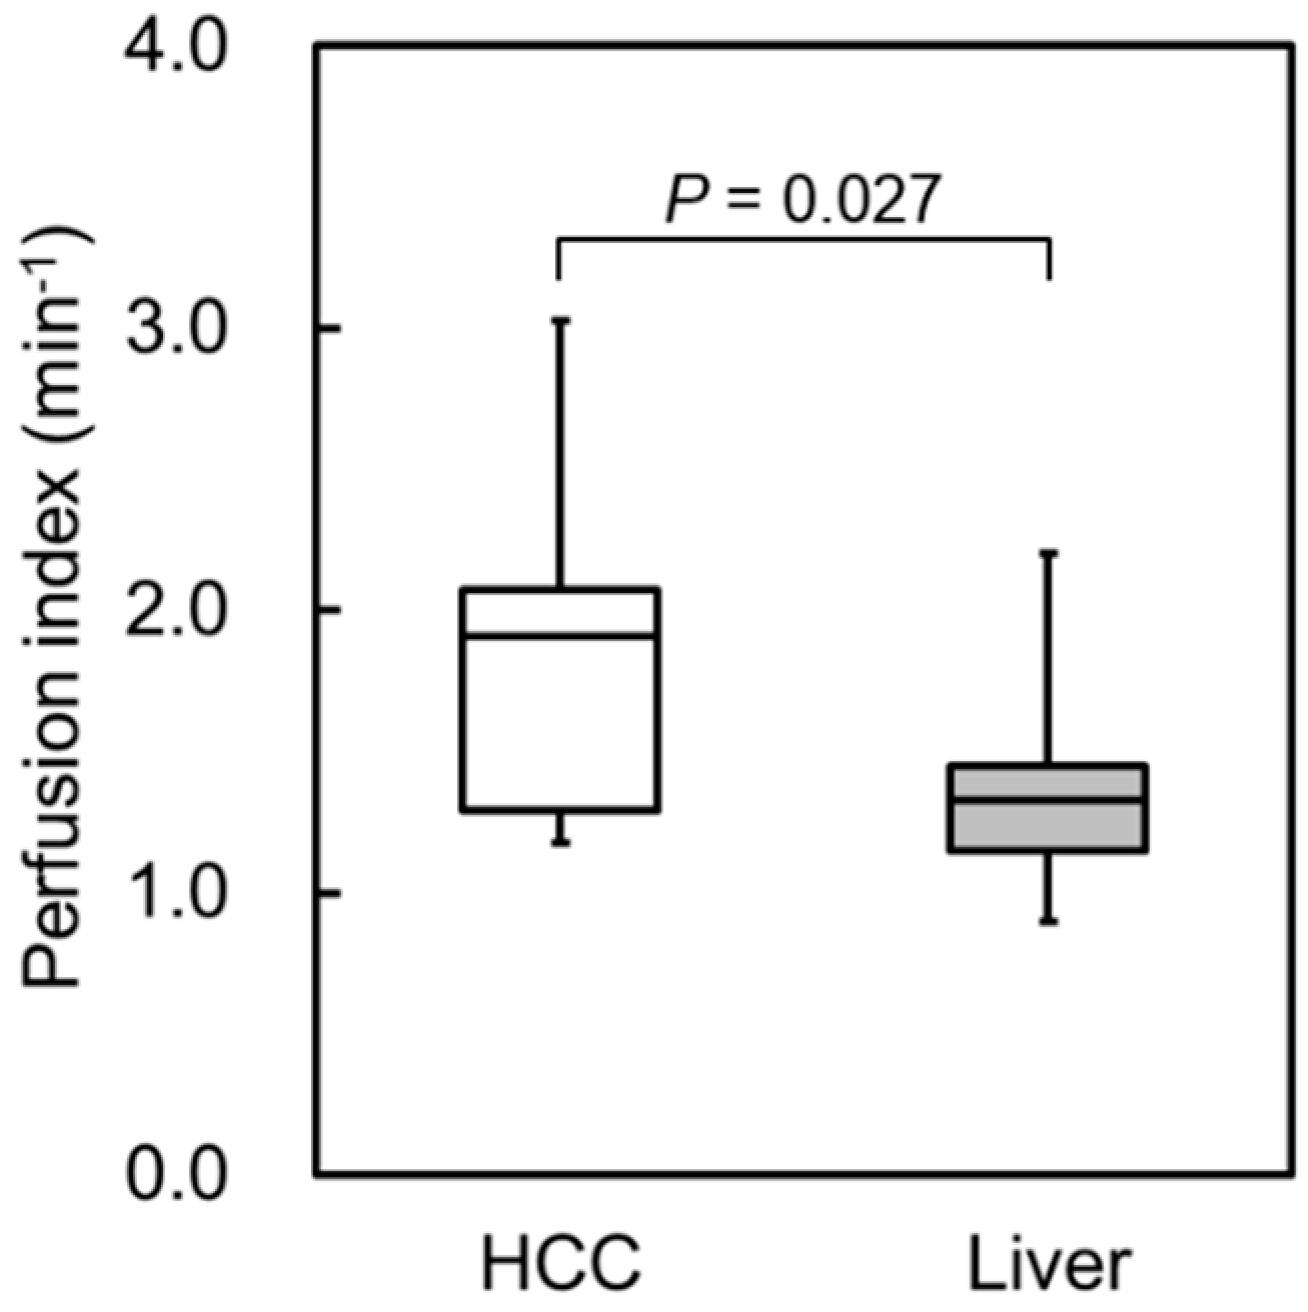
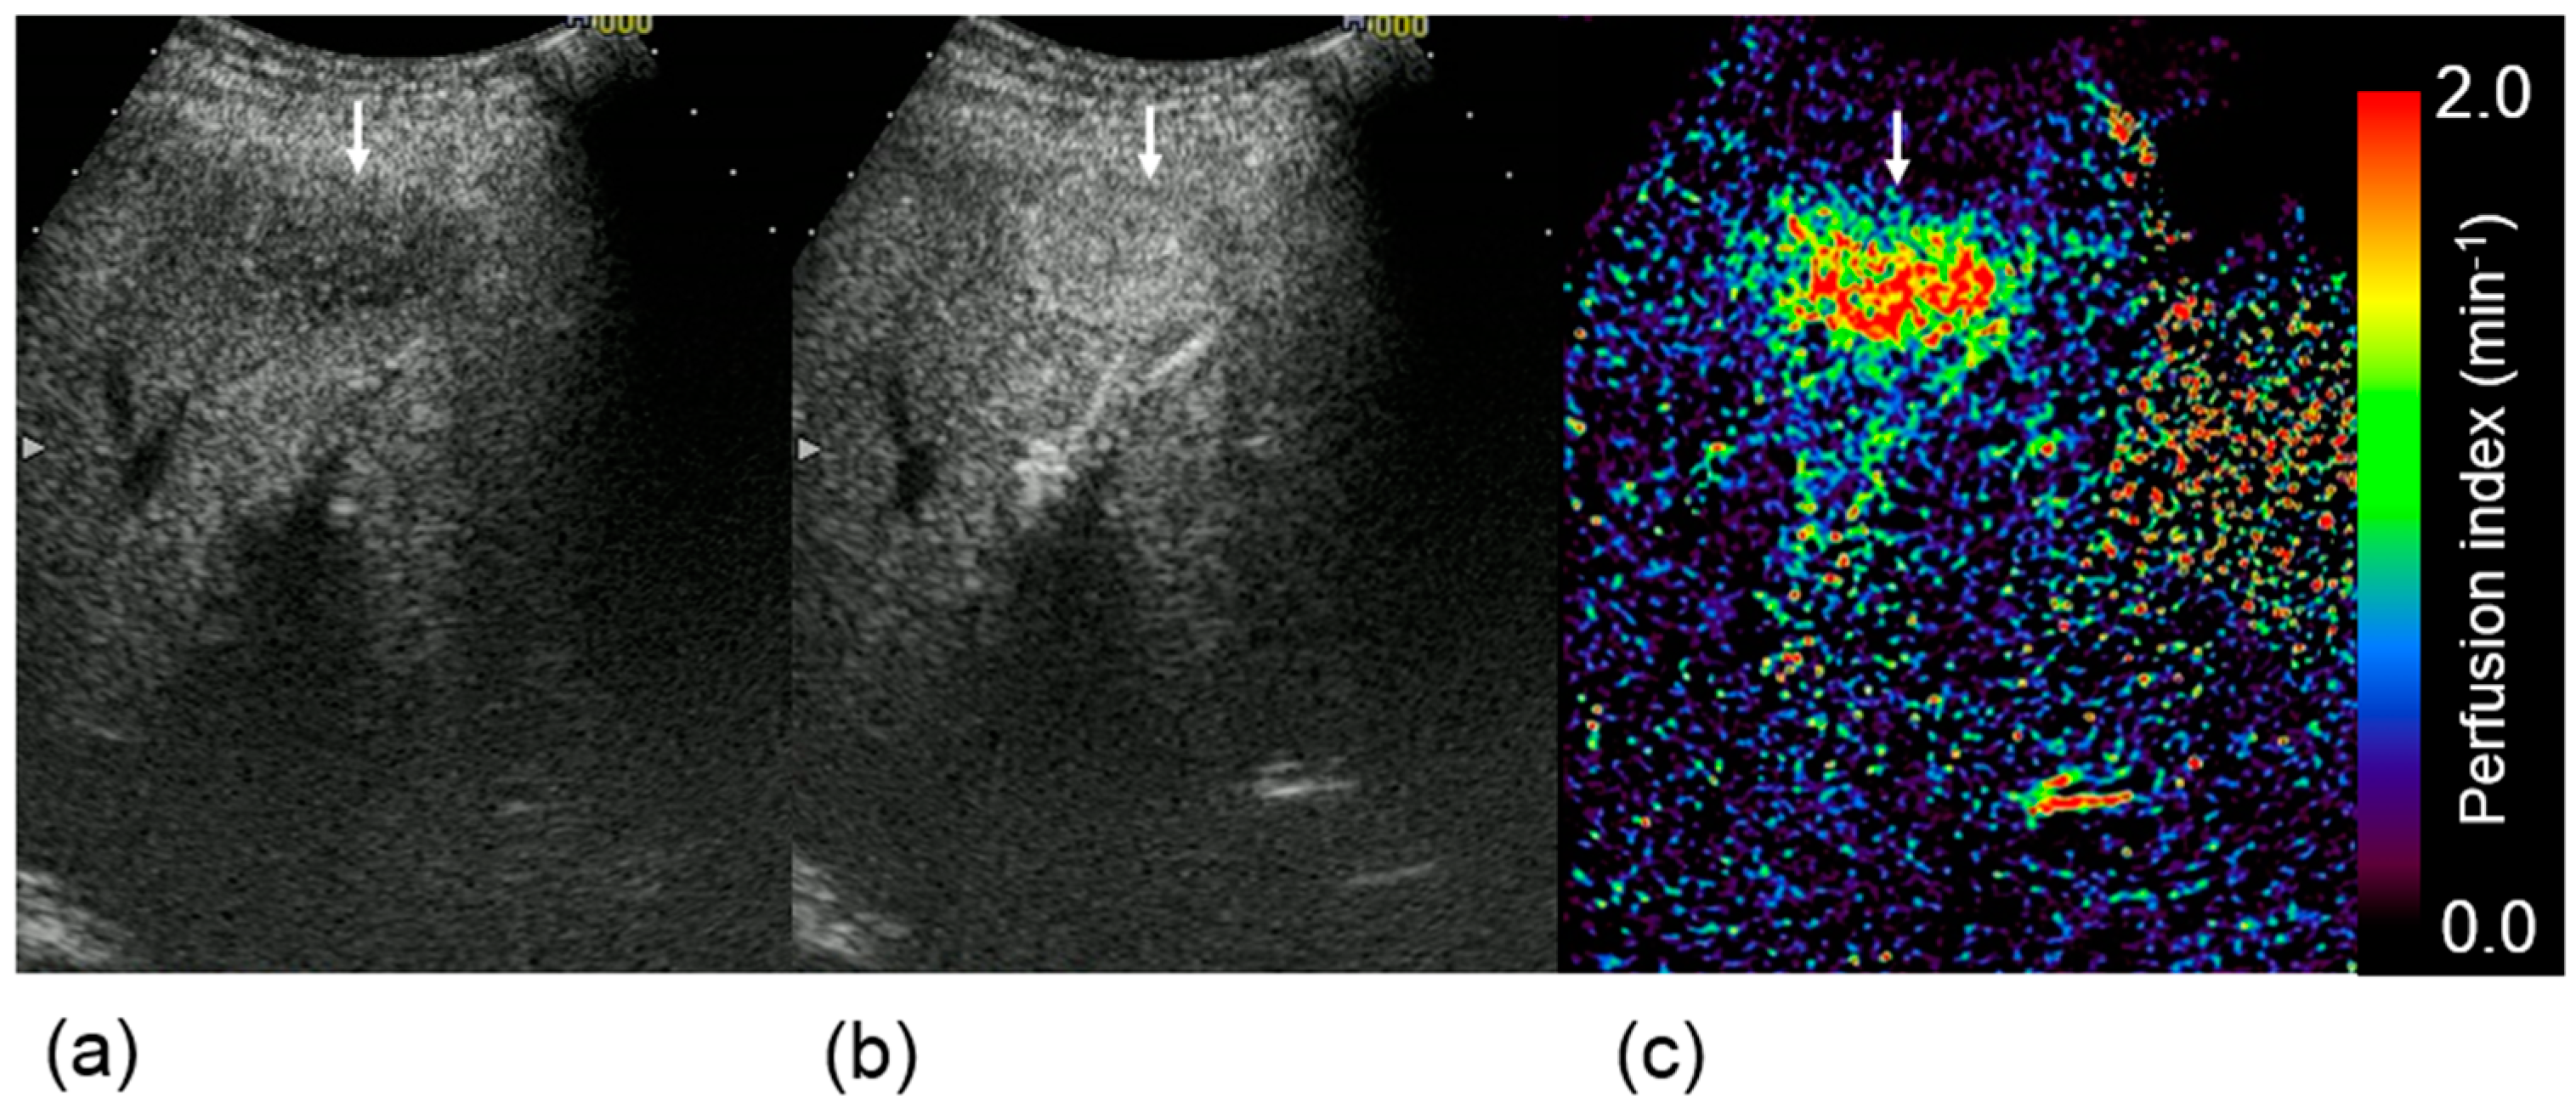
3.2. Clinical Study

4. Discussion
5. Conclusions
Conflicts of Interest
References
- Miles, K.A. Measurement of tissue perfusion by dynamic computed tomography. Br. J. Radiol. 1991, 64, 409–412. [Google Scholar] [CrossRef] [PubMed]
- Konno, K.; Ishida, H.; Sato, M.; Komatsuda, T.; Ishida, J.; Naganuma, H.; Hamashima, Y.; Watanabe, S. Liver tumors in fatty liver: Difficulty in ultrasonographic interpretation. Abdom. Imaging 2001, 26, 487–491. [Google Scholar] [CrossRef] [PubMed]
- Naganuma, H.; Funaoka, M.; Fujimori, S.; Niwa, M.; Ishida, H.; Komatsuda, T.; Yamada, M.; Furukawa, K. Contrast-enhanced sonographic findings in a case of hepatobiliary cystadenoma with intracystic bleeding. J. Clin. Ultrasound 2006, 34, 412–415. [Google Scholar] [CrossRef] [PubMed]
- Halpern, E.J.; McCue, P.A.; Aksnes, A.K.; Hagen, E.K.; Frauscher, F.; Gomella, L.G. Contrast-enhanced us of the prostate with sonazoid: Comparison with whole-mount prostatectomy specimens in 12 patients. Radiology 2002, 222, 361–366. [Google Scholar] [CrossRef] [PubMed]
- Nakamura, K.; Sasaki, N.; Yoshikawa, M.; Ohta, H.; Hwang, S.J.; Mimura, T.; Yamasaki, M.; Takiguchi, M. Quantitative contrast-enhanced ultrasonography of canine spleen. Vet. Radiol. Ultrasound 2009, 50, 104–108. [Google Scholar] [CrossRef] [PubMed]
- Aoki, S.; Hattori, R.; Yamamoto, T.; Funahashi, Y.; Matsukawa, Y.; Gotoh, M.; Yamada, Y.; Honda, N. Contrast-enhanced ultrasound using a time-intensity curve for the diagnosis of renal cell carcinoma. BJU Int. 2011, 108, 349–354. [Google Scholar] [CrossRef] [PubMed]
- Lassau, N.; Koscielny, S.; Chami, L.; Chebil, M.; Benatsou, B.; Roche, A.; Ducreux, M.; Malka, D.; Boige, V. Advanced hepatocellular carcinoma: Early evaluation of response to bevacizumab therapy at dynamic contrast-enhanced us with quantification—preliminary results. Radiology 2011, 258, 291–300. [Google Scholar] [CrossRef] [PubMed]
- Lassau, N.; Chapotot, L.; Benatsou, B.; Vilgrain, V.; Kind, M.; Lacroix, J.; Cuinet, M.; Taieb, S.; Aziza, R.; Sarran, A.; et al. Standardization of dynamic contrast-enhanced ultrasound for the evaluation of antiangiogenic therapies: The french multicenter support for innovative and expensive techniques study. Investig. Radiol. 2012, 47, 711–716. [Google Scholar] [CrossRef]
- Moriyasu, F.; Itoh, K. Efficacy of perflubutane microbubble-enhanced ultrasound in the characterization and detection of focal liver lesions: Phase 3 multicenter clinical trial. Am. J. Roentgenol. 2009, 193, 86–95. [Google Scholar] [CrossRef]
- Claudon, M.; Dietrich, C.F.; Choi, B.I.; Cosgrove, D.O.; Kudo, M.; Nolsoe, C.P.; Piscaglia, F.; Wilson, S.R.; Barr, R.G.; Chammas, M.C.; et al. Guidelines and good clinical practice recommendations for Contrast Enhanced Ultrasound (CEUS) in the liver—Update 2012: A WFUMB-EFSUMB initiative in cooperation with representatives of AFSUMB, AIUM, ASUM, FLAUS and ICUS. Ultrasound Med. Bio. 2013, 39, 187–210. [Google Scholar] [CrossRef]
- Watanabe, R.; Matsumura, M.; Chen, C.J.; Kaneda, Y.; Fujimaki, M. Characterization of tumor imaging with microbubble-based ultrasound contrast agent, sonazoid, in rabbit liver. Biol. Pharm. Bull. 2005, 28, 972–977. [Google Scholar] [CrossRef] [PubMed]
- Sugimoto, K.; Moriyasu, F.; Saito, K.; Taira, J.; Saguchi, T.; Yoshimura, N.; Oshiro, H.; Imai, Y.; Shiraishi, J. Comparison of kupffer-phase sonazoid-enhanced sonography and hepatobiliary-phase gadoxetic acid-enhanced magnetic resonance imaging of hepatocellular carcinoma and correlation with histologic grading. J. Ultrasound Med. 2012, 31, 529–538. [Google Scholar] [PubMed]
- Kudo, M.; Izumi, N.; Kokudo, N.; Matsui, O.; Sakamoto, M.; Nakashima, O.; Kojiro, M.; Makuuchi, M.; HCC Expert Panel of Japan Society of Hepatology. Management of hepatocellular carcinoma in Japan: Consensus-based clinical practice guidelines proposed by the japan society of hepatology (JSH) 2010 updated version. Dig. Dis. 2011, 29, 339–364. [Google Scholar] [CrossRef] [PubMed]
- Lassau, N.; Bonastre, J.; Kind, M.; Vilgrain, V.; Lacroix, J.; Cuinet, M.; Taieb, S.; Aziza, R.; Sarran, A.; Labbe-Devilliers, C.; et al. Validation of dynamic contrast-enhanced ultrasound in predicting outcomes of antiangiogenic therapy for solid tumors: The french multicenter support for innovative and expensive techniques study. Investig. Radiol. 2014, 49, 794–800. [Google Scholar] [CrossRef]
- Dietrich, C.F.; Averkiou, M.A.; Correas, J.M.; Lassau, N.; Leen, E.; Piscaglia, F. An EFSUMB introduction into dynamic contrast-enhanced ultrasound (DCE-US) for quantification of tumour perfusion. Ultraschall Med. 2012, 33, 344–351. [Google Scholar] [CrossRef] [PubMed]
- Mandai, M.; Koda, M.; Matono, T.; Nagahara, T.; Sugihara, T.; Ueki, M.; Ohyama, K.; Murawaki, Y. Assessment of hepatocellular carcinoma by contrast-enhanced ultrasound with perfluorobutane microbubbles: Comparison with dynamic CT. Br. J. Radiol. 2011, 84, 499–507. [Google Scholar] [CrossRef] [PubMed]
- Nishigaki, Y.; Hayashi, H.; Tomita, E.; Suzuki, Y.; Watanabe, N.; Watanabe, S.; Watanabe, C.; Takagi, Y.; Kato, T.; Naiki, T. Usefulness of contrast-enhanced ultrasonography using sonazoid for the assessment of therapeutic response to percutaneous radiofrequency ablation for hepatocellular carcinoma. Hepatol. Res. 2015, 45, 432–440. [Google Scholar] [CrossRef] [PubMed]
- Yamada, S.; Komuro, K.; Taniguchi, M.; Uranishi, A.; Komatsu, H.; Asanuma, T.; Ishikura, F.; Onozuka, H.; Mikami, T.; Tsutsui, H.; Beppu, S. A fundamental study for quantitative measurement of ultrasound contrast concentration by low mechanical index contrast ultrasonography. J. Med. Ultrasonics 2006, 33, 77–83. [Google Scholar] [CrossRef]
- Yamada, S.; Komuro, K.; Mikami, T.; Kudo, N.; Onozuka, H.; Goto, K.; Fujii, S.; Yamamoto, K.; Kitabatake, A. Novel quantitative assessment of myocardial perfusion by harmonic power doppler imaging during myocardial contrast echocardiography. Heart 2005, 91, 183–188. [Google Scholar] [CrossRef] [PubMed]
© 2015 by the authors; licensee MDPI, Basel, Switzerland. This article is an open access article distributed under the terms and conditions of the Creative Commons Attribution license (http://creativecommons.org/licenses/by/4.0/).
Share and Cite
Ohno, N.; Miyati, T.; Yamashita, M.; Narikawa, M. Quantitative Assessment of Tissue Perfusion in Hepatocellular Carcinoma Using Perflubutane Dynamic Contrast-Enhanced Ultrasonography: A Preliminary Study. Diagnostics 2015, 5, 210-218. https://doi.org/10.3390/diagnostics5020210
Ohno N, Miyati T, Yamashita M, Narikawa M. Quantitative Assessment of Tissue Perfusion in Hepatocellular Carcinoma Using Perflubutane Dynamic Contrast-Enhanced Ultrasonography: A Preliminary Study. Diagnostics. 2015; 5(2):210-218. https://doi.org/10.3390/diagnostics5020210
Chicago/Turabian StyleOhno, Naoki, Tosiaki Miyati, Makiko Yamashita, and Mayu Narikawa. 2015. "Quantitative Assessment of Tissue Perfusion in Hepatocellular Carcinoma Using Perflubutane Dynamic Contrast-Enhanced Ultrasonography: A Preliminary Study" Diagnostics 5, no. 2: 210-218. https://doi.org/10.3390/diagnostics5020210