Prolonged Waking and Recovery Sleep Affect the Serum MicroRNA Expression Profile in Humans

 ,
,
Abstract
:1. Introduction
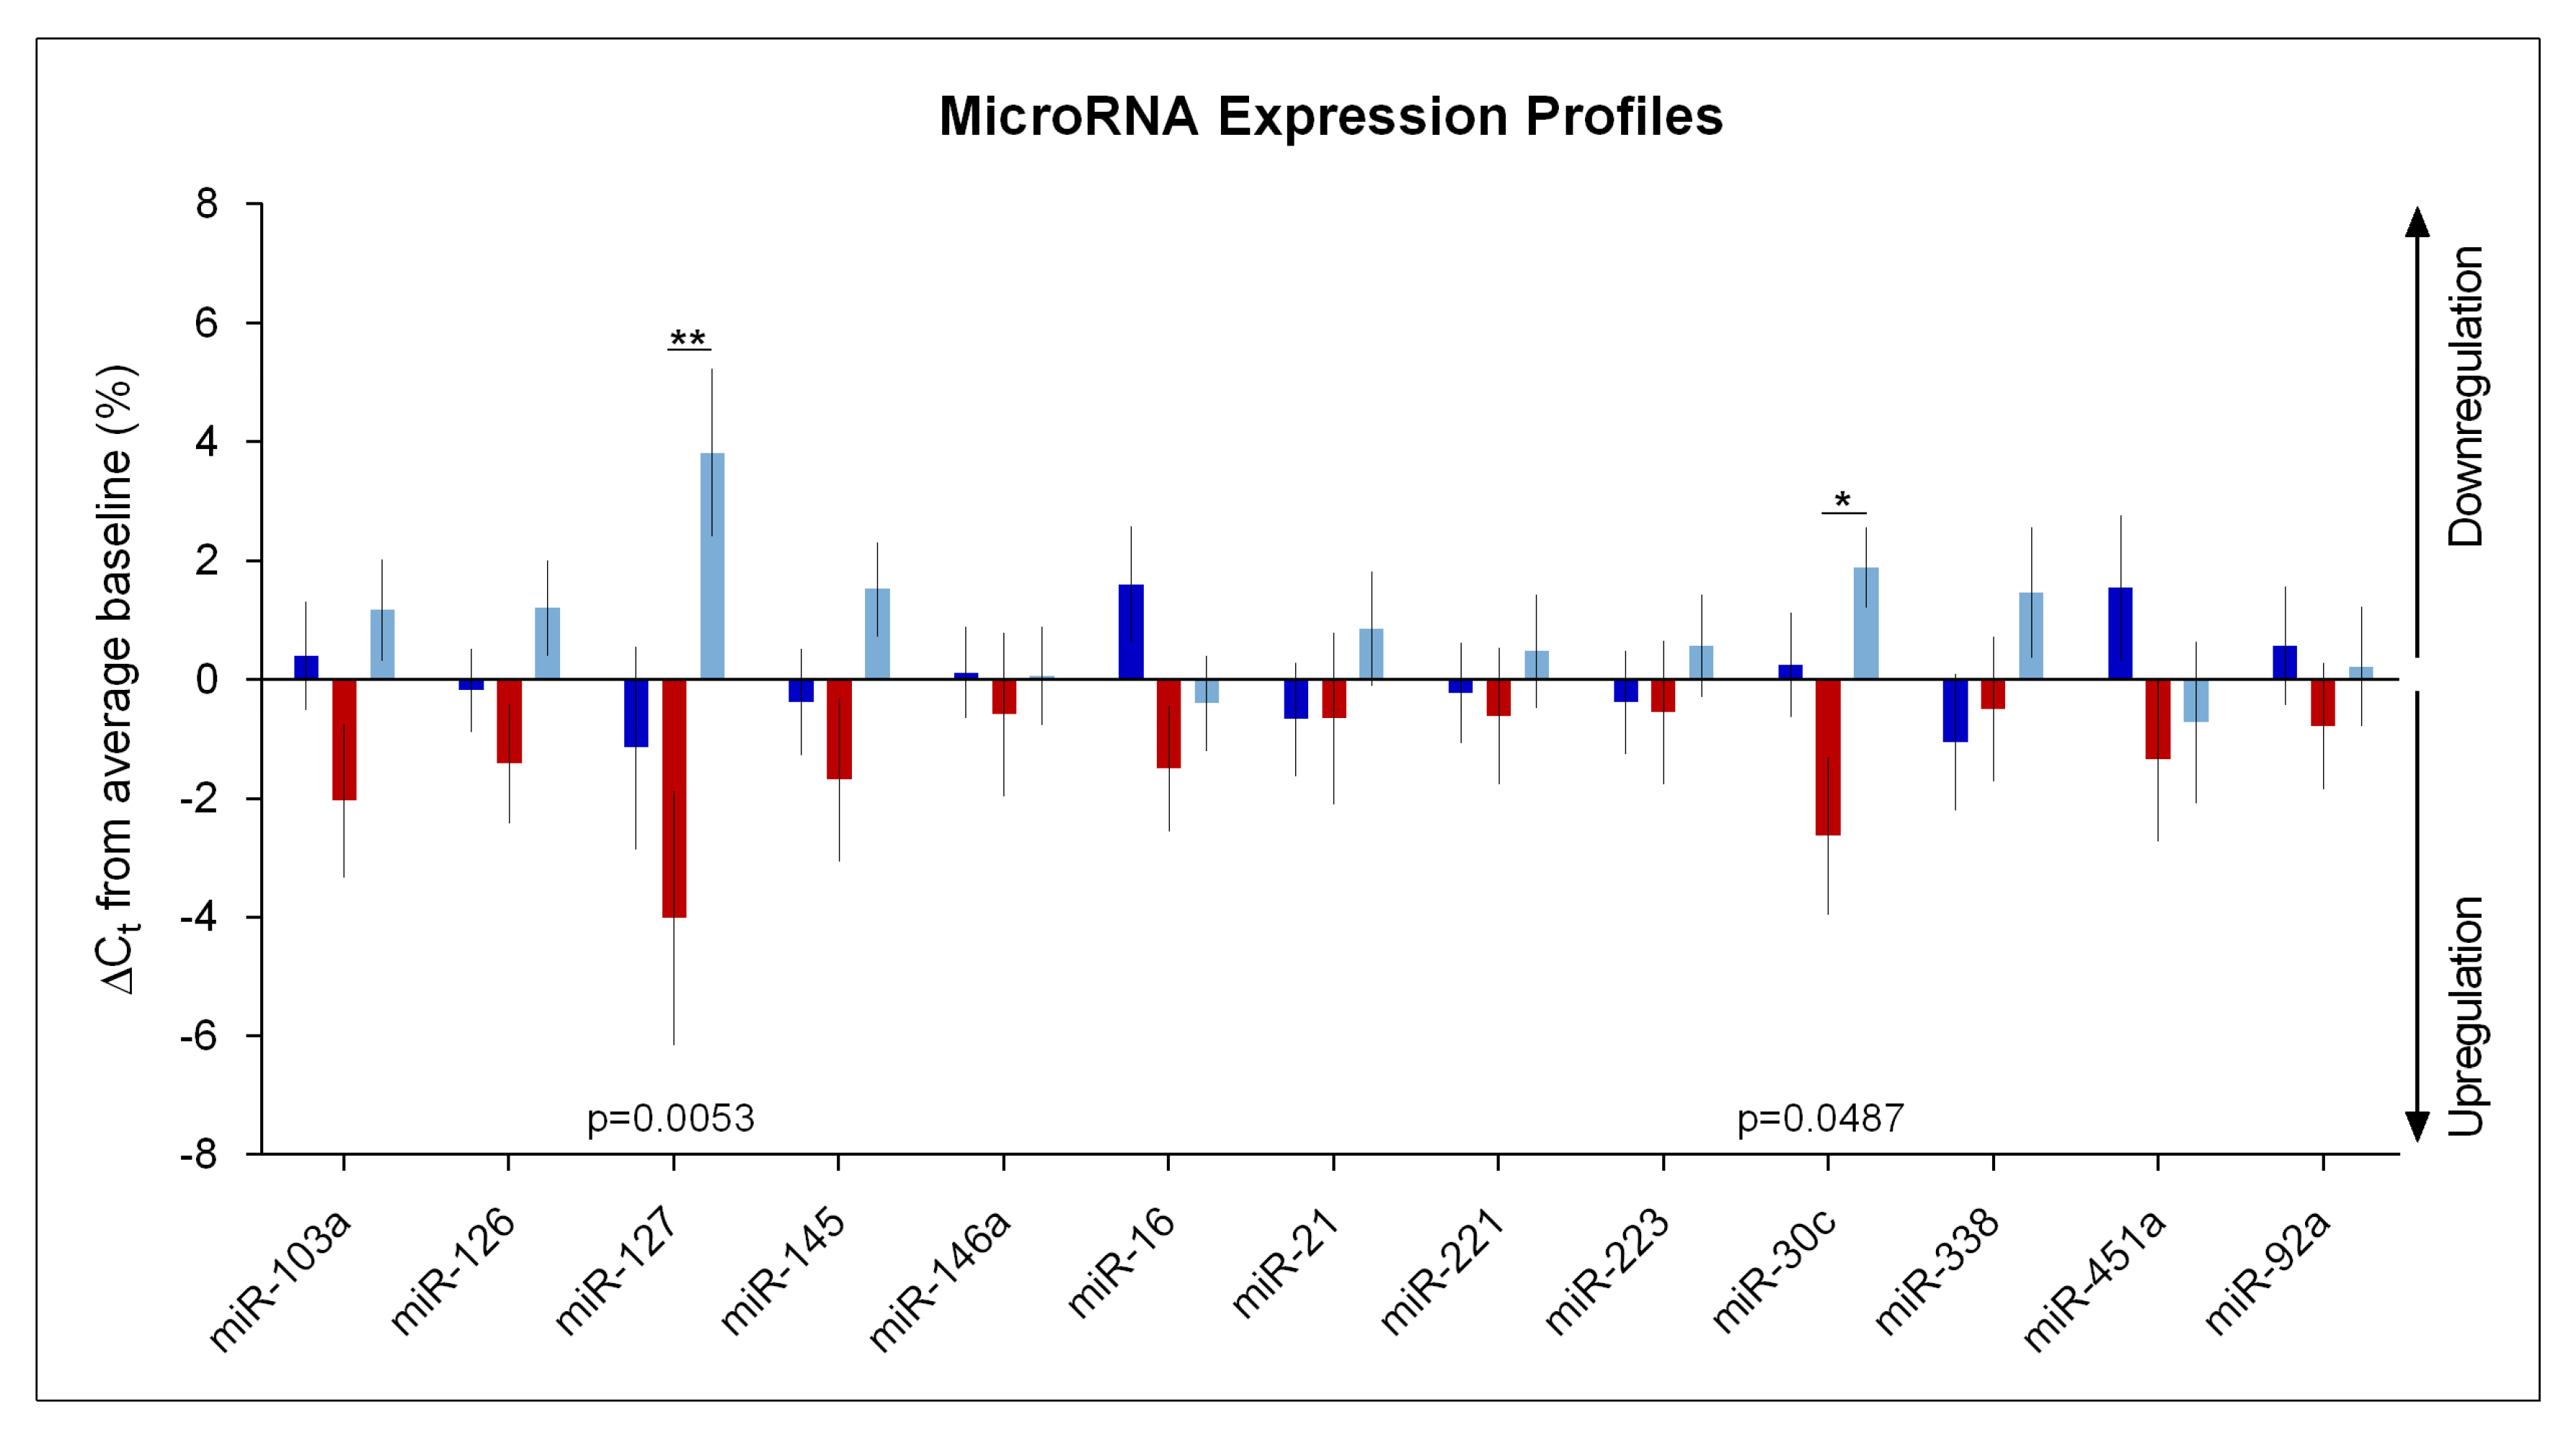
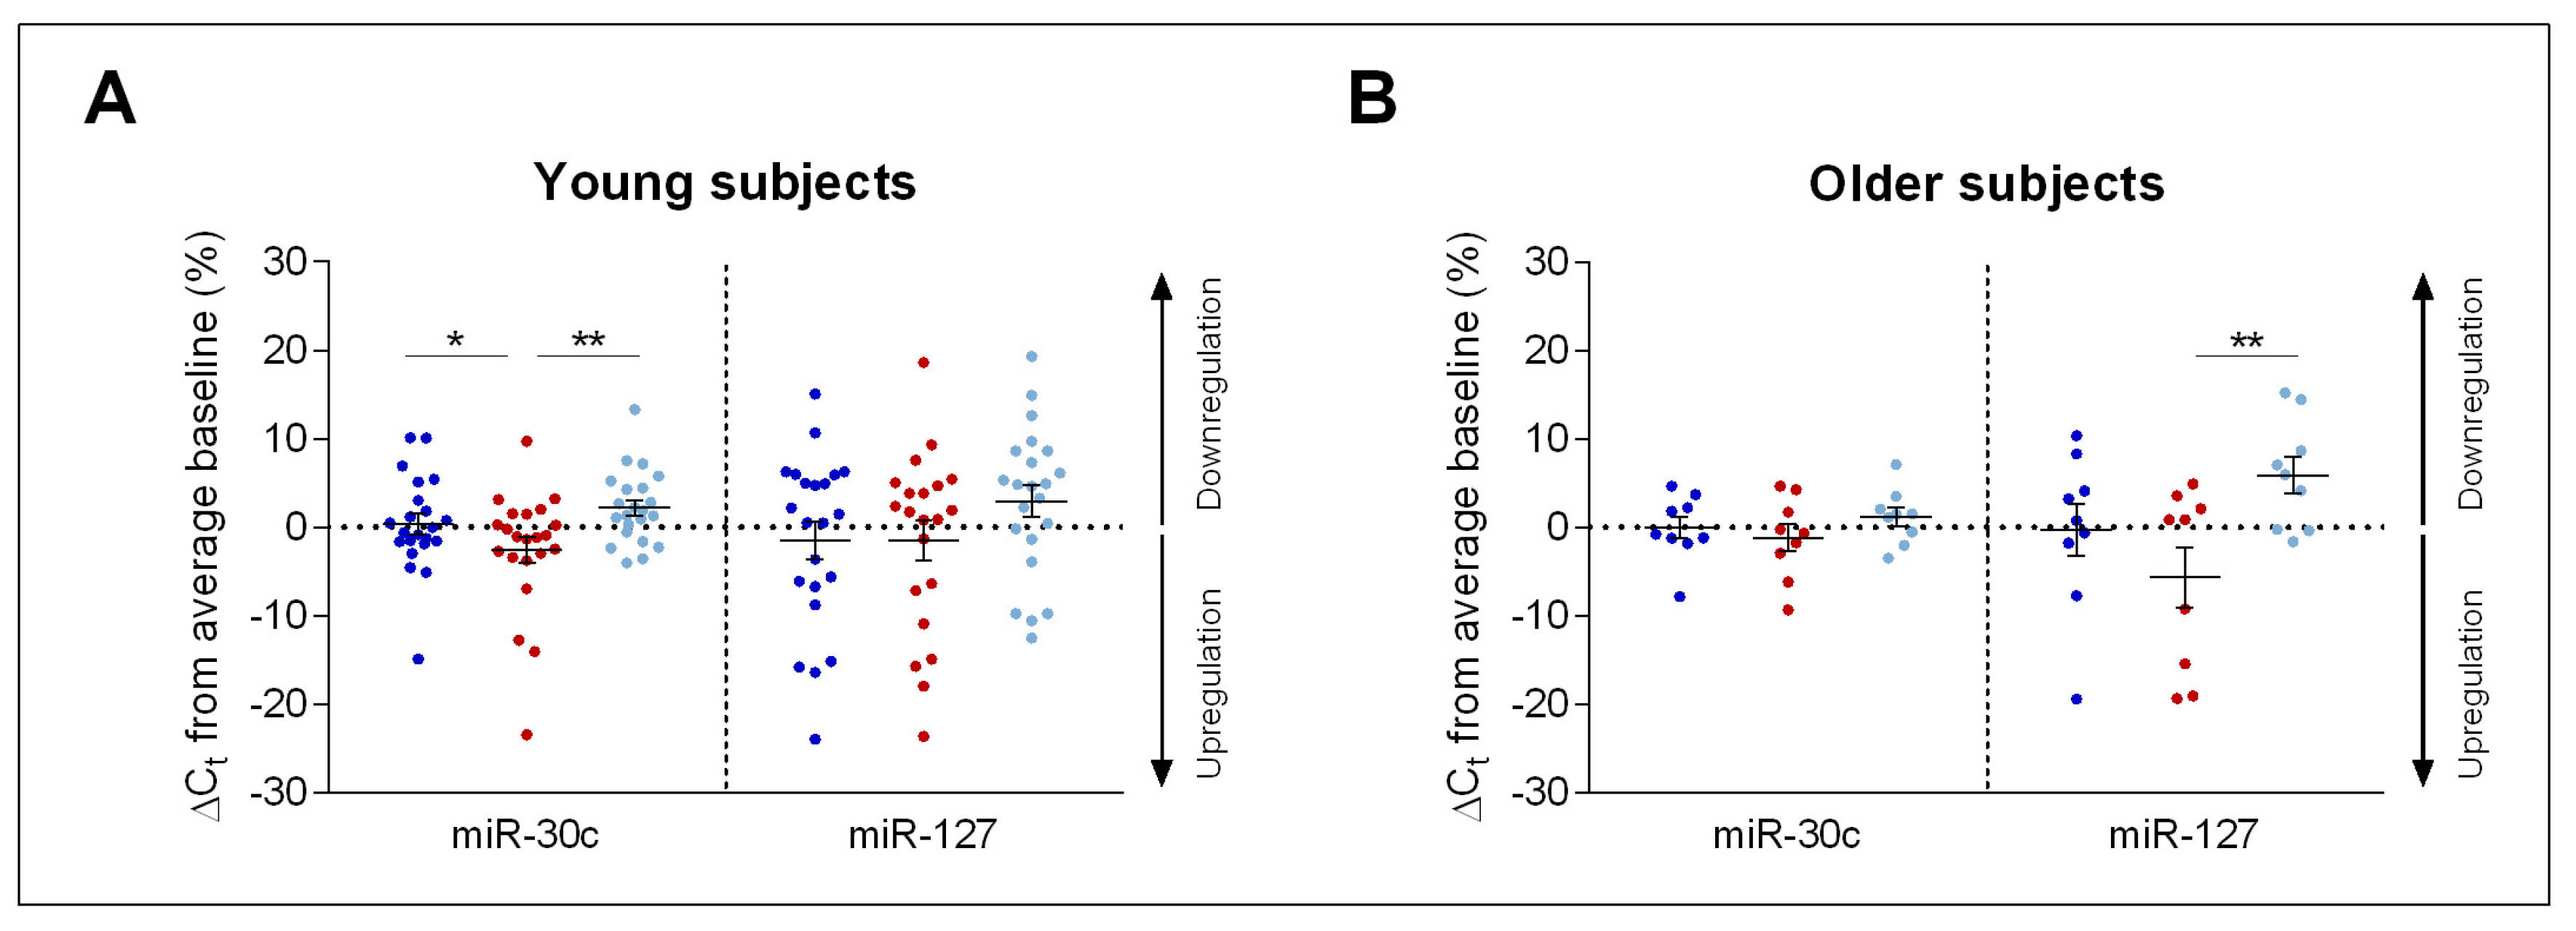
2. Results
Impact of Sleep Deprivation and Recovery Sleep on miR-30c and miR-127 Expression in Blood Serum
3. Discussion
4. Materials and Methods
4.1. Study Participants
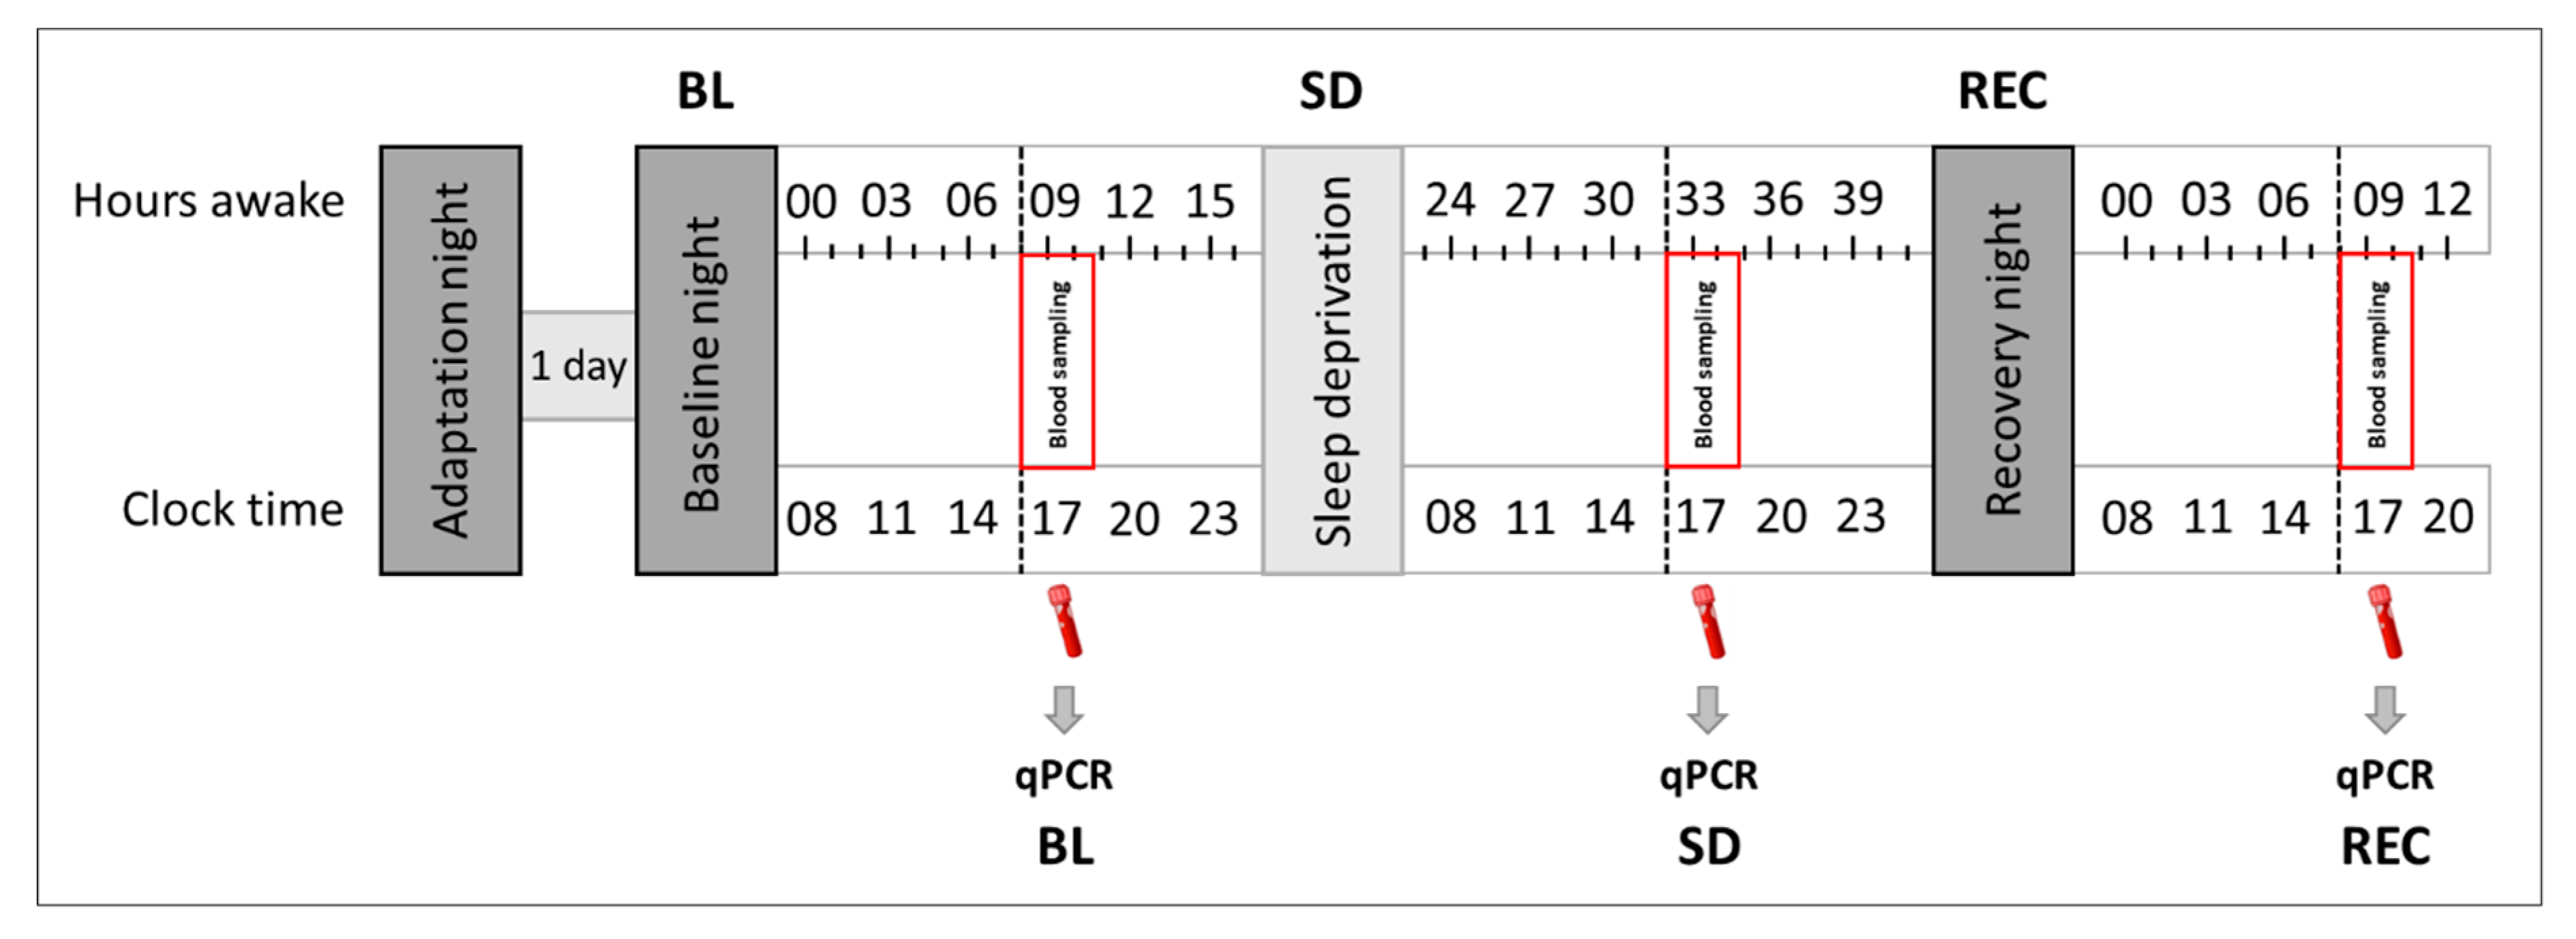
4.2. Pre-Experimental Procedure and Experimental Protocol
4.3. Assessment of miRNA
4.4. Isolation of miRNA
4.5. Quantification of Mature miRNAs
4.6. Hemolysis in Human Blood Serum Samples
4.7. Identification of Genes and Pathways
4.8. Statistical Analyses
Supplementary Materials
Author Contributions
Acknowledgments
Conflicts of Interest
References
- Ha, M.; Kim, V.N. Regulation of microRNA biogenesis. Nat. Rev. Mol. Cell. Biol. 2014, 15, 509–524. [Google Scholar] [CrossRef] [PubMed]
- Guo, H.; Ingolia, N.T.; Weissman, J.S.; Bartel, D.P. Mammalian microRNAs predominantly act to decrease target mRNA levels. Nature 2010, 466, 835–840. [Google Scholar] [CrossRef] [PubMed] [Green Version]
- Vasudevan, S.; Tong, Y.; Steitz, J.A. Switching from repression to activation: MicroRNAs can up-regulate translation. Science 2007, 318, 1931–1934. [Google Scholar] [CrossRef] [PubMed]
- Vasudevan, S.; Tong, Y.; Steitz, J.A. Cell-cycle control of microRNA-mediated translation regulation. Cell Cycle 2008, 7, 1545–1549. [Google Scholar] [CrossRef] [PubMed]
- McNeill, E.; Van Vactor, D. MicroRNAs shape the neuronal landscape. Neuron 2012, 75, 363–379. [Google Scholar] [CrossRef] [PubMed]
- Bartel, D.P. MicroRNAs: Genomics, biogenesis, mechanism, and function. Cell 2004, 116, 281–297. [Google Scholar] [CrossRef]
- Pincus, Z.; Smith-Vikos, T.; Slack, F.J. MicroRNA predictors of longevity in Caenorhabditis elegans. PLoS Genet. 2011, 7, e1002306. [Google Scholar] [CrossRef] [PubMed]
- Sredni, S.T.; Gadd, S.; Jafari, N.; Huang, C.C. A Parallel Study of mRNA and microRNA profiling of peripheral blood in young adult women. Front. Genet. 2011, 2, 49. [Google Scholar] [CrossRef] [PubMed]
- Hooten, N.N.; Abdelmohsen, K.; Gorospe, M.; Ejiogu, N.; Zonderman, A.B.; Evans, M.K. MicroRNA expression patterns reveal differential expression of target genes with age. PLoS ONE 2010, 5, e10724. [Google Scholar] [CrossRef] [PubMed]
- ElSharawy, A.; Keller, A.; Flachsbart, F.; Wendschlag, A.; Jacobs, G.; Kefer, N.; Brefort, T.; Leidinger, P.; Backes, C.; Meese, E.; et al. Genome-wide miRNA signatures of human longevity. Aging Cell 2012, 11, 607–616. [Google Scholar] [CrossRef] [PubMed] [Green Version]
- Gombar, S.; Jung, H.J.; Dong, F.; Calder, B.; Atzmon, G.; Barzilai, N.; Tian, X.L.; Pothof, J.; Hoeijmakers, J.H.; Campisi, J.; et al. Comprehensive microRNA profiling in B-cells of human centenarians by massively parallel sequencing. BMC Genomics 2012, 13, 353. [Google Scholar] [CrossRef] [PubMed] [Green Version]
- Olivieri, F.; Spazzafumo, L.; Santini, G.; Lazzarini, R.; Albertini, M.C.; Rippo, M.R.; Galeazzi, R.; Abbatecola, A.M.; Marcheselli, F.; Monti, D.; et al. Age-related differences in the expression of circulating microRNAs: miR-21 as a new circulating marker of inflammaging. Mech. Ageing Dev. 2012, 133, 675–685. [Google Scholar] [CrossRef] [PubMed]
- Serna, E.; Gambini, J.; Borras, C.; Abdelaziz, K.M.; Belenguer, A.; Sanchis, P.; Avellana, J.A.; Rodriguez-Manas, L.; Vina, J. Centenarians, but not octogenarians, up-regulate the expression of microRNAs. Sci Rep. 2012, 2, 961. [Google Scholar] [CrossRef] [PubMed]
- Hooten, N.N.; Fitzpatrick, M.; Wood, W.H., 3rd; De, S.; Ejiogu, N.; Zhang, Y.; Mattison, J.A.; Becker, K.G.; Zonderman, A.B.; Evans, M.K. Age-related changes in microRNA levels in serum. Aging 2013, 5, 725–740. [Google Scholar] [CrossRef] [PubMed] [Green Version]
- Weilner, S.; Schraml, E.; Redl, H.; Grillari-Voglauer, R.; Grillari, J. Secretion of microvesicular miRNAs in cellular and organismal aging. Exp. Gerontol. 2013, 48, 626–633. [Google Scholar] [CrossRef] [PubMed]
- Smith-Vikos, T.; Liu, Z.; Parsons, C.; Gorospe, M.; Ferrucci, L.; Gill, T.M.; Slack, F.J. A serum miRNA profile of human longevity: findings from the Baltimore Longitudinal Study of Aging (BLSA). Aging 2016, 8, 2971–2987. [Google Scholar] [CrossRef] [PubMed] [Green Version]
- Goodwin, P.R.; Meng, A.; Moore, J.; Hobin, M.; Fulga, T.A.; Van Vactor, D.; Griffith, L.C. MicroRNAs Regulate Sleep and Sleep Homeostasis in Drosophila. Cell Rep. 2018, 23, 3776–3786. [Google Scholar] [CrossRef] [PubMed]
- Pawlyk, A.C.; Ferber, M.; Shah, A.; Pack, A.I.; Naidoo, N. Proteomic analysis of the effects and interactions of sleep deprivation and aging in mouse cerebral cortex. J Neurochem. 2007, 103, 2301–2313. [Google Scholar] [CrossRef] [PubMed] [Green Version]
- Poirrier, J.E.; Guillonneau, F.; Renaut, J.; Sergeant, K.; Luxen, A.; Maquet, P.; Leprince, P. Proteomic changes in rat hippocampus and adrenals following short-term sleep deprivation. Proteome Sci. 2008, 6, 14. [Google Scholar] [CrossRef] [PubMed]
- Cirelli, C.; Pfister-Genskow, M.; McCarthy, D.; Woodbury, R.; Tononi, G. Proteomic profiling of the rat cerebral cortex in sleep and waking. Arch. Ital. Biol. 2009, 147, 59–68. [Google Scholar] [PubMed]
- Borbély, A.A.; Baumann, F.; Brandeis, D.; Strauch, I.; Lehmann, D. Sleep deprivation: Effect on sleep stages and EEG power density in man. Electroencephalogr. Clin. Neurophysiol. 1981, 51, 483–495. [Google Scholar] [CrossRef]
- Borbély, A.A. A two process model of sleep regulation. Hum. Neurobiol. 1982, 1, 195–204. [Google Scholar] [PubMed]
- Borbély, A.A.; Achermann, P. Sleep homeostasis and models of sleep regulation. In Principles and Practice of Sleep Medicine; Kryger, M.H., Roth, T., Dement, W.C., Eds.; Elsevier Saunders: Philadelphia, PA, USA, 2017; pp. 405–417. [Google Scholar]
- Davis, C.J.; Bohnet, S.G.; Meyerson, J.M.; Krueger, J.M. Sleep loss changes microRNA levels in the brain: A possible mechanism for state-dependent translational regulation. Neurosci. Lett. 2007, 422, 68–73. [Google Scholar] [CrossRef] [PubMed] [Green Version]
- Gharib, S.A.; Khalyfa, A.; Abdelkarim, A.; Bhushan, B.; Gozal, D. Integrative miRNA-mRNA profiling of adipose tissue unravels transcriptional circuits induced by sleep fragmentation. PLoS ONE 2012, 7, e37669. [Google Scholar] [CrossRef] [PubMed]
- Mongrain, V.; Hernandez, S.A.; Pradervand, S.; Dorsaz, S.; Curie, T.; Hagiwara, G.; Gip, P.; Heller, H.C.; Franken, P. Separating the contribution of glucocorticoids and wakefulness to the molecular and electrophysiological correlates of sleep homeostasis. Sleep 2010, 33, 1147–1157. [Google Scholar] [CrossRef] [PubMed]
- Davis, C.J.; Clinton, J.M.; Taishi, P.; Bohnet, S.G.; Honn, K.A.; Krueger, J.M. MicroRNA 132 alters sleep and varies with time in brain. J. Appl. Physiol. 2011, 111, 665–672. [Google Scholar] [CrossRef] [PubMed] [Green Version]
- Davis, C.J.; Clinton, J.M.; Krueger, J.M. MicroRNA 138, let-7b, and 125a inhibitors differentially alter sleep and EEG delta-wave activity in rats. J. Appl. Physiol. 2012, 113, 1756–1762. [Google Scholar] [CrossRef] [PubMed] [Green Version]
- Bliwise, D.L. Sleep in normal aging and dementia. Sleep 1993, 16, 40–81. [Google Scholar] [CrossRef] [PubMed]
- Blois, R.; Feinberg, I.; Gaillard, J.M.; Kupfer, D.J.; Webb, W.B. Sleep in normal and pathological aging. Experientia 1983, 39, 551–558. [Google Scholar] [CrossRef] [PubMed]
- Landolt, H.P.; Dijk, D.J.; Achermann, P.; Borbely, A.A. Effect of age on the sleep EEG: Slow-wave activity and spindle frequency activity in young and middle-aged men. Brain Res. 1996, 738, 205–212. [Google Scholar] [CrossRef]
- Landolt, H.P.; Borbély, A.A. Age-dependent changes in sleep EEG topography. Clin. Neurophysiol. 2001, 112, 369–377. [Google Scholar] [CrossRef]
- Adam, M.; Rétey, J.V.; Khatami, R.; Landolt, H.P. Age-related changes in the time course of vigilant attention during 40 hours without sleep in men. Sleep 2006, 29, 55–57. [Google Scholar] [CrossRef] [PubMed]
- Landolt, H.P.; Rétey, J.V.; Adam, M. Reduced neurobehavioral impairment from sleep deprivation in older adults: Contribution of adenosinergic mechanism. Front. Neurol. 2012, 3, 62. [Google Scholar] [CrossRef] [PubMed] [Green Version]
- Duffy, J.F.; Willson, H.J.; Wang, W.; Czeisler, C.A. Healthy older adults better tolerate sleep deprivation than young adults. J. Am. Geriatr. Soc. 2009, 57, 1245–1251. [Google Scholar] [CrossRef] [PubMed]
- Holm, A.; Bang-Berthelsen, C.H.; Knudsen, S.; Kornum, B.R.; Modvig, S.; Jennum, P.; Gammeltoft, S. miRNA profiles in plasma from patients with sleep disorders reveal dysregulation of miRNAs in narcolepsy and other central hypersomnias. Sleep 2014, 37, 1525–1533. [Google Scholar] [CrossRef] [PubMed]
- Hood, B.; Bruck, D. A comparison of sleep deprivation and narcolepsy in terms of complex cognitive performance and subjective sleepiness. Sleep Med. 2002, 3, 259–266. [Google Scholar] [CrossRef] [Green Version]
- Thomann, J.; Baumann, C.R.; Landolt, H.P.; Werth, E. Psychomotor Vigilance Task demonstrates impaired vigilance in disorders with excessive daytime sleepiness. J. Clin. Sleep Med. 2014, 10, 1019–1024. [Google Scholar] [CrossRef] [PubMed]
- Jentzsch, C.; Leierseder, S.; Loyer, X.; Flohrschütz, I.; Sassi, Y.; Hartmann, D.; Thum, T.; Laggerbauer, B.; Engelhardt, S. A phenotypic screen to identify hypertrophy-modulating microRNAs in primary cardiomyocytes. J. Mol. Cell. Cardiol. 2012, 52, 13–20. [Google Scholar] [CrossRef] [PubMed]
- Holm, A.; Bang-Berthelsen, C.H.; Knudsen, S.; Modvig, S.; Kornum, B.R.; Gammeltoft, S.; Jennum, P.J. MiRNA profiles in cerebrospinal fluid from patients with central hypersomnias. J. Neurol. Sci. 2014, 347, 199–204. [Google Scholar] [CrossRef] [PubMed]
- Grimaldi, D.; Calandra-Buonaura, G.; Provini, F.; Agati, P.; Pierangeli, G.; Franceschini, C.; Barletta, G.; Plazzi, G.; Montagna, P.; Cortelli, P. Abnormal sleep-cardiovascular system interaction in narcolepsy with cataplexy: Effects of hypocretin deficiency in humans. Sleep 2012, 35, 519–528. [Google Scholar] [CrossRef] [PubMed]
- Sorensen, G.L.; Knudsen, S.; Petersen, E.R.; Kempfner, J.; Gammeltoft, S.; Sorensen, H.B.; Jennum, P. Attenuated heart rate response is associated with hypocretin deficiency in patients with narcolepsy. Sleep 2013, 36, 91–98. [Google Scholar] [CrossRef] [PubMed]
- Mullington, J.M.; Haack, M.; Toth, M.; Serrador, J.M.; Meier-Ewert, H.K. Cardiovascular, inflammatory, and metabolic consequences of sleep deprivation. Prog. Cardiovasc. Dis. 2009, 51, 294–302. [Google Scholar] [CrossRef] [PubMed]
- Holst, S.C.; Landolt, H.P. Sleep–Wake Neurochemistry. Sleep Med. Clin. 2018, 13, 137–146. [Google Scholar] [CrossRef] [PubMed]
- Dallmann, R.; Viola, A.U.; Tarokh, L.; Cajochen, C.; Brown, S.A. The human circadian metabolome. Proc. Natl. Acad. Sci. USA 2012, 109, 2625–2629. [Google Scholar] [CrossRef] [PubMed] [Green Version]
- Davies, S.K.; Ang, J.E.; Revell, V.L.; Holmes, B.; Mann, A.; Robertson, F.P.; Cui, N.; Middleton, B.; Ackermann, K.; Kayser, M.; et al. Effect of sleep deprivation on the human metabolome. Proc. Natl. Acad. Sci. USA 2014, 111, 10761–10766. [Google Scholar] [CrossRef] [PubMed] [Green Version]
- Chen, J.; Wang, M.; Guo, M.; Xie, Y.; Cong, Y.S. miR-127 regulates cell proliferation and senescence by targeting BCL6. PLoS ONE 2013, 8, e80266. [Google Scholar] [CrossRef] [PubMed]
- Nilsson, E.K.; Boström, A.E.; Mwinyi, J.; Schiöth, H.B. Epigenomics of total acute sleep deprivation in relation to genome-wide DNA methylation profiles and RNA expression. OMICS 2016, 20, 334–342. [Google Scholar] [CrossRef] [PubMed]
- Massart, R.; Freyburger, M.; Suderman, M.; Paquet, J.; El Helou, J.; Belanger-Nelson, E.; Rachalski, A.; Koumar, O.C.; Carrier, J.; Szyf, M.; et al. The genome-wide landscape of DNA methylation and hydroxymethylation in response to sleep deprivation impacts on synaptic plasticity genes. Transl. Psychiatry 2014, 4, e347. [Google Scholar] [CrossRef] [PubMed]
- Vecsey, C.G.; Peixoto, L.; Choi, J.H.; Wimmer, M.; Jaganath, D.; Hernandez, P.J.; Blackwell, J.; Meda, K.; Park, A.J.; Hannenhalli, S.; et al. Genomic analysis of sleep deprivation reveals translational regulation in the hippocampus. Physiol. Genomics 2012, 44, 981–991. [Google Scholar] [CrossRef] [PubMed] [Green Version]
- EFSA NDA Panel (EFSA Panel on Dietetic Products, Nutrition and Allergies). Scientific Opinion on the safety of caffeine. EFSA J. 2015, 13, 4102. [Google Scholar] [Green Version]
- Horne, J.A.; Ostberg, O. A self-assessment questionnaire to determine morningness-eveningness in human circadian rhythms. Int. J. Chronobiol. 1976, 4, 97–110. [Google Scholar] [PubMed]
- Spielberger, C.D.; Gorsuch, R.L.; Lushene, R.E. Manual for the State-Trait Anxiety Inventory; Consulting Psychologists Press: Palo Alto, CA, USA, 1970. [Google Scholar]
- Francis, L.J.; Lewis, C.A.; Ziebertz, H. The short-form revised Eysenck personality Questionnaire (EPQ-S): A German edition. Available online: https://glyndwr.collections.crest.ac.uk/335/ (accessed on 10 October 2018).
- Bloch, K.E.; Schoch, O.D.; Zhang, J.N.; Russi, E.W. German version of the Epworth Sleepiness Scale. Respiration 1999, 66, 440–447. [Google Scholar] [CrossRef] [PubMed]
- Beck, A.T.; Ward, C.H.; Mendelson, M.; Mock, J.; Erbaugh, J. An inventory for measuring depression. Arch. Gen. Psychiatry 1961, 4, 561–571. [Google Scholar] [CrossRef] [PubMed]
- Nasreddine, Z.S.; Phillips, N.A.; Bédirian, V.; Charbonneau, S.; Whitehead, V.; Collin, I.; Cummings, J.L.; Chertkow, H. The Montreal Cognitive Assessment, MoCA: A brief screening tool for mild cognitive impairment. J. Am. Geriatr. Soc. 2005, 53, 695–699. [Google Scholar] [CrossRef] [PubMed]
- Buysse, D.J.; Reynolds, C.F., III; Monk, T.H.; Berman, S.R.; Kupfer, D.J. The Pittsburgh Sleep Quality Index: A new instrument for psychiatric practice and research. Psychiatry Res. 1989, 28, 193–213. [Google Scholar] [CrossRef]
- Dinges, D.F.; Powell, J.W. Microcomputer analyses of performance on a portable, simple visual RT task during sustained operations. Behav. Res. Meth. Instr. 1985, 17, 652–655. [Google Scholar] [CrossRef] [Green Version]
- Akerstedt, T.; Gillberg, M. Subjective and objective sleepiness in the active individual. Int. J. Neurosci. 1990, 52, 29–37. [Google Scholar] [CrossRef] [PubMed]
- Schulz, H.; Volk, S.; Yassouridis, A. Measuring tiredness by symptoms. Sleep Res. 1991, 20A, 515. [Google Scholar]
- Hoddes, E.; Zarcone, V.; Smythe, H.; Phillips, R.; Dement, W.C. Quantification of sleepiness: A new approach. Psychophysiology 1973, 10, 431–436. [Google Scholar] [CrossRef] [PubMed]
- Schmittgen, T.D.; Livak, K.J. Analyzing real-time PCR data by the comparative CT method. Nat. Protocol. 2008, 3, 1101–1108. [Google Scholar] [CrossRef]
- Kirschner, M.B.; Kao, S.C.; Edelman, J.J.; Armstrong, N.J.; Vallely, M.P.; van Zandwijk, N.; Reid, G. Haemolysis during Sample Preparation Alters microRNA Content of Plasma. PLoS ONE 2011, 6, e24145. [Google Scholar] [CrossRef] [PubMed]
- Blondal, T.; Nielsen, S.J.; Baker, A.; Andreasen, D.; Mouritzen, P.; Teilum, M.W.; Dahlsveen, I.K. Assessing sample and miRNA profile quality in serum and plasma or other biofluids. Methods 2013, 59, S1–S6. [Google Scholar] [CrossRef] [PubMed]
- Exiqon, Vedbaek Denmark (v1.0–12/2015). Available online: https://www.exiqon.com/ls/Documents/Scientific/microRNA-serum-plasma-guidelines.pdf (accessed on 10 October 2018).
- Wong, N.; Wang, X. miRDB: An online resource for microRNA target prediction and functional annotations. Nucleic Acids Res. 2015, 43, D146–D152. [Google Scholar] [CrossRef] [PubMed]
- Wang, X. Improving microRNA target prediction by modeling with unambiguously identified microRNA-target pairs from CLIP-ligation studies. Bioinformatics 2016, 32, 1316–1322. [Google Scholar] [CrossRef] [PubMed] [Green Version]
- Agarwal, V. Predicting effective microRNA target sites in mammalian mRNAs. Elife 2015, 4, e05005. [Google Scholar] [CrossRef] [PubMed]
- Mi, H.; Dong, Q.; Muruganujan, A.; Gaudet, P.; Lewis, S.; Thomas, P.D. PANTHER version 7: Improved phylogenetic trees, orthologs and collaboration with the Gene Ontology Consortium. Nucleic Acids Res. 2010, 38, D204–D210. [Google Scholar] [CrossRef] [PubMed]
- Mi, H.; Huang, X.; Muruganujan, A.; Tang, H.; Mills, C.; Kang, D.; Thomas, P.D. PANTHER version 11: Expanded annotation data from Gene Ontology and Reactome pathways, and data analysis tool enhancements. Nucleic Acids Res. 2016, 45, D183–D189. [Google Scholar] [CrossRef] [PubMed]

| miRNA | Factor | F-Value | p-Value (Uncorrected) | p-Value (Corrected) |
|---|---|---|---|---|
| miR103a-3p | Condition | F2,57 = 2.29 | 0.07 | 0.11 |
| Age Condition x Age | F1,57 = 0.00 F2,57 = 0.57 | 0.89 0.49 | 0.99 0.57 | |
| miR126-3p | Condition | F2,57 = 0.82 | 0.23 | 0.45 |
| Age Condition x Age | F1,57 = 0.02 F2,57 = 1.25 | 0.65 0.11 | 0.89 0.29 | |
| miR127-3p | Condition | F2,57 = 5.76 | 0.0001 | 0.005 |
| Age Condition x Age | F1,57 = 0.00 F2,57 = 0.97 | 0.91 0.24 | 0.97 0.38 | |
| miR145-5p | Condition | F2,57 = 1.10 | 0.23 | 0.34 |
| Age Condition x Age | F1,57 = 0.01 F2,57 = 0.46 | 0.82 0.51 | 0.91 0.64 | |
| miR146a-5p | Condition | F2,57 = 0.04 | 0.90 | 0.96 |
| Age Condition x Age | F1,57 = 0.02 F2,57 = 0.18 | 0.92 0.73 | 0.89 0.84 | |
| miR16-5p | Condition | F2,57 = 1.58 | 0.07 | 0.22 |
| Age Condition x Age | F1,57 = 0.01 F2,57 = 2.24 | 0.82 0.08 | 0.91 0.10 | |
| miR21-5p | Condition | F2,57 = 0.56 | 0.31 | 0.58 |
| Age Condition x Age | F1,57 = 0.05 F2,57 = 1.00 | 0.80 0.25 | 0.82 0.37 | |
| miR221-3p | Condition | F2,57 = 0.64 | 0.45 | 0.53 |
| Age Condition x Age | F1,57 = 0.00 F2,57 = 0.59 | 0.93 0.30 | 0.97 0.56 | |
| miR223-3p | Condition | F2,57 = 0.09 | 0.87 | 0.92 |
| Age Condition x Age | F1,57 = 0.01 F2,57 = 1.90 | 0.83 0.09 | 0.90 0.16 | |
| miR30c-5p | Condition | F2,57 = 3.18 | 0.003 | 0.05 |
| Age Condition x Age | F1,57 = 0.01 F2,57 = 0.43 | 0.87 0.39 | 0.92 0.65 | |
| miR338-5p | Condition | F2,57 = 1.63 | 0.07 | 0.21 |
| Age Condition x Age | F1,57 = 0.01 F2,57 = 0.55 | 0.84 0.31 | 0.91 0.58 | |
| miR451a | Condition | F1,57 = 1.01 | 0.25 | 0.37 |
| Age Condition x Age | F2,57 = 0.03 F2,57 = 2.24 | 0.85 0.08 | 0.87 0.10 | |
| miR92a-3p | Condition | F1,57 = 0.06 | 0.91 | 0.95 |
| Age Condition x Age | F2,57 = 0.01 F2,57 = 1.73 | 0.90 0.10 | 0.94 0.19 |
| Variable | Young Age Group (Mean ± SD) | Older Age Group (Mean ± SD) | p-Value |
|---|---|---|---|
| Sample size (n) | 22 | 9 | |
| Age (years) | 24.45 ± 3.23 | 64.89 ± 1.17 | |
| Body Mass Index (kg/m2) | 23.19 ± 2.09 | 23.97 ± 2.62 | 0.22 |
| Caffeine Consumption (mg/day) | 112.27 ± 101.73 | 294.37 ± 3.06 | 0.0007 |
| Alcohol consumption (drinks/week) | 3.52 ± 3.26 | 3.06 ± 3.41 | 0.37 |
| Daytime sleepiness (ESS) | 5.68 ± 3.03 | 8.00 ± 3.71 | 0.06 |
| Habitual sleep duration (min) | 445.91 ± 6.63 | 438.33 ± 10.54 | 0.28 |
| Pittsburgh sleep quality index (PSQI) | 3.45 ± 0.32 | 3.22 ± 0.61 | 0.37 |
| Diurnal preference (MEQ) | 52.09 ± 9.29 | 61.00 ± 11.08 | 0.03 |
| Trait anxiety (TAI) | 30.71 ± 5.98 | 26.13 ± 6.96 | 0.04 |
| Eysenck Personality Traits | |||
| Psychoticism | 3.64 ± 2.34 | 1.22 ± 1.09 | 0.0003 |
| Extraversion | 7.27 ± 2.73 | 7.11 ± 4.01 | 0.46 |
| Neuroticism | 2.05 ± 2.42 | 1.78 ± 2.17 | 0.38 |
| Lie scale | 3.45 ± 1.52 | 5.1 ± 2.83 | 0.03 |
| Depression score (BDI) | 3.14 ± 4.56 | 2.33 ± 2.41 | 0.26 |
| Cognitive assessment (MoCA) | 29.43 ± 0.73 | 28.8 ± 0.81 | 0.46 |
© 2018 by the authors. Licensee MDPI, Basel, Switzerland. This article is an open access article distributed under the terms and conditions of the Creative Commons Attribution (CC BY) license (http://creativecommons.org/licenses/by/4.0/).
Share and Cite
Weigend, S.; Holst, S.C.; Meier, J.; Brock, M.; Kohler, M.; Landolt, H.-P. Prolonged Waking and Recovery Sleep Affect the Serum MicroRNA Expression Profile in Humans. Clocks & Sleep 2019, 1, 75-86. https://doi.org/10.3390/clockssleep1010008
Weigend S, Holst SC, Meier J, Brock M, Kohler M, Landolt H-P. Prolonged Waking and Recovery Sleep Affect the Serum MicroRNA Expression Profile in Humans. Clocks & Sleep. 2019; 1(1):75-86. https://doi.org/10.3390/clockssleep1010008
Chicago/Turabian StyleWeigend, Susanne, Sebastian C. Holst, Josefine Meier, Matthias Brock, Malcolm Kohler, and Hans-Peter Landolt. 2019. "Prolonged Waking and Recovery Sleep Affect the Serum MicroRNA Expression Profile in Humans" Clocks & Sleep 1, no. 1: 75-86. https://doi.org/10.3390/clockssleep1010008