The Work Function of TiO2
by
 ,
,
Shun Kashiwaya
1,2, 
Jan Morasch
1,
Verena Streibel
1,†,
Thierry Toupance
2,
Wolfram Jaegermann
1 and
Andreas Klein
1,* 1
Department of Materials and Earth Sciences, Surface Science Division, Technische Universität Darmstadt, Otto-Berndt-Straße 3, 64287 Darmstadt, Germany
2
Institute of Molecular Sciences, University of Bordeaux, CNRS UMR 5255, Bâtiment A12, 351 Cours de la Liberation, 33405 Talence CEDEX, France
*
Author to whom correspondence should be addressed.
†
Current address: SUNCAT Center for Interface Science and Catalysis, SLAC National Accelerator Laboratory, 2575 Sand Hill Road, Menlo Park, CA 94025, USA.
Surfaces 2018, 1(1), 73-89; https://doi.org/10.3390/surfaces1010007
Submission received: 13 July 2018
/
Revised: 31 August 2018
/
Accepted: 1 September 2018
/
Published: 7 September 2018
Abstract
:Polycrystalline anatase thin films, (001)- and (101)-oriented anatase TiO single crystals and (001)- and (110)-oriented rutile TiO single crystals with various surface treatments were studied by photoelectron spectroscopy to obtain their surface potentials. Regardless of orientations and polymorph, a huge variation of the Fermi level and work function was achieved by varying the surface condition. The most strongly oxidized surfaces are obtained after oxygen plasma treatment with a Fermi level ∼2.6 eV above the valence band maximum and ionization potentials of up to 9.5 eV (work function 7.9 eV). All other treated anatase surfaces exhibit an ionization potential independent of surface condition of eV. The Fermi level positions and the work functions vary by up to 1 eV. The ionization potential of rutile is ∼0.56 eV lower than that of anatase in good agreement with recent band alignment studies.
1. Introduction
Titanium dioxide (TiO) is widely applied in photocatalysis [1] and as electrode in solar cells [2], and has been considered to be a promising material owing to its physical and chemical properties. Among the different polymorphs of TiO, mostly fundamental properties of rutile have been studied experimentally and theoretically despite a superior photocatalytic activity of anatase as compared to rutile, which is associated with its longer charge carrier life time and higher carrier mobility [3]. Oriented rutile substrates, of which the rutile (110) is the most stable and can be easily prepared, have been thoroughly investigated as model surfaces for fundamental surface phenomena [4]. In contrast, information about oriented anatase is sparse because of their difficult preparation [5]. Only recently novel techniques to prepare oriented anatase substrates have been developed [6]. In 2008 Yang et al. [7] synthesized anatase single crystals with 47% of the minority (001) facet via a hydrothermal route employing fluoric acid. This successful synthesis has surged further fundamental investigations of both anatase (101) and (001) facets [8,9,10,11]. However, although the electronic structure of anatase bulk and surfaces including band gaps and surface states are well known due a wide range of experimental and theoretical studies using complementary techniques, particularly using electron spectroscopy (see e.g., [11,12,13,14,15,16,17,18,19,20,21]), the surface potentials—Fermi level position, work function and ionization potential—have not yet been studied systematically.
The work function of materials is especially relevant for photocatalysis and solar cells as it governs the band alignments of interfaces such as TiO/metal contacts forming Schottky barriers, TiO/p-type semiconductor interfaces forming p-n junctions, and TiO/liquid junctions related to redox potentials. Despite its importance for TiO, only few work function data have been reported [22,23,24]. The work function is affected by the Fermi energy and by the vacuum energy , which can be manipulated separately by doping, surface space charge layers, or the surface dipole, respectively [25]. The latter depends on surface polarity and termination [26]. Changes in the surface dipole directly affect the ionization potential , which is the difference between vacuum energy and valence band maximum and which does not depend on the Fermi energy.
The ionization potential of metal oxide surfaces depends on surface orientation and surface termination, where the latter can vary with the oxygen activity during preparation [25,27,28,29,30,31]. Due to a strong electronegativity of oxygen, less oxygen results in a lower negative surface charge and thus in a lower and . The oxygen activity also affects the Fermi energy in oxides. A lower oxygen activity, i.e., more reducing conditions, generally results in a higher Fermi energy and thereby in a lower . Detailed data on the interplay between the surface potentials and oxygen activity for most TiO surfaces are still lacking.
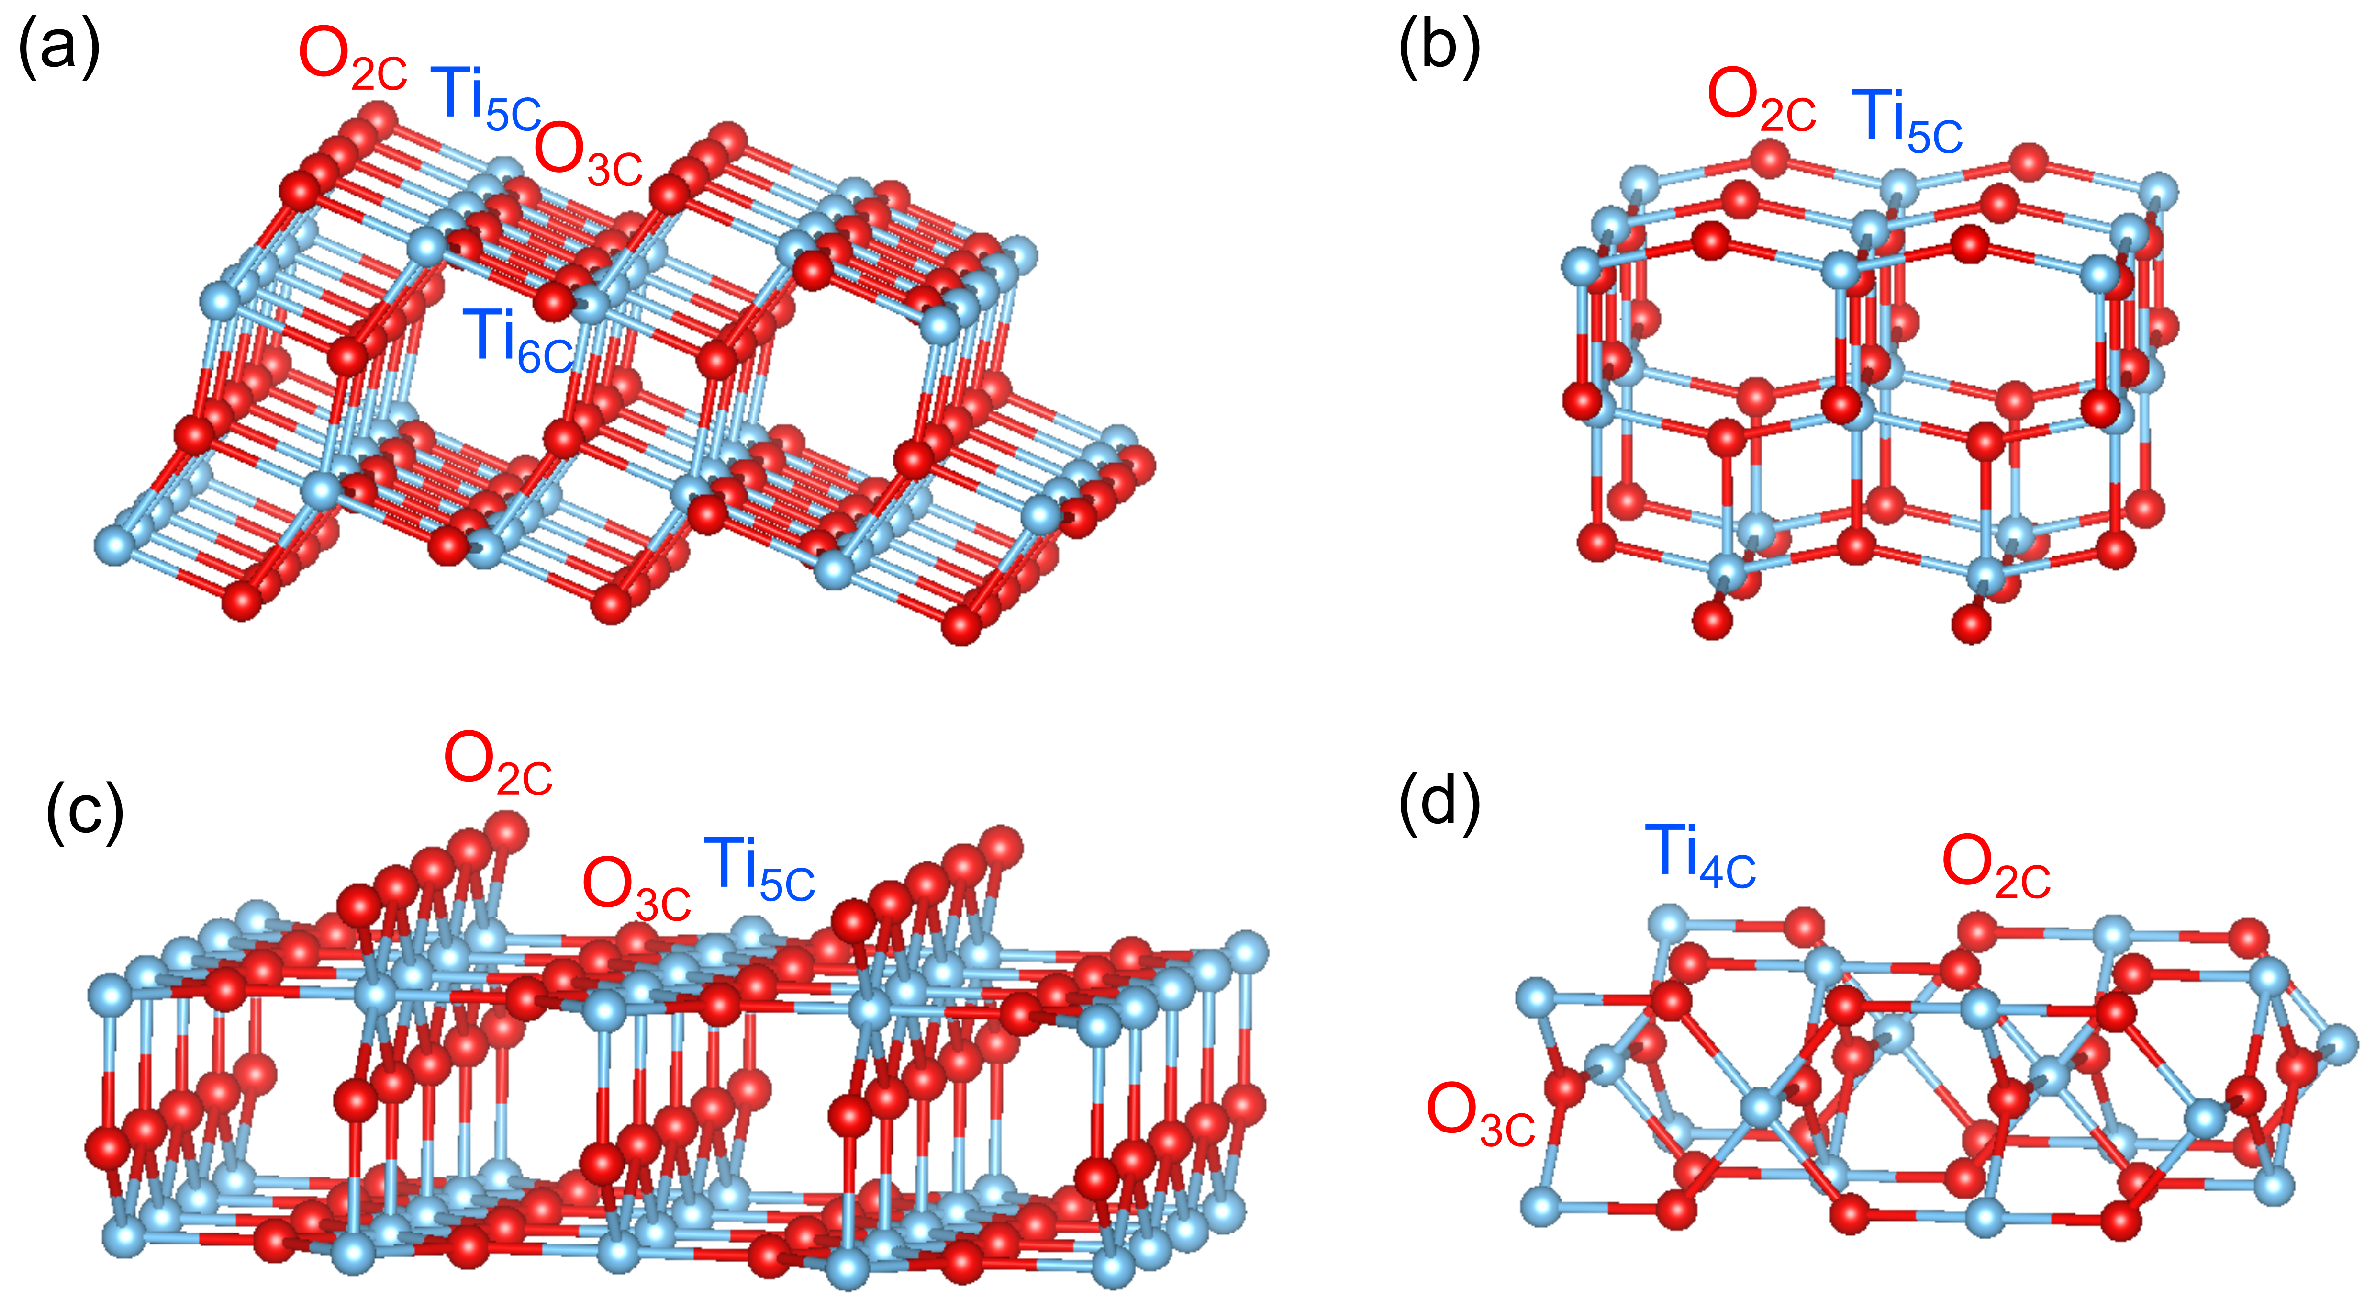
Figure 1 displays a ball-and-stick model of bulk-terminated surfaces of rutile (110) and (001), and anatase (101) and (001) without structural relaxations. At the rutile (110) surface bridging oxygen atoms missing one bond to Ti can be easily removed by thermal annealing, whereas at the rutile (001) surface, oxygen vacancies are believed to easily form at a twofold-coordinated surface O atom [4,32]. It was theoretically predicted and experimentally shown that the point defect is located at the bridging oxygen row on the rutile (110) surface whereas for the anatase (101) surface are favored to be situated in the subsurface rather than on the surface [18,33,34,35]. At anatase (101) and (001) surfaces, the has a lower formation energy in the subsurface than on the surface while the rutile (110) surface exhibits an inverse trend. Thus, at anatase (101) and (001) surfaces, are energetically stable in the subsurface or even in the bulk whereas at rutile (110) and (001) surfaces, the form most likely at the bridging oxygen site on the top surface. This difference in oxygen vacancy distribution is expected to lead to different electronic properties.
Many applications of TiO such as water splitting, water purification and self-cleaning, undergo an interaction with water [36,37,38,39]. Thus, the investigation of water adsorption on the surface is important. Water adsorption has therefore been investigated intensively by many groups with different techniques (see e.g., [4,40,41,42,43,44,45,46,47,48,49,50] and references therein). Studies of water adsorption on TiO are usually performed at liquid nitrogen or lower temperature, where multilayers of molecular water can be adsorbed in a vacuum system [51]. Many studies have focused on the initial state of adsorption: molecular, dissociative, or multilayer adsorption. Most calculations have predicted that on rutile (110) surfaces dissociative adsorption of water is energetically preferred over molecular adsorption [4]. However, there is a consensus established by several experiments that water dissociates only at the vacancy sites of so-called bridging oxygen rows while only molecular adsorption takes place on the stoichiometric defect-free rutile (110) surface [4,40,41]. For anatase, it was found that water adsorbs dissociatively on the surface in the presence of subsurface , although it has also been reported that water would adsorb only molecularly on the anatase surfaces [42,43,44,45,46]. Based on these reports, we assume that the distribution of influences the interface of TiO and water, which affects photocatalytic redox reactions. Despite the wealth of studies on this subject, it remains largely unknown how water adsorption affects the work function of different surfaces.
In this work, (001)- and (101)-oriented and polycrystalline anatase surfaces in different oxidation conditions were studied. The same treatments were applied to rutile (110)- and (001)-oriented surfaces. Polycrystalline anatase thin films prepared by spray pyrolysis are also included in this study. The chemical and electronic surface properties were accessed using X-ray und UV photoelectron spectroscopy (XPS and UPS). The reported results provide the variation of the surface potentials of TiO, i.e., the Fermi level position () with respect to the valence band maximum () and the work function , with surface condition. For anatase, we have also studied the variation of surface properties after exposure to water vapor at room temperature without breaking vacuum. Furthermore, we compare anatase and rutile surfaces and discuss differences in their electronic properties. Overall, the work provides guidance towards manipulating the work function of TiO surfaces.
2. Materials and Methods
Natural anatase crystals were employed for both (101) and (001) surfaces (SurfaceNet GmbH, Rheine, Germany). Polycrystalline anatase substrates were prepared by spray pyrolysis. Epitaxially polished rutile (110) and (001) substrates were purchased from CrysTec GmbH (Berlin, Germany). The size of the substrates is . A surface roughness less than a lattice constant was achieved after epi-polishing the single crystal substrates. For anatase, in addition to the ex-situ surfaces (ex-a(001), ex-a(101), and ex-a-poly) with contamination from air and polishing, unreconstructed (101) and (001), and polycrystalline surfaces were in situ prepared inside an integrated vacuum system to expose different well-defined stoichiometries: sputtered (sp-a(001), sp-a(101), and sp-a-poly), annealed (an-a(001), an-a(101), and an-a-poly), oxidized (ox-a(001), ox-a(101), and ox-a-poly), and stoichiometric (st-a(001), st-a(101), and st-a-poly). For rutile, annealed (an-r(110) and an-r(001)) and oxidized (ox-r(110) and ox-r(001)) were prepared.
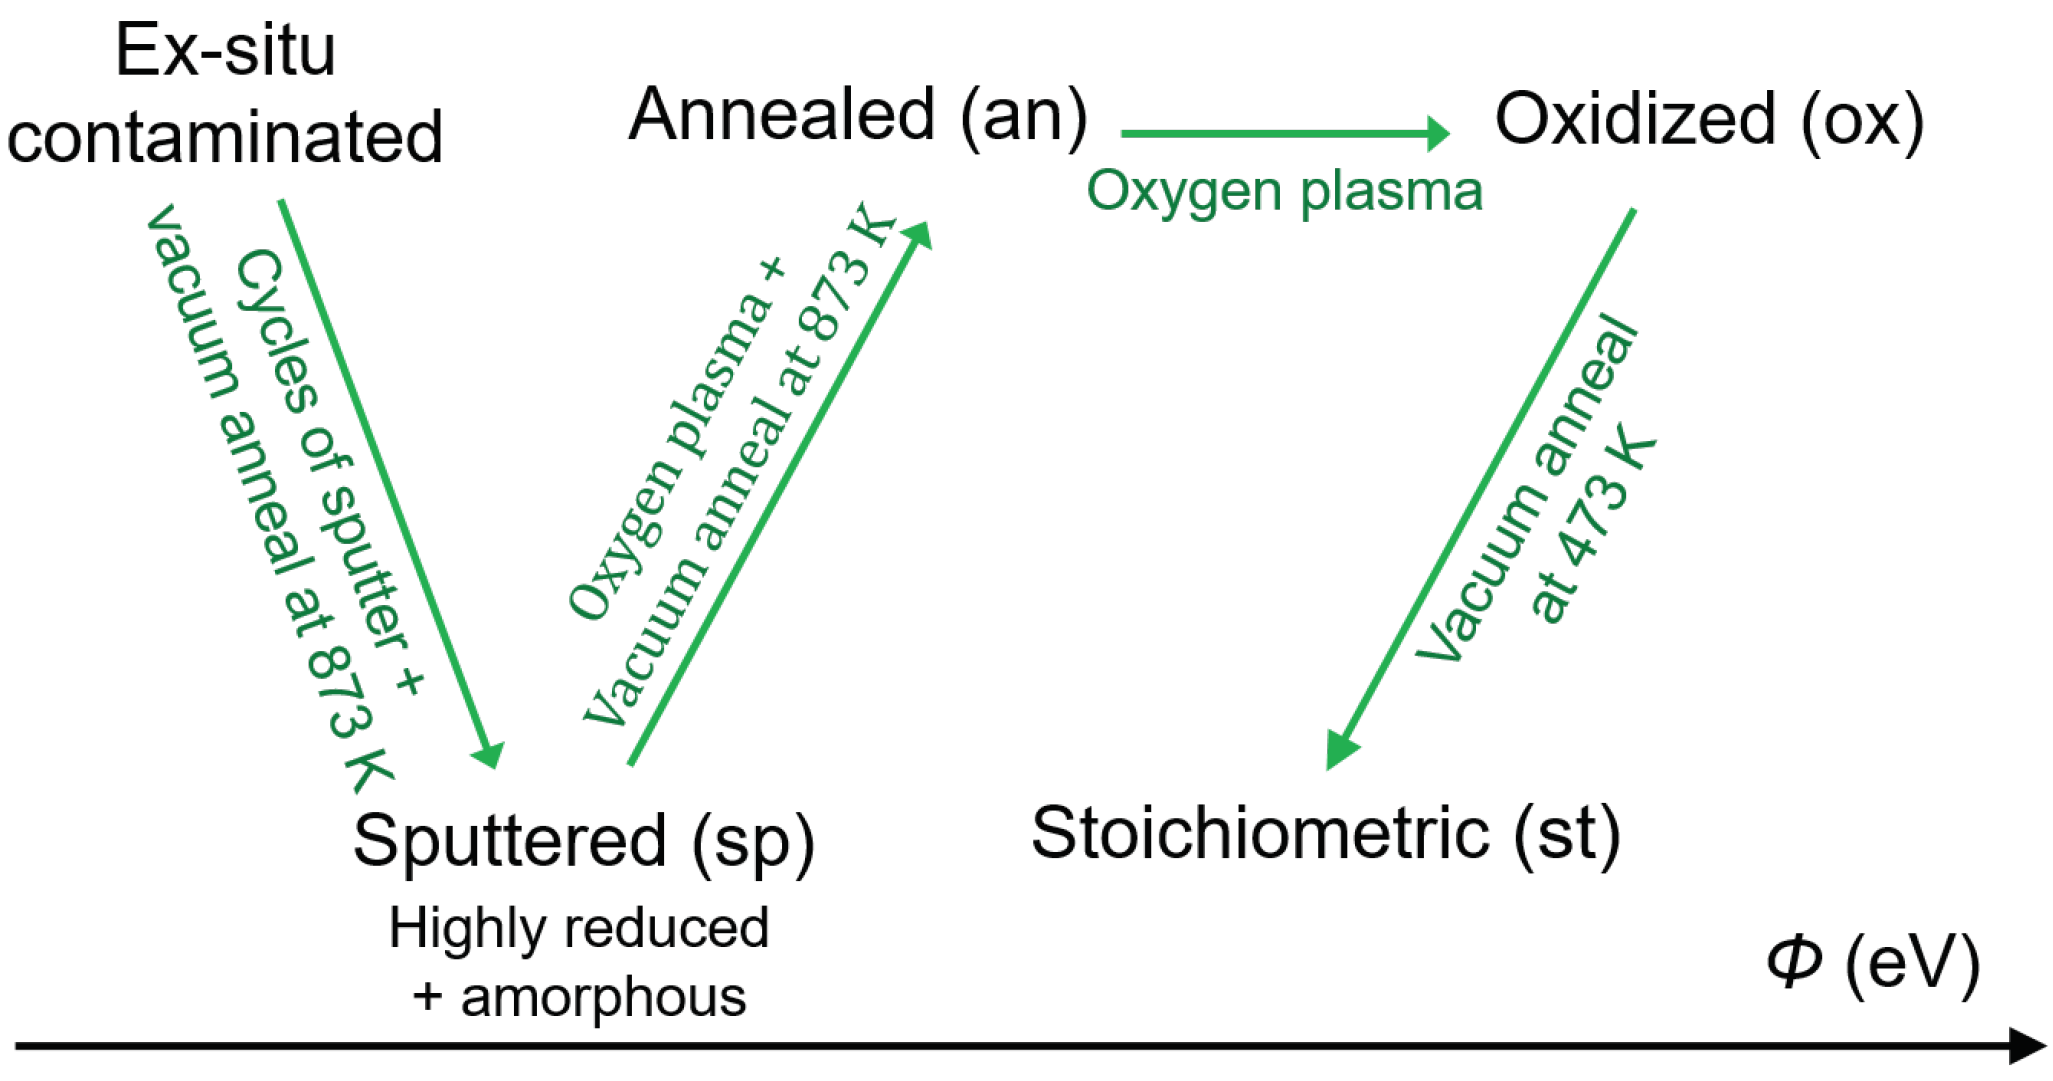
Sample preparations and measurements were carried out in the Darmstadt integrated system for materials research (Daisy-Mat) [52] equipped with a multitechnique surface analysis system Physical Electronics PHI 5700, which is connected to different sample preparation chambers via a sample transfer system. The sputtered surfaces were prepared by repeated cycles of Ar ion sputtering with an energy of 1 keV for 15 min and annealing under ultrahigh vacuum (UHV) conditions at 873 K for 30 min until no remaining emissions from contaminations were observed by X-ray photoelectron spectroscopy (XPS). Although this procedure has been conventionally accepted to prepare clean surfaces of single crystal TiO, Ar sputtering not only results in a highly reduced surface and thus leads to the formation of oxygen vacancies and Ti surface states, but also partially destroys the crystallinity of the surface and introduces an amorphous phase [4,6,53].
After Ar ion etching, the sputtered surfaces were oxidized in an Oxygen plasma at room temperature in an atmosphere of O for 15 min to re-oxidize the surface, followed by annealing at 873 K in UHV to re-crystallize the surface. Here the O plasma was selected to replenish the lattice O instead of annealing in O atmosphere, which has been frequently used for oxidation, as annealing in O could form additional incomplete reconstructions [54]. Furthermore, annealing in O may lead to iron oxide layer formation since elevated temperatures may trigger the surface segregation of Fe, which is a typical contamination of natural anatase crystals [6]. In addition, atomic O in the O plasma is more oxidative than molecular O during annealing in O atmosphere, which leads to partially remaining [18,55].
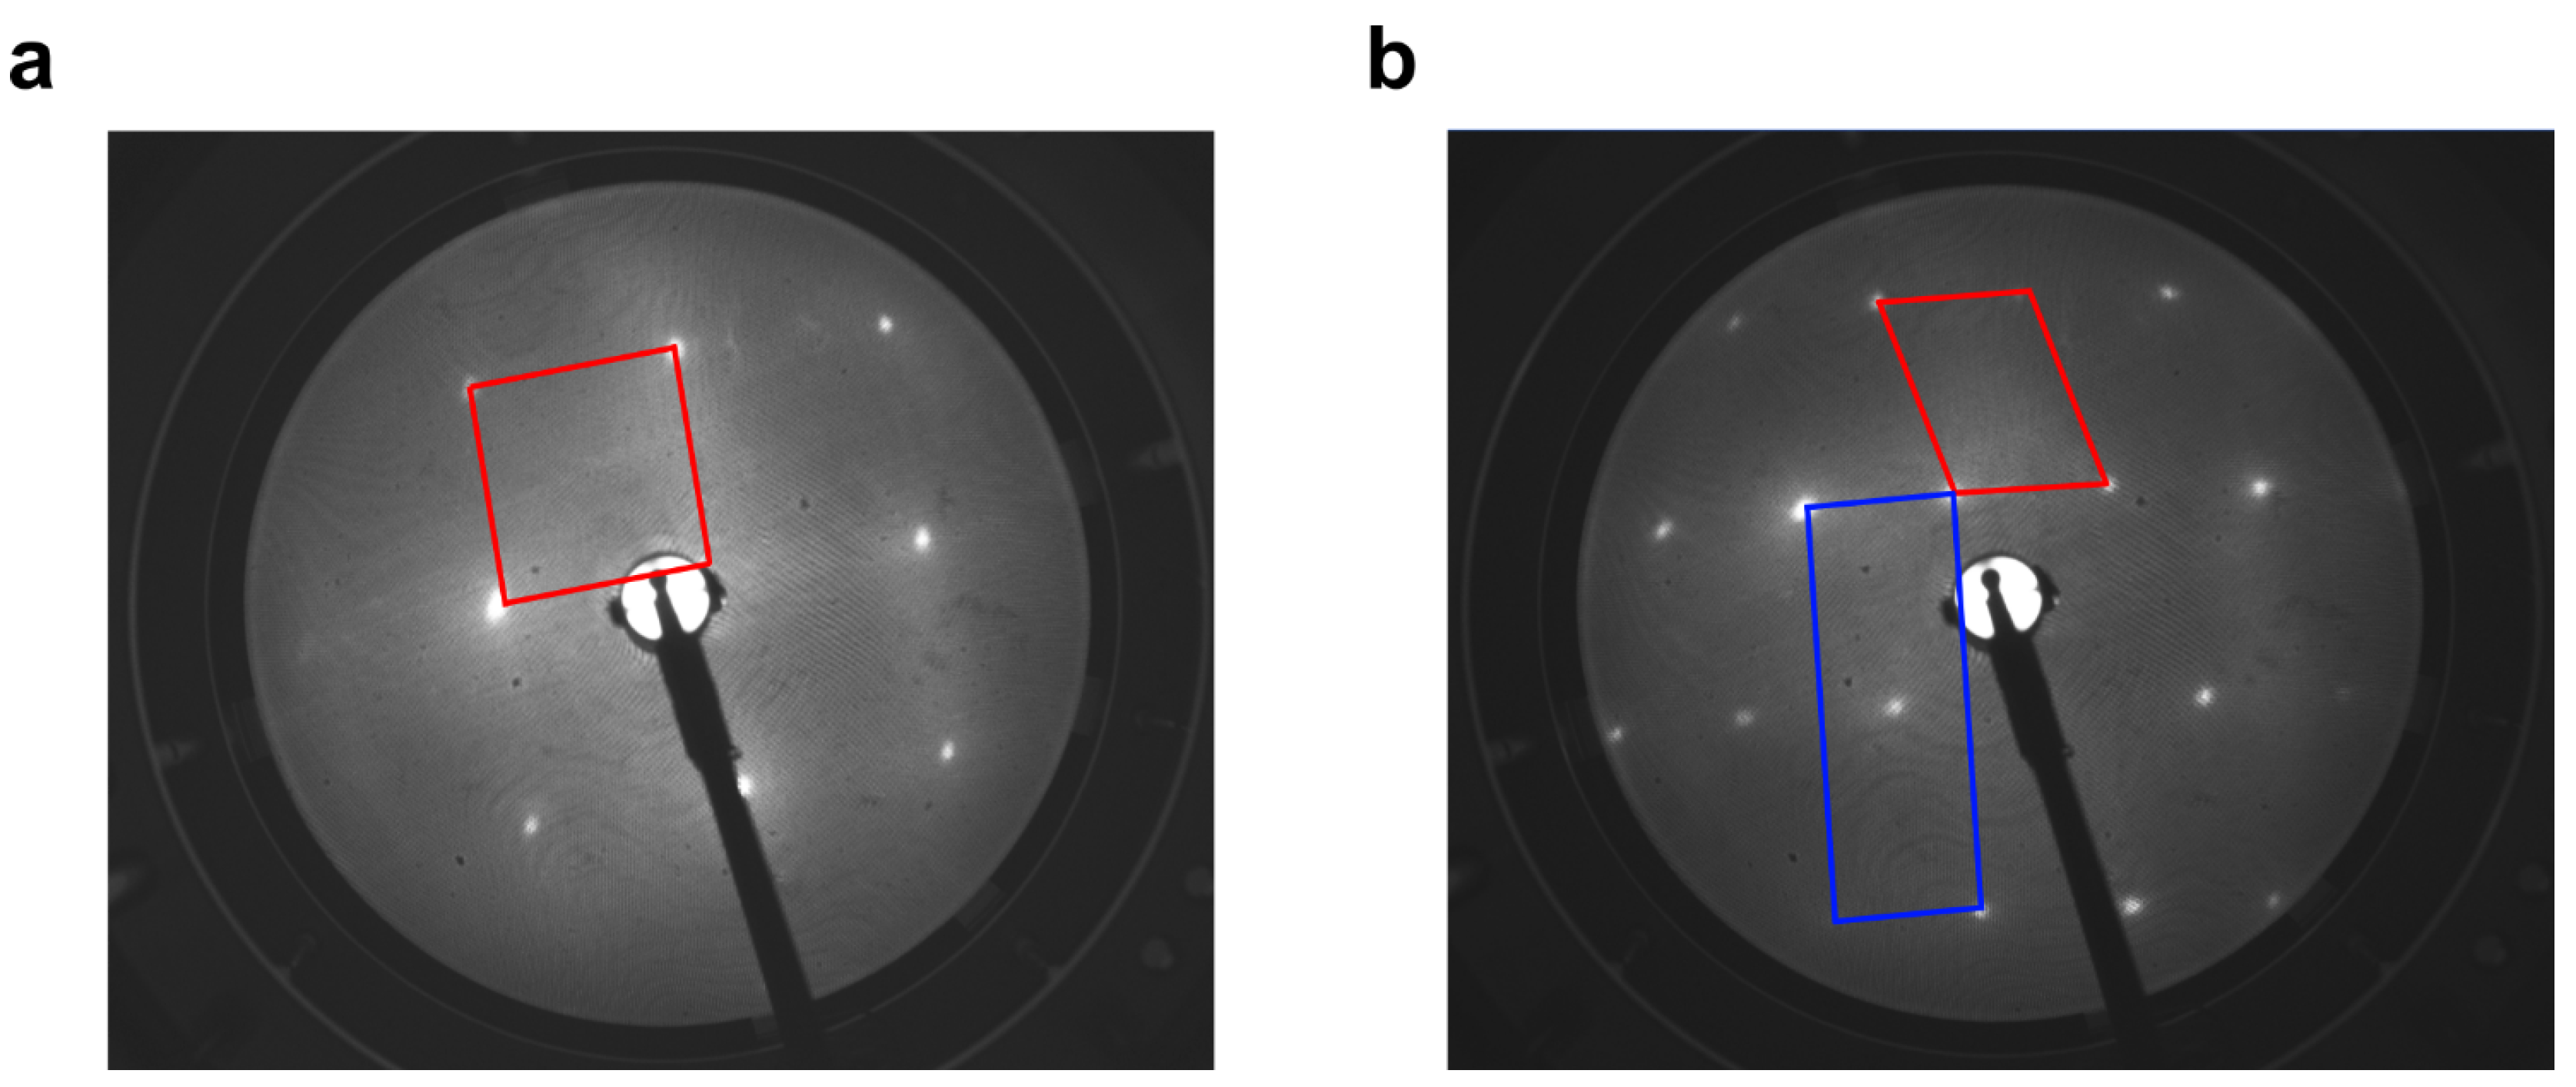
The surfaces, which are in this work referred to as annealed, (The term annealing might be used differently in literature) were prepared by an oxygen plasma treatment and a subsequent reduction by annealing in vacuum at 873 K. Low energy electron diffraction (LEED) patterns recorded for these surfaces are shown in Figure A1. They show unreconstructed 1 × 1 patterns with low background intensity, indicating well-ordered surfaces. Finally, the stoichiometric surfaces were prepared by removing O adatoms by annealing the oxidized (plasma treated) surfaces in UHV at 473 K for 20 min [56,57]. An overview of the preparation procedures for the above described different surfaces is given in Figure 2. It is noted that the color of rutile substrates, which are less conductive than anatase, changed from transparent into dark blue after the reduction procedure, making the surfaces sufficiently conductive to avoid charging during photoemission measurements.
To further understand the electronic structures of different surfaces in a practical situation for photocatalytic reactions, water was dosed through a diaphragm valve for atomic layer deposition in a vacuum chamber [58] onto the annealed, oxidized, and stoichiometric surfaces for the anatase (001) and (101), and polycrystalline anatase. The water exposure at room temperature was completed using 15 water pulses of 0.5 s duration followed by evacuation for 60 s. The amount of exposed water molecules in this process depends on the pumping speed and the chamber geometry. We estimate the exposure to – Langmuir. The resulting TiO substrates were transferred to the XPS chamber and investigated immediately after this adsorption procedure. XPS analysis revealed a small C 1s emission after water exposure.
X-ray photoelectron spectra were recorded with monochromatic Al K radiation at an emission angle of and a pass energy of 5.85 eV, which gives a total energy resolution of 0.4 eV, as determined from the Gaussian broadening of the Fermi edge of a sputter-cleaned Ag sample. Binding energies of core levels and the valence band maximum can be determined with an accuracy of 50 meV, and 100 meV, respectively. For the determination of work function and ionization potentials , ultraviolet photoelectron spectra were recorded in normal emission with He I radiation ( eV) from a He discharge lamp and a negative sample bias of 4.0 V. The total energy resolution is 0.2 eV. No charging problems were observed during the XPS and UPS measurements. Obtained binding energies for XPS and UPS were calibrated by the Fermi level energy of a sputter-cleaned Ag sample. Hence, all binding energies are given with respect to the calibrated Fermi level at 0 eV. More details of the experimental setup and approach in performing the experiments may be found elsewhere [52,59].
3. Results and Discussion
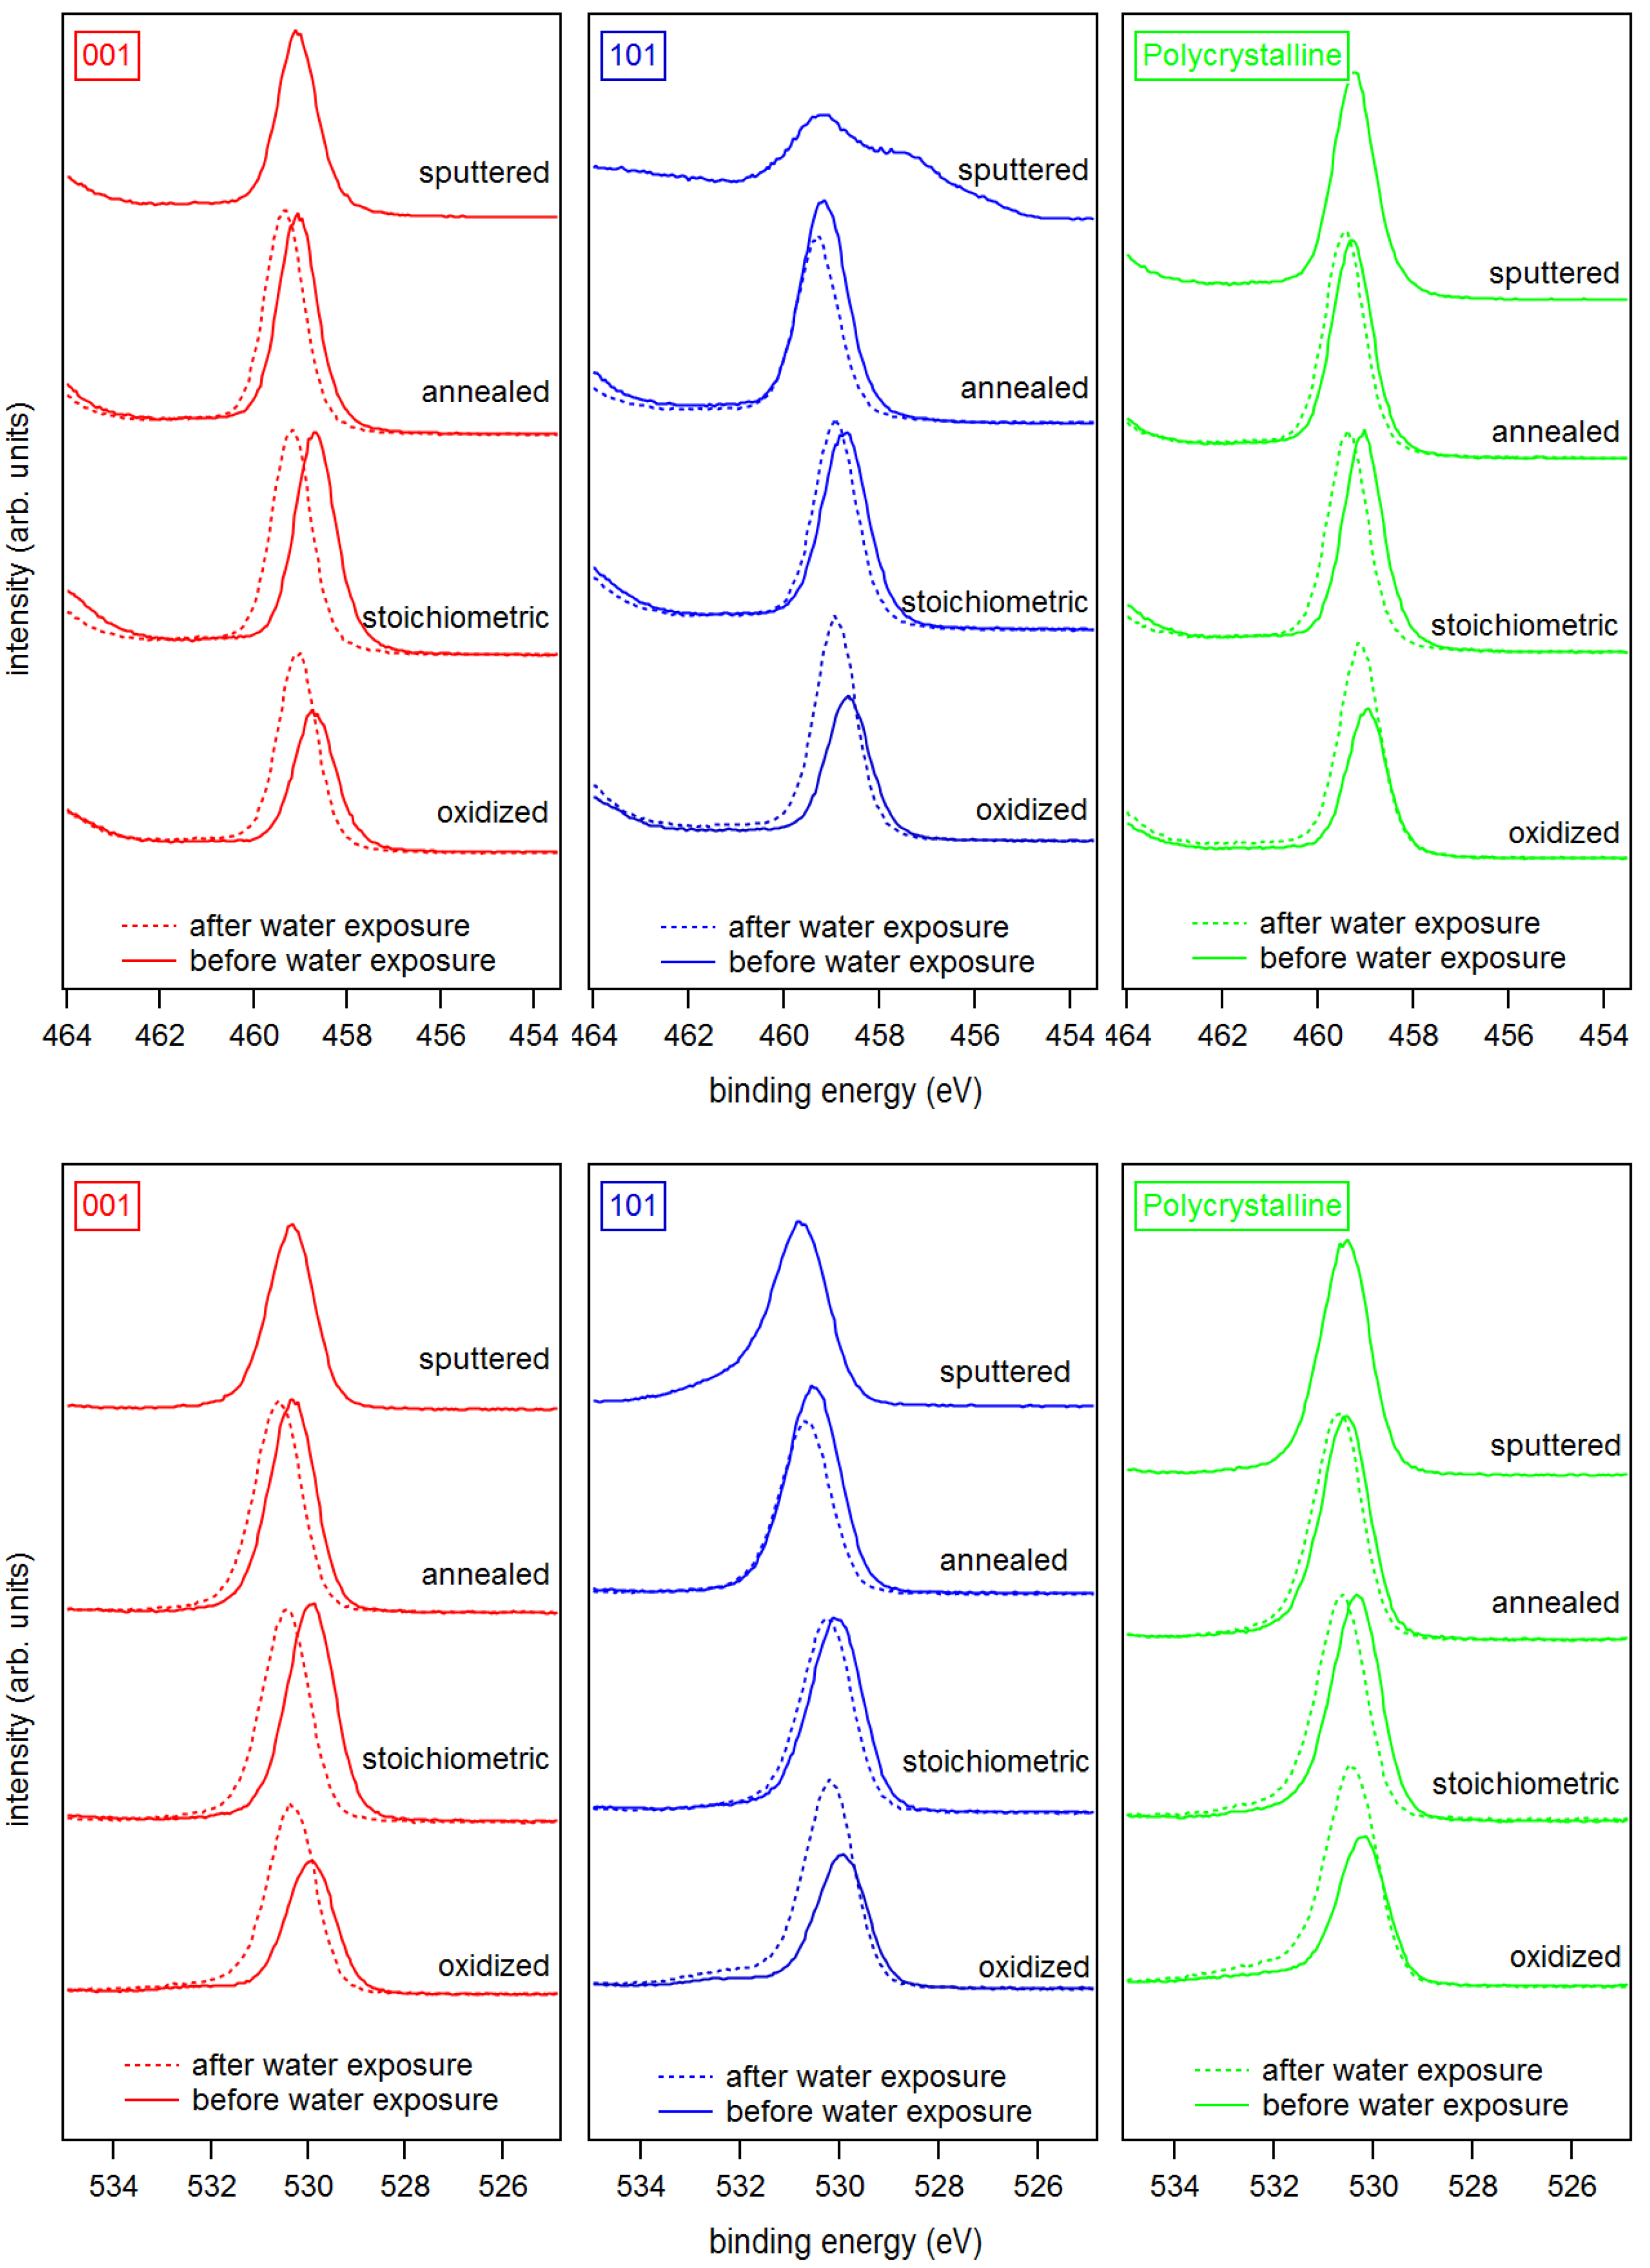
The Ti 2p and O 1s core level spectra of the differently treated surfaces are shown in Figure 3. The Ti 2p emission of the sputtered anatase (101) surface shows a strong low binding energy emission associated with Ti and Ti shifted relative to the main emission line of Ti by ∼1.7 and ∼3.5 eV, respectively [45,60,61]. All other samples, including the sputtered anatase (001), exhibit sharp and symmetric lines consisting of a single Ti oxidation state. Evidently, the anatase (101) surface is much easier reduced than the (001) surface. The low binding energy Ti 2p emissions related to surface reduction of anatase (101) are neither observed after re-oxidation by O plasma treatment nor after re-crystallization by annealing in vacuum.
Exposing an-a(001) and an-a(101) to an O plasma results in a shoulder in the O 1s emission at 3 eV higher binding energy compared to the O 1s emission related to TiO (see bottom row of Figure 3). This shoulder is likely attributed to peroxo (O) surface species, like for example in bridging oxygen dimers [62]. The stoichiometric anatase (001) and (101) surfaces show no shoulder in the O 1s emission after annealing in vacuum at 473 K. The surface peroxo species observed after oxygen plasma treatment at ox-a(001) and ox-a(101) is therefore effectively removed by annealing.
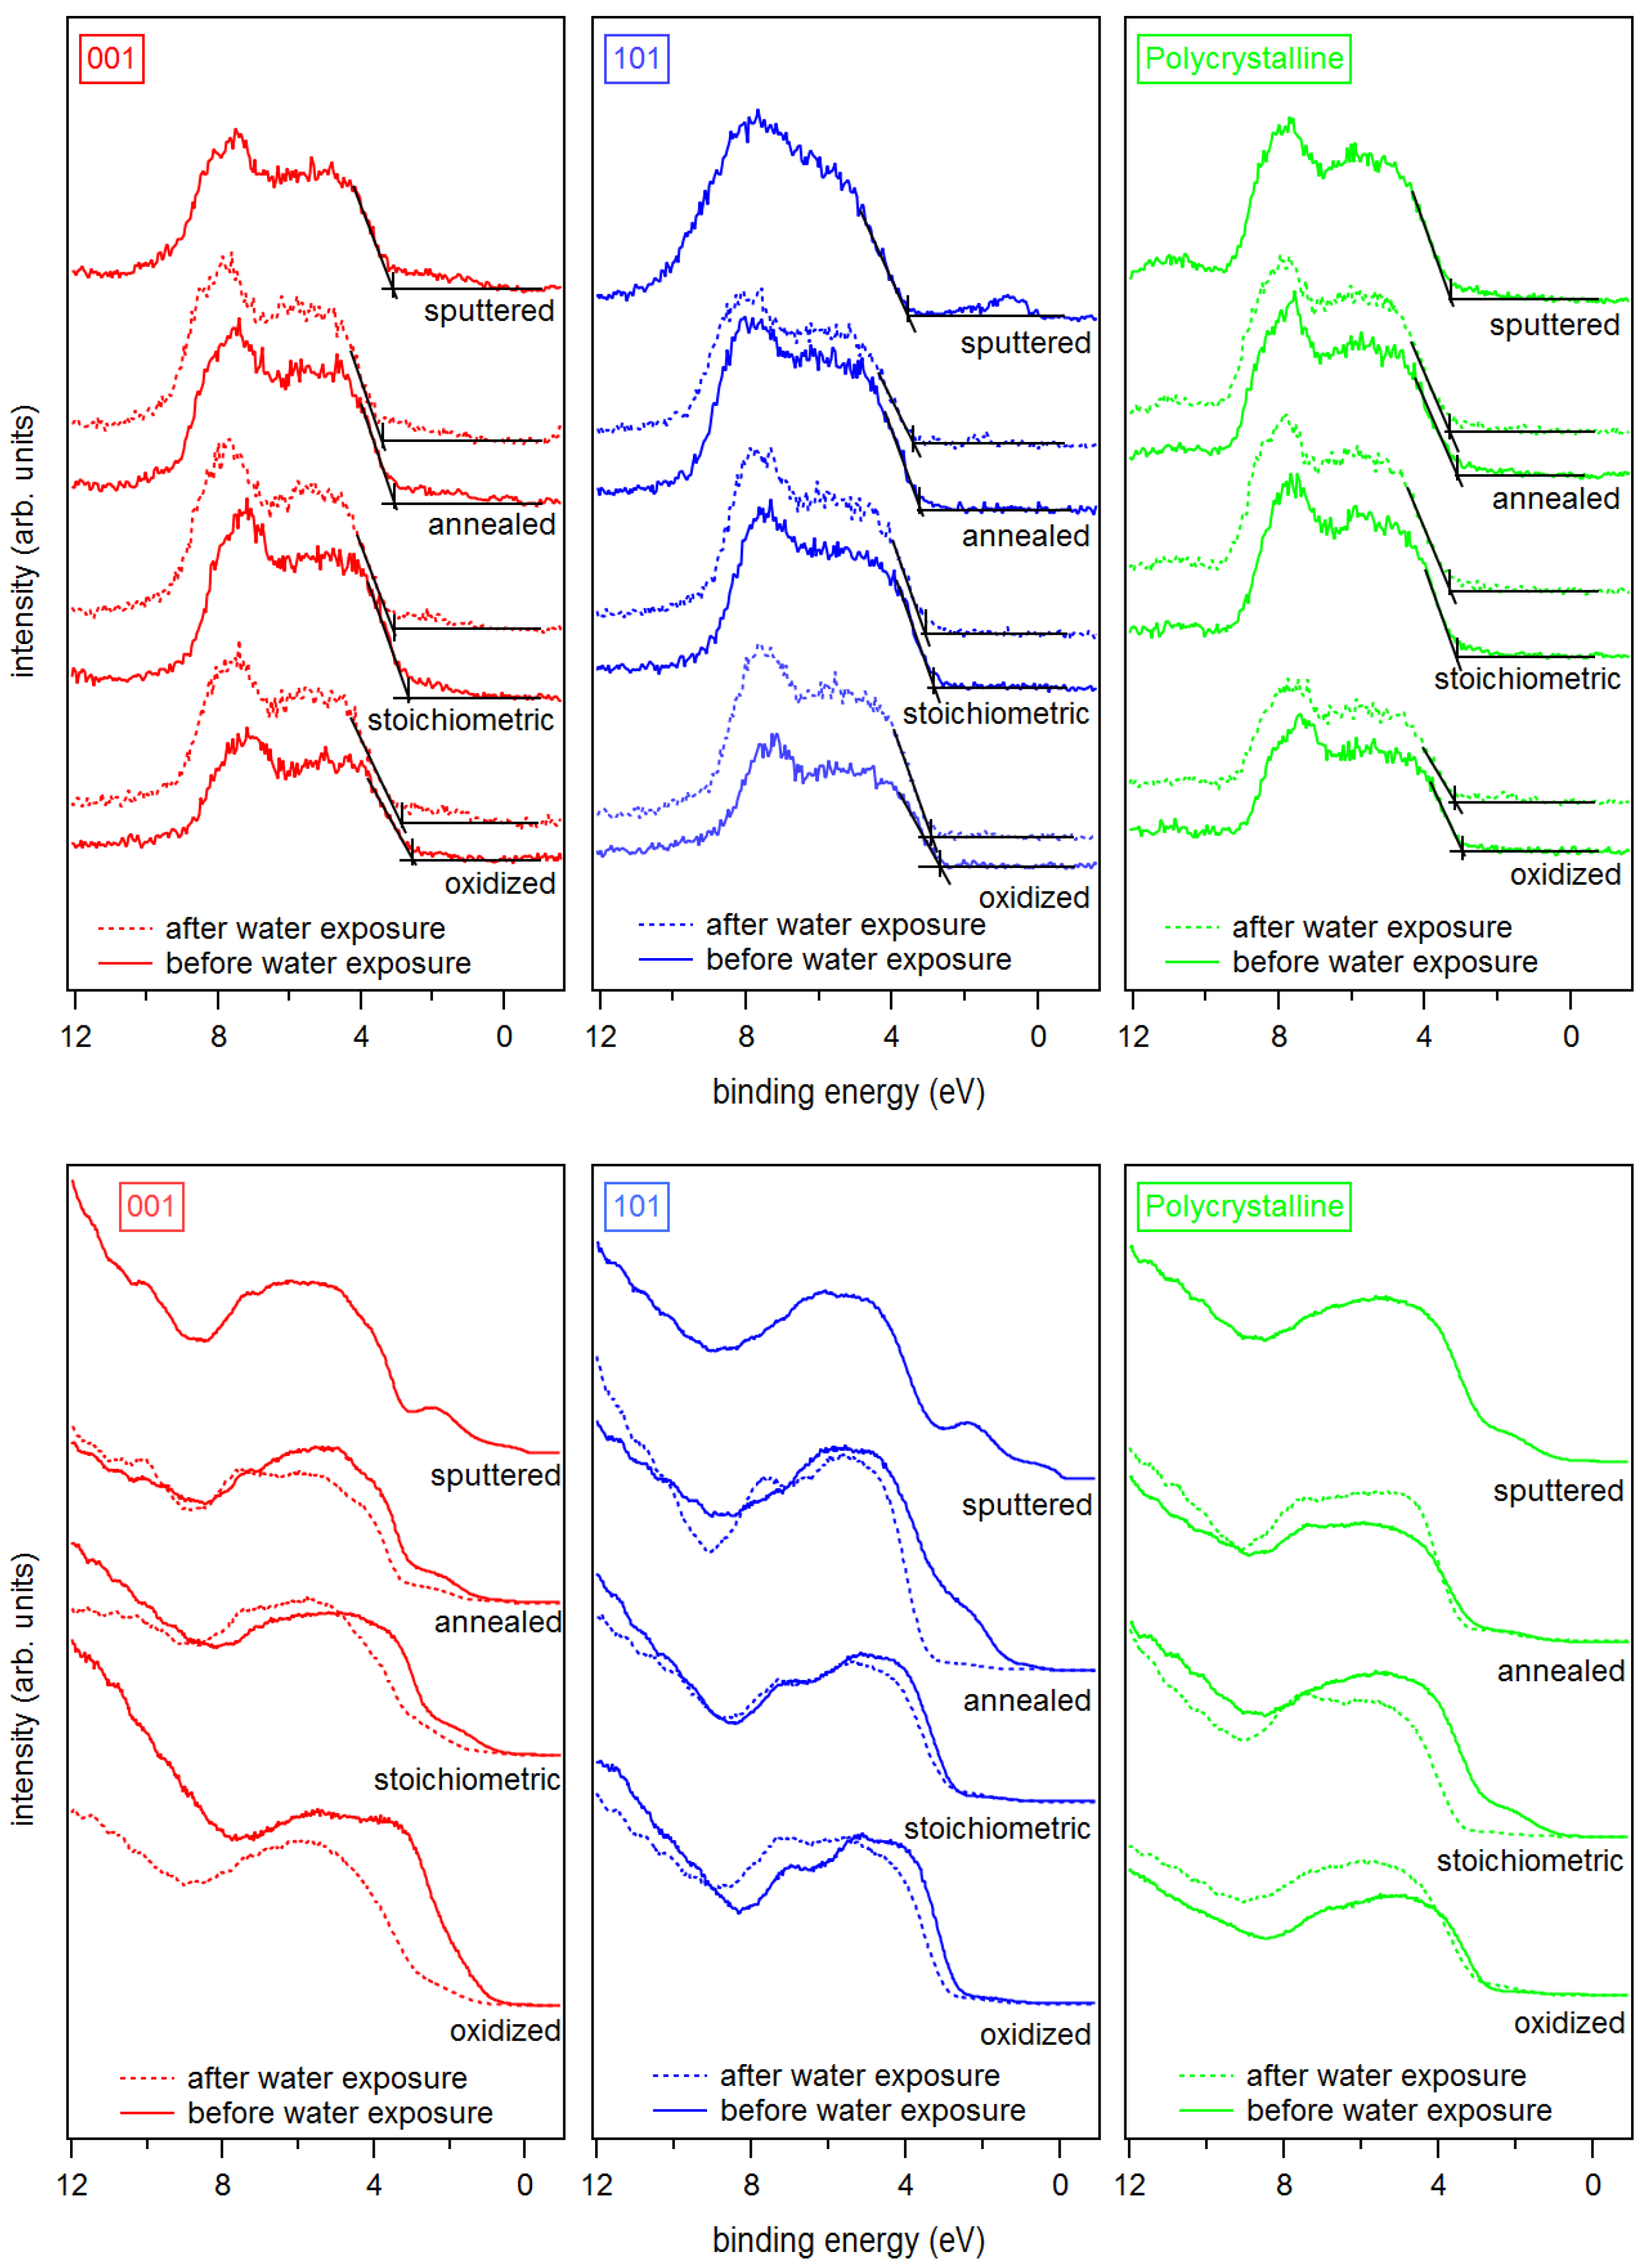
X-ray and ultraviolet valence band spectra are shown in Figure 4. UP spectra are usually more sensitive to surface defects than XP spectra, which is mostly due to the higher surface sensitivity of UPS and the higher intensities. It is accepted that the so-called band gap surface states would form due to occupied Ti 3d states (Ti) near the O vacancy sites on the surface, but also due to Ti interstitials in the subsurface region [4,11,18,63,64]. It is clear from Figure 4 that all sputtered TiO surfaces show the well-known Ti 3d emission lines in the band gap region.
The emission of the gap states is different for the (001) and (101) surface orientation of anatase. The state energically closer to the Fermi energy at a binding energy of ∼0.5 eV is more pronounced for the (101) surface. As this emission is clearly observed only for the sputtered (101) surface, this shallow gap state is likely related to the observation of the reduced Ti species.
The intensity of the band gap states is generally reduced with surface oxidation for both orientations and all treatments. However, the deep gap state, which is closer to the onset of the valence band maximum at – eV binding energy, is still observed in the XP and the UP valence spectra for the (001) surface even after O plasma treatment. In contrast, the deep gap state is completely attenuated for the oxidized and the stoichiometric (101) surface.
The valence band maximum binding energies are determined by a linear extrapolation of the low binding energy valence band emission edge. Only XPS data are used here as they are less affected by the gap state emissions. The extracted values are summarized in Table 1 together with the core level binding energies, which are determined from the spectra shown in Figure 3.
Independent of surface orientations, the valence band maximum binding energy decreases in the order sputtered, annealed, stoichiometric, and oxidized treatment. The valence band maximum and the core levels show comparable binding energy shifts. In particular, the binding energy difference between the O 1s and the Ti 2p core level is eV, with the only exception of the sputtered anatase surface, where the binding energy of the Ti 2p core level is more uncertain due to the strong reduction of the surface. The binding energy differences between the core levels and valence band maxima also remain within eV, which can also be considered to be constant considering the changes of the valence bands in dependence on treatment. The binding energy shifts can therefore be attributed to different Fermi energies. These are likely caused by different concentrations of oxygen vacancies at the surface or in the bulk. The former would cause binding energy shifts due to surface electron accumulation, the latter due to enhanced doping.
The overall variation of the Fermi energy is 0.46 eV for the (001) and 0.71 eV for the (101) surface orientation, respectively. It is noteworthy that of the (101) surface is always higher than that of the (001) surface. This difference of results in a variation of surface potential with orientation, which will drive photogenerated electrons and holes towards the (101) and (001) surfaces, respectively. This charge separation mechanism agrees with literature reports [65,66].
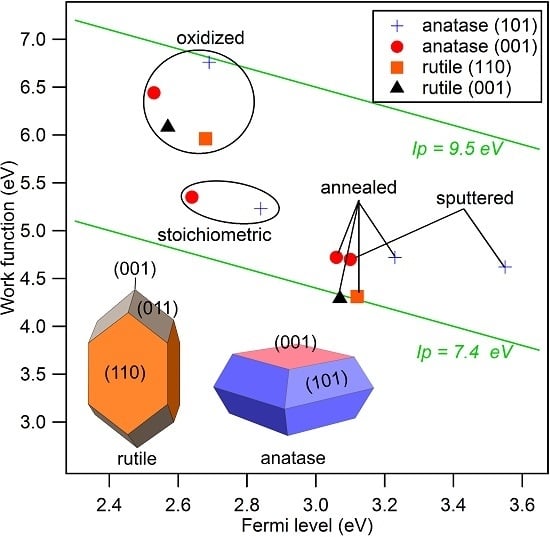
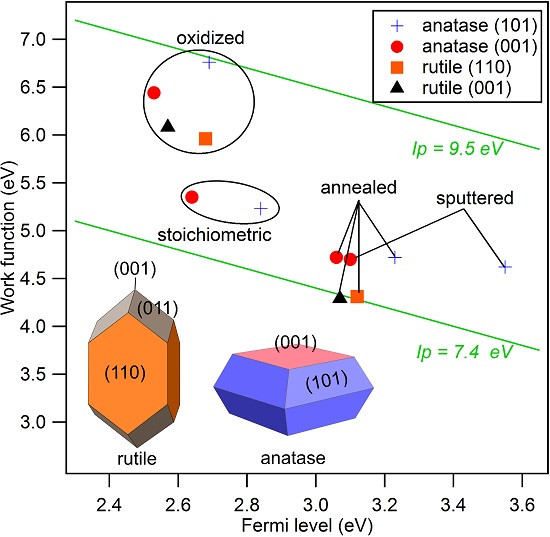
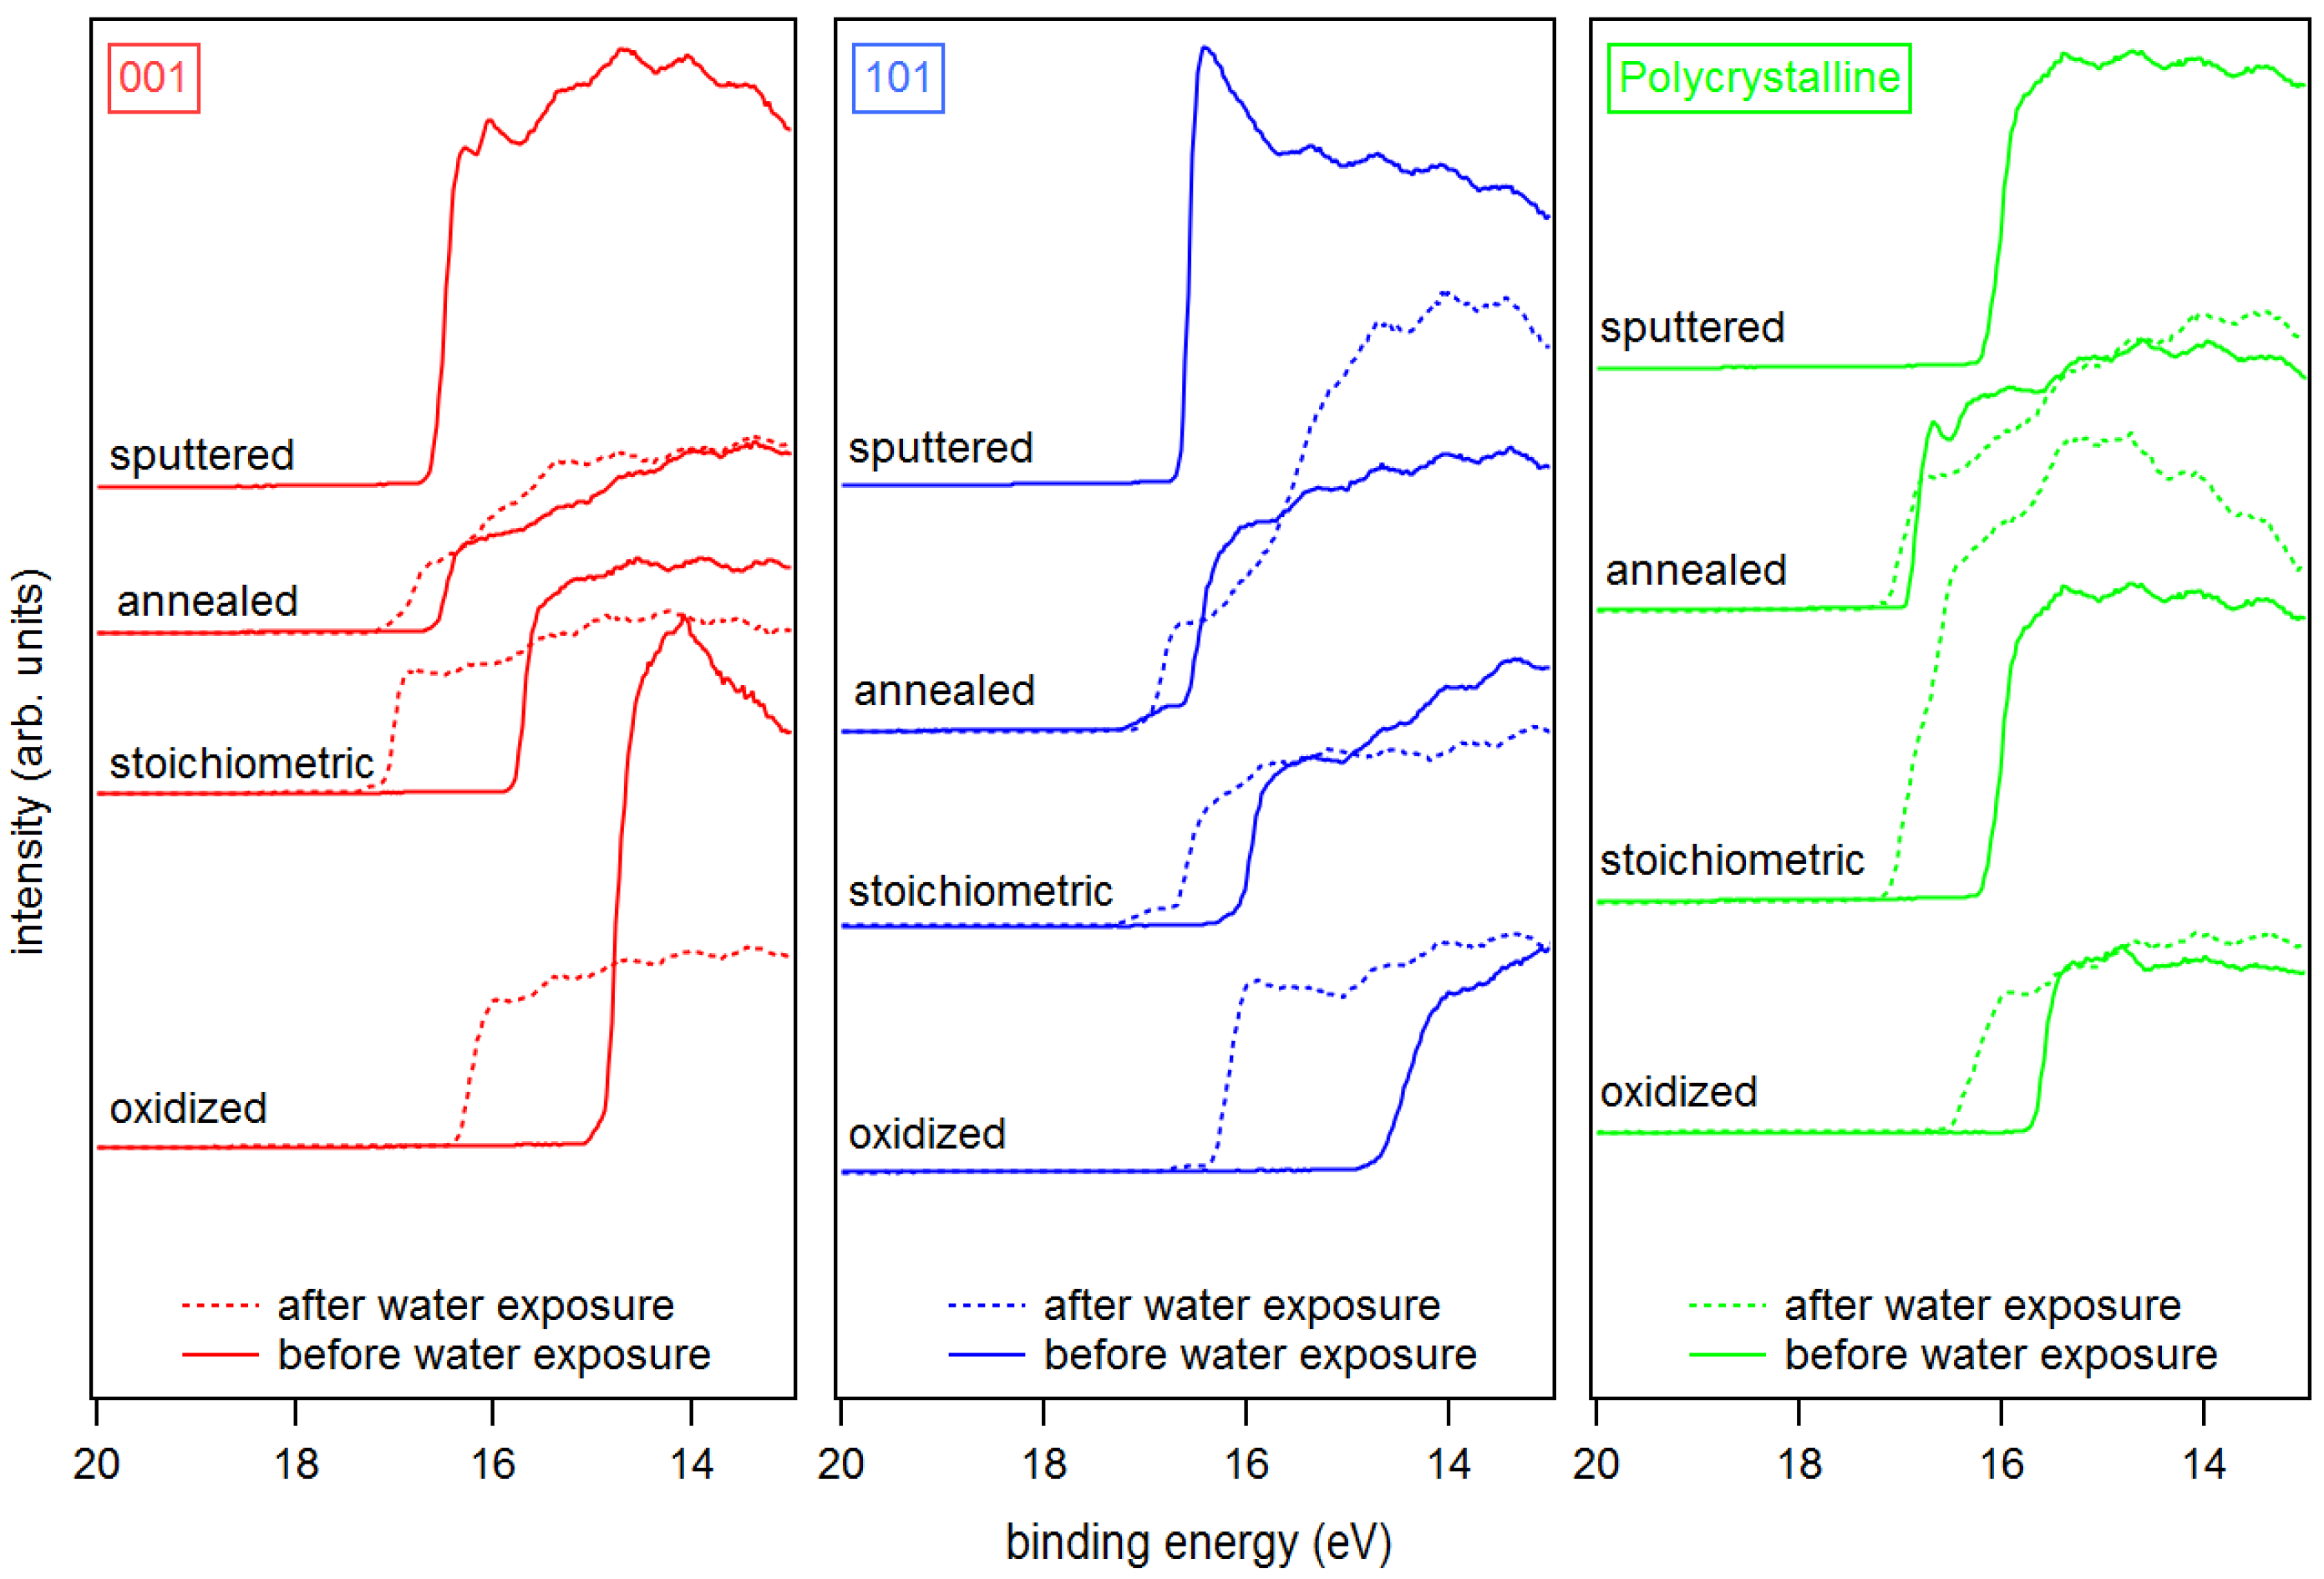
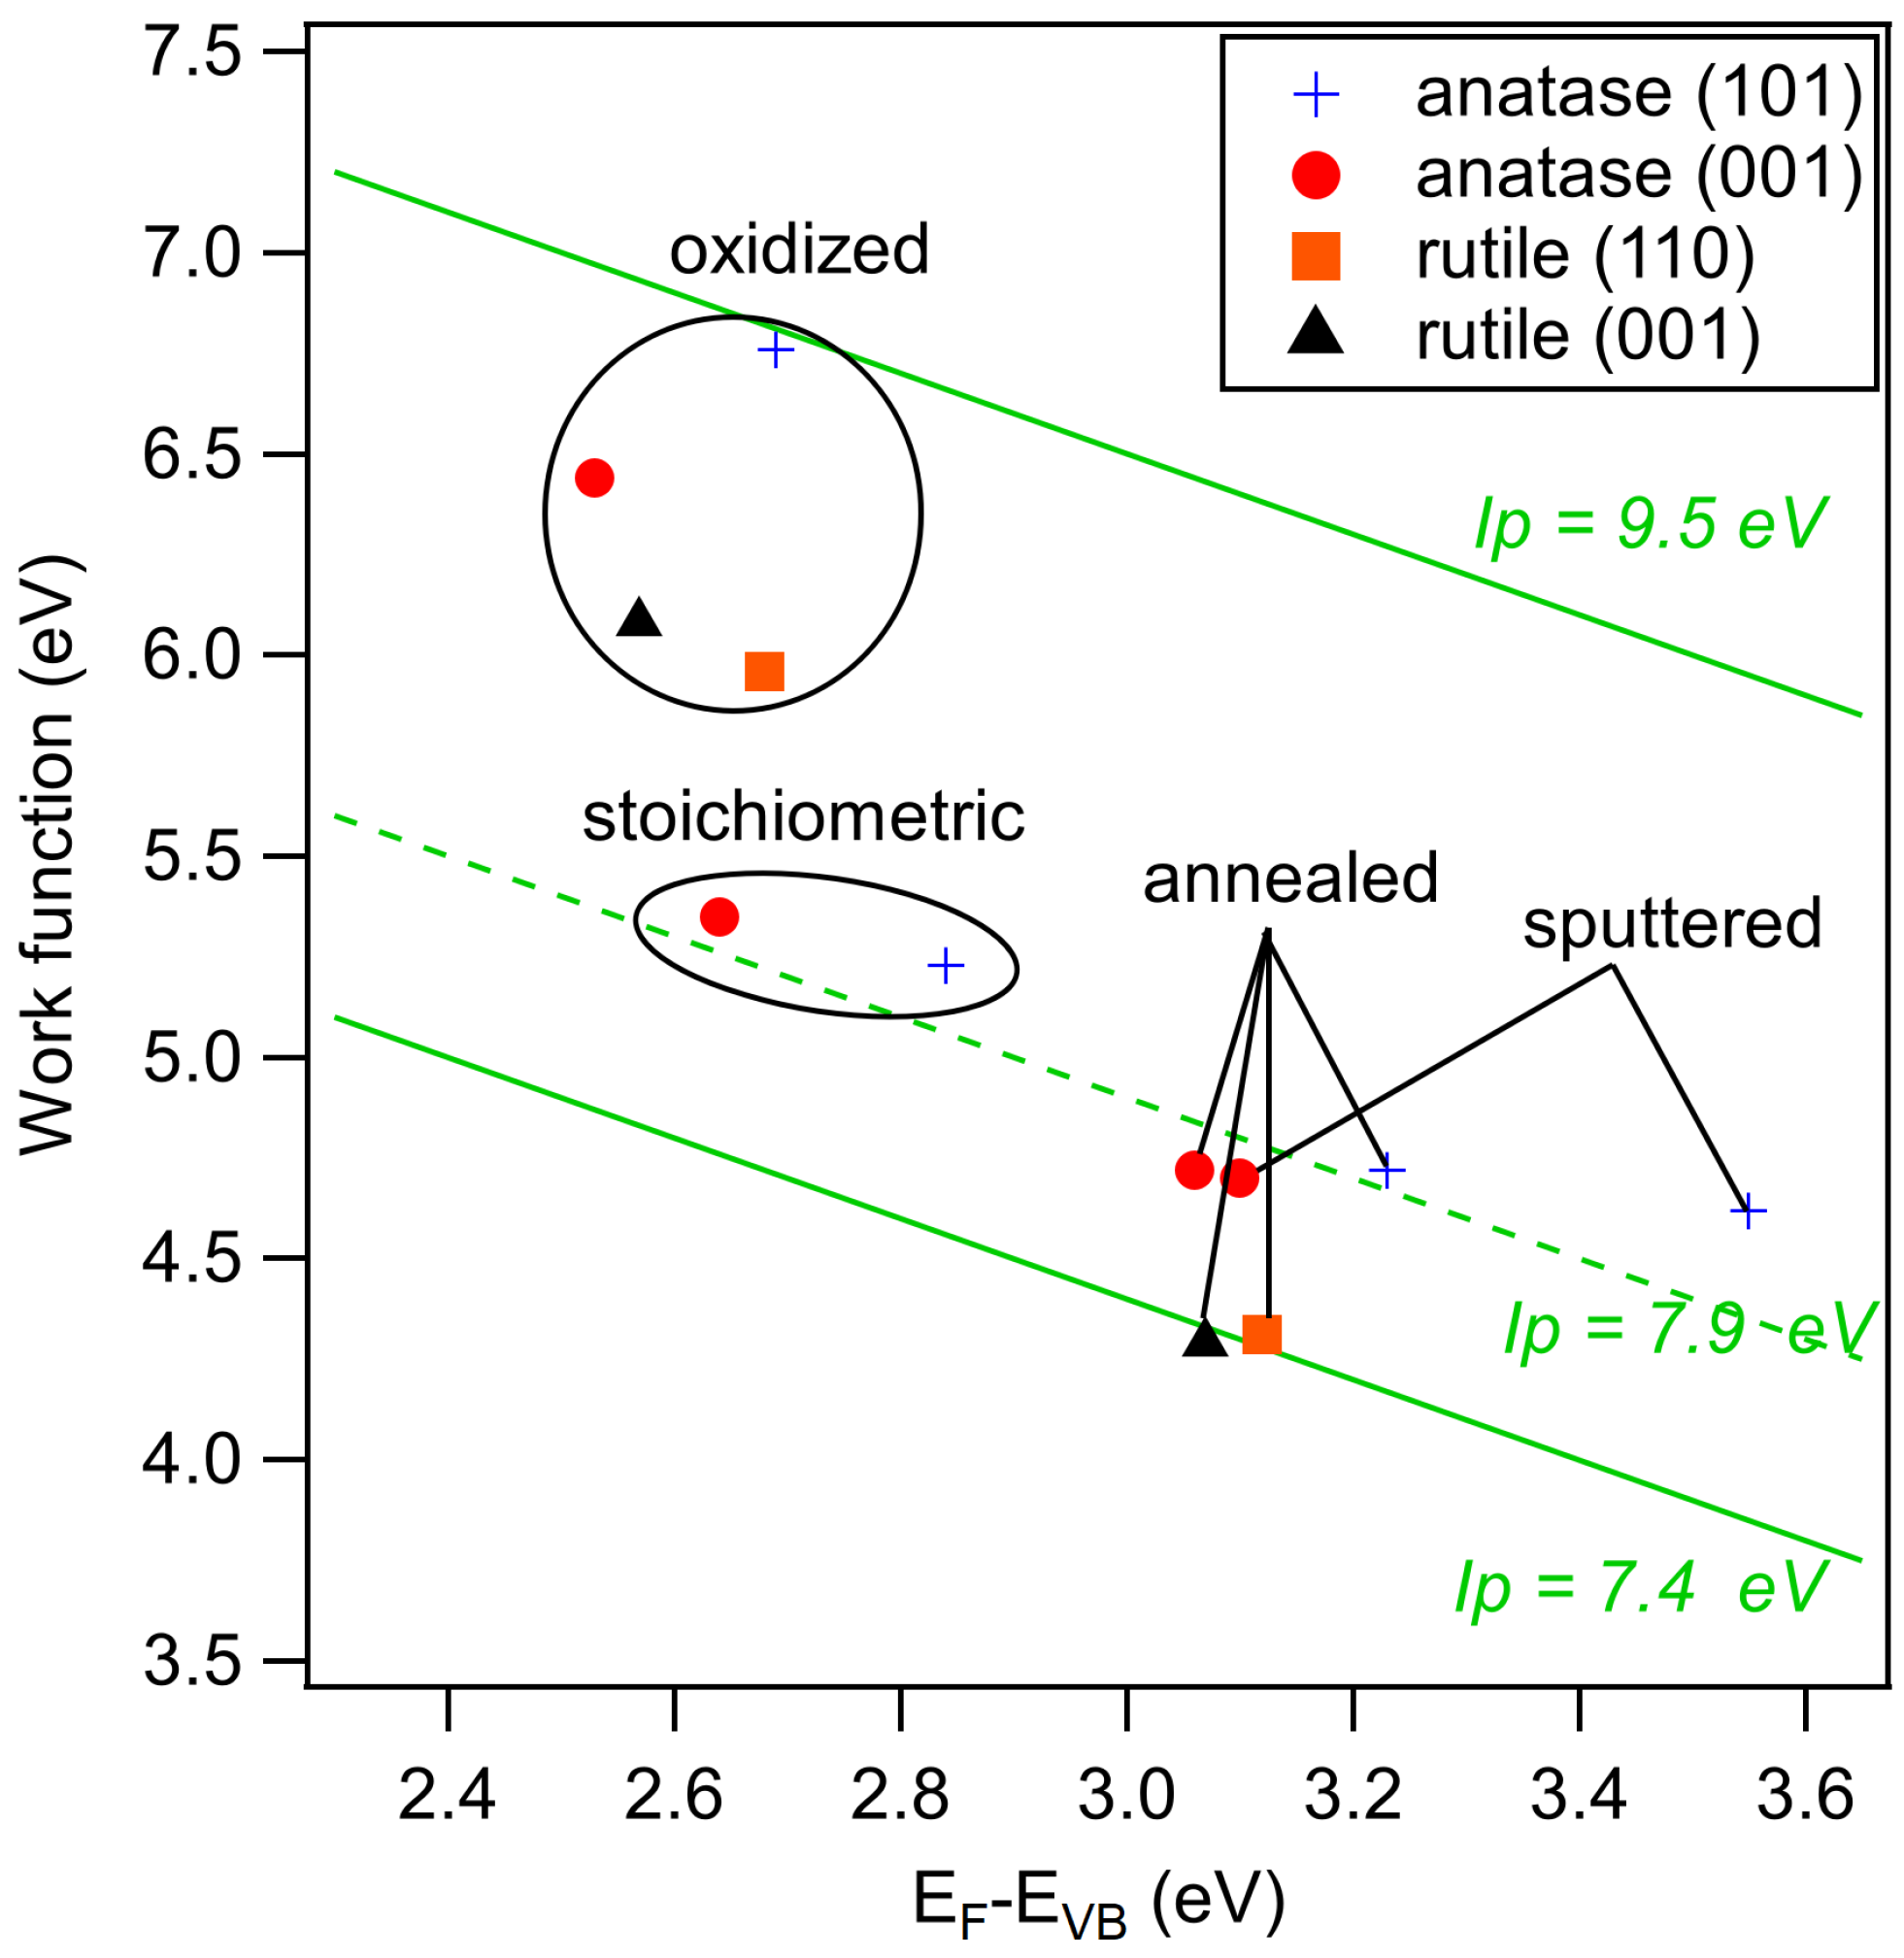
The secondary electron edges of the UP spectra of anatase are shown in Figure 5. Their energetic position is determined at the middle of the steep rise of the edge. (Most authors use the intersection of the secondary electron edge with the baseline to determine the work function. We take the middle of the steep rise instead as we assume that the onset is broadened by the resolution of the spectrometer system. We use this procedure when the width of the steep part of the edge is ≤0.2 eV, which is the case for all spectra in this manuscript. In this case, the difference between the two approaches is less than 0.1 eV.) The extracted work functions and ionization potentials are summarized in Table 1 and the work function is plotted as a function of the Fermi energy in Figure 6. More extended data including polycrystalline and water exposed samples are provided in the appendix in Figure A2 and Table A1. The work functions are decreasing in the order oxidized > stoichiometric > annealed > sputtered for both single crystal anatase surface orientations. It therefore decreases monotonically with the increase of the Fermi level to valence band maximum distance, . This is to be expected as both depend on the oxidation state of the surface and subsurface. Similar dependencies have been reported for ZnO, InO and SnO [25].
The overall variation of the work function is 1.74, 2.14 and 1.39 eV for anatase (001), anatase (101) and polycrystalline anatase, respectively. The change of between stoichiometric, annealed, and sputtered single crystal surfaces is caused mainly by a change of as the ionization potential is almost constant for these surface conditions with eV. Such a behavior has also been reported by Henrich et al. for rutile (110) surfaces [22]. The ionization potential of the polycrystalline surfaces varies more with preparation conditions than at the single crystalline surfaces. This is likely attributed to a less pure surface condition, as the surfaces typically show residual carbon contamination. Considerably higher ionization potentials of up to 9.45 eV are observed for the oxygen plasma treated surfaces. This matches with the assumed peroxo or bridging oxygen species on the surface, which are induced by radical oxygen atoms of the oxygen plasma. Electronegative oxygen accumulates with a negative charge, leading to high work functions and ionization potentials of oxidized surfaces due to an increase of the surface dipole [31,67].
Water vapor was exposed to the surfaces at room temperature and the resulting electronic properties were investigated by XPS and UPS. Obtained core level binding energies and surface potentials of the surfaces exposed to water are included in brackets in Table 1. The chemical modification of the surface resulting from water exposure is not clear. During low temperature adsorption, a mixture of molecular and dissociative adsorption is reported [4,40,41,42,43,44,45,46]. The adsorption of water molecules is not expected at room temperature in ultra-high vacuum but formation of hydroxides is likely. However, we do not have a clear confirmation for this. The O 1s peaks do not show the high binding energy shoulder typical for hydroxides. Nevertheless, the O 1s spectra do exclude a low OH coverage. Further studies, which are beyond the scope of the present work, are required to resolve the interaction of water vapor with TiO surfaces.
Irrespective of the uncertainty of the chemical state of the surface, water exposure reproducibly induces shifts of the Ti 2p and O 1s core levels and the valence band edge towards higher binding energies. The shifts can therefore be attributed to a downward band bending at the TiO surface, resulting in an accumulation of electrons at the surface. This observation emphasizes the importance of adsorbates for the frequently reported electron accumulation layers at oxide surfaces [68,69,70]. The final Fermi level positions, which are extracted from the valence band maximum and the core level binding energies do not depend on surface orientation and are ∼3.4, ∼3.1 and ∼2.9 eV for the annealed, stoichiometric and oxidized (001) and (101) surfaces, respectively. The original difference in between the anatase (101) and (001), which was present for all surface conditions, thus disappeared after water exposure.
The work function after water exposure is ∼4.4 eV for the annealed and stoichiometric surfaces, while it is significantly higher (∼5.0 eV) for the oxidized surface. Apparently, the adsorbed peroxo or bridging oxygen species, which cause the increased ionization potential, are not completely removed by water exposure. These species are therefore strongly enough bound to the surface to withstand the reduction of the sample by water exposure. The latter is indicated by the rise of the Fermi energy.
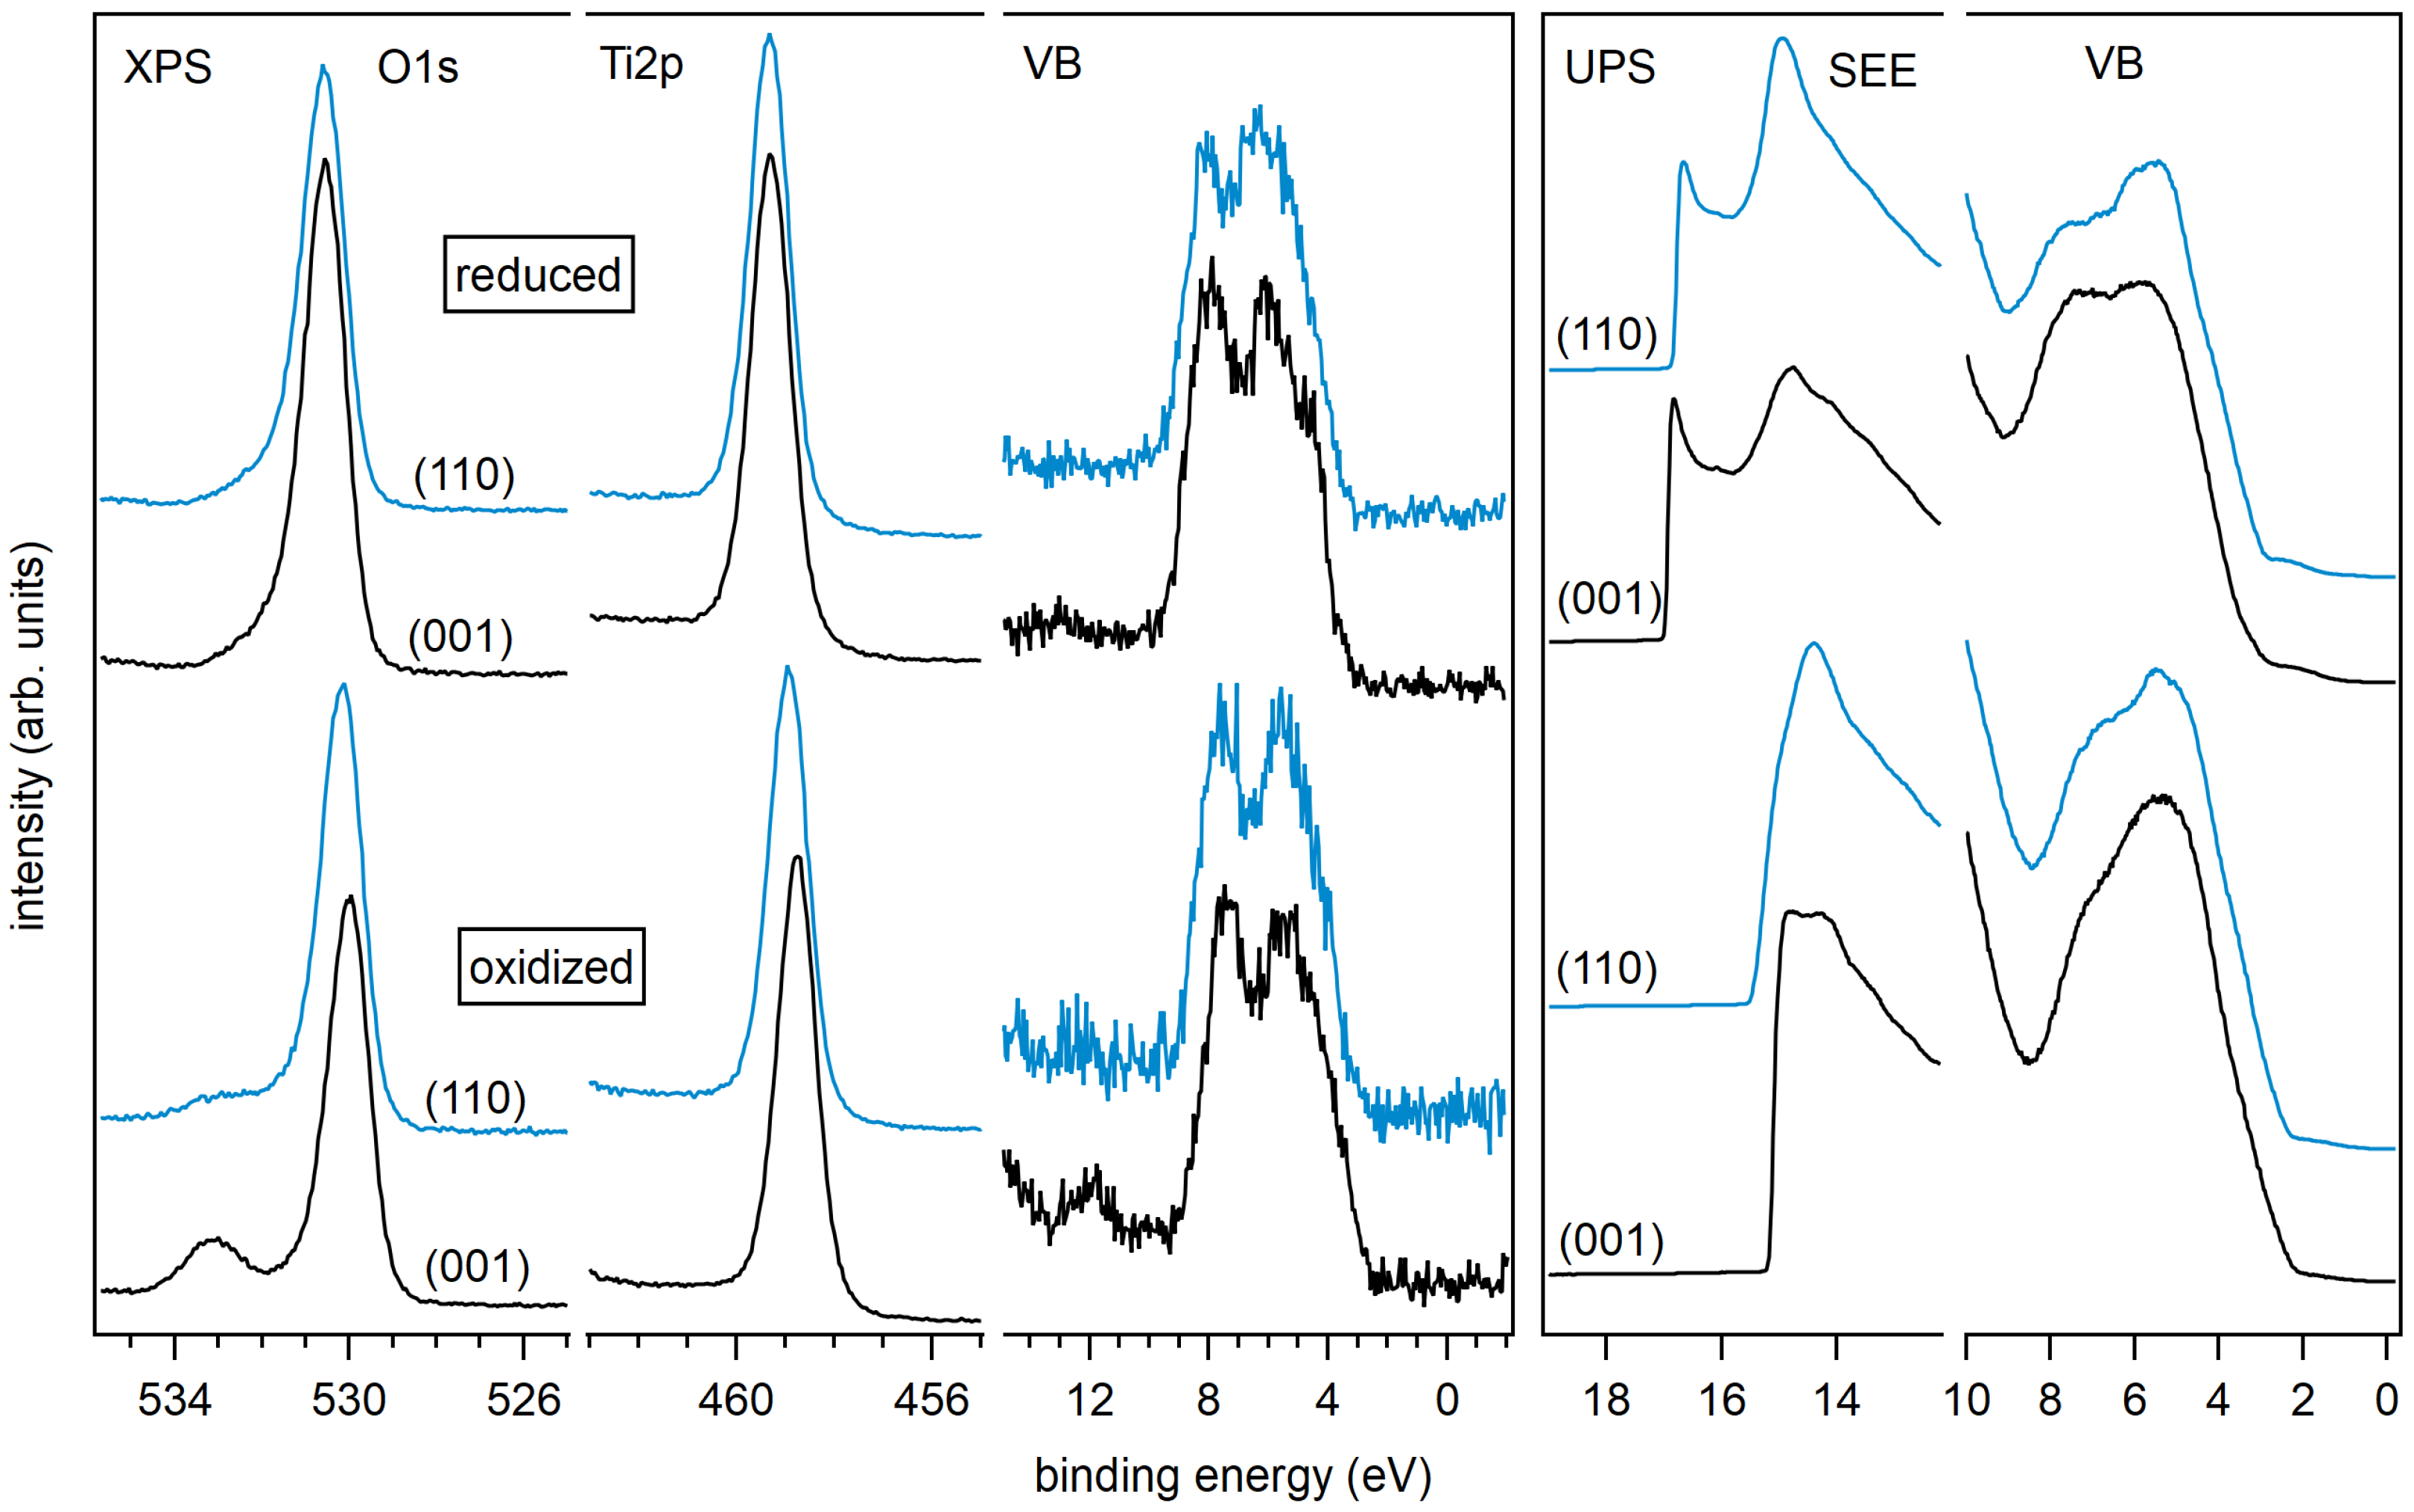
XP spectra of the valence band region, the Ti 2p, and the O 1s core levels of annealed and oxidized rutile (001) and (110) surfaces are shown in Figure 7. Corresponding core level binding energies and surface potentials are included in Table 1. Obtained work functions and ionization potentials are plotted together with the anatase data in Figure 6. A large difference of and between the two treatments but no significant dependence on surface orientation are observed. The ionization potential of the annealed surfaces amounts to eV, which is eV lower than that of the corresponding anatase surfaces.
The ionization potentials of the anatase and rutile surfaces (except for the ones treated in the O plasma), which are 7.96 and 7.40 eV, respectively, are comparable to those of ZnO surfaces exposed to oxidizing conditions (∼7.6 eV) [25,29]. Similar ionization potentials are also found for surfaces of Sn-doped InO (∼7.7 eV) and reduced SnO surfaces [25,29,71,72]. The latter are characterized by a Sn oxidation state [28,73,74,75]. Except for the sputtered anatase (101) surfaces, which exhibits substantial reduction of Ti, most of the Ti adopts a +IV oxidation state. One might therefore expect that the ionization potential is comparable to that of the stoichiometric SnO surface, which amounts to ∼8.9 eV [25,29,71,72]. The deviation is quite substantial, even for rutile, which has the same crystal structure as SnO. The ionization potential of TiO is therefore substantially lower than that of SnO. TiO surfaces do also not show the variation of cation oxidation state and the associate change of , which is characteristic for SnO. The origin of these remarkable differences remains to be resolved. Due to the similar ionization potentials and work functions of TiO, ZnO and InO, the superior photocatalytic and solar cell properties of TiO are probably not caused by an advantageous energy band alignment.
The difference in ionization potential between anatase and rutile amounts to ∼0.5 eV. Aligning the vacuum energies of the two polytypes does therefore result in a valence band maximum of anatase being ∼0.5 eV lower in energy than that of rutile. This is the same direction and of the same magnitude as the energy band alignment established recently by different experimental and theoretical approaches [19,76,77], supporting the conclusion that the energy bands of rutile are higher than those of anatase.
4. Summary and Conclusions
Chemical and electronic properties of anatase (001), anatase (101), polycrystalline anatase, rutile (110) and rutile (001) with different surface treatments were studied using XPS and UPS. The Fermi energy and work function depend drastically on surface conditions, which are characterized by different oxygen vacancy concentrations and surface adsorbates. We have shown how the surface Fermi energy, work function and ionization potentials are affected and can therefore be adjusted by different surface treatments.
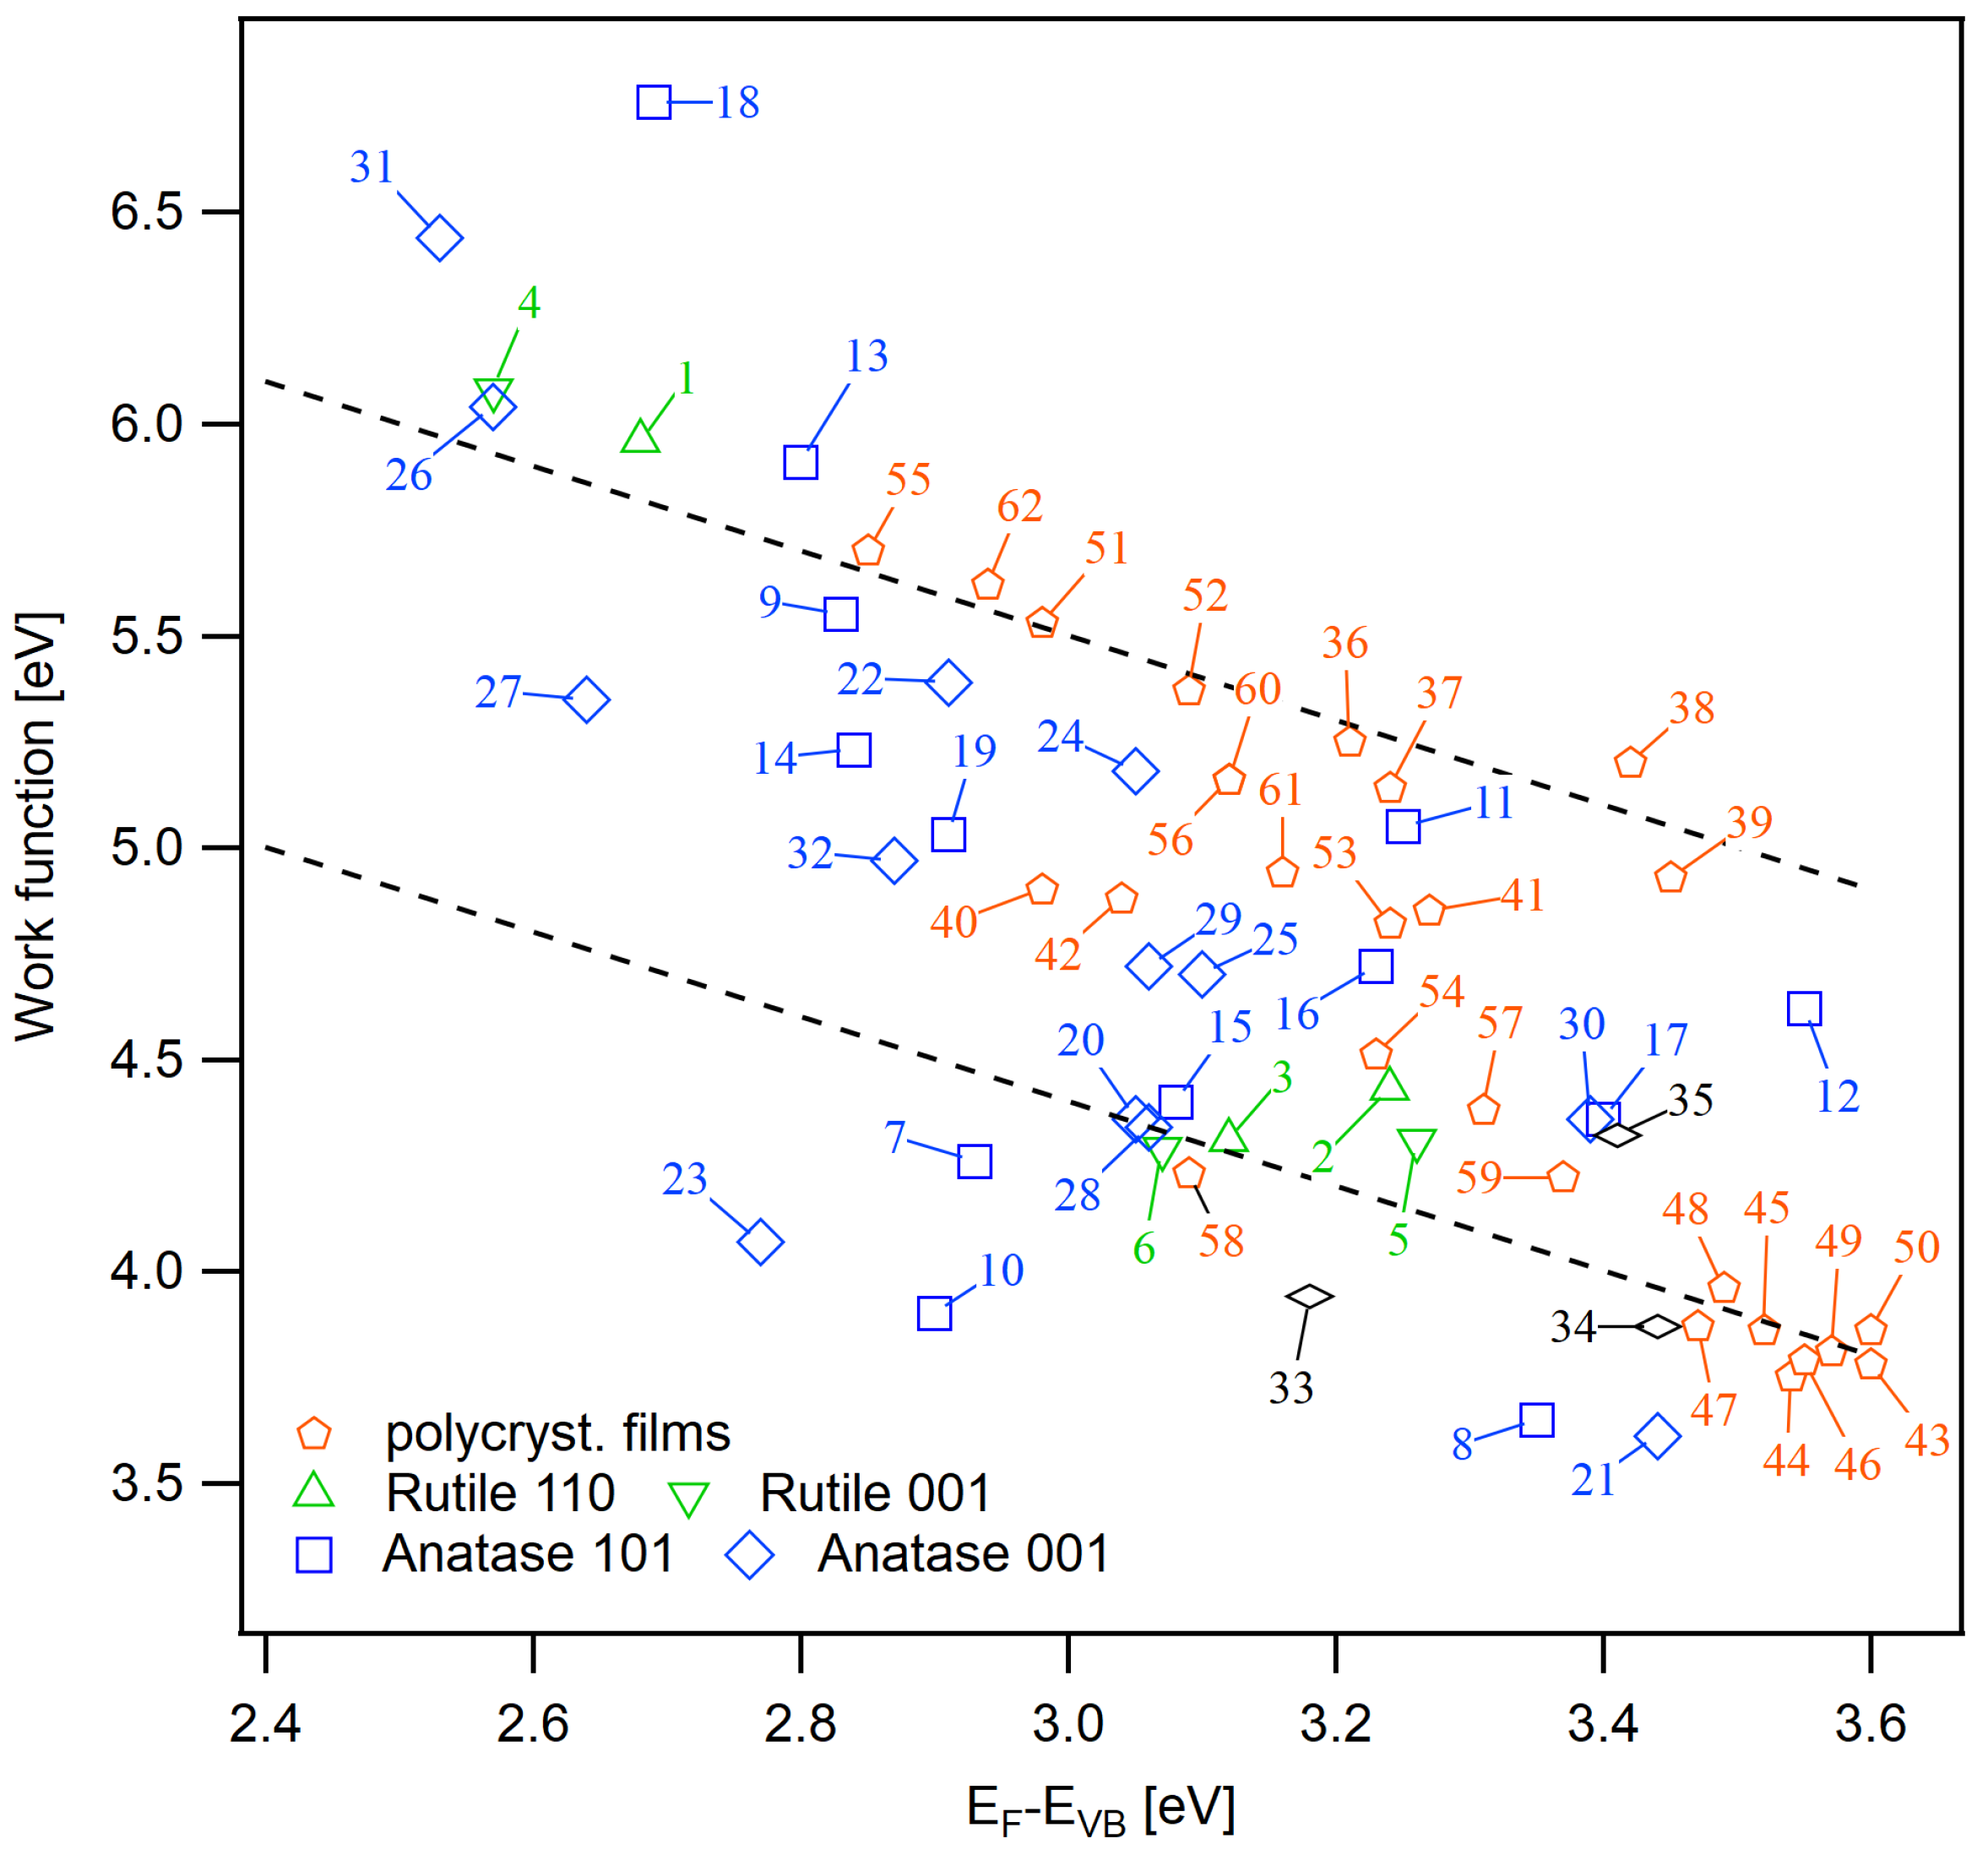
For anatase, the Fermi level can be manipulated between 2.53–3.10, 2.69–3.55, and 2.94–3.23 eV for the (001), (101) and polycrystalline surfaces, respectively. Along with the different Fermi energies goes a variation of work function between 4.70–6.44, 4.62–6.76, and 4.51–5.62 eV for the (001), (101) and polycrystalline surfaces, respectively. Apart from the plasma treated samples, which have exceptionally high work functions likely due to the presence of peroxo species, the ionization potential is rather insensitive to the surface treatments and exhibits a value of eV. This is approximately eV higher than of rutile, which agrees with the band alignment obtained from other techniques. For the anatase samples, the Fermi energy at the (101) surface is furthermore higher than at the (001) surface for all surface treatments.
Exposure of the samples to water vapor at room temperature reproducibly causes a downward band bending on all surfaces (rise of the Fermi energy). For the anatase surfaces, the dependence of Fermi energy on surface orientation is removed by water exposure. Water exposure also affects the ionization potential. Together, both effects result in a lowering of the work function down to eV ( eV) for the annealed and the stoichimetric surfaces. The ionization potential of the plasma treated surfaces remains rather high ( eV), resulting in work functions of eV after water exposure.
Author Contributions
Single and polycrystalline surfaces were prepared and analyzed by S.K. and J.M., supervised by A.K., W.J. and T.T.; Discussion and interpretation of results was conducted by S.K., A.K. and W.J.; The original draft has been composed by S.K., edited by A.K. and revised by all authors; Funding has been acquired by W.J. and T.T.
Funding
This work was partly supported by the European Commission within the Erasmus Mundus Joint Doctoral program International Doctoral School in Functional Materials for Energy, Information Technology, and Health (ids-funmat), the French-German University (UFA Doctoral College in Functional Materials for Energy and Information Technology) and was carried out within the framework of EMMI (European Multifunctional Material Institute). Further support was received from the European Commission under the FP7 project “Novel Composite Oxides by Combinatorial Material Synthesis for Next Generation All-Oxide-Photovoltaics,” project number 309018.
Acknowledgments
Receipt of polycrystalline samples from Arie Zaban’s group at Bar Ilan University, Israel, is also gratefully acknowledged.
Conflicts of Interest
The authors declare no conflict of interest. The founding sponsors had no role in the design of the study; in the collection, analyses, or interpretation of data; in the writing of the manuscript, and in the decision to publish the results.
Abbreviations
The following abbreviations are used in this manuscript:
| XPS | X-ray photoelectron spectroscopy |
| UPS | ultraviolet photoelectron spectroscopy |
| UHV | ultra-high vacuum |
| LEED | low-energy electron diffraction |
Appendix A. LEED Pattern for Annealed Anatase Surfaces
Figure A1.
LEED pattern of the annealed anatase (001) (a) and (101) (b) surfaces. The unit cells are indicated.
Figure A1.
LEED pattern of the annealed anatase (001) (a) and (101) (b) surfaces. The unit cells are indicated.
Appendix B. Further Work Function Data
Figure A2.
Extended set of work function and Fermi energy data. The description of the sample numbers are given in Table A1.
Figure A2.
Extended set of work function and Fermi energy data. The description of the sample numbers are given in Table A1.

Table A1.
Sample descriptions and surface potentials for Figure A2. All values are in eV with a typical uncertainty of eV.
Table A1.
Sample descriptions and surface potentials for Figure A2. All values are in eV with a typical uncertainty of eV.
| No. | Sample | Description | |||
|---|---|---|---|---|---|
| 1 | rutile (110) | (i) same as #2; (ii) O plasma, RT, 15 min | 2.68 | 5.96 | 8.64 |
| 2 | rutile (110) | (i) 500 C, 0.5 Pa O, 2h; (ii) 600 C, Pa, 1 h | 3.24 | 4.43 | 7.67 |
| 3 | rutile (110) | same as #2 | 3.12 | 4.31 | 7.43 |
| 4 | rutile (001) | same as #1 | 2.57 | 6.08 | 8.65 |
| 5 | rutile (001) | same as #2 | 3.26 | 4.31 | 7.57 |
| 6 | rutile (001) | same as #2 | 3.07 | 4.29 | 7.36 |
| 7 | anatase (101) | same as #2 | 2.93 | 4.26 | 7.19 |
| 8 | anatase (101) | same as #2 + air exposure | 3.35 | 3.65 | 7.00 |
| 9 | anatase (101) | O plasma, RT, 15 min | 2.83 | 5.55 | 8.38 |
| 10 | anatase (101) | same as #9 + air exposure | 2.90 | 3.90 | 6.80 |
| 11 | anatase (101) | (i) same as #12; (ii) O plasma, RT, 15 min; (iii) annealing in Pa, 200 C, 20 min | 3.25 | 5.05 | 8.30 |
| 12 | anatase (101) | cycles of sputtering + annealing 600 C, Pa, 1 h | 3.55 | 4.62 | 8.17 |
| 13 | anatase (101) | (i) same as #12; (ii) O plasma, RT, 15 min | 2.80 | 5.91 | 8.71 |
| 14 | anatase (101) | stoichiometric as in manuscript | 2.84 | 5.23 | 8.07 |
| 15 | anatase (101) | (i) same as #14; (ii) HO adsorption | 3.08 | 4.40 | 7.48 |
| 16 | anatase (101) | reduced as in manuscript | 3.23 | 4.72 | 7.95 |
| 17 | anatase (101) | (i) same #16; (ii) HO adsorption | 3.4 | 4.36 | 7.76 |
| 18 | anatase (101) | oxidized as in manuscript | 2.69 | 6.76 | 9.45 |
| 19 | anatase (101) | (i) same as #18; (ii) HO adsorption | 2.91 | 5.03 | 7.94 |
| 20 | anatase (001) | same as #7 | 3.05 | 4.36 | 7.41 |
| 21 | anatase (001) | same as #8 | 3.44 | 3.61 | 7.05 |
| 22 | anatase (001) | same as #9 | 2.83 | 5.55 | 8.38 |
| 23 | anatase (001) | same as #10 | 2.90 | 3.90 | 6.80 |
| 24 | anatase (001) | same as #11 | 3.25 | 5.05 | 8.30 |
| 25 | anatase (001) | same as #12 | 3.55 | 4.62 | 8.17 |
| 26 | anatase (001) | same as #13 | 2.80 | 5.91 | 8.71 |
| 27 | anatase (001) | same as #14 | 2.84 | 5.23 | 8.07 |
| 28 | anatase (001) | same as #15 | 3.08 | 4.4 | 7.48 |
| 29 | anatase (001) | same as #16 | 3.23 | 4.72 | 7.95 |
| 30 | anatase (001) | same as #17 | 3.40 | 4.36 | 7.76 |
| 31 | anatase (001) | same as #18 | 2.69 | 6.76 | 9.45 |
| 32 | anatase (001) | same as #19 | 2.91 | 5.03 | 7.94 |
| 33 | powder | sol-gel, as prepared | 3.18 | 3.94 | 7.12 |
| 34 | powder | hydrothermal, as prepared | 3.44 | 3.87 | 7.31 |
| 35 | nanocrystals | (101) facetted | 3.41 | 4.32 | 7.73 |
| 36 | sprayed film | 0.5 Pa O, 400 C, 12 h | 3.21 | 5.25 | 8.46 |
| 37 | sprayed film | 0.5 Pa Ar, 400 C, 12 h | 3.24 | 5.14 | 8.38 |
| 38–42 | sprayed film | same as #36 | – | – | – |
| 43–50 | sprayed film | as received | – | – | – |
| 51 | thin film | (i) in situ magnetron sputtering at RT; (ii) 0.5 Pa O, 600 C, 1 h | 2.98 | 5.53 | 8.51 |
| 52 | thin film | (i) in situ magnetron sputtering at RT; (ii) 0.5 Pa O, 400 C, 1 h | 3.09 | 5.37 | 8.46 |
| 53 | sprayed film | same as #11 | 3.24 | 4.82 | 8.06 |
| 54 | sprayed film | same as #12 | 3.23 | 4.51 | 7.74 |
| 55 | sprayed film | same as #13 | 2.85 | 5.70 | 8.55 |
| 56 | sprayed film | stoichiometric as in manuscript | 3.12 | 5.16 | 8.28 |
| 57 | sprayed film | (i) same as #58; (ii) HO adsorption | 3.31 | 4.23 | 7.32 |
| 58 | sprayed film | reduced as in manuscript | 3.09 | 4.23 | 7.32 |
| 59 | sprayed film | (i) same as #60; (ii) HO adsorption | 3.37 | 4.22 | 7.59 |
| 60 | sprayed film | stoichiometric as in manuscript | 3.12 | 5.16 | 8.28 |
| 61 | sprayed film | (i) same as #62; (ii) HO adsorption | 3.16 | 4.94 | 8.10 |
| 62 | sprayed film | oxidized as in manuscript | 2.94 | 5.62 | 8.56 |
References
- Linsebigler, A.L.; Lu, G.; Yates, J.T. Photocatalysis on TiO2 Surfaces: Principles, Mechanisms, and Selected Results. Chem. Rev. 1995, 95, 735–758. [Google Scholar] [CrossRef]
- Grätzel, M. Solar Energy Conversion by Dye-Sensitized Photovoltaic Cells. Inorg. Chem. 2005, 44, 6841–6851. [Google Scholar] [CrossRef] [PubMed]
- Selcuk, S.; Selloni, A. Facet-dependent trapping and dynamics of excess electrons at anatase TiO2 surfaces and aqueous interfaces. Nat. Mater. 2016, 15, 1107. [Google Scholar] [CrossRef] [PubMed]
- Diebold, U. The surface science of titanium dioxide. Surf. Sci. Rep. 2003, 48, 53–229. [Google Scholar] [CrossRef]
- Herman, G.S.; Gao, Y. Growth of epitaxial anatase (001) and (101) films. Thin Solid Films 2001, 397, 157–161. [Google Scholar] [CrossRef]
- Setvin, M.; Daniel, B.; Mansfeldova, V.; Kavan, L.; Scheiber, P.; Fidler, M.; Schmid, M.; Diebold, U. Surface preparation of TiO2 anatase (101): Pitfalls and how to avoid them. Surf. Sci. 2014, 626, 61–67. [Google Scholar] [CrossRef]
- Yang, H.G.; Sun, C.H.; Qiao, S.Z.; Zou, J.; Liu, G.; Smith, S.C.; Cheng, H.M.; Lu, G.Q. Anatase TiO2 single crystals with a large percentage of reactive facets. Nature 2008, 453, 638. [Google Scholar] [CrossRef] [PubMed]
- Chen, W.; Kuang, Q.; Wang, Q.; Xie, Z. Engineering a high energy surface of anatase TiO2 crystals towards enhanced performance for energy conversion and environmental applications. RSC Adv. 2015, 5, 20396–20409. [Google Scholar] [CrossRef]
- Liu, G.; Yu, J.C.; Lu, G.Q.M.; Cheng, H.M. Crystal facet engineering of semiconductor photocatalysts: motivations, advances and unique properties. Chem. Commun. 2011, 47, 6763–6783. [Google Scholar] [CrossRef] [PubMed]
- Scheiber, P.; Fidler, M.; Dulub, O.; Schmid, M.; Diebold, U.; Hou, W.; Aschauer, U.; Selloni, A. (Sub)Surface Mobility of Oxygen Vacancies at the TiO2 Anatase (101) Surface. Phys. Rev. Lett. 2012, 109, 136103. [Google Scholar] [CrossRef] [PubMed]
- Reckers, P.; Dimamay, M.; Klett, J.; Trost, S.; Zilberberg, K.; Riedl, T.; Parkinson, B.A.; Brötz, J.; Jaegermann, W.; Mayer, T. Deep and Shallow TiO2 Gap States on Cleaved Anatase Single Crystal (101) Surfaces, Nanocrystalline Anatase Films, and ALD Titania Ante and Post Annealing. J. Phys. Chem. C 2015, 119, 9890–9898. [Google Scholar] [CrossRef]
- Baldini, E.; Chiodo, L.; Dominguez, A.; Palummo, M.; Moser, S.; Yazdi-Rizi, M.; Auböck, G.; Mallett, B.P.; Berger, H.; Magrez, A. Strongly bound excitons in anatase TiO2 single crystals and nanoparticles. Nat. Commun. 2017, 8, 13. [Google Scholar] [CrossRef] [PubMed]
- Moser, S.; Moreschini, L.; Jaćimović, J.; Barišić, O.S.; Berger, H.; Magrez, A.; Chang, Y.J.; Kim, K.S.; Bostwick, A.; Rotenberg, E.; et al. Tunable Polaronic Conduction in Anatase TiO2. Phys. Rev. Lett. 2013, 110, 196403. [Google Scholar] [CrossRef] [PubMed]
- Emori, M.; Sakino, A.; Ozawa, K.; Sakama, H. Polarization-dependent ARPES measurement for valence band of anatase TiO2. Solid State Commun. 2014, 188, 15–18. [Google Scholar] [CrossRef]
- Sandell, A.; Sanyal, B.; Walle, L.; Richter, J.; Plogmaker, S.; Karlsson, P.; Borg, A.; Uvdal, P. Probing and modifying the empty-state threshold of anatase TiO2: Experiments and ab initio theory. Phys. Rev. B 2008, 78, 075113. [Google Scholar] [CrossRef]
- Tuan, A.C.; Kaspar, T.C.; Droubay, T.; Rogers, J.W., Jr.; Chambers, S.A. Band offsets for the epitaxial TiO2/SrTiO3/Si(001) system. Appl. Phys. Lett. 2003, 83, 3734–3736. [Google Scholar] [CrossRef]
- Thomas, A.G.; Flavell, W.R.; Kumarasinghe, A.R.; Mallick, A.K.; Tsoutsou, D.; Smith, G.C.; Stockbauer, R.; Patel, S.; Grätzel, M.; Hengerer, R. Resonant photoemission of anatase TiO2 (101) and (001) single crystals. Phys. Rev. B 2003, 67, 035110. [Google Scholar] [CrossRef]
- Thomas, A.G.; Flavell, W.R.; Mallick, A.K.; Kumarasinghe, A.R.; Tsoutsou, D.; Khan, N.; Chatwin, C.; Rayner, S.; Smith, G.C.; Stockbauer, R.L.; et al. Comparison of the electronic structure of anatase and rutile TiO2 single-crystal surfaces using resonant photoemission and X-ray absorption spectroscopy. Phys. Rev. B 2007, 75, 035105. [Google Scholar] [CrossRef]
- Pfeifer, V.; Erhart, P.; Li, S.; Rachut, K.; Morasch, J.; Brötz, J.; Reckers, P.; Mayer, T.; Rühle, S.; Zaban, A.; et al. Energy Band Alignment Between Anatase and Rutile TiO2. J. Phys. Chem. Lett. 2013, 4, 4182–4187. [Google Scholar] [CrossRef]
- Schwanitz, K.; Weiler, U.; Hunger, R.; Mayer, T.; Jaegermann, W. Synchrotron-induced photoelectron spectroscopy of the dye-sensitized nanocrystalline TiO2/electrolyte interface: Band gap states and their interaction with dye and solvent molecules. J. Phys. Chem. C 2007, 111, 849–854. [Google Scholar] [CrossRef]
- Liu, G.; Schulmeyer, T.; Thissen, A.; Klein, A.; Jaegermann, W. In situ preparation and interface characterization of TiO2/Cu2S heterointerface. Appl. Phys. Lett. 2003, 82, 2269–2271. [Google Scholar] [CrossRef]
- Henrich, V.E.; Dresselhaus, G.; Zeiger, H.J. Observation of Two-Dimensional Phases Associated with Defect States on the Surface of TiO2. Phys. Rev. Lett. 1976, 36, 1335–1339. [Google Scholar] [CrossRef]
- Thompson, T.L.; Diwald, O.; Yates, J.T. CO2 as a Probe for Monitoring the Surface Defects on TiO2(110)Temperature-Programmed Desorption. J. Phys. Chem. B 2003, 107, 11700–11704. [Google Scholar] [CrossRef]
- Borodin, A.; Reichling, M. Characterizing TiO2(110) surface states by their work function. Phys. Chem. Chem. Phys. 2011, 13, 15442–15447. [Google Scholar] [CrossRef] [PubMed]
- Klein, A.; Körber, C.; Wachau, A.; Säuberlich, F.; Gassenbauer, Y.; Schafranek, R.; Harvey, S.P.; Mason, T.O. Surface Potentials of Magnetron Sputtered Transparent Conducting Oxides. Thin Solid Films 2009, 518, 1197–1203. [Google Scholar] [CrossRef]
- Goniakowski, J.; Finocchi, F.; Noguera, C. Polarity of oxide surfaces and nanostructures. Rep. Prog. Phys. 2008, 71, 016501. [Google Scholar] [CrossRef]
- Ishii, H.; Sugiyama, K.; Ito, E.; Seki, K. Energy Level Alignment and Interfacial Electronic Structures at Organic/Metal and Organic/Organic Interfaces. Adv. Mater. 1999, 11, 605–625. [Google Scholar] [CrossRef]
- Batzill, M.; Diebold, U. The surface and materials science of tin oxide. Prog. Surf. Sci. 2005, 79, 47–154. [Google Scholar] [CrossRef]
- Klein, A.; Körber, C.; Wachau, A.; Säuberlich, F.; Gassenbauer, Y.; Harvey, S.P.; Proffit, D.E.; Mason, T.O. Transparent Conducting Oxides for Photovoltaics: Manipulation of Fermi Level, Work Function, and Energy Band Alignment. Materials 2010, 3, 4892–4914. [Google Scholar] [CrossRef] [PubMed]
- Hohmann, M.V.; Ágoston, P.; Wachau, A.; Bayer, T.J.M.; Brötz, J.; Albe, K.; Klein, A. Orientation Dependent Ionization Potential of In2O3: A Natural Source for Inhomogeneous Barrier Formation at Electrode Interfaces in Organic Electronics. J. Phys. Condens. Matter 2011, 23, 334203. [Google Scholar] [CrossRef] [PubMed]
- Wardenga, H.; Klein, A. Surface Potentials of (111), (110) and (100) oriented CeO2-x thin films. Appl. Surf. Sci. 2016, 377, 1–8. [Google Scholar] [CrossRef]
- Morgan, B.J.; Watson, G.W. A Density Functional Theory + U Study of Oxygen Vacancy Formation at the (110), (100), (101), and (001) Surfaces of Rutile TiO2. J. Phys. Chem. C 2009, 113, 7322–7328. [Google Scholar] [CrossRef]
- Cheng, H.; Selloni, A. Surface and subsurface oxygen vacancies in anatase TiO2 and differences with rutile. Phys. Rev. B 2009, 79, 092101. [Google Scholar] [CrossRef]
- Li, H.; Guo, Y.; Robertson, J. Calculation of TiO2 Surface and Subsurface Oxygen Vacancy by the Screened Exchange Functional. J. Phys. Chem. C 2015, 119, 18160–18166. [Google Scholar] [CrossRef]
- He, Y.; Dulub, O.; Cheng, H.; Selloni, A.; Diebold, U. Evidence for the Predominance of Subsurface Defects on Reduced Anatase TiO2(101). Phys. Rev. Lett. 2009, 102, 106105. [Google Scholar] [CrossRef] [PubMed]
- Bahnemann, D. Photocatalytic water treatment: solar energy applications. Solar Energy 2004, 77, 445–459. [Google Scholar] [CrossRef]
- Fujishima, A.; Zhang, X.; Tryk, D.A. TiO2 photocatalysis and related surface phenomena. Surf. Sci. Rep. 2008, 63, 515–582. [Google Scholar] [CrossRef]
- De Angelis, F.; Valentin, C.D.; Fantacci, S.; Vittadini, A.; Selloni, A. Theoretical Studies on Anatase and Less Common TiO2 Phases: Bulk, Surfaces, and Nanomaterials. Chem. Rev. 2014, 114, 9708–9753. [Google Scholar] [CrossRef] [PubMed]
- Bourikas, K.; Kordulis, C.; Lycourghiotis, A. Titanium Dioxide (Anatase and Rutile): Surface Chemistry, Liquid-Solid Interface Chemistry, and Scientific Synthesis of Supported Catalysts. Chem. Rev. 2014, 114, 9754–9823. [Google Scholar] [CrossRef] [PubMed]
- Pang, C.L.; Lindsay, R.; Thornton, G. Chemical reactions on rutile TiO2(110). Chem. Soc. Rev. 2008, 37, 2328–2353. [Google Scholar] [CrossRef] [PubMed]
- Hussain, H.; Tocci, G.; Woolcot, T.; Torrelles, X.; Pang, C.L.; Humphrey, D.S.; Yim, C.M.; Grinter, D.C.; Cabailh, G.; Bikondoa, O.; et al. Structure of a model TiO2 photocatalytic interface. Nat. Mater. 2017, 16, 461. [Google Scholar] [CrossRef] [PubMed]
- Vittadini, A.; Selloni, A.; Rotzinger, F.P.; Grätzel, M. Structure and Energetics of Water Adsorbed at TiO2 Anatase (101) and (001) Surfaces. Phys. Rev. Lett. 1998, 81, 2954–2957. [Google Scholar] [CrossRef]
- Aschauer, U.; He, Y.; Cheng, H.; Li, S.C.; Diebold, U.; Selloni, A. Influence of Subsurface Defects on the Surface Reactivity of TiO2: Water on Anatase (101). J. Phys. Chem. C 2010, 114, 1278–1284. [Google Scholar] [CrossRef]
- Li, Y.; Gao, Y. Interplay between Water and TiO2 Anatase (101) Surface with Subsurface Oxygen Vacancy. Phys. Rev. Lett. 2014, 112, 206101. [Google Scholar] [CrossRef]
- Jackman, M.J.; Thomas, A.G.; Muryn, C. Photoelectron Spectroscopy Study of Stoichiometric and Reduced Anatase TiO2(101) Surfaces: The Effect of Subsurface Defects on Water Adsorption at Near-Ambient Pressures. J. Phys. Chem. C 2015, 119, 13682–13690. [Google Scholar] [CrossRef]
- Liu, L.; Zhao, H.; Andino, J.M.; Li, Y. Photocatalytic CO2 Reduction with H2O on TiO2 Nanocrystals: Comparison of Anatase, Rutile, and Brookite Polymorphs and Exploration of Surface Chemistry. ACS Catal. 2012, 2, 1817–1828. [Google Scholar] [CrossRef]
- Duncan, D.; Allegretti, F.; Woodruff, D. Water does partially dissociate on the perfect TiO2 (110) surface: A quantitative structure determination. Phys. Rev. B 2012, 86, 045411. [Google Scholar] [CrossRef]
- Walle, L.E.; Borg, A.; Uvdal, P.; Sandell, A. Experimental evidence for mixed dissociative and molecular adsorption of water on a rutile TiO2 (110) surface without oxygen vacancies. Phys. Rev. B 2009, 80, 235436. [Google Scholar] [CrossRef]
- Mu, R.; Zhao, Z.J.; Dohnálek, Z.; Gong, J. Structural motifs of water on metal oxide surfaces. Chem. Soc. Rev. 2017, 46, 1785–1806. [Google Scholar] [CrossRef] [PubMed]
- Patrick, C.E.; Giustino, F. Structure of a water monolayer on the anatase TiO2 (101) surface. Phys. Rev. Appl. 2014, 2, 014001. [Google Scholar] [CrossRef]
- Henrion, O.; Klein, A.; Pettenkofer, C.; Jaegermann, W. Low temperature adsorption of water on cleaved GaAs(110) surfaces. Surf. Sci. Lett. 1996, 366, L685. [Google Scholar] [CrossRef]
- Klein, A. Interface Properties of Dielectric Oxides. J. Am. Ceram. Soc. 2016, 99, 369–387. [Google Scholar] [CrossRef]
- Wendt, S.; Sprunger, P.T.; Lira, E.; Madsen, G.K.H.; Li, Z.; Hansen, J.O.; Matthiesen, J.; Blekinge-Rasmussen, A.; Lægsgaard, E.; Hammer, B.; et al. The Role of Interstitial Sites in the Ti3d Defect State in the Band Gap of Titania. Science 2008, 320, 1755–1759. [Google Scholar] [CrossRef] [PubMed] [Green Version]
- Li, M.; Hebenstreit, W.; Gross, L.; Diebold, U.; Henderson, M.A.; Jennison, D.R.; Schultz, P.A.; Sears, M.P. Oxygen-induced restructuring of the TiO2(110) surface: A comprehensive study. Surf. Sci. 1999, 437, 173–190. [Google Scholar] [CrossRef]
- Wu, C.C.; Wu, C.I.; Sturm, J.C.; Kahn, A. Surface modification of indium tin oxide by plasma treatment: An effective method to improve the efficiency, brightness, and reliability of organic light emitting devices. Appl. Phys. Lett. 1997, 70, 1348. [Google Scholar] [CrossRef]
- Klissurski, D.; Hadjiivanov, K.; Kantcheva, M.; Gyurova, L. Study of peroxide-modified titanium dioxide (anatase). J. Chem. Soc. Faraday Trans. 1990, 86, 385–388. [Google Scholar] [CrossRef]
- Iwamoto, M.; Yoda, Y.; Yamazoe, N.; Seiyama, T. Study of metal oxide catalysts by temperature programmed desorption. 4. Oxygen adsorption on various metal oxides. J. Phys. Chem. 1978, 82, 2564–2570. [Google Scholar] [CrossRef]
- Bayer, T.J.M.; Wachau, A.; Fuchs, A.; Deuermeier, J.; Klein, A. Atomic layer deposition of Al2O3 onto Sn-doped In2O3: Absence of self-limited adsorption during initial growth by oxygen diffusion from the substrate and band offset modification by Fermi level pinning in Al2O3. Chem. Mater. 2012, 24, 4503–4510. [Google Scholar] [CrossRef]
- Klein, A. Transparent Conducting Oxides: Electronic Structure - Property Relationship from Photoelectron Spectroscopy with in-situ Sample Preparation. J. Am. Ceram. Soc. 2013, 96, 331–345. [Google Scholar] [CrossRef]
- Idriss, H.; Barteau, M.A. Characterization of TiO2 surfaces active for novel organic syntheses. Catal. Lett. 1994, 26, 123–139. [Google Scholar] [CrossRef]
- Moulder, J.F.; Stickle, W.F.; Sobol, P.E.; Bomben, K.D. Handbook of X-ray Photoelectron Spectroscopy; Physical Electronics, Inc.: Eden Prairie, MN, USA, 1995. [Google Scholar]
- Yesodharan, E.; Grätzel, M. Photodecomposition of Liquid Water with TiO2? Supported Noble Metal Clusters. Helv. Chim. Acta 1983, 66, 2145–2153. [Google Scholar] [CrossRef]
- Kodaira, S.; Sakisaka, Y.; Maruyama, T.; Haruyama, Y.; Aiura, Y.; Kato, H. Angle-resolved photoemission study of an in-gap state in TiO2. Solid State Commun. 1994, 89, 9–12. [Google Scholar] [CrossRef]
- Finazzi, E.; Valentin, C.D.; Pacchioni, G.; Selloni, A. Excess electron states in reduced bulk anatase TiO2: Comparison of standard GGA, GGA+U, and hybrid DFT calculations. J. Chem. Phys. 2008, 129, 154113. [Google Scholar] [CrossRef] [PubMed]
- Ohno, T.; Sarukawa, K.; Matsumura, M. Crystal faces of rutile and anatase TiO2 particles and their roles in photocatalytic reactions. New J. Chem. 2002, 26, 1167–1170. [Google Scholar] [CrossRef]
- Yu, J.; Low, J.; Xiao, W.; Zhou, P.; Jaroniec, M. Enhanced Photocatalytic CO2-Reduction Activity of Anatase TiO2 by Coexposed 001 and 101 Facets. J. Am. Chem. Soc. 2014, 136, 8839–8842. [Google Scholar] [CrossRef] [PubMed]
- Dette, C.; Pérez-Osorio, M.A.; Kley, C.S.; Punke, P.; Patrick, C.E.; Jacobson, P.; Giustino, F.; Jung, S.J.; Kern, K. TiO2 Anatase with a Bandgap in the Visible Region. Nano Lett. 2014, 14, 6533–6538. [Google Scholar] [CrossRef] [PubMed]
- King, P.D.C.; Veal, T.D.; Fuchs, F.; Wang, C.Y.; Payne, D.J.; Bourlange, A.; Zhang, H.; Bell, G.R.; Cimalla, V.; Ambacher, O.; et al. Band gap, electronic structure, and surface electron accumulation of cubic and rhombohedral In2O3. Phys. Rev. B 2009, 79, 205211. [Google Scholar] [CrossRef]
- Berthold, T.; Rombach, J.; Stauden, T.; Polyakov, V.; Cimalla, V.; Krischok, S.; Bierwagen, O.; Himmerlich, M. Consequences of plasma oxidation and vacuum annealing on the chemical properties and electron accumulation of In2O3 surfaces. J. Appl. Phys. 2016, 120, 245301. [Google Scholar] [CrossRef]
- Vasheghani Farahani, S.K.; Veal, T.D.; Mudd, J.J.; Scanlon, D.O.; Watson, G.W.; Bierwagen, O.; White, M.E.; Speck, J.S.; McConville, C.F. Valence-band density of states and surface electron accumulation in epitaxial SnO2 films. Phys. Rev. B 2014, 90, 155413. [Google Scholar] [CrossRef]
- Körber, C.; Ágoston, P.; Klein, A. Surface and Bulk Properties of Sputter Deposited Intrinsic and Doped SnO2 Thin Films. Sens. Actuators B 2009, 139, 665–672. [Google Scholar] [CrossRef]
- Rachut, K.; Körber, C.; Brötz, J.; Klein, A. Growth and Surface Properties of Epitaxial SnO2. Phys. Stat. Sol. (A) 2014, 211, 1997–2004. [Google Scholar] [CrossRef]
- Batzill, M.; Katsiev, K.; Burst, J.M.; Diebold, U.; Chaka, A.M.; Delley, B. Gas-phase-dependent properties of SnO2 (110), (100), and (101) single-crystal surfaces: Structure, composition, and electronic properties. Phys. Rev. B 2005, 72, 165414. [Google Scholar] [CrossRef]
- Cox, D.F.; Fryberger, T.B.; Semancik, S. Oxygen vacancies and defect electronic states on the SnO2(110)-1×1 surface. Phys. Rev. B 1988, 38, 2072–2083. [Google Scholar] [CrossRef]
- Ágoston, P.; Albe, K. Disordered reconstructions of the reduced SnO2-(110) surface. Surf. Sci. 2011, 605, 714–722. [Google Scholar] [CrossRef]
- Deák, P.; Aradi, B.; Frauenheim, T. Band Lineup and Charge Carrier Separation in Mixed Rutile-Anatase Systems. J. Phys. Chem. C 2011, 115, 3443–3446. [Google Scholar] [CrossRef]
- Scanlon, D.O.; Dunnill, C.W.; Buckeridge, J.; Shevlin, S.A.; Logsdail, A.J.; Woodley, S.M.; Catlow, C.R.A.; Powell, M.J.; Palgrave, R.G.; Parkin, I.P.; et al. Band alignment of rutile and anatase TiO2. Nat. Mater. 2013, 12, 798. [Google Scholar] [CrossRef] [PubMed]
Figure 1.
Bulk-terminated surfaces of (a) anatase (101), (b) anatase (001), (c) rutile (110) and (d) rutile (001), illustrated using VESTA.
Figure 1.
Bulk-terminated surfaces of (a) anatase (101), (b) anatase (001), (c) rutile (110) and (d) rutile (001), illustrated using VESTA.
Figure 2.
Scheme of the preparation procedure for ex-situ (ex), sputtered (sp), annealed (an), oxidized (ox), and stoichiometric (st) surfaces of the TiO surfaces.
Figure 2.
Scheme of the preparation procedure for ex-situ (ex), sputtered (sp), annealed (an), oxidized (ox), and stoichiometric (st) surfaces of the TiO surfaces.
Figure 3.
X-ray photoelectron spectra of the Ti 2p (top) and the O 1s (bottom) core level emissions of (left) anatase (001), (middle) anatase (101), and (right) polycrystalline anatase substrates with sputtered, annealed, stoichiometric, and oxidized surfaces. Solid and dash lines represent spectra before and after water exposure, respectively.
Figure 4.
X-ray (top) and ultraviolet (bottom) valence band spectra of sputtered, annealed, stoichiometric, and oxidized surfaces for (left) anatase (001), (middle) anatase (101), and (right) polycrystalline anatase substrates before and after water exposure.
Figure 4.
X-ray (top) and ultraviolet (bottom) valence band spectra of sputtered, annealed, stoichiometric, and oxidized surfaces for (left) anatase (001), (middle) anatase (101), and (right) polycrystalline anatase substrates before and after water exposure.
Figure 5.
UP spectra of SEE of sputtered, annealed, stoichiometric, and oxidized surfaces for anatase (001), anatase (101), and polycrystalline anatase substrates before and after water exposure.
Figure 5.
UP spectra of SEE of sputtered, annealed, stoichiometric, and oxidized surfaces for anatase (001), anatase (101), and polycrystalline anatase substrates before and after water exposure.
Figure 6.
Work function versus Fermi level to valence band maximum distance, , of sputtered, annealed, stoichiometric, and oxidized surfaces for anatase (001), anatase (101), and polycrystalline anatase substrates before and after water exposure. Values for annealed and oxidized rutile (001) and (110) surfaces are added for comparison.
Figure 7.
XP spectra of Ti 2p, O 1s, and valence band emission lines, and UP spectra of secondary electron edge and valence band region for rutile (001) and (110) substrates with reduced and oxidized surfaces.
Figure 7.
XP spectra of Ti 2p, O 1s, and valence band emission lines, and UP spectra of secondary electron edge and valence band region for rutile (001) and (110) substrates with reduced and oxidized surfaces.
Table 1.
Binding energies (Ti 2p and O 1s), Fermi level position , work function , and ionization potential for anatase (001), anatase (101), and polycrystalline anatase, as well as for rutile (001) and rutile (110) with different surface stoichiometries: sputtered, annealed, stoichiometric, oxidized and ex-situ prepared surfaces. Number in brackets are obtained after in situ exposure to water vapor at room temperature.
| Sputtered | Annealed | Stoichiometric | Oxidized | Ex-Situ | |
|---|---|---|---|---|---|
| Ti 2p (eV) | |||||
| a-(001) | 459.08 | 459.07 (459.36) | 458.70 (459.20) | 458.64 (459.06) | 459.27 |
| a-(101) | 459.21 | 459.17 (459.31) | 458.73 (458.93) | 458.69 (458.91) | 459.28 |
| a-poly | 459.25 | 459.28 (459.44) | 459.06 (459.37) | 458.95 (459.09) | |
| r-(001) | 459.38 | 458.78 | |||
| r-(110) | 459.35 | 458.95 | |||
| O 1s (eV) | |||||
| a-(001) | 530.35 | 530.33 (530.62) | 529.95 (530.47) | 529.93 (530.32) | 530.60 |
| a-(101) | 530.81 | 530.52 (530.68) | 530.07 (530.27) | 529.93 (530.19) | 530.62 |
| a-poly | 530.57 | 530.56 (530.71) | 530.35 (530.64) | 530.20 (530.44) | |
| r-(001) | 530.69 | 530.04 | |||
| r-(110) | 530.62 | 530.21 | |||
| (eV) | |||||
| a-(001) | 3.10 | 3.06 (3.39) | 2.64 (3.06) | 2.53 (2.87) | 3.44 |
| a-(101) | 3.55 | 3.23 (3.40) | 2.84 (3.08) | 2.69 (2.91) | 3.35 |
| a-poly | 3.23 | 3.09 (3.37) | 3.12 (3.31) | 2.94 (3.16) | |
| r-(001) | 3.07 | 2.57 | |||
| r-(110) | 3.12 | 2.68 | |||
| in (eV) | |||||
| a-(001) | 4.70 | 4.72 (4.36) | 5.35 (4.34) | 6.44 (4.97) | 3.61 |
| a-(101) | 4.62 | 4.72 (4.36) | 5.23 (4.40) | 6.76 (5.03) | 3.65 |
| a-poly | 4.51 | 4.23 (4.22) | 5.16 (4.38) | 5.62 (4.94) | |
| r-(001) | 4.29 | 6.08 | |||
| r-(110) | 4.31 | 5.96 | |||
| (eV) | |||||
| a-(001) | 7.80 | 7.78 (7.75) | 7.99 (7.40) | 8.97 (7.84) | 7.05 |
| a-(101) | 8.17 | 7.95 (7.76) | 8.07 (7.48) | 9.45 (7.94) | 7.00 |
| a-poly | 7.74 | 7.32 (7.59) | 8.28 (7.69) | 8.56 (8.10) | |
| r-(001) | 7.36 | 8.65 | |||
| r-(110) | 7.43 | 8.64 | |||
© 2018 by the authors. Licensee MDPI, Basel, Switzerland. This article is an open access article distributed under the terms and conditions of the Creative Commons Attribution (CC BY) license (http://creativecommons.org/licenses/by/4.0/).
Share and Cite
MDPI and ACS Style
Kashiwaya, S.; Morasch, J.; Streibel, V.; Toupance, T.; Jaegermann, W.; Klein, A. The Work Function of TiO2. Surfaces 2018, 1, 73-89. https://doi.org/10.3390/surfaces1010007
AMA Style
Kashiwaya S, Morasch J, Streibel V, Toupance T, Jaegermann W, Klein A. The Work Function of TiO2. Surfaces. 2018; 1(1):73-89. https://doi.org/10.3390/surfaces1010007
Chicago/Turabian StyleKashiwaya, Shun, Jan Morasch, Verena Streibel, Thierry Toupance, Wolfram Jaegermann, and Andreas Klein. 2018. "The Work Function of TiO2" Surfaces 1, no. 1: 73-89. https://doi.org/10.3390/surfaces1010007