The Spatial Prediction of Soil Texture Fractions in Arid Regions of Iran
by

Elham Mehrabi-Gohari
1, 
Hamid Reza Matinfar
2,*,
Azam Jafari
3,
Ruhollah Taghizadeh-Mehrjardi
4,5 and
John Triantafilis
6
1
Department of Soil Science, College of Agriculture, Lorestan University, Khorramabad 6815144316, Iran
2
Department of Soil Science, College of Agriculture, Lorestan University, Khorramabad 6815144316, Iran
3
Department of Soil Science, Agriculture Faculty, Shahid Bahonar University of Kerman, Kerman 76169-14111, Iran
4
Soil Science and Geomorphology, Institute of Geography, University of Tübingen, 72070 Tübingen, Germany
5
Faculty of Agriculture and Natural Resources, Ardakan University, Ardakan 8951656767, Iran
6
School of Biological, Earth and Environmental Sciences, Faculty of Science, The University of New South Wales, NSW 2052, Australia
*
Author to whom correspondence should be addressed.
Soil Syst. 2019, 3(4), 65; https://doi.org/10.3390/soilsystems3040065
Submission received: 31 May 2019
/
Revised: 10 August 2019
/
Accepted: 24 September 2019
/
Published: 26 September 2019
(This article belongs to the Special Issue Digital Soil Mapping of Soil Functions)
Abstract
:To predict the soil texture fractions, 115 profiles were identified based on the Latin hypercube sampling technique, the horizons were sampled, and the clay, sand, and silt contents (in percentages) of soil samples were measured. Then equal-area quadratic spline depth functions were used to derive clay, sand, and silt contents at five standard soil depths (0–5, 5–15, 15–30, 30–60, and 60–100 cm). Auxiliary variables used in this study include the terrain attributes (derived from a digital elevation model), Landsat 8 image data (acquired in 2015), geomorphological map, and spectrometric data (laboratory data). Artificial neural network (ANN), regression tree (RT), and neuro-fuzzy (ANFIS) models were used to make a correlation between soil data (clay, sand, and silt) and auxiliary variables. The results of this study showed that the ANFIS model was more accurate in the prediction of the three parameters of clay, silt, and sand than ANN and RT. Moreover, the ability of ANFIS model to estimate the soil texture fractions in the surface layers was higher than the lower layers. The mean coefficient of determination (R2) values calculated by 10-fold cross validation suggested the higher prediction performance in the upper depth intervals and higher prediction error in the lower depth intervals (e.g., R2 = 0.91, concordance correlation coefficient (CCC) = 0.90, RMSE = 4.00 g kg−1 for sand of 0–5 cm depth, and R2 = 0.68, CCC = 0.60, RMSE = 8.03 g kg−1 for 60–100 cm depth). The results also showed that the most important auxiliary variables are spectrometric data, multi-resolution, valley-bottom flatness index and wetness index. Overall, it is recommended to use ANFIS models for the digital mapping of soil texture fractions in other arid regions of Iran.
1. Introduction
Soil texture is one of the most important soil properties, because it affects the amount of accessible water and nutrients, permeability, drainage, ventilation, organic carbon content, buffer capacity, porosity, and many mechanical properties of soil [1]. Soil texture is also important in the comprehensive soil classification system used to identify the grades, and to classify soils at the family level, including Argillic, Nitric, and Kandic horizons [2,3]. Soil texture data, that is the distribution of the particle size fractions, are also among the necessary input data for most hydrological, ecological, climate and environmental models [4]. In addition, soil texture is used in some pedotransfer functions to estimate properties such as bulk density, water conductivity, and soil water holding capacity [5]. Soil texture is also important in determining the suitability of soil for some of the special uses, such as landfill and water management [6,7].
Despite the importance of soil texture, and while there is an increasing amount of literature on the use of digital soil mapping (DSM) methods to map soil texture on the field [8] and district scales [9], there is a paucity of data available for environmental modeling at the landscape scale. Specifically, in most of the existing soil maps, there is little soil texture data spatially across the landscape and associated with mapped classes [10]. Of equal concern is the lack of data which captures the gradual change of soil texture with depth [11]. In terms of the latter, soil texture data is needed, because clear or abrupt changes affect soil permeability and drainage, and consequently, ecosystem function. Recently, much research has been conducted in this area with the use of continuous depth functions to predict soil textures [12]. One of the first to use such functions was Jenny [13], who used freehand curve methods. More recently, advanced techniques have been used; including, exponential decay functions [14], polynomials [15], or equal-area splines [16]. One of the most popularly applied are splines which have been used to model continuous changes of soil properties with depth [11,17,18,19,20,21,22].
The use of the digital soil mapping (DSM) approach, which has become de rigueur in recent years [23], can be applied to prepare these continuous depth functions. This is because the basis of DSM, the scorpan (soil, climate, organisms, parent materials, age and spatial position) model [24], is based on the modelling set of soil properties or soil classes (such as soil texture class) with more readily available auxiliary variables derived from other sources, such as conventional soil/geology maps, digital elevation models, remote or proximal sensing measurements, and expert knowledge. Those are considered, and then, using appropriate prediction models, soil properties or classes can be predicted [24].
To predict soil texture, various prediction models have been considered. These include data mining techniques, such as artificial neural networks (ANN), regression trees (RT) and neuro-fuzzy (ANFIS) systems. For example, Zhao et al. [25] used an ANN model to generate a soil texture map. Jafari et al. [26] also predicted soil texture classes by a boosted RT in an arid region and by considering multi-resolution valley flatness and moisture indices in their DSM as important auxiliary variables for their model. They also concluded that a geomorphological map is a very important auxiliary variable, which may be due to the recent formation of geomorphological levels, which have good correlations with soil genesis processes in arid regions. Additionally, Taghizadeh-Mehrjardi et al. [6] prepared a three-dimensional soil salinity map using an RT model in the Ardakan region. The use of ANFIS is another suitable method for predicting soil properties. The ANFIS model, which combines a neural network with fuzzy logic, determines the parameters of the fuzzy system using the neural network training algorithm. This model implements a fuzzy system in a neural structure and uses a combination of training methods, including gradient descent and the least square error [27,28,29].
The objectives of the present study are (i) to predict soil texture fractions, from the various particle size fractions data (i.e., clay, silt, and sand) using data mining models, including a regression tree, an artificial neural network and a neuro-fuzzy system, and (ii) to study the impact of auxiliary data, such as terrain parameters, satellite images, geomorphological maps, and spectrometric data for predicting the spatial distribution of clay, sand, and silt contents.
2. Materials and Methods
2.1. Description of the Study Region
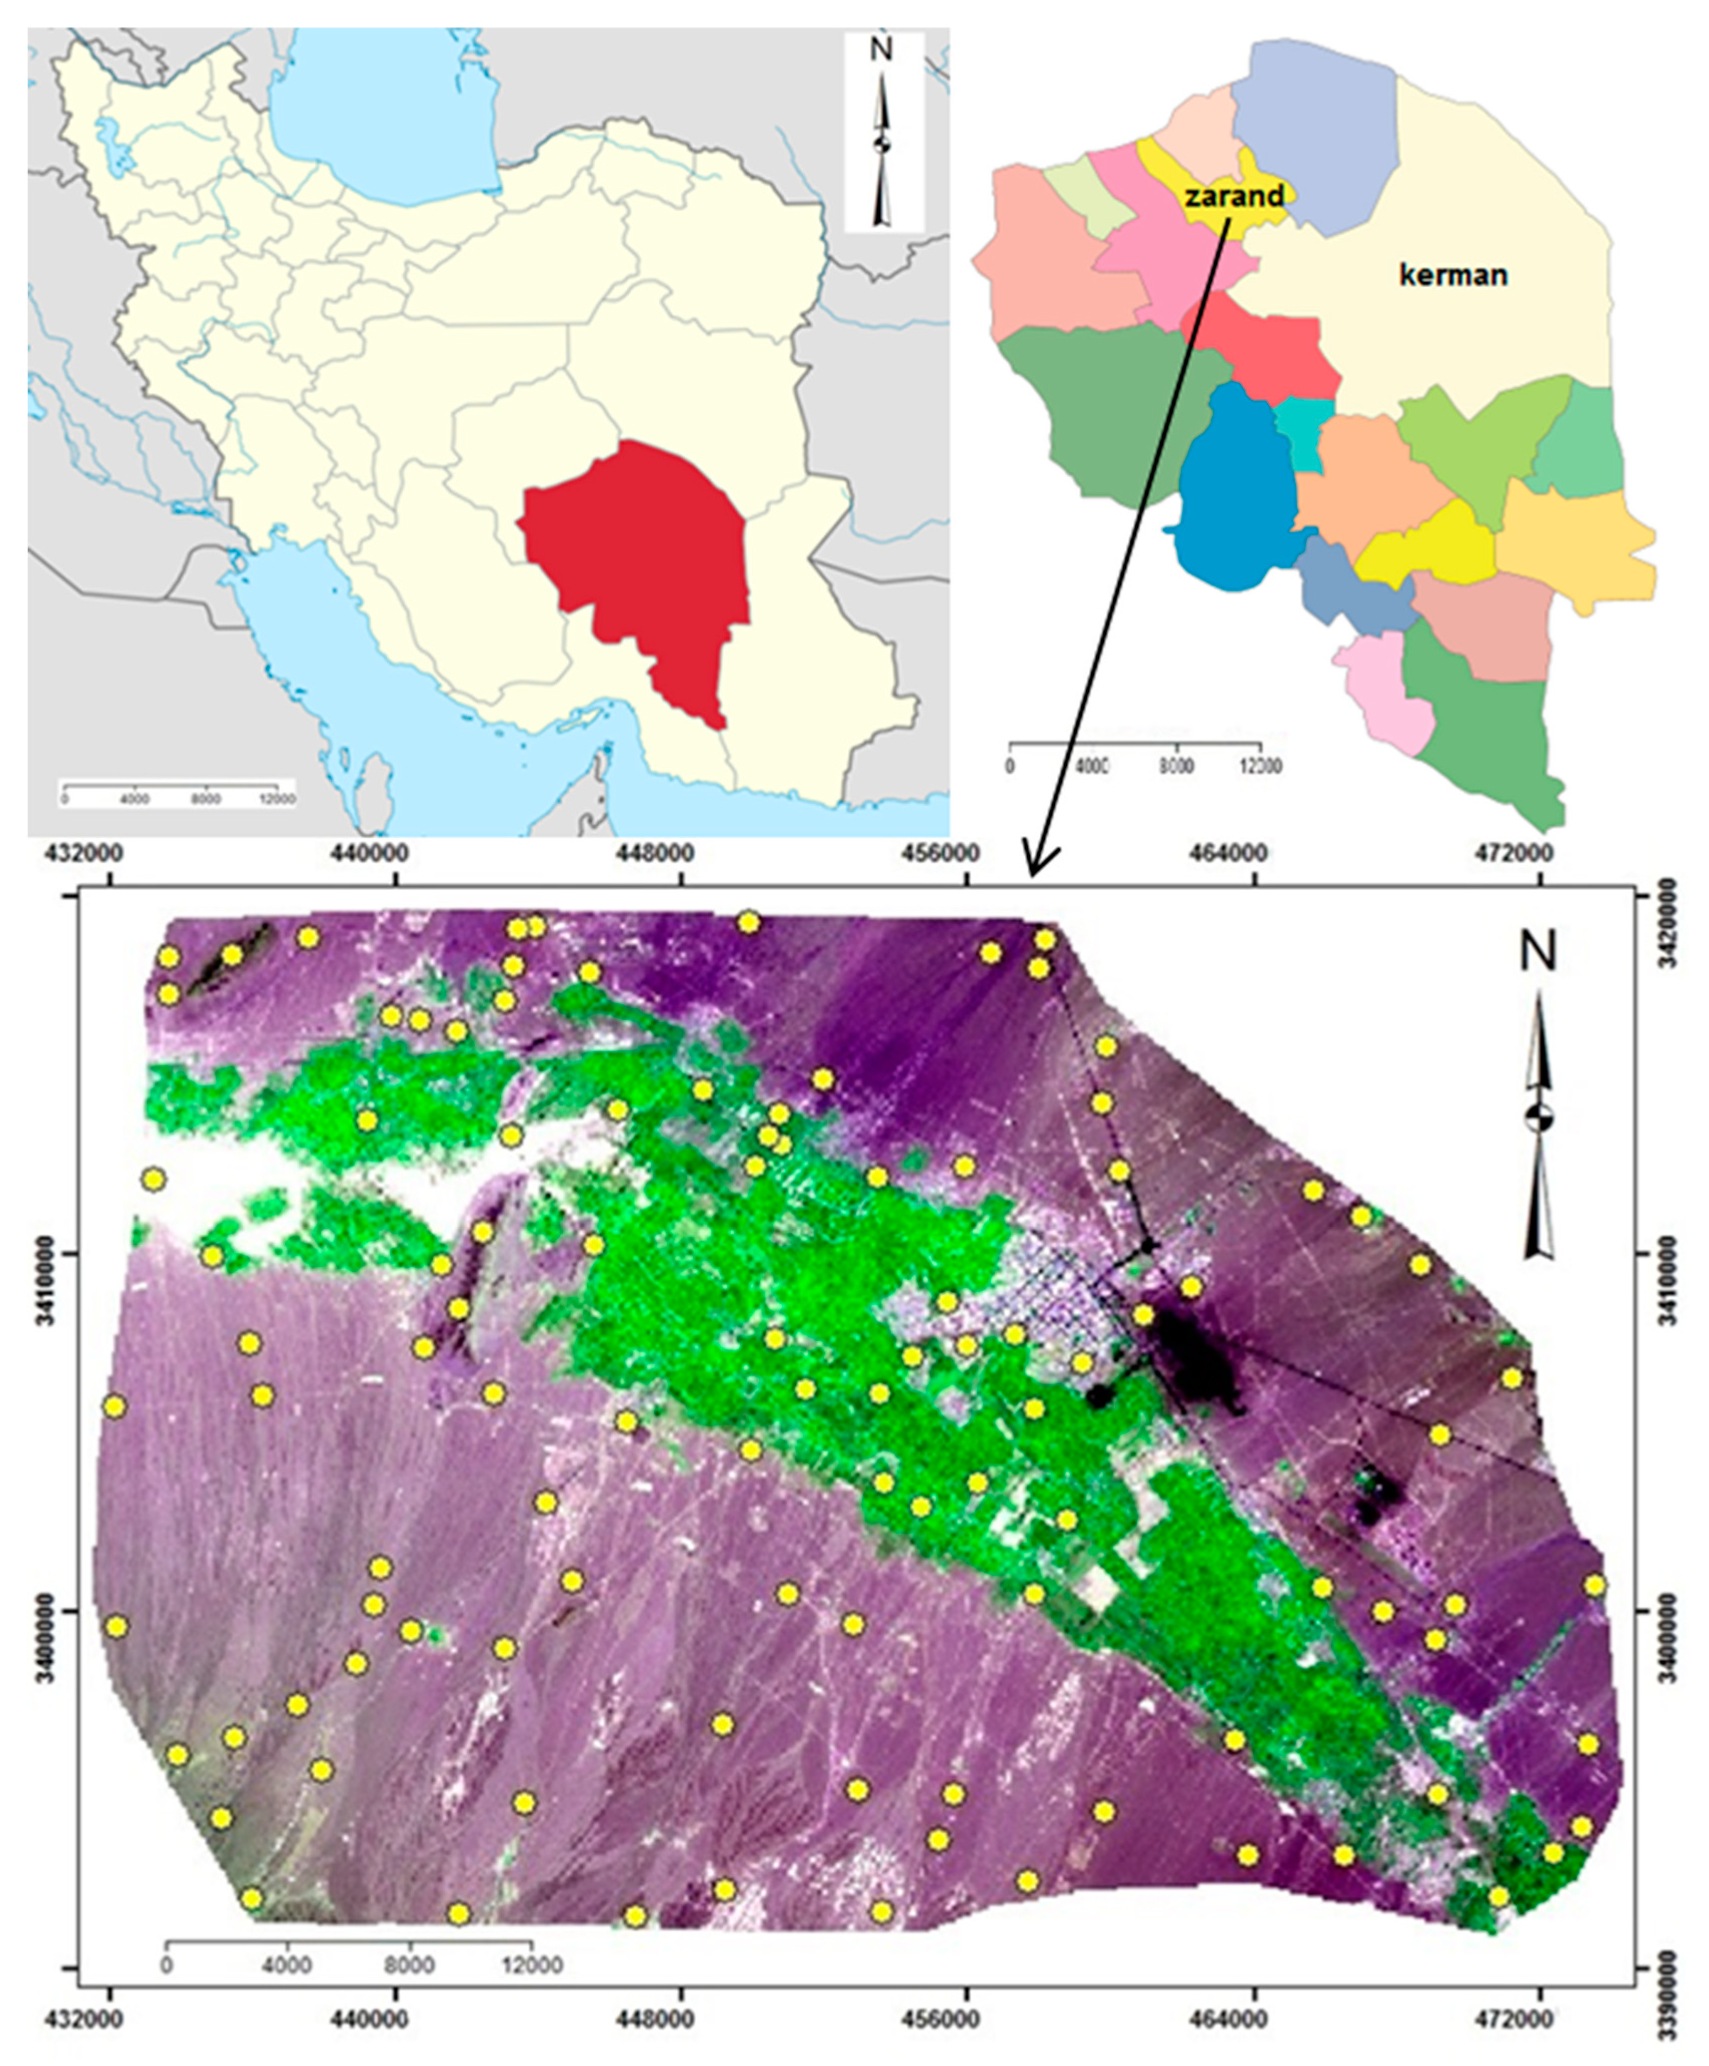
The study area is located in southeastern Iran, approximately 70 km from Kerman, between latitudes of 30°40′ and 31°00′ N, and longitudes of 56°10′ to 56°50′ E. The region covers an area of about 100,000 hectares and includes the city of Zarand (Figure 1). The city extends in two directions, toward the north-west and south-east, and along the plain of Zarand. The main landforms of this area are old and new fans, a clay flat, and sand dunes. Average annual rainfall, temperature, and evapotranspiration are 61 mm, 17 °C, and 1750 mm, respectively [30].
Land use in the study area includes pasture and agriculture, so that most of the agricultural areas are cultivated under pistachio cultivation and are located in the center of the area on Playa and most of the pastures are located on the alluvial fan sediments.
2.2. Soil Sampling and Laboratory Analysis
Figure 1 shows the sample locations in the study area. In regard to the area, 115 profiles were selected based on the latin hypercube sampling technique. During soil sampling, samples were collected separately from each pedological horizon in each profile and taken to the laboratory for analysis.
Samples were air-dried at room temperature before passing the samples through a 2-mm sieve, and the fine-earth fraction was analyzed for the soil texture fractions (clay, silt, and sand) in the laboratory using the hydrometer method. Some other soil physical and chemical properties were measured, including organic carbon (OC), pH, the electrical conductivity of a saturated soil paste extract (ECe dS/m), cation exchange capacity (CEC Cmol(+)/Kg), and lime and gypsum percentages [31].
2.3. Modeling Soil Texture Depth Function in Soil Profiles
In this study, spline depth equations were fitted to the soil texture fractions’ data measured at different depths. Then, the percentages of clay, silt, and sand were predicted at the standard depths required by the Global Soil Map project, which includes depths of; 0–5, 5–15, 15–30, 30–60 and 60–100 cm [12,18].
2.4. Auxiliary Variables
Based on the scorpan model in DSM, auxiliary variables are needed to value add to the soil texture fractions. In the present study, four gridded layers were used as auxiliary variables (Table 1).
- The SRTM (Shuttle Radar Topography Mission) digital elevation model (DEM—90 m resolution) was used to extract terrain attributes (Table 1) in the SAGA (System for Automated Geoscientific Analyses) geographical system [29]. The parameters such as Aspect, catchment slope (CS), elevation, LS_Factor (Slope Length and Steepness factor), modified catchment area, multi-resolution ridge-top flatness index (MRRTF), multi-resolution, valley-bottom flatness index (MrVBF), slope, topographic wetness index (TWI), and valley depth, were calculated and extracted in SAGA’s geographical system environment. The extraction of these parameters was described in the method proposed by Hengl et al. [32].
- Landsat 8 satellite images taken in 2015 were used, including bands B2 (0.450 to 0.515 μm—15 m resolution), B3 (0.525–0.600 μm—15 m resolution), B4 (0.630–0.680 μm—15 m resolution), B5 (0.845–0.885 μm—15 m resolution), B6 (1.560–1.660 μm—15 m resolution), B7 (2.100–2.300 μm—15 m resolution), B8 (0.500–0.680 μm—15 m resolution), B10 (10.6–11.2 μm—100 m resolution) and B11 (11.5–12.5 μm—100 m resolution). To control the quality of the Landsat 8 data used and to ascertain whether systemic and non-systematic errors were resolved or left to the system’s correction, the data were monitored and processed. The following indices were then calculated: normalized difference vegetation index (NDVI), perpendicular vegetation index (PVI), green normalized difference vegetation index (GNDVI), green soil adjusted vegetation index (GSAVI), normalized difference water index (NDWI), and modified, soil-adjusted vegetation index (MSAVI). The images were georeferenced before use, and the remote sensing indices were applied for a better description of the study area in the modelling (Table 1).
- The soil spectral data obtained by a spectrometer was also used as auxiliary variables. For this purpose, the spectroradiometer was used with a 20-watt halogen bulb as an optical source. The grinding of soil particles has a significant effect on the soil spectrum and generally increases the reflection, and the drying of the sample also has the same effect as grinding, increasing the total reflection. According to this, air-dried soil samples were passed through a 2-mm sieve and their spectral curves were measured in the visible, near infrared, and middle infrared (350–2500 nm) in a dark room and used for white panel spectra upon calibration (Table 1).
To reduce error (increasing the signal-to-noise ratio), each specimen was tested four times (for each 90 degree sequential rotation) to remove the effects of a change in the radiation geometry. The radiation geometry is capable of effecting the bi-directional reflection distribution function (BRDF), so it is necessary that the effects of changing the geometry of radiation on the reflected reflections reach the lowest level. The curves obtained were averaged using RS3 software and displayed as a spectral curve. For each sample, 3 replications were recorded with the values of the visible spectrum-infrared spectrum that were measured. Then, the absorption values were improved, because of positive effects of the filtering and processing.
The preprocessing of the spectral data plays an effective role in the improvement of calibration, because spectral measurements are affected by unwanted factors. Therefore, various preprocesses were performed on the spectra. Common smoothing techniques were used to reduce noise in spectral signals, including averaging of the spectra, the displacement of middle and middle filters, and the Savitzky and Golay filter. In order to perform pre-processing of the spectra, spectral data were removed in the ranges of 350–400 and 2450–2500 nm. In addition, the interruption due to changes in the detector in the range of 900 to 1000 nm was also eliminated [40]. Types of preprocessing methods include the first derivative, the second derivative with the middle filter, and the Savitzky and Golay filter [41], multiplying correction and standard normal variables on spectral data using Unschambler 10.3 software.
Partial least square regression (PLSR) was then used to model the individual soil texture fractions: clay, silt, and sand. For this purpose, the data sets were randomly divided into calibration and validation groups. The sample size of the calibration group was 80 (about two thirds of the data) and the validation was 35 (about one-third of the data). Finally, the best fitted model was introduced based on the minimum root mean square predictive error (RMSE). Importantly, by weighting the specified parameters, we determined which spectra had higher weights and a better diagnoses of clay, sand, and silt parameters. In this way, the effective spectra listed in Table 1 were extracted, and with the Kriging model was transformed into raster layers. Overall, six raster layers obtained by a spectrometer were used to estimate the clay, sand, and silt.
- 4.
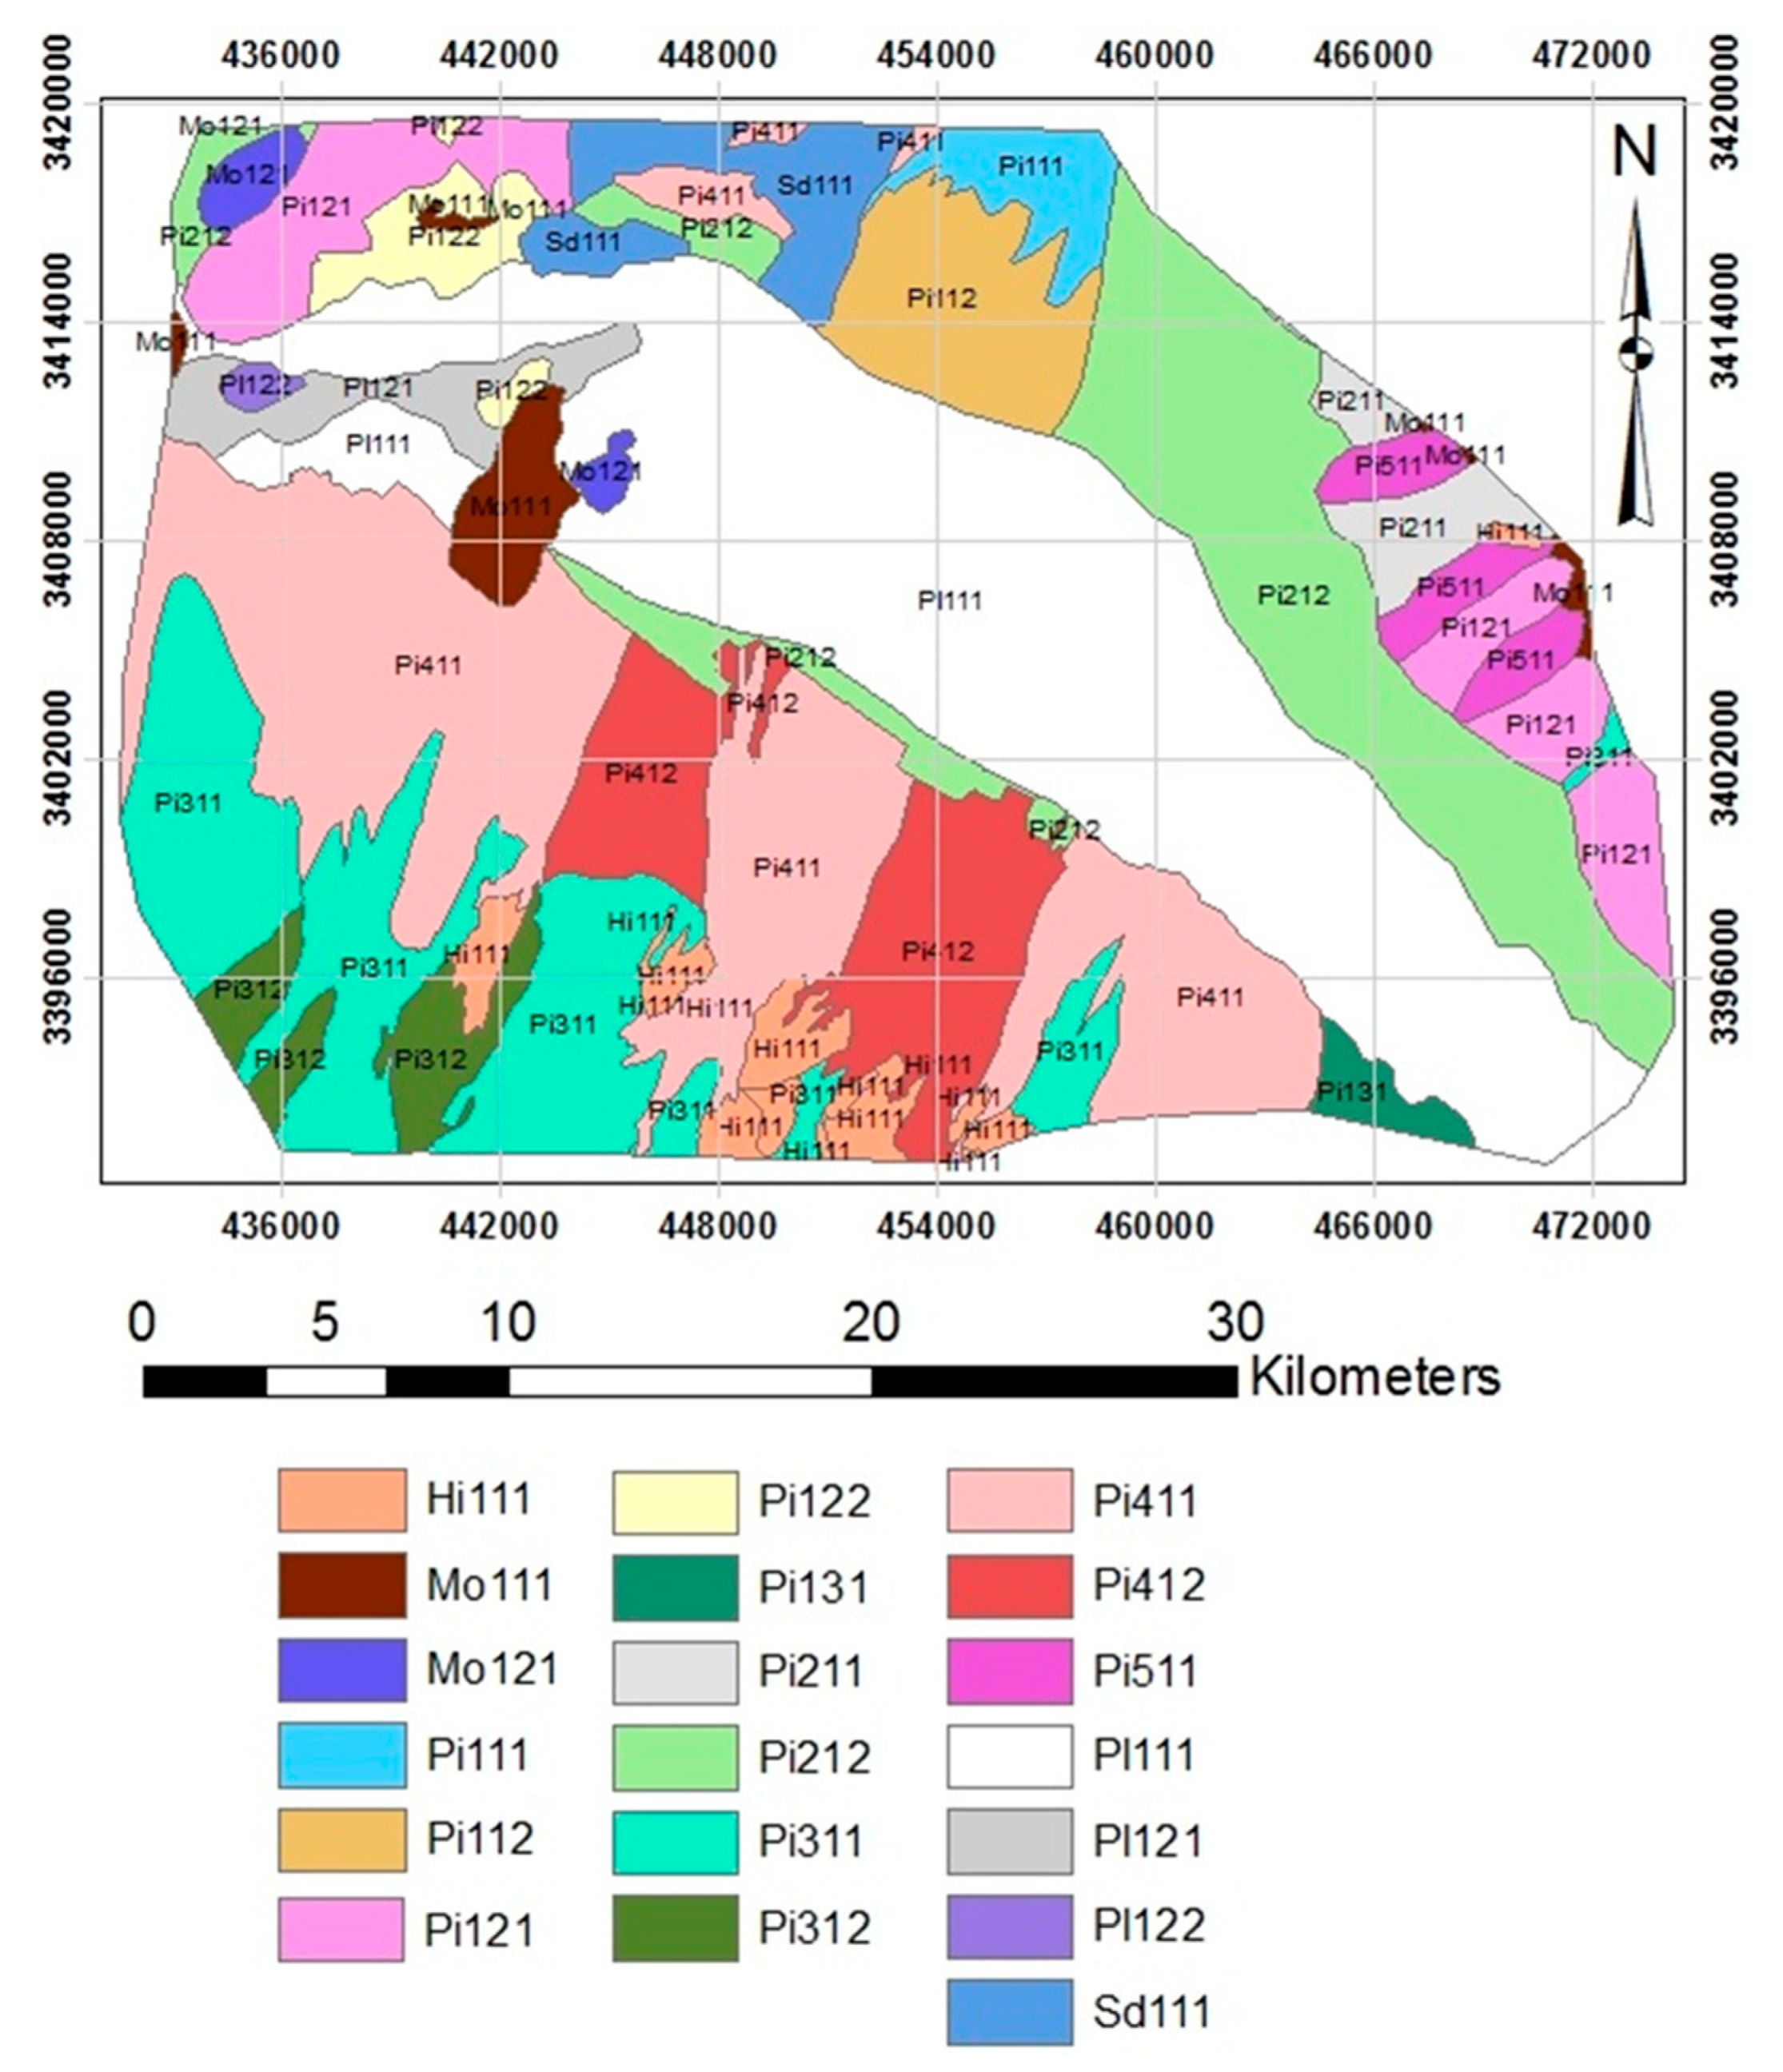
- A geomorphic map was prepared using aerial photographs with scale of 1:40,000 and through plotting geomorphic surfaces by air photo interpretation (API) based on formation processes, general structure, and morphometries. The geomorphological entities were defined through a nested geomorphological hierarchy. During stereoscopic delineation, we employed our existing knowledge in soil-scape relationships together with geology, topography, and geomorphology. The interpreted air photos of the study area were imported into a GIS environment, and geomorphic surfaces were mapped and inserted into the GIS via on-screen digitization, following ortho-photo geo-referencing. In all, 19 geomorphic surfaces were identified (Figure 2 and Table 2).
2.5. Spatial Prediction
Three different spatial prediction approaches were employed. We describe each briefly and in turn. Decision trees, such as regression and classification trees, are nonparametric algorithms that can predict quantitative or classified variables based on a set of quantitative and qualitative predictor variables. In this method, a set of logical conditions are used as a tree algorithm for the classification or quantitative prediction of a variable. A decision tree is created in two stages. The first stage is the creation and growth of a tree. The second is stopping and pruning.
An ANN approach is typically organized in layers, and these layers consist of a number of connected nodes that have an active function. An ANN (multilayer perceptron) was studied with a sigmoid activation function in the hidden layer, and a linear activation function in the output layer with the number of neurons varied from two to 10 neurons. The best number of neurons were determined by trial and error. Additionally, the Levenberg Marquardt algorithm was used.
An ANFIS was also used to predict soil texture fractions. The structure of fuzzy sets can be interpreted as communication weights and the input and output variables as neurons; the learning algorithm of structures, parameters, or both modifies them. To create this network, several parameters, such as the type of membership function, number of functions, learning method, and number of epoch should be optimized. To do this, all scenarios were achieved by trial and error.
2.6. The Comparison of Digital Soil Maps
Ten-fold cross-validation was applied to evaluate the performance of the three different spatial prediction models; namely, RT, ANN, and ANFIS models. Five different error criteria were used for evaluating the performance of the models in predicting dependent variables (clay, sand, and silt); namely, the coefficient of determination (R2), concordance correlation coefficient (CCC), mean error (ME), root mean square error (RMSE), and normalized root mean square error (nRMSE).
The R2 is a statistical measure of how well the prediction approximates the real data points. The CCC measures the agreement between two variables. The ME represents the prediction biases and should be close to zero for unbiased methods. The RMSE is a measure of prediction accuracy, with a value close to zero for accurate predictions. Normalized root mean square deviation (nRMSD) facilitates the comparison between data sets or models with different scales, and the best predictive model should have a value close to zero. The averages of five index values of the 10-fold validation are presented in this paper.
3. Results and Discussion
3.1. A Summary of the Statistical Data
Table 3 summarizes the basic statistical data of the soil texture fractions of clay, silt and sand at the five standard depths. The clay content in the topsoil (0–5 cm) was small (18.59 g kg−1). On average it was also uniformly small with depth, with a maximum average clay (19.14 g kg−1) in the subsurface (30–60 cm). The coefficient of variation of clay, however, was quite large, being the smallest (43%) in the mid-topsoil (5–15 cm) but largest (53%) for the subsoil (60–100 cm). The sand content was much larger by comparison, and in fact, the largest on average of all particle size fractions. The largest sand contents, were in the topsoil (64.09 g kg−1) and subsoil (65.36 g kg−1). The coefficient of variation was smaller than clay, however (21–28%). The silt content was on average, the smallest of the three soil texture fractions, with the subsoil containing the smallest fraction (16.38 g kg−1). The coefficient of variation was the largest for the subsoil (76%). According to the US Soil Texture Triangle the average soil texture in the area and at most depths would be a sandy loam.
Spatially, the larger percentages of clay and silt were observed and associated with the central parts of the study area, which was geomorphologically located in the playa (Pl111, Pl121, and Pl122). Large amounts of sand were found in the northern and southern parts. There, the landscape is characterised by alluvial fans which lie at the foot slopes of mountains, derived from alluvial deposits of volcanic rocks, quartz, sandstone, dolomite, and shale—alluvial deposits of different limestone rocks). In general, the different soil textures characterised these landscapes, whereby sandy loam textures were observed in the steep slopes; alluvial fan regions and contrarily soil textures with more clay defined the central parts.
3.2. The Soil Spectrum’s Characteristics
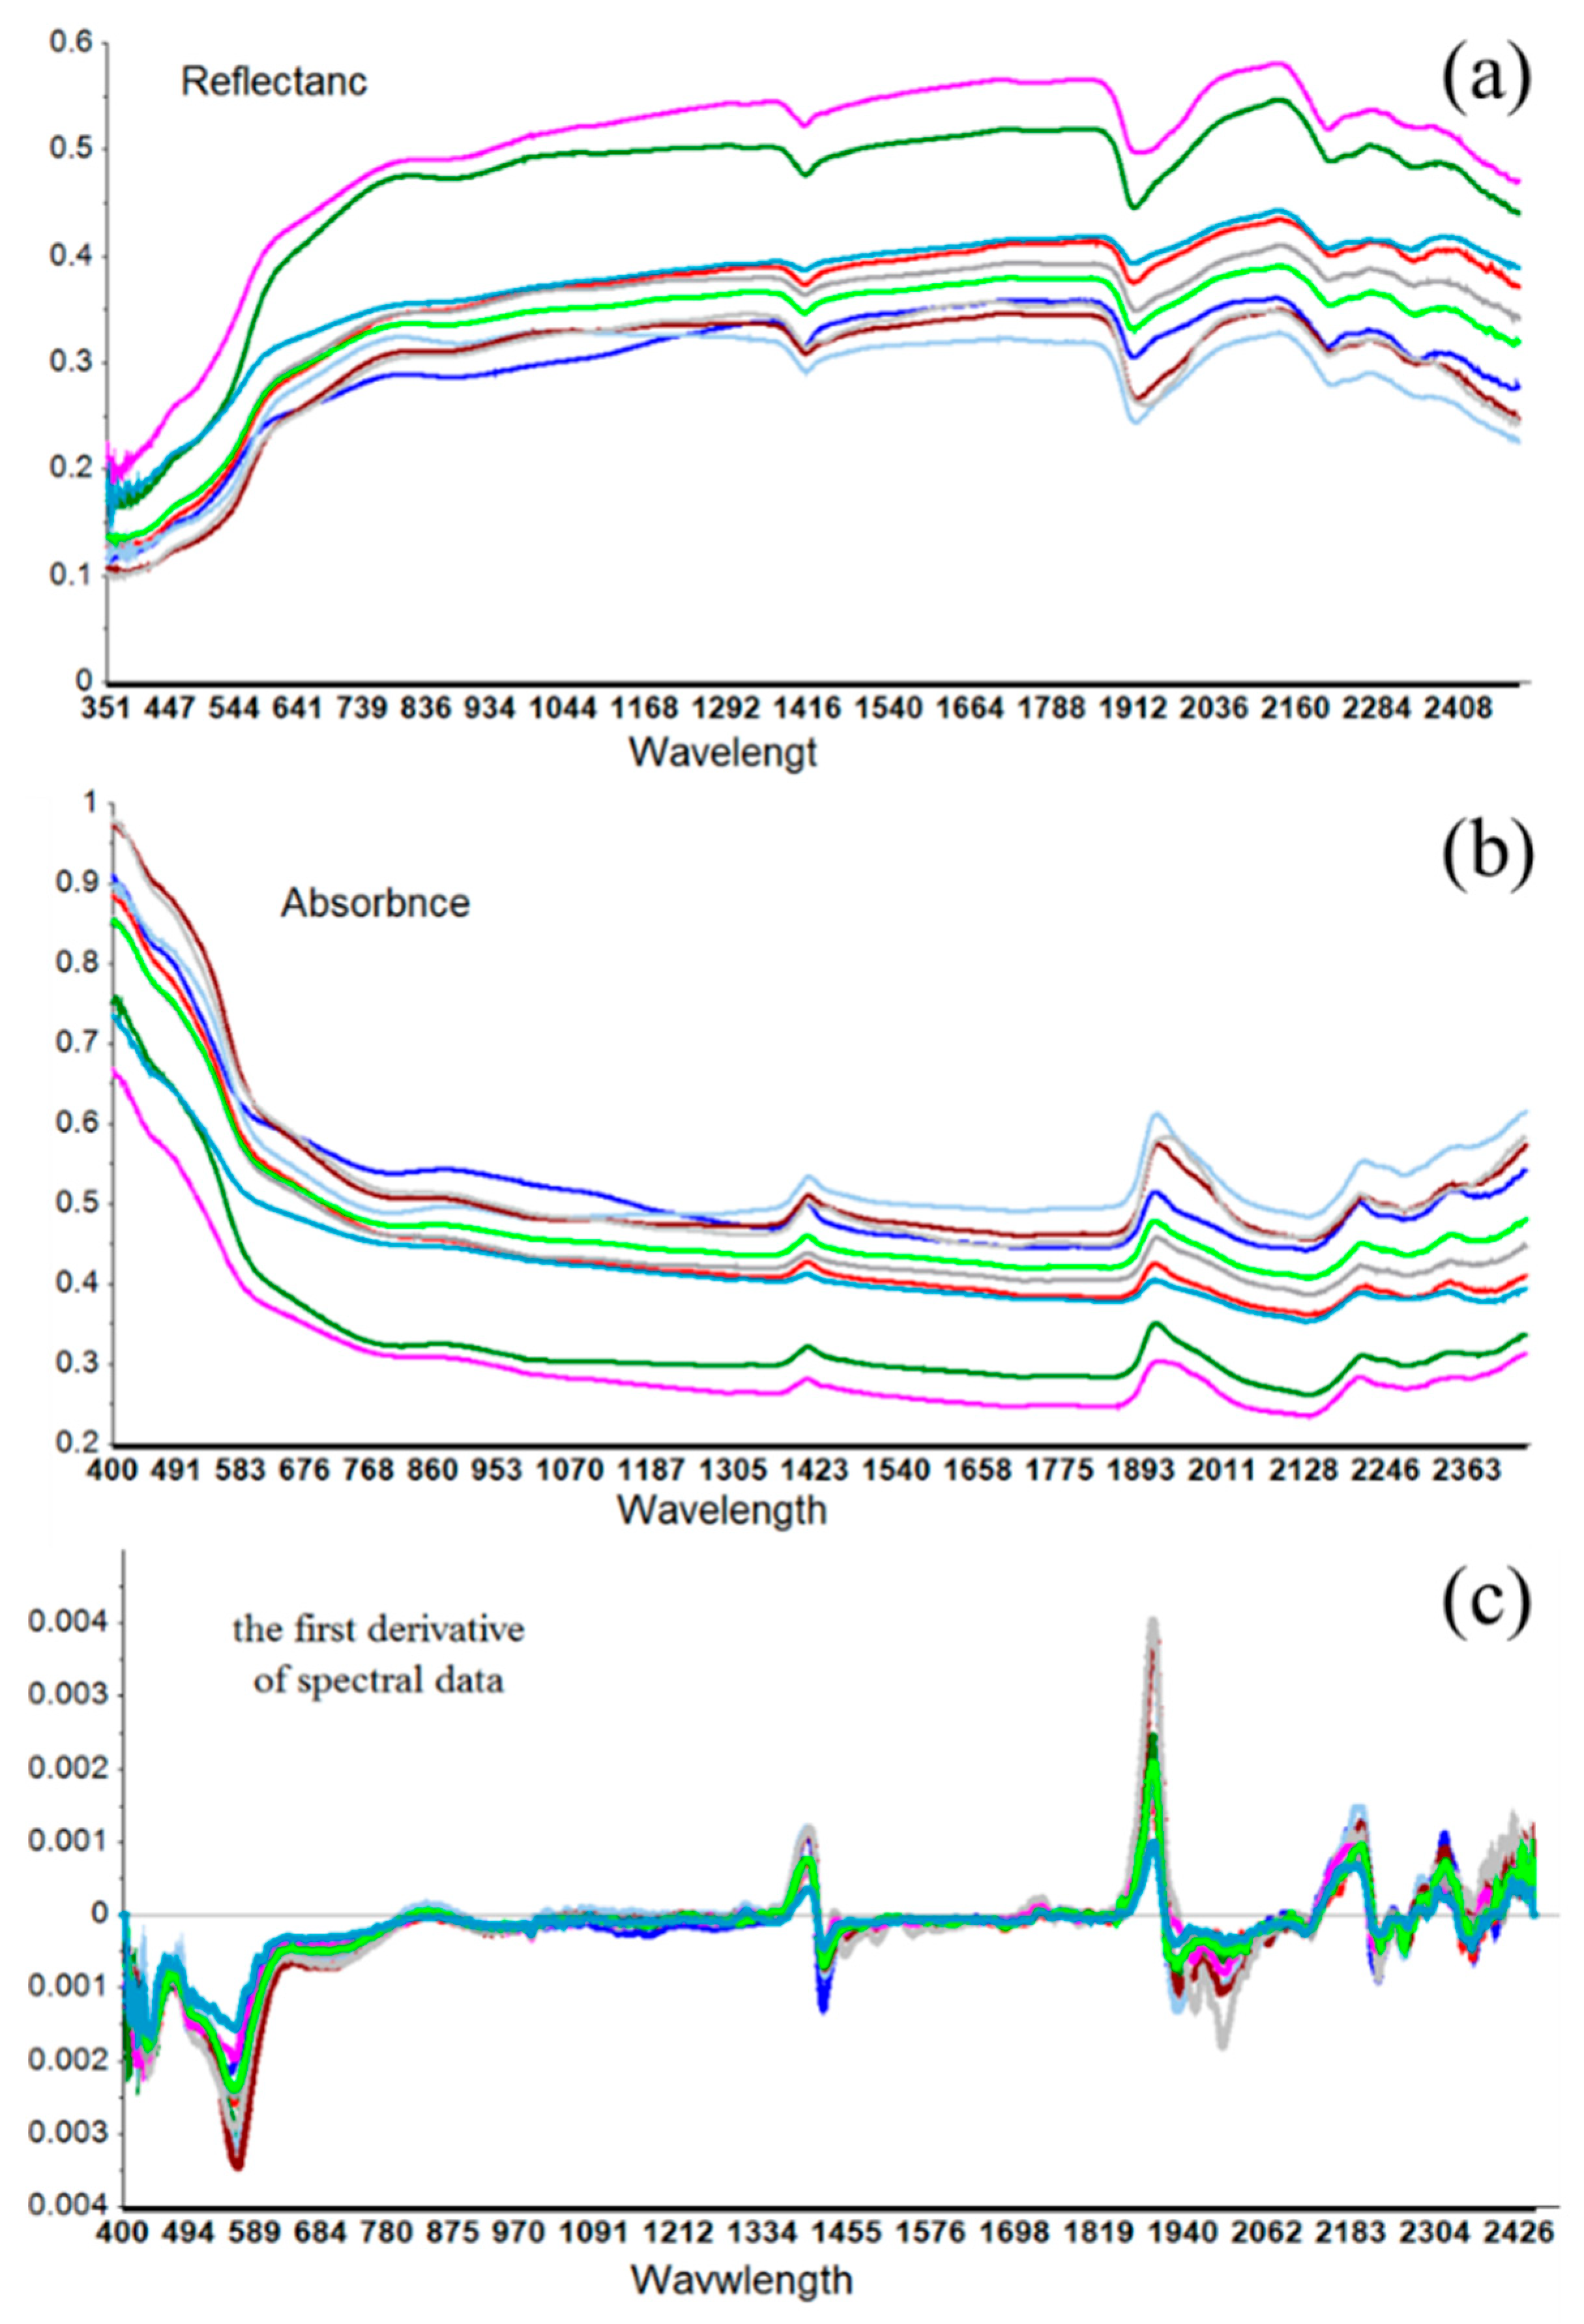
Figure 3a shows the spectrum of the visible near-infrared range of ten soil samples. The general shape of all spectra in all soils is almost the same, so that the absorption properties of water and clay were observed in all spectra, although there were differences in the intensities of the reflections. Reflection values were converted to absorption. Figure 3b shows the visible-infrared spectral absorptions of ten soil samples. During spectral measurements, and especially in the desert, these measurements were affected by unwanted factors, such as soil moisture, soil roughness, coarse organic residues, probe pollution due to dust, changes in the sensor and soil distance, and irradiation effects. The pre-processing of spatial data plays an effective role in improving calibration [42]. Using partial least squares regression analysis, the best model was produced when the first derivative of reflection values was fitted. Figure 3c shows the visible near-infrared spectra of ten soil samples after preprocessing (the first derivative + Savitzaki and Glai filters). Then, using the Unscrambler software, the best weighted coefficients (BW) for clay, silt, and sand spectra were determined. For clay content (g kg−1) there were wavelengths of 879 nm and 890 nm; for sand content (g kg−1) they were 852 nm and 879 nm; for silt (%), they were 1456 nm and 1998 nm. The reflection spectrum had the best weights weighted coefficients. Finally, they were mapped using the Kriging and analyzed as auxiliary data in the models.
3.3. Effective Auxiliary Data
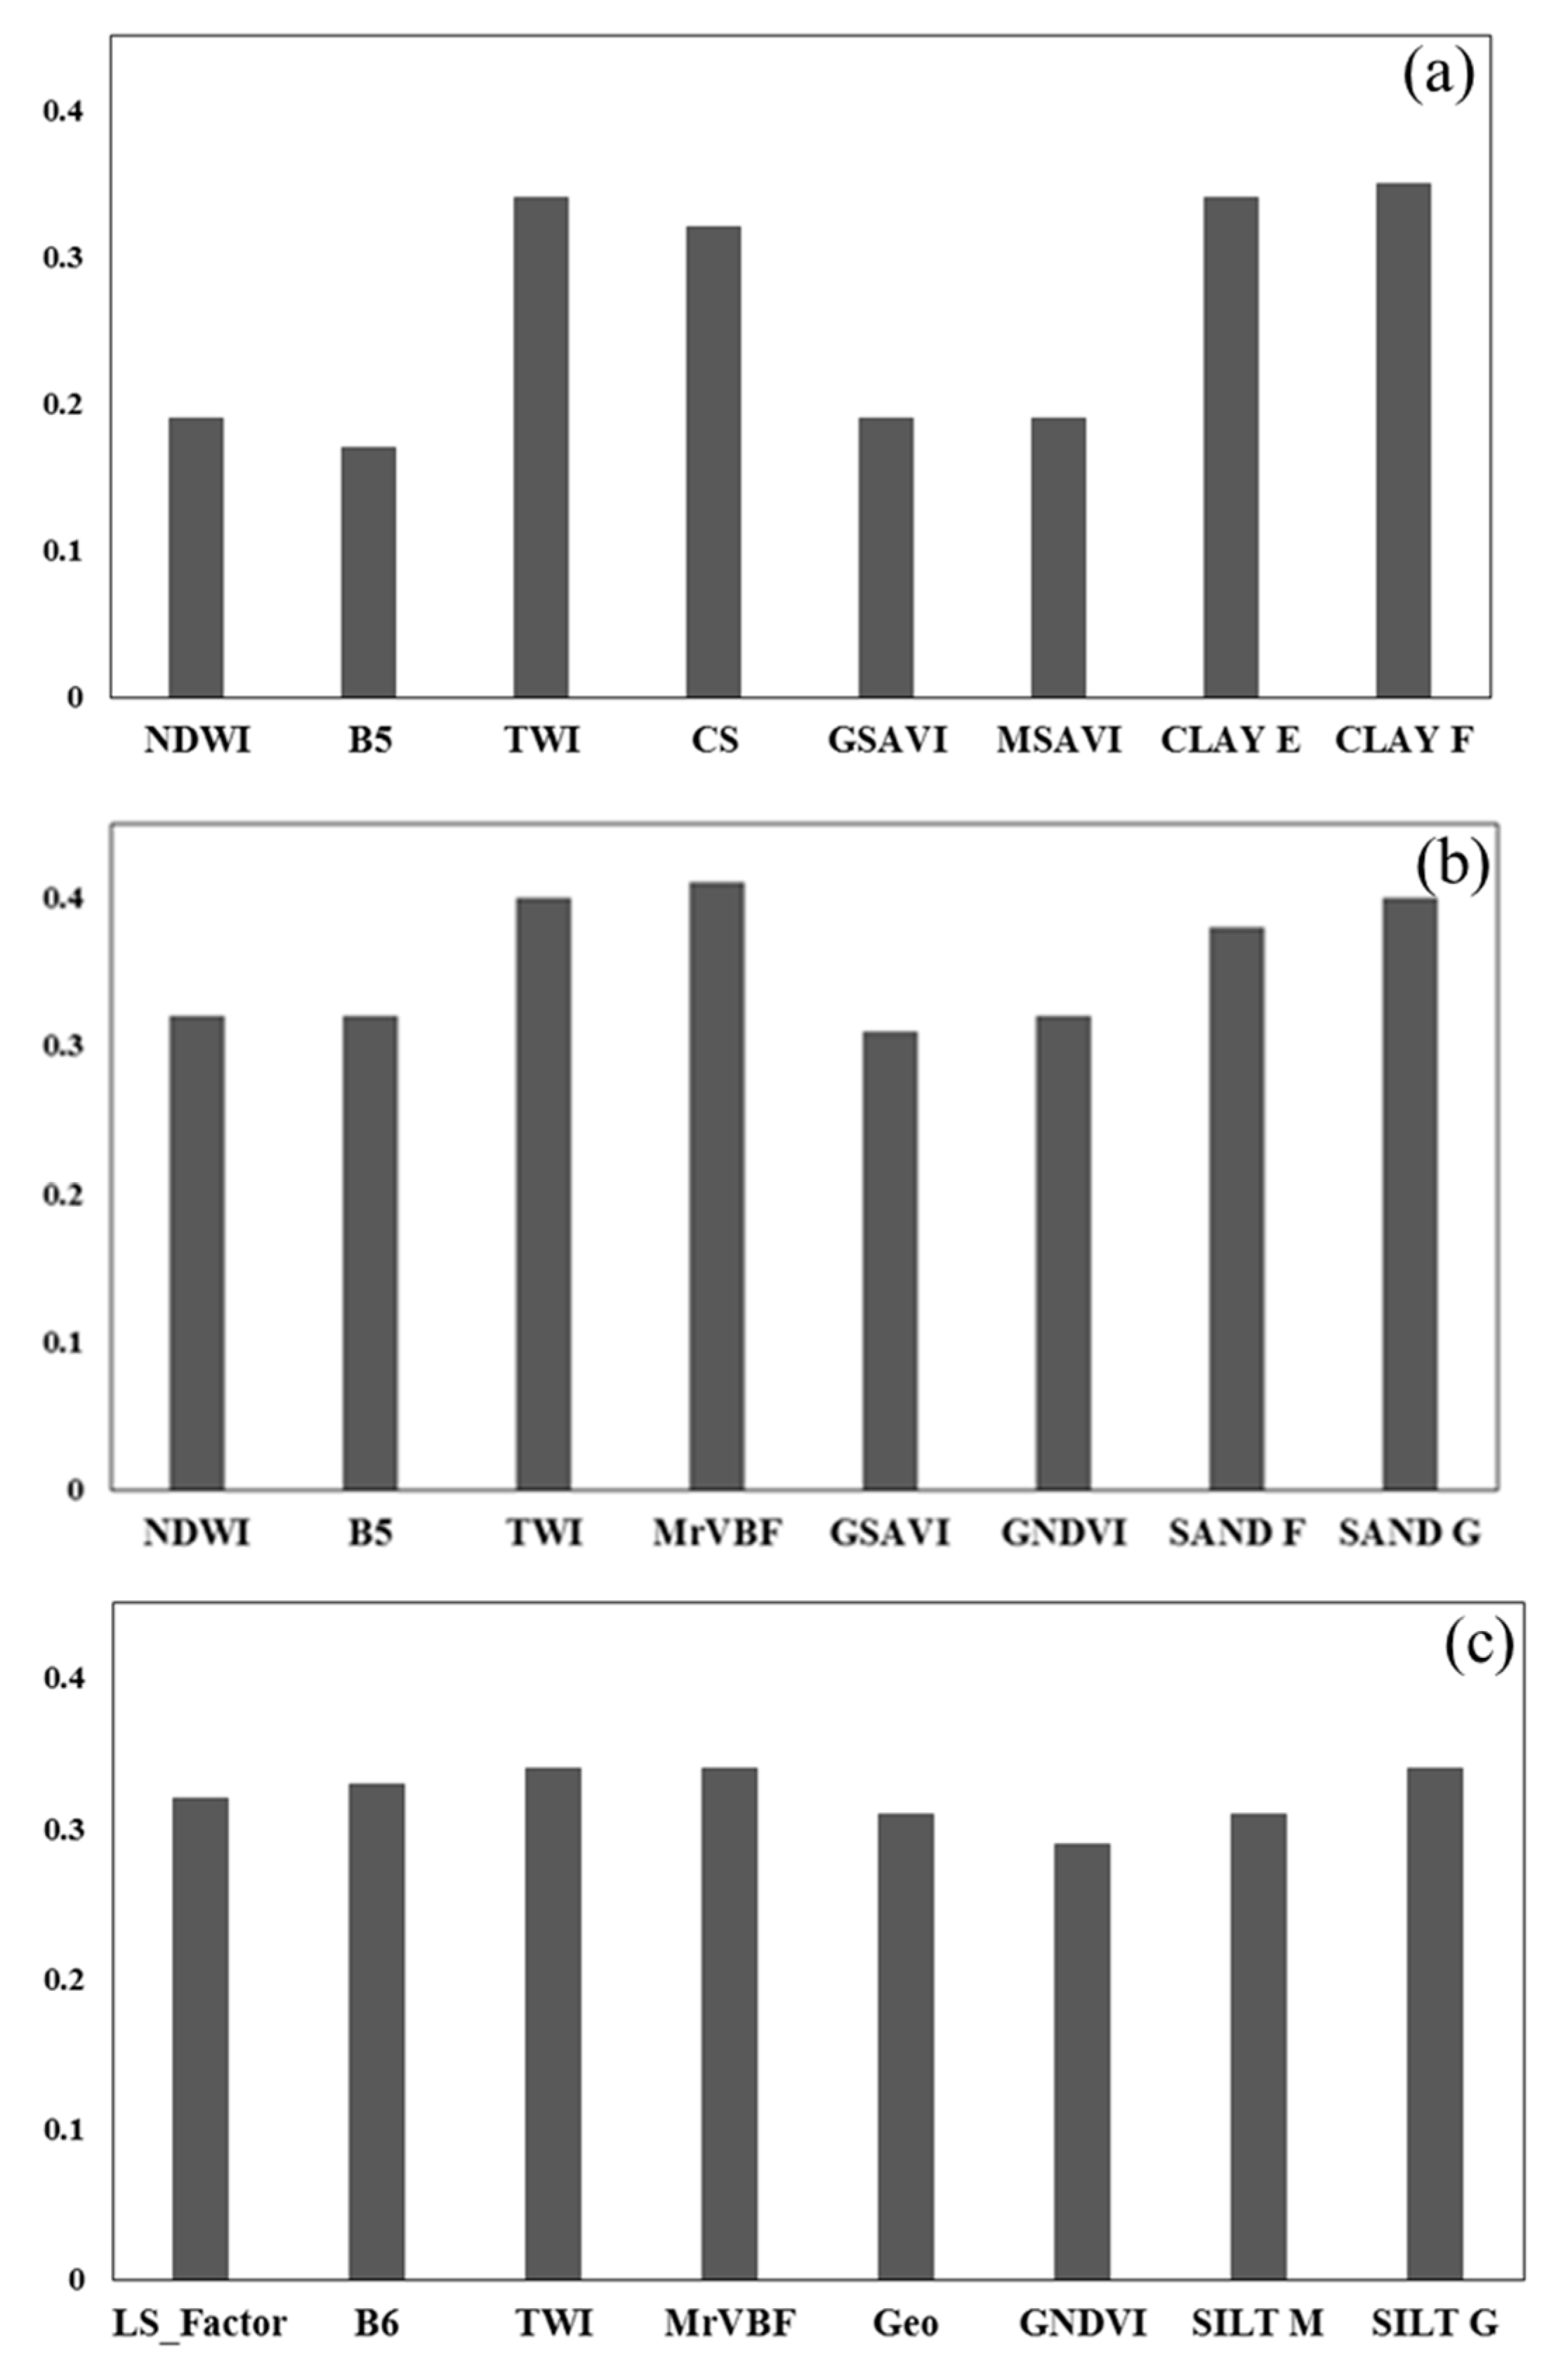
Figure 4 shows the results of which auxiliary variables were important to predict the three soil texture fractions. Figure 4a shows the results for clay. The best predictors for clay were two of the spectrometry data; namely, Clay F (0.35) and Clay E (0.34). Those was closely followed by TWI (0.34) and CS (0.32), which were both generated from the DEM. The next best predictors of clay were GSAVI and MSAVI (0.19) acquired from the Landsat 8 remote sensed data, and the NDWI (0.19) and B5 (0.17). Figure 4b shows that for sand, the best predictors were again, two spectrometry datums: Sand F (0.38) and Sand G (0.40). However, TWI (0.40) was equivalent, and MrVBF (0.41) slightly more important. The next best was again GSAVI (0.31), with GNDVI also being important (0.32), and the other Landsat 8 remote sensed data of NDWI (0.32) and B5 (0.32) being important also. Figure 4c show the results for silt. The equal best auxiliary data were Silt G, TWI, and MrVBF (0.34). The next best was B6 (0.33). Then LS_Factor (0.32), the qualitative data of Geomorphology (0.31), and finally, the spectrometry derived Silt M (0.31). The Landsat 8 remotely sensed data of GNDVI (0.29) was also useful.
Of the various auxiliary variables considered, the spectrometry data was one of the most effective for all three soil texture fractions. One of the terrain attributes, moisture index, was used to determine the spatial distribution of groundwater penetration and flow. In fact, it showed the effect of the topography on the location and the amount of moisture accumulation in the soil or groundwater. That parameter was more correlated with dependent variables that those that were related and affected by moisture. In this study, the moisture index (TWI) was considered as a significant predictive variable in the prediction model of the silt fraction. The moisture index indicates areas susceptible to sediment yields. In this respect, the results achieved herein were equivalent to those of Moore et al. [43], who showed the importance of the moisture index when soil mapping in their study region. Jafari et al. [26] also predicted soil classes in a dry area and introduced the moisture index as an important parameter for their model.
It is important to note that the correlation of reflection spectroscopy parameters with the soil texture fractions was very close to the correlation between the parameters of the moisture index and the MrVBF (Figure 4), such that correlation of reflection spectroscopy parameters with the soil texture fractions was between 0.34 to 0.40 of significance.
Since a large amount of soil spatial data can be collected using proximal soil sensing techniques with few human resources and low costs. It is suggested that these parameters and their specific spectra be used in further studies.
3.4. Spatial Prediction
3.4.1. Regression Tree (RT)
Table 4 summarizes the different parameters of model assessment with their corresponding values used to assess RT model predictive performances. The results showed that the RMSE value for the clay, from the topsoil to the subsoil increased by 3.38 g kg−1. For sand, it increased by 6.75 g kg−1, and for silt, the increase was only 1.9 g kg−1. Additionally, the results of R2 for the clay were between 0.68 and 0.51; for the sand they were between 0.70 and 0.51; and for silt, 0.63–0.51. Kheir et al. [44] used an RT model for soil mapping. Moonjun et al. [45] compared the technique of ANN and RT to predict soil units and showed that there is no significant difference between the two techniques for prediction.
3.4.2. Artificial Neural Network (ANN)
The number of neurons in the hidden layer and the number of epochs were obtained in the training process by trial and error. In the present study, the number of neurons from two to 10 was tested. To determine the best combination, the root mean square error and the explanatory factor were used. Table 5 shows the different model assessment parameters with their corresponding values used to assess ANN model predictive performances. The results showed that the numbers nine, eight, and 10 neurons were the best compositionally for predicting clay, sand, and silt. The value of RMSE was increased from the soil surface to the depth for clay, sand, and silt, being 2.77 g kg−1, 4.15 g kg−1, and 3.00 g kg−1, respectively. Additionally, the results of the explanatory factor were 0.89–0.76, 0.91–0.66, and 0.92–0.65, respectively, which is consistent with the results of Amini et al. [46]. These researchers used organic matter and clay content to estimate the amount of CEC in the Isfahan region by ANN and five experimental models. They concluded that ANN has a higher precision in comparison to other models.
3.4.3. Neuro-Fuzzy Technique (ANFIS)
The ANFIS model implements a fuzzy system in a neural structure and uses a combination of back propagation and least square error methods. Table 6 summarizes different model assessment parameters with their corresponding values used to assess ANFIS technique model predictive performances. The results of the prediction showed that the amount of root square error increases from the topsoil to the subsoil for clay (2.68 g kg−1), sand (4.03 g kg−1), and silt (2.53 g kg−1). The results of the explanatory factor were 0.9–0.76, 0.91–0.68, and 0.92–0.71, respectively. Some researchers have also confirmed high efficiency of the ANFIS model in DSM. Kashi et al. [47] estimated CEC and water infiltration in the soil using both ANFIS and ANN, and the results indicated the higher efficiency of the ANFIS model. Besalatpour et al. [48] used the ANN and ANFIS models to predict wet soil stability from several auxiliary variables and their results showed very high potentials for ANN and ANFIS models. Si et al. [49] studied the performance of ANFIS and two ANN types for predicting of water content, and concluded that the ANFIS model is more accurate.
3.5. A Comparison of the Models
In general, the accuracy of predictions for all three soil texture fractions from the topsoil to subsoil decreased. Similar results have been reported by various researchers, which may be related to the nature of the auxiliary variables used and the vertical distance of most sampling points in the deep layers [1,11,14]. Additionally, most of the auxiliary variables used reflect the surface characteristics of the soil and are related most to the topsoil. The trend of changes in the coefficient of determination also indicates that prediction accuracy decreases with increasing depth.
The results of prediction clay, sand, and silt fractions by ANFIS, ANN, and RT presented for five standard depths showed that the best performance was obtained by ANFIS model for all soil particles. After the ANFIS model, the ANN model had the best performance. The RMSE value in the ANFIS model reduced by 3.07, 2.98, and 2.96 units for surface clay, sand, and silt, respectively, indicating the better performance of the ANFIS model.
The results of this study showed that the ANN was more efficient than RT equations. According to Schaap et al. [50], the design of ANN does not require a particular type of equation, and the proper correlation between input and output data can be achieved. Due to the existence of nonlinear relationships among the dependent and predicted variables, the ANN has a better performance than a RT. The results obtained from this study are consistent with what Zhao et al. [24] obtained in China. They generated the digital map of the soil texture by an ANN with total accuracy of 88%. Pachepsky et al. [51] compared the performance of ANN and RT using the statistics of correlation coefficients and root mean square errors. They concluded that the ANN has a better performance based on the data of the soil texture. As we know, all these methods are based on the accuracy of the variables studied and their observations, and relationships between the variables should to be assumed accurately. While in natural systems such as soil, we generally encounter obscurities or unknown relationships between variables. In such a situation, we must use models that can provide more suitable patterns, so that they can adapt to the real world. Thus, the ambiguous nature of soil phenomena or the approximate size of the soil particles measured may be the reasons for the higher efficiency of fuzzy sets in the processing of pedotransfer functions [52]. Mohammadi and Taheri [53] concluded that the fuzzy regression method can be an appropriate alternative when ambiguous relations between variables and errors resulted from ambiguity in the structure of regression equations. In the present study, similar results were obtained, such that ANN was less efficient in estimating soil texture fractions compared to ANFIS. It should be highlighted that the RMSE of the ANFIS model for all three fractions of clay, sand, and silt were less than those of the ANN and RT models. However, the results showed that there was no significant difference between the results of ANN and ANFIS to a 95% significance level [54].
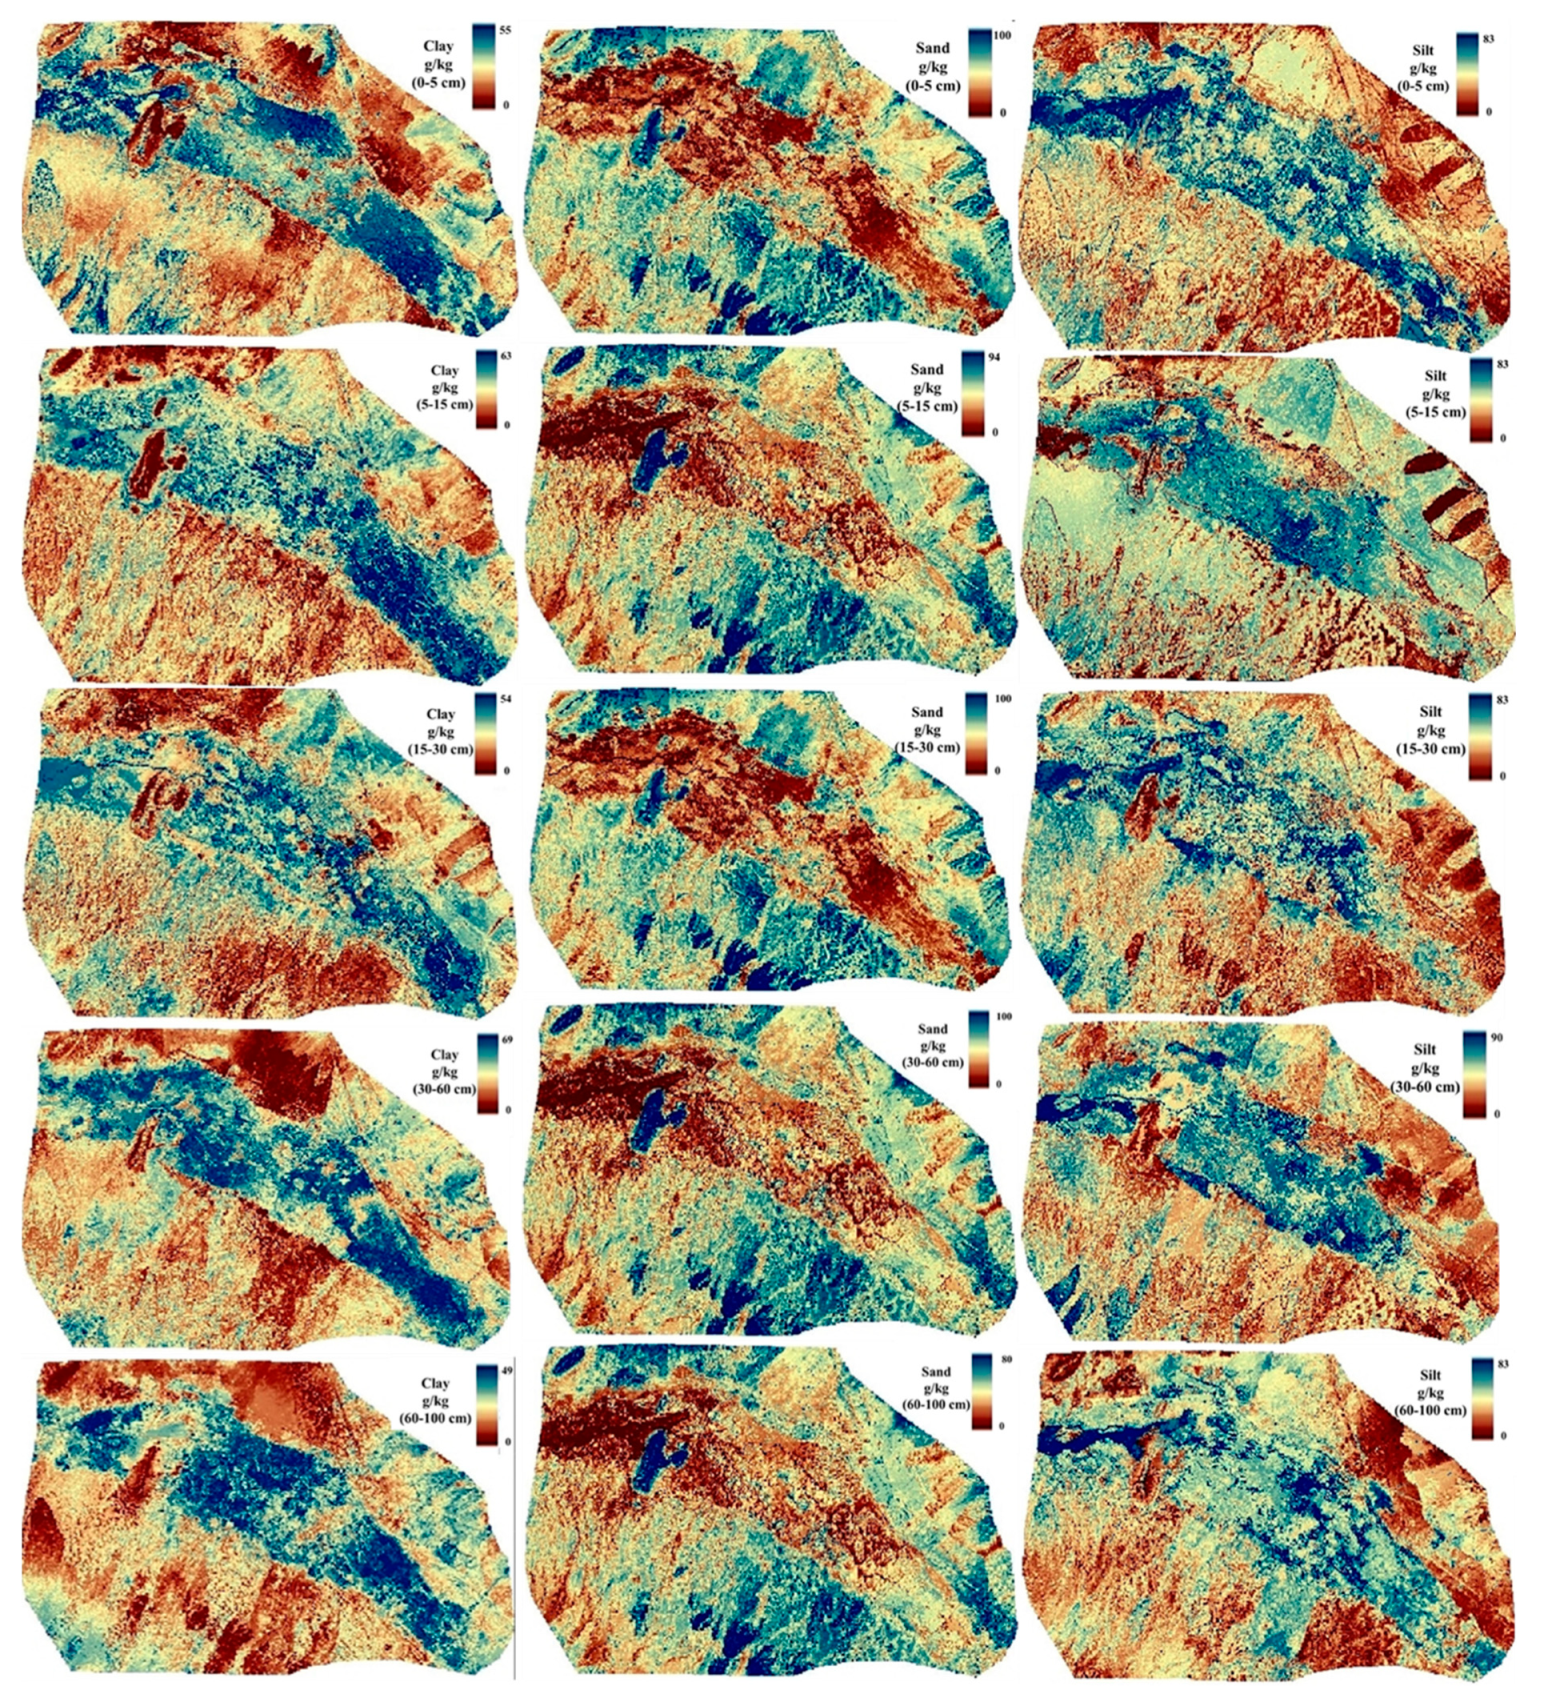
As it was seen in Table 3, the highest amount of clay was observed in the low horizons, mainly in the central part, due to clay climbing from the high horizons through pedogenesis. The maps show only slight differences in the distribution of the texture in the upper horizons of 0 to 5 and 5 to 15 cm, and the layers of 15 to 30 cm. The small difference may show the influence of, firstly, nonagricultural profiles where splines performed differently than in a disturbed soil depth, and secondly, of variable soil scorpan factor interactions, which could be specific to the local environment [18].
4. Conclusions
To predict the percentages of clay, sand, and silt particles, the results of comparison of neuro-fuzzy, artificial neural network, and tree regression models showed that the neuro-fuzzy model had a higher efficiency when predicting each of the particles of clay, sand, and silt, followed by the artificial neural network, and lastly, the tree regression. The results of ANFIS model, in the surface layers, were obtained for clay (2.00 g kg−1), sand (4.00 g kg−1), and silt (2.68 g kg−1). Additionally, the results of the explanatory factor were 0.90, 0.91, and 0.92, respectively. The results also showed that the most important auxiliary variables are spectrometry, MrVBF, and moisture index. Since a large amount of soil data can be easily collected by using proximal soil sensing techniques with low costs and minimal human resources, it is suggested that the parameters and their spectra are used in further researches.
The results showed that pedometric techniques, especially the neural network and neuro-fuzzy, can carry out the soil mapping process on a large scale with any natural complexities, improve the traditional method, increase the speed and efficiency of the maps during data transfer, and be used for a wide range of scientific disciplines. Therefore, it is recommended to use neural network and neuro-fuzzy models for soil digital mapping and auxiliary data from the images of proximal soil sensing in future studies. The accuracy of the spline-depth equation and ANFIS in estimating the vertical and horizontal distribution of soil texture decreases with increasing depth. In general, it can be concluded that the combination of these two methods, especially in countries such as Iran, should be used to generate continuous spatial and three-dimensional data. But the sources of extraction of accessible and inexpensive auxiliary variables are a good tool to show the horizontal and vertical variations in soil properties.
Author Contributions
Conceptualization—E.M.-G., H.R.M., A.J., and R.T.-M.; methodology—E.M.-G., H.R.M., A.J., and R.T.-M.; software—E.M.-G., H.R.M., A.J., and R.T.-M.; analysis—E.M.-G., H.R.M., A.J., and R.T.-M.; investigation— E.M.-G., H.R.M., A.J., and R.T.-M.; data curation—E.M.-G., H.R.M., and A.J.; writing—original draft preparation—E.M.-G., H.R.M., A.J., R.T.-M., and J.T.; visualization—E.M.-G.
Funding
This research was funded by Lorestan University, and Ruhollah Taghizadeh-Mehrjardi was funded by the Alexander von Humboldt Foundation, grant number Ref 3.4-1164573-IRN-GFHERMES-P.
Acknowledgments
This study was part of a PhD project entitled “Digital mapping of soil texture fractions in central arid regions of Iran.”
Conflicts of Interest
The authors declare no conflict of interest.
References
- Akpa, S.I.C.; Odeh, I.O.A.; Bishop, T.F.A. Digital mapping of soil particle-size fractions for Nigeria. Soil Sci. Soc. Am. J. 2014, 78, 1953–1966. [Google Scholar] [CrossRef]
- Soil Survey Staff. Keys to Soil Taxonomy, 11st ed.; United States Department of Agriculture: Washington, DC, USA, 2014. [Google Scholar]
- Amin, P.; Taghizadeh-Mehrjardi, R.; Akbarzadeh, A.; Shirmardi, M. Comparison of data mining techniques to predict and map the Atterberg limits in central plateau of Iran. Pol. J. Soil Sci. 2018, 51, 185. [Google Scholar] [CrossRef]
- Lie, M.; Glaser, B.; Huwe, B. Uncertainty in the spatial prediction of soil texture: Comparison of regression tree and random forest models. Geoderma 2012, 170, 70–79. [Google Scholar]
- Minasny, B.; Hartemink, A.E. Predicting soil properties in the tropics. Earth Sci. Rev. 2011, 106, 52–62. [Google Scholar]
- Thompson, J.A.; Roecker, S.; Grunwald, S.; Owens, P.R. Digital soil mapping: Interactions with and applications for hydropedology. In Hydropedology; Lin, H., Ed.; Academic Press: Amsterdam, The Netherlands, 2012; pp. 665–709. [Google Scholar]
- Amirian-Chakan, A.; Minasny, B.; Taghizadeh-Mehrjardi, R.; Akbarifazli, R.; Darvishpasand, Z.; Khordehbin, S. Some practical aspects of predicting texture data in digital soil mapping. Soil Tillage Res. 2019, 194, 104289. [Google Scholar] [CrossRef]
- Muzzamal, M.; Huang, J.; Nielson, R.; Sefton, M.; Triantafilis, J. Mapping soil particle-size fractions (PSFs) using additive-log ratio transformation and proximal sensed ancillary data. Clays Clay Min. 2018, 66, 9–27. [Google Scholar]
- Huang, J.; Buchanan, S.; Bishop, T.F.A.; Triantafilis, J. Terra GIS—A web GIS for delivery of digital soil maps in cotton growing areas of Australia. Soil Use Man. 2017, 33, 568–582. [Google Scholar] [CrossRef]
- Zare, E.; Huang, J.; Ahmed, M.F.; Malik, R.S.; Subasinghe, R.; Triantafilis, J. Comparing traditional and digital soil mapping at the district scale using REML analysis. Soil Res. 2018, 56, 535–547. [Google Scholar] [CrossRef]
- Adhikari, K.; Kheir, R.B.; Greve, M.B.; Bocher, P.K.; Malone, B.P.; Minasny, B.; McBratney, A.B.; Greve, M.H. High-resolution 3-D mapping of soil texture in Denmark. Soil Sci. Soc. Am. J. 2013, 77, 860–876. [Google Scholar] [CrossRef]
- Bishop, T.F.A.; McBratney, A.B.; Laslett, G.M. Modelling soil attribute depth functions with equal-area quadratic smoothing splines. Geoderma 1999, 91, 27–45. [Google Scholar] [CrossRef]
- Jenny, H. Factors of Soil Formation: A System of Quantitative Pedology; McGraw-Hill: New York, NY, USA, 1941; p. 281. [Google Scholar]
- Minasny, B.; McBratney, A.B.; Mendonça-Santos, M.L.; Odeh, I.O.A.; Guyon, B. Prediction and digital mapping of soil carbon storage in the Lower Namoi Valley. Aust. J. Soil Res. 2006, 44, 233–244. [Google Scholar] [CrossRef]
- Campbell, N.A.; Mulcahy, M.J.; McArthur, W.M. Numerical classifi cation of soil profi les on the basis of fi eld morphological properties. Aust. J. Soil Res. 1970, 8, 43–58. [Google Scholar] [CrossRef]
- Ponce-Hernandez, R.; Marriott, F.H.C.; Beckett, P.H.T. An improved method for reconstructing a soil profi le from analyses of a small number of samples. J. Soil Sci. 1986, 37, 455–467. [Google Scholar] [CrossRef]
- Malone, B.P.; McBratney, A.B.; Minasny, B.; Laslett, G.M. Mapping continuous depth functions of soil carbon storage and available water capacity. Geoderma 2009, 154, 138–152. [Google Scholar] [CrossRef]
- Malone, B.P.; McBratney, A.B.; Minasny, B. Empirical estimates of uncertainty for mapping continuous depth functions of soil attributes. Geoderma 2011, 160, 614–626. [Google Scholar] [CrossRef]
- Odgers, N.P.; Libohova, Z.; Thompson, J.A. Equal-area spline functions applied to a legacy soil database to create weighted-means maps of soil organic carbon at a continental scale. Geoderma 2012, 189–190, 153–163. [Google Scholar] [CrossRef]
- Taghizadeh Mehrjardi, R.; Minasny, B.; Sarmadian, F.; Malone, P.B. Digital mapping of soil salinity in Ardakan region, central Iran. Geoderma 2014, 213, 15–28. [Google Scholar] [CrossRef]
- Taghizadeh-Mehrjardi, R.; Ayoubi, S.; Namazi, Z.; Malone, B.P.; Zolfaghari, A.A.; Sadrabadi, F.R. Prediction of soil surface salinity in arid region of central Iran using auxiliary variables and genetic programming. Arid Land Res. Manag. 2016, 30, 49–64. [Google Scholar] [CrossRef]
- Taghizadeh-Mehrjardi, R.; Minasny, B.; Toomanian, N.; Zeraatpisheh, M.; Amirian-Chakan, A.; Triantafilis, J. Digital Mapping of Soil Classes Using Ensemble of Models in Isfahan Region, Iran. Soil Syst. 2019, 3, 37. [Google Scholar] [CrossRef]
- Vaysse, K.; Lagacherie, P. Evaluating digital soil mapping approaches for mapping GlobalSpilMap soil properties from legacy data in Languedoc Roussillon (France). Geoderma 2015, 4, 20–30. [Google Scholar] [CrossRef]
- McBratney, A.B.; Santos, M.L.M.; Minasny, B. On digital soil mapping. Geoderma 2003, 117, 3–52. [Google Scholar] [CrossRef]
- Zhao, Z.; Chow, T.L.; Rees, H.W.; Yang, Q.; Xing, Z.; Meng, F. Predict soil texture distributions using an artificial neural network model. Comput. Electron. Agric. 2009, 65, 36–48. [Google Scholar] [CrossRef]
- Jafari, A.; Finke, P.A.; Wauw, J.V.; Ayoubi, S.; Khademi, H. Spatial prediction of USDA-great soil groups in the arid Zarand region, Iran: Comparing logistic regression approaches to predict diagnostic horizons and soil types. Eur. J. Soil Sci. 2012, 63, 284–298. [Google Scholar] [CrossRef]
- Kisi, O. Suspended sediment estimation using neuro-fuzzy and neural network. approaches. Hydrol. Sci. J. Des. Sci. Hydrol. 2005, 50, 683–696. [Google Scholar]
- Drake, J.T. Communications Phase Synchronization Using the Adaptive Network Fuzzy Inference System. Ph.D. Thesis, New Mexico State University, Las Cruces, NM, USA, 2000. [Google Scholar]
- Conrad, O.; Bechtel, B.; Bock, M.; Dietrich, H.; Fischer, E.; Gerlitz, L.; Wehberg, J.; Wichmann, V.; Böhner, J. System for Automated Geoscientific Analyses (SAGA) v. 2.1.4. Geosci. Model. Dev. 2015, 8, 1991–2007. [Google Scholar] [CrossRef] [Green Version]
- Weather Data of Zarand, Kerman Province 2015. Available online: http://irimo.ir (accessed on 25 September 2019).
- Fernndez-Glvez, J.; Simmond, L.P.; Barahona, E. Estimating detailed soil water profile records from point measurements. Eur. J. Soil Sci. 2005, 57, 23–45. [Google Scholar]
- Hengl, T.; Rossiter, D.G.; Stein, A. Soil sampling strategies for spatial prediction by correlation with auxiliary maps. Geoderma 2003, 120, 75–93. [Google Scholar] [CrossRef]
- Gallant, J.C.; Dowling, T.I. A multiresolution index of vally bottom flatness for mapping depositional areas. Water Resour. Res. 2003, 39, 1347–1359. [Google Scholar] [CrossRef]
- Boehner, J.; Selige, T. Spatial Prediction of soil Attibutes Using Terrain Analysis and Climate Regionalisation. In SAGA-Analysis and Modelling Application; Boehner, J., McCloy, K.R., Strobl, J., Eds.; Geographisehe Abhandlungen: Goettinger, Germany, 2006; pp. 13–27. [Google Scholar]
- Hom, B.K. Hill shading and the relectance map. Proc. IEEE 1981, 69, 14–47. [Google Scholar]
- Rodiguez, F.; Maire, E.; Courjault-Rade, D.; Darrozes, J. The Black Top Hat fanction applied to a DEM: A tool to estimate recent incision in a mountainous water shed. Geophys. Res. Lett. 2002, 29, 9-1–9-4. [Google Scholar]
- Boettinger, J.L.; Ramsey, R.D.; Bodily, J.M.; Cole, N.J.; Kienast-Brown, S.; Nield, S.J.; Saunders, A.M.; Stum, A.K. Landsat spectral data for digital soil mapping. In Digital Soil Mapping with Limited Data; Hartemink, A.E., McBratney, A.B., Eds.; Springer Science: Berlin, Australia, 2008; pp. 193–203. [Google Scholar]
- Esbensen, K.H. Multivariate Data Analysis, 5th ed.; CAMO Software AS: Oslo, Norway, 2006; p. 589. [Google Scholar]
- Toomanian, N.; Jalalian, A.; Khademi, H.; KarimianEghbal, M.; Papritz, A. Pedodeversity and pedogenesis in Zayandeh-Rud Vally, Central Iran. Geomorphology 2006, 81, 376–393. [Google Scholar] [CrossRef]
- Tamari, S.; Wosten, J.H.M.; Ruz-suarez, J.C. Testing an artificial neural network for predicting soil hydraulic conductivity. J. Soil Sci. Soc. Am. 1996, 60, 1732–1741. [Google Scholar] [CrossRef]
- Savitzky, A.; Golay, M.J. Smoothing and differentiation of data by simplified least squares procedures. Anal. Chem. 1964, 36, 1627–1639. [Google Scholar] [CrossRef]
- Stenberg, B.; Viscarra Rossel, R.A.; Mouazen, A.M.; Wetterlind, J. Visible and near infrared spectroscopy in soil science. Adv. Agron. 2010, 107, 163–215. [Google Scholar]
- Moore, I.D.; Grayson, R.B.; Ladson, A.R. Digital terrain modeling: Review of hydrological, geomorphological and biological applications. Hyd. Proc. 1991, 5, 3–30. [Google Scholar] [CrossRef]
- Kheir, B.; Greve, M.H.; Bocher, P.K.; Greve, M.B.; Larsen, R.; McCloy, K. Predictive mapping of soil organic carbon in wet cultivated lands using classification-tree based models: The case study of Denmark. J. Environ. Manag. 2010, 91, 1150–1160. [Google Scholar] [CrossRef] [PubMed]
- Moonjun, R.; Farshad, A.; Shrestha, D.P.; Vaiphasa, C. Artificial Neural Network and Decision Tree in Predictive Soil Mapping of Hoi NumRin Sub-Watershed, Thailand. Digital Soil Mapping. Pro. Soil Sci. 2010, 2, 151–164. [Google Scholar]
- Amini, M.; Abbaspour, K.C.; Khademi, H.; Fathianpour, N.; Afyuni, M.; Schulin, R. Neural network models to predict cation exchange capacity in arid regions of Iran. Eur. J.Soil Sci. 2005, 53, 748–757. [Google Scholar] [CrossRef]
- Kashi, H.; Emamgholizadeh, S.; Ghorbani, H. Estimation of Soil Infiltration and Cation Exchange Capacity Based on Multiple Regression, ANN (RBF, MLP), and ANFIS Models. Commun. Soil Sci. Plant. Anal. 2014, 45, 1195–1213. [Google Scholar] [CrossRef]
- Besalatpour, A.A.; Ayoubi, S.; Hajabbasi, M.A.; Mosaddeghi, M.R.; Schulin, R. Estimating wet soil aggregate stability from easily available properties in a highly mountainous watershed. Catena 2013, 111, 72–79. [Google Scholar] [CrossRef] [Green Version]
- Si, J.; Feng, Q.; Wen, X.; Xi, H.; Yu, T.; Li, W.; Zhao, C. Modeling soil water content in extreme arid area using an adaptive neuro-fuzzy inference system. J. Hydrol. 2015, 527, 679–687. [Google Scholar] [CrossRef]
- Schaap, M.G.; Leij, F.J.; van Genuchten, M.T. Neural network analysis for hierarchical prediction of soil hydraulic properties. J. Soil Sci. Soc. Am. 1998, 62, 847–855. [Google Scholar] [CrossRef]
- Pachepsky, Y.A.; Timilin, D.; Varallyay, G. Artificial neural networks to estimate soil water retention from easily measurable data. J. Soil Sci. Soc. Am. 1996, 60, 727–733. [Google Scholar] [CrossRef]
- Mohammadi, J. Testing an artificial neural network for predicting soil water retention characteristics from soil physical and chemical properties. In Proceeding of the 17th WCSS, Bankok, Thailand, 20 August 2007; p. 221. [Google Scholar]
- Mohammadi, J.; Taheri, M. Estimation of pedotransfer function using fuzzy regression. J. Agri. Sci. Technol. 2005, 2, 51–60. [Google Scholar]
- Taghizadeh-mehrjardi, R.; Toomanian, N.; Khavaninzadeh, A.R.; Jafari, A.; Triantafilis, J. Predicting and mapping of soil particle-size fractions with adaptive neuro-fuzzy inference and ant colony optimization in central I ran. Eur. J. Soil Sci. 2016, 67, 707–725. [Google Scholar] [CrossRef]
Figure 1.
Location of study area and selected site. (Green color shows the agricultural areas).
Figure 2.
Geomorphology map of the study area (Codes refer to Table 2).
Figure 2.
Geomorphology map of the study area (Codes refer to Table 2).
Figure 3.
Representative VNIR/SWIR (The visible and near-infrared/ Short wave infrared) spectra of 10 randomly selected soil samples (a). The absorption spectra of the VNIR/SWIR spectra of 10 randomly selected soil samples (b), and Savitzky–Golay plus the first derivatives of 10 randomly selected soil samples, respectively (c).
Figure 4.
The relatively important auxiliary variables for predicting clay (a), sand (b), and silt (c) particles. MrVBF: multi-resolution, valley-bottom flatness index; NDWI: normalized difference water index; LS_Factor: slope length and steepness factor; GSAVI: green soil adjusted vegetation index; MSAVI: modified soil-adjusted vegetation index; TWI: topographic wetness index; CS: catchment slope; GNDVI: green normalized difference vegetation index; B5,B6: Landsat OLI spectral bands 5 and 6; Geo: geomorphology and 1456 nm (SILT G), 1998 nm (SILT M), 890 nm (CLAY F), 852 nm (SAND F), 879 nm (SAND G), and 879 nm (CLAY E); (an explanation of each of the auxiliary data is given in Table 1).
Figure 5.
Predicted maps of clay, sand and silt particles using the ANFIS model for the five standard depths: 0–5 cm, 5–15 cm, 15–30 cm, 30–60 cm, and 60–100 cm.
Figure 5.
Predicted maps of clay, sand and silt particles using the ANFIS model for the five standard depths: 0–5 cm, 5–15 cm, 15–30 cm, 30–60 cm, and 60–100 cm.
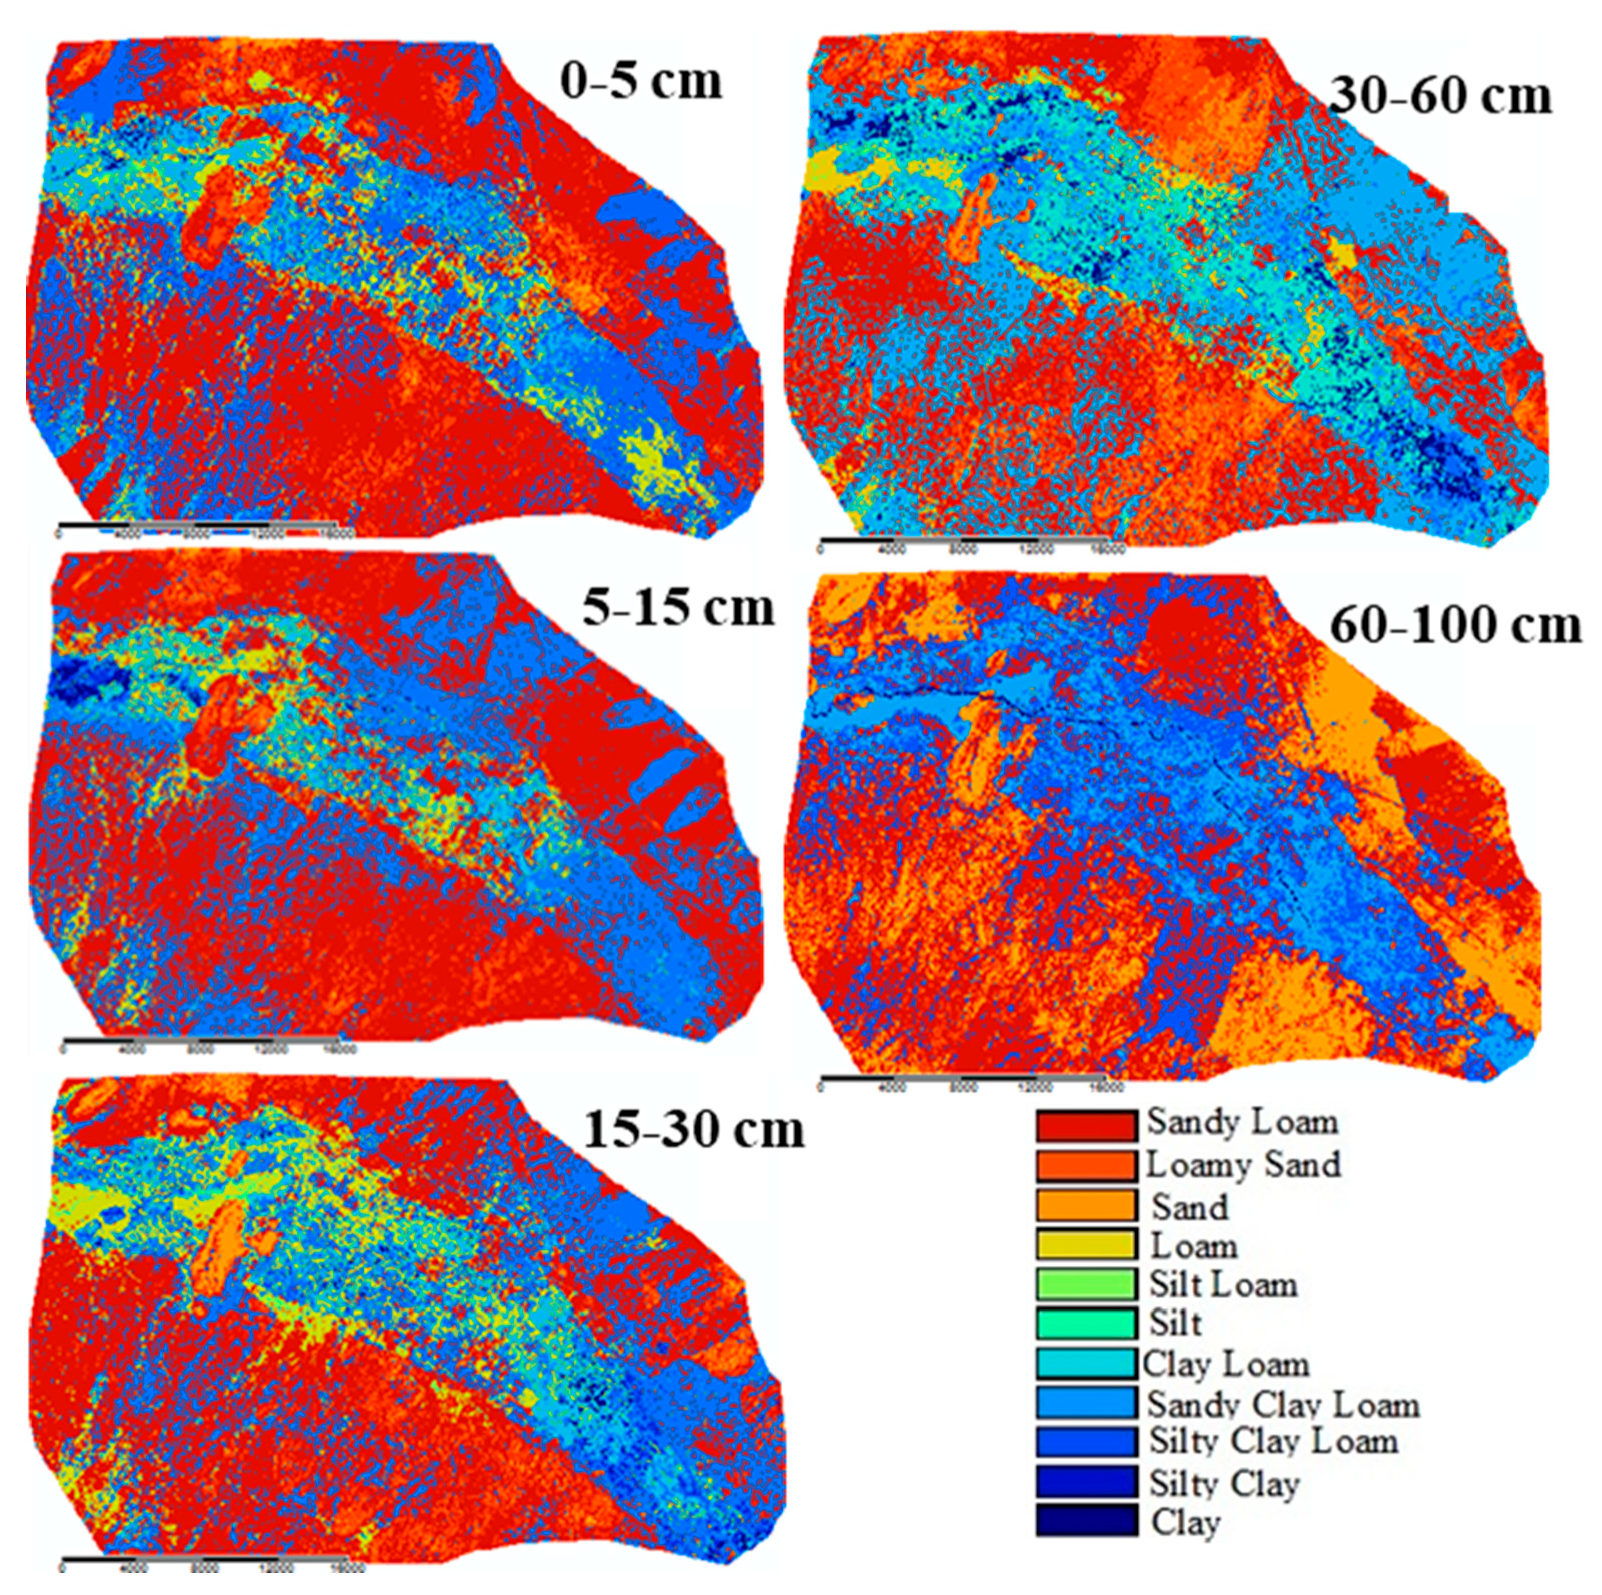
Figure 6.
Soil texture prediction map for the five standard depths: 0–5 cm, 5–15 cm, 15–30 cm, 30–60 cm, and 60–100 cm.
Figure 6.
Soil texture prediction map for the five standard depths: 0–5 cm, 5–15 cm, 15–30 cm, 30–60 cm, and 60–100 cm.

Table 1.
Auxiliary variables used as predictors in modeling.
| Auxiliary Variables | Parameters | Definition | Reference |
|---|---|---|---|
| The extracted data is DEM | Elevation | Height above sea level in meters | [33] |
| Slope gradient (SLOP) | Local hillslope gradient | [34] | |
| Aspect (ASP) | Compass direction of the maximum rate of change | [35] | |
| Multi-resolution Valley Bottom Flatness Index (MrVBF) | Measure of flatness in valley positions | [33] | |
| Valley depth (VD) | Depth of valley in meters | [36] | |
| Topographic wetness index (TWI) | Commonly used to quantify topographic control on hydrological processes | [34] | |
| Catchment slope (CS) | Average gradient above the flow path | [34] | |
| Multi-resolution Ridge-top Flatness Index(MRRTF) | Identifies high flat areas | [33] | |
| Modified catchment area | Area of modified areas (calculation of flow accumulation and related parameters) | [34] | |
| LS_Factor (Slope Length and Steepness factor) | Multiple flow algorithms and help to accurately estimate current accumulation | [34] | |
| Remote sensing data | Normalized Difference Vegetation Index (NDVI) | (B4 − B3)/(B4 + B3) | [37] |
| Perpendicular Vegetation Index(PVI) | -SINa(B5) COSa (B4) | [37] | |
| Green Normalized Difference Vegetation Index(GNDVI) | (B5 − B3)/(B5 + B3) | [37] | |
| Green Soil AdjustedVegetation Index (GSAVI) | (B5 − B3)/B5 + B3 + 0.5*1.5 | [37] | |
| Normalized difference water index (NDWI) | (B3 − B5)/(B3 + B5) | [37] | |
| Modified Soil-adjusted Vegetation Index (MSAVI) | (2*B5 + 1 − sqrt((2*B5 + 1)2 − 8*(B5 − B4)))/2 | [37] | |
| B2 | Landsat OLI spectral band | ||
| B3 | Landsat OLI spectral band | ||
| B4 | Landsat OLI spectral band | ||
| B5 | Landsat OLI spectral band | ||
| B6 | Landsat OLI spectral band | ||
| B7 | Landsat OLI spectral band | ||
| B8 | Landsat OLI spectral band | ||
| B10 | Landsat OLI spectral band | ||
| B11 | Landsat OLI spectral band | ||
| Field measurements closely measured by FieldSpec® 3 (The names of the spectra were performed in alphabetical order and then the effective spectra were separated.) | 1456 (SILT G) | 1456 Spectrum | [38] |
| 1998 (SILT M) | 1998 Spectrum | [38] | |
| 890 (CLAY F) | 890 Spectrum | [38] | |
| 852 (SAND F) | 852 Spectrum | [38] | |
| 879 (SAND G) | 879 Spectrum | [38] | |
| 879 (CLAY E) | 879 Spectrum | [38] | |
| Geomorphology data | Geomorphology map | Geomorphology levels | [39] |
Table 2.
Geomorphology map hierarchy for the study area.
| Landscape | Landform | Lithology | Geomorphic Surface | Code |
|---|---|---|---|---|
| Hill | Eroded outcrops | Conglomerate, sandstone | Tree branch drainage system | Hi111 |
| Mountain | Rock outcrop | Dolomite and limestone | Rock surface | Mo111 |
| Sandstone, volcanic rock, dolomite and shale | Rock surface | Mo121 | ||
| Sand dunes | Dune | Wind deposits | The active shaped hills are expanding | Sd111 |
| Piedmont | Shaped fan | Alluvial deposits of volcanic rocks, quartz, sandstone, dolomite and shale | Active fan, upper part, high slope, drainage network | Pi111 |
| The lower part is less drained and slopes less | Pi112 | |||
| Shale, sandstone, stone silt, quartz | Active fan, upper section | Pi121 | ||
| Active fan, lower section, low slope | Pi122 | |||
| Gypsiferous materials, sandstone | Active fan, upper section | Pi131 | ||
| Connected fans | Alluvial deposits of sandstone, limestone and dolomite | Upper part, drainage dense network, very high slope | Pi211 | |
| Lower bottom, drainage drain, slope less | Pi212 | |||
| Connected and cut old machines | Alluvial deposits of different limestone, volcanic, sandstone and shale rocks | Smooth surface with drainage dense network | Pi311 | |
| Surface with high elevation, high slope and deep drainage | Pi312 | |||
| Old connected fans | Alluvial deposits of different limestone stones, gypsum, volcanic rocks, sandstone, and shale | Coarse texture deposits, low slope, increasing drainage distance | Pi411 | |
| New alluvium with parallel drainage | Pi412 | |||
| Shaped and cut fan | Alluvial deposits of different limestone, volcanic, sandstone and shale rocks | Upper part, drainage dense network, very high slope | Pi511 | |
| Playa | clay flat | Alluvial fine sediments, salty | Cultivated clay flat | Pl111 |
| Clay, salty and wet | Clay flat, highly salty and wetness | Pll21 | ||
| Fine and coarse alluvial sediments, high salty | Salty and wetness, dense stream | Pl122 |
Table 3.
Statistical descriptions of the soil texture fractions at five standard depths.
| Soil Texture Fractions | Depth, cm | Min | Max | Average | Standard Deviation | Coefficient of Variation (%) |
|---|---|---|---|---|---|---|
| Clay | 0–5 | 3 | 42.61 | 18.59 | 8.91 | 48 |
| 5–15 | 3.52 | 41.35 | 18.63 | 8.14 | 43 | |
| 15–30 | 4.21 | 41.78 | 18.77 | 8.22 | 44 | |
| 30–60 | 4.1 | 53.91 | 19.14 | 9.88 | 52 | |
| 60–100 | 5 | 47.12 | 18.31 | 9.69 | 53 | |
| Sand | 0–5 | 16.97 | 94.88 | 64.1 | 15.13 | 24 |
| 5–15 | 23.14 | 91.23 | 64.09 | 14.04 | 21 | |
| 15–30 | 9.02 | 90.3 | 63.64 | 14.57 | 23 | |
| 30–60 | 5.93 | 86.82 | 63.25 | 17.71 | 28 | |
| 60–100 | 18.34 | 86.69 | 65.36 | 17.39 | 27 | |
| Silt | 0–5 | 2.01 | 42.15 | 17.26 | 9.57 | 55 |
| 5–15 | 3 | 47.41 | 17.12 | 9.46 | 55 | |
| 15–30 | 2.32 | 65.66 | 17.24 | 11.31 | 66 | |
| 30–60 | 3.54 | 70.39 | 17.56 | 12.82 | 73 | |
| 60–100 | 4.26 | 69.24 | 16.38 | 12.53 | 76 |
Table 4.
The efficiency of a regression tree (RT) model for predicting soil texture fractions at five standard depths.
Table 4.
The efficiency of a regression tree (RT) model for predicting soil texture fractions at five standard depths.
| Soil Texture Fractions | Depth, cm | R2 | CCC | RMSE (g kg−1) | ME | nRMSE |
|---|---|---|---|---|---|---|
| Clay | 0–5 | 0.68 | 0.62 | 5.07 | 0.04 | 0.27 |
| 5–15 | 0.63 | 0.61 | 6.05 | 0.05 | 0.33 | |
| 15–30 | 0.59 | 0.54 | 6.45 | 0.08 | 0.34 | |
| 30–60 | 0.57 | 0.50 | 8.00 | 0.06 | 0.42 | |
| 60–100 | 0.51 | 0.50 | 8.45 | −0.19 | 0.46 | |
| Sand | 0–5 | 0.70 | 0.65 | 6.98 | 0.09 | 0.11 |
| 5–15 | 0.68 | 0.61 | 10.96 | 0.18 | 0.17 | |
| 15–30 | 0.61 | 0.57 | 12.86 | 0.32 | 0.20 | |
| 30–60 | 0.59 | 0.56 | 13.67 | −0.11 | 0.22 | |
| 60–100 | 0.51 | 0.49 | 13.73 | −0.15 | 0.22 | |
| Silt | 0–5 | 0.63 | 0.59 | 4.64 | 0.21 | 0.27 |
| 5–15 | 0.59 | 0.57 | 4.67 | 0.11 | 0.27 | |
| 15–30 | 0.54 | 0.47 | 5.67 | −0.12 | 0.33 | |
| 30–60 | 0.51 | 0.48 | 6.40 | −0.60 | 0.33 | |
| 60–100 | 0.51 | 0.44 | 6.54 | 0.09 | 0.40 |
R2, coefficient of determination; ME, mean error; RMSE, root mean square error; nRMSE, normalized root mean square deviation; CCC, Concordance correlation coefficient.
Table 5.
The efficiency of artificial neural network (ANN) model for predicting soil texture fractions at five standard depths.
Table 5.
The efficiency of artificial neural network (ANN) model for predicting soil texture fractions at five standard depths.
| Soil Texture Fractions | Depth, cm | R2 | CCC | RMSE (g kg−1) | ME | nRMSE |
|---|---|---|---|---|---|---|
| Clay | 0–5 | 0.89 | 0.82 | 2.02 | 0.02 | 0.11 |
| 5–15 | 0.85 | 0.81 | 2.37 | 0.02 | 0.13 | |
| 15–30 | 0.82 | 0.79 | 2.51 | 0.07 | 0.13 | |
| 30–60 | 0.79 | 0.71 | 3.35 | 0.01 | 0.18 | |
| 60–100 | 0.76 | 0.64 | 4.79 | -0.16 | 0.26 | |
| Sand | 0–5 | 0.91 | 0.88 | 4.07 | 0.06 | 0.06 |
| 5–15 | 0.83 | 0.78 | 4.40 | 0.13 | 0.07 | |
| 15–30 | 0.77 | 0.69 | 6.33 | 0.24 | 0.10 | |
| 30–60 | 0.75 | 0.73 | 7.00 | −0.05 | 0.11 | |
| 60–100 | 0.66 | 0.57 | 8.22 | −0.08 | 0.13 | |
| Silt | 0–5 | 0.92 | 0.86 | 2.75 | 0.1 | 0.16 |
| 5–15 | 0.85 | 0.83 | 3.35 | 0.09 | 0.20 | |
| 15–30 | 0.80 | 0.77 | 4.38 | −0.04 | 0.25 | |
| 30–60 | 0.68 | 0.59 | 5.66 | −0.40 | 0.32 | |
| 60–100 | 0.65 | 0.56 | 5.75 | 0.06 | 0.34 |
R2, coefficient of determination; ME, mean error; RMSE, root mean square error; nRMSE, normalized root mean square deviation; CCC, Concordance correlation coefficient.
Table 6.
The efficiency of a neuro-fuzzy system (ANFIS) model for predicting soil texture fractions at five standard depths.
Table 6.
The efficiency of a neuro-fuzzy system (ANFIS) model for predicting soil texture fractions at five standard depths.
| Soil Texture Fractions | Depth, cm | R2 | CCC | RMSE (g kg−1) | ME | nRMSE |
|---|---|---|---|---|---|---|
| Clay | 0–5 | 0.90 | 0.86 | 2.00 | 0.02 | 0.11 |
| 5–15 | 0.87 | 0.84 | 2.11 | 0.02 | 0.11 | |
| 15–30 | 0.85 | 0.77 | 2.35 | 0.06 | 0.12 | |
| 30–60 | 0.79 | 0.78 | 3.01 | 0.01 | 0.16 | |
| 60–100 | 0.76 | 0.69 | 4.68 | −0.15 | 0.25 | |
| Sand | 0–5 | 0.91 | 0.90 | 4.00 | 0.06 | 0.06 |
| 5–15 | 0.85 | 0.77 | 4.11 | 0.11 | 0.06 | |
| 15–30 | 0.78 | 0.71 | 6.18 | 0.21 | 0.09 | |
| 30–60 | 0.75 | 0.68 | 6.82 | −0.03 | 0.11 | |
| 60–100 | 0.68 | 0.60 | 8.03 | −0.07 | 0.12 | |
| Silt | 0–5 | 0.92 | 0.87 | 2.68 | 0.09 | 0.15 |
| 5–15 | 0.87 | 0.83 | 3.24 | 0.09 | 0.19 | |
| 15–30 | 0.81 | 0.75 | 4.10 | −0.05 | 0.24 | |
| 30–60 | 0.69 | 0.65 | 5.60 | −0.35 | 0.32 | |
| 60–100 | 0.71 | 0.68 | 5.21 | 0.04 | 0.32 |
R2, coefficient of determination; ME, mean error; RMSE, root mean square error; nRMSE, normalized root mean square deviation; CCC, Concordance correlation coefficient.
© 2019 by the authors. Licensee MDPI, Basel, Switzerland. This article is an open access article distributed under the terms and conditions of the Creative Commons Attribution (CC BY) license (http://creativecommons.org/licenses/by/4.0/).
Share and Cite
MDPI and ACS Style
Mehrabi-Gohari, E.; Matinfar, H.R.; Jafari, A.; Taghizadeh-Mehrjardi, R.; Triantafilis, J. The Spatial Prediction of Soil Texture Fractions in Arid Regions of Iran. Soil Syst. 2019, 3, 65. https://doi.org/10.3390/soilsystems3040065
AMA Style
Mehrabi-Gohari E, Matinfar HR, Jafari A, Taghizadeh-Mehrjardi R, Triantafilis J. The Spatial Prediction of Soil Texture Fractions in Arid Regions of Iran. Soil Systems. 2019; 3(4):65. https://doi.org/10.3390/soilsystems3040065
Chicago/Turabian StyleMehrabi-Gohari, Elham, Hamid Reza Matinfar, Azam Jafari, Ruhollah Taghizadeh-Mehrjardi, and John Triantafilis. 2019. "The Spatial Prediction of Soil Texture Fractions in Arid Regions of Iran" Soil Systems 3, no. 4: 65. https://doi.org/10.3390/soilsystems3040065