Soil Organic Carbon Changes for Switchgrass Farms in East Tennessee, USA
by
 ,
,
Dustin K. Toliver
1, 
Burton C. English
2,*,
Donald D. Tyler
3,
Jaehoon Lee
4,
R. Jamey Menard
2 and
Jon C. Walton
2 1
170 Winfair Drive, Tyrone, GA 30290, USA
2
Agricultural and Resource Economics, University of Tennessee, Knoxville, TN 37996-4518, USA
3
Biosystems Engineering and Soil Science, University of Tennessee, Jackson, TN 38301, USA
4
Biosystems Engineering and Soil Science, University of Tennessee, Knoxville, TN 37996-4531, USA
*
Author to whom correspondence should be addressed.
Soil Syst. 2018, 2(2), 25; https://doi.org/10.3390/soilsystems2020025
Submission received: 7 March 2018
/
Revised: 17 April 2018
/
Accepted: 17 April 2018
/
Published: 24 April 2018
(This article belongs to the Special Issue Soil Organic Matter Dynamics)
Abstract
:Much attention has been paid to switchgrass’s potential for conversion to cellulosic ethanol and its ability to sequester soil organic carbon (SOC). Soil samples from switchgrass farms in East Tennessee were collected at depths of 0–5, 15–30, 30–60, and 60–90 cm and tested for SOC over a 4-year period (2008–2011). Results showed no differences (p ≥ 0.05) in SOC from 2008 to 2011. However, when comparing the initial samples to year four, SOC decreases ranging from 0.04 to 0.47 t ha−1 were observed in the 5–10 and 10–15 cm soil depths. While SOC increased with time in the 90 to 120 cm layer, this increase was not significant at p = 0.05 but was significant at the 0.10 level. Following three full growing seasons, switchgrass’s potential to sequester carbon comes at deeper soil depths due to its vast root structure. Greater levels of carbon were present in soil previously no-tilled compared to that previously under conventional tillage; however, neither gained or lost a significant amount of SOC by year four. Alfisols were the only taxonomic category that had a significant increase in SOC by year four. Green beans were the only previously produced crop that had a significant positive effect on sequestering carbon. Increases in switchgrass yield were correlated to SOC.
1. Introduction
The biofuels versus fossil fuels debate continues. Some indicate that the need to replace fossil fuels with an environment friendly alternative has become all the more urgent, as reports pour in on how fossil fuels pollute the environment and contribute to the phenomenon of global warming. Among the various replacement options put forth, biofuels are believed to be one of the best alternatives to fossil fuels and are expected to be the primary contributor to renewable energy over the next decade [1].
In 2005, the United States through the Energy Policy Act embarked on an alternative transportation fuels strategy by setting a renewable fuel standard (RFS) that required 7.5 billion gallons of ethanol by 2012. By 2007, production exceeded this mandate and the Energy Independence and Security Act (EISA) was passed. The EISA expanded the RFS program to include diesel, in addition to gasoline; increased the volume of renewable fuel required to be blended into transportation fuel from 9 billion gallons in 2008 to 36 billion gallons by 2022; established new categories of renewable fuel, setting separate volume requirements for each category; and required the Environmental Protection Agency (EPA) to apply lifecycle greenhouse gas performance threshold standards to ensure that each category of renewable fuel emits fewer greenhouse gases than the petroleum fuel it replaces [2].
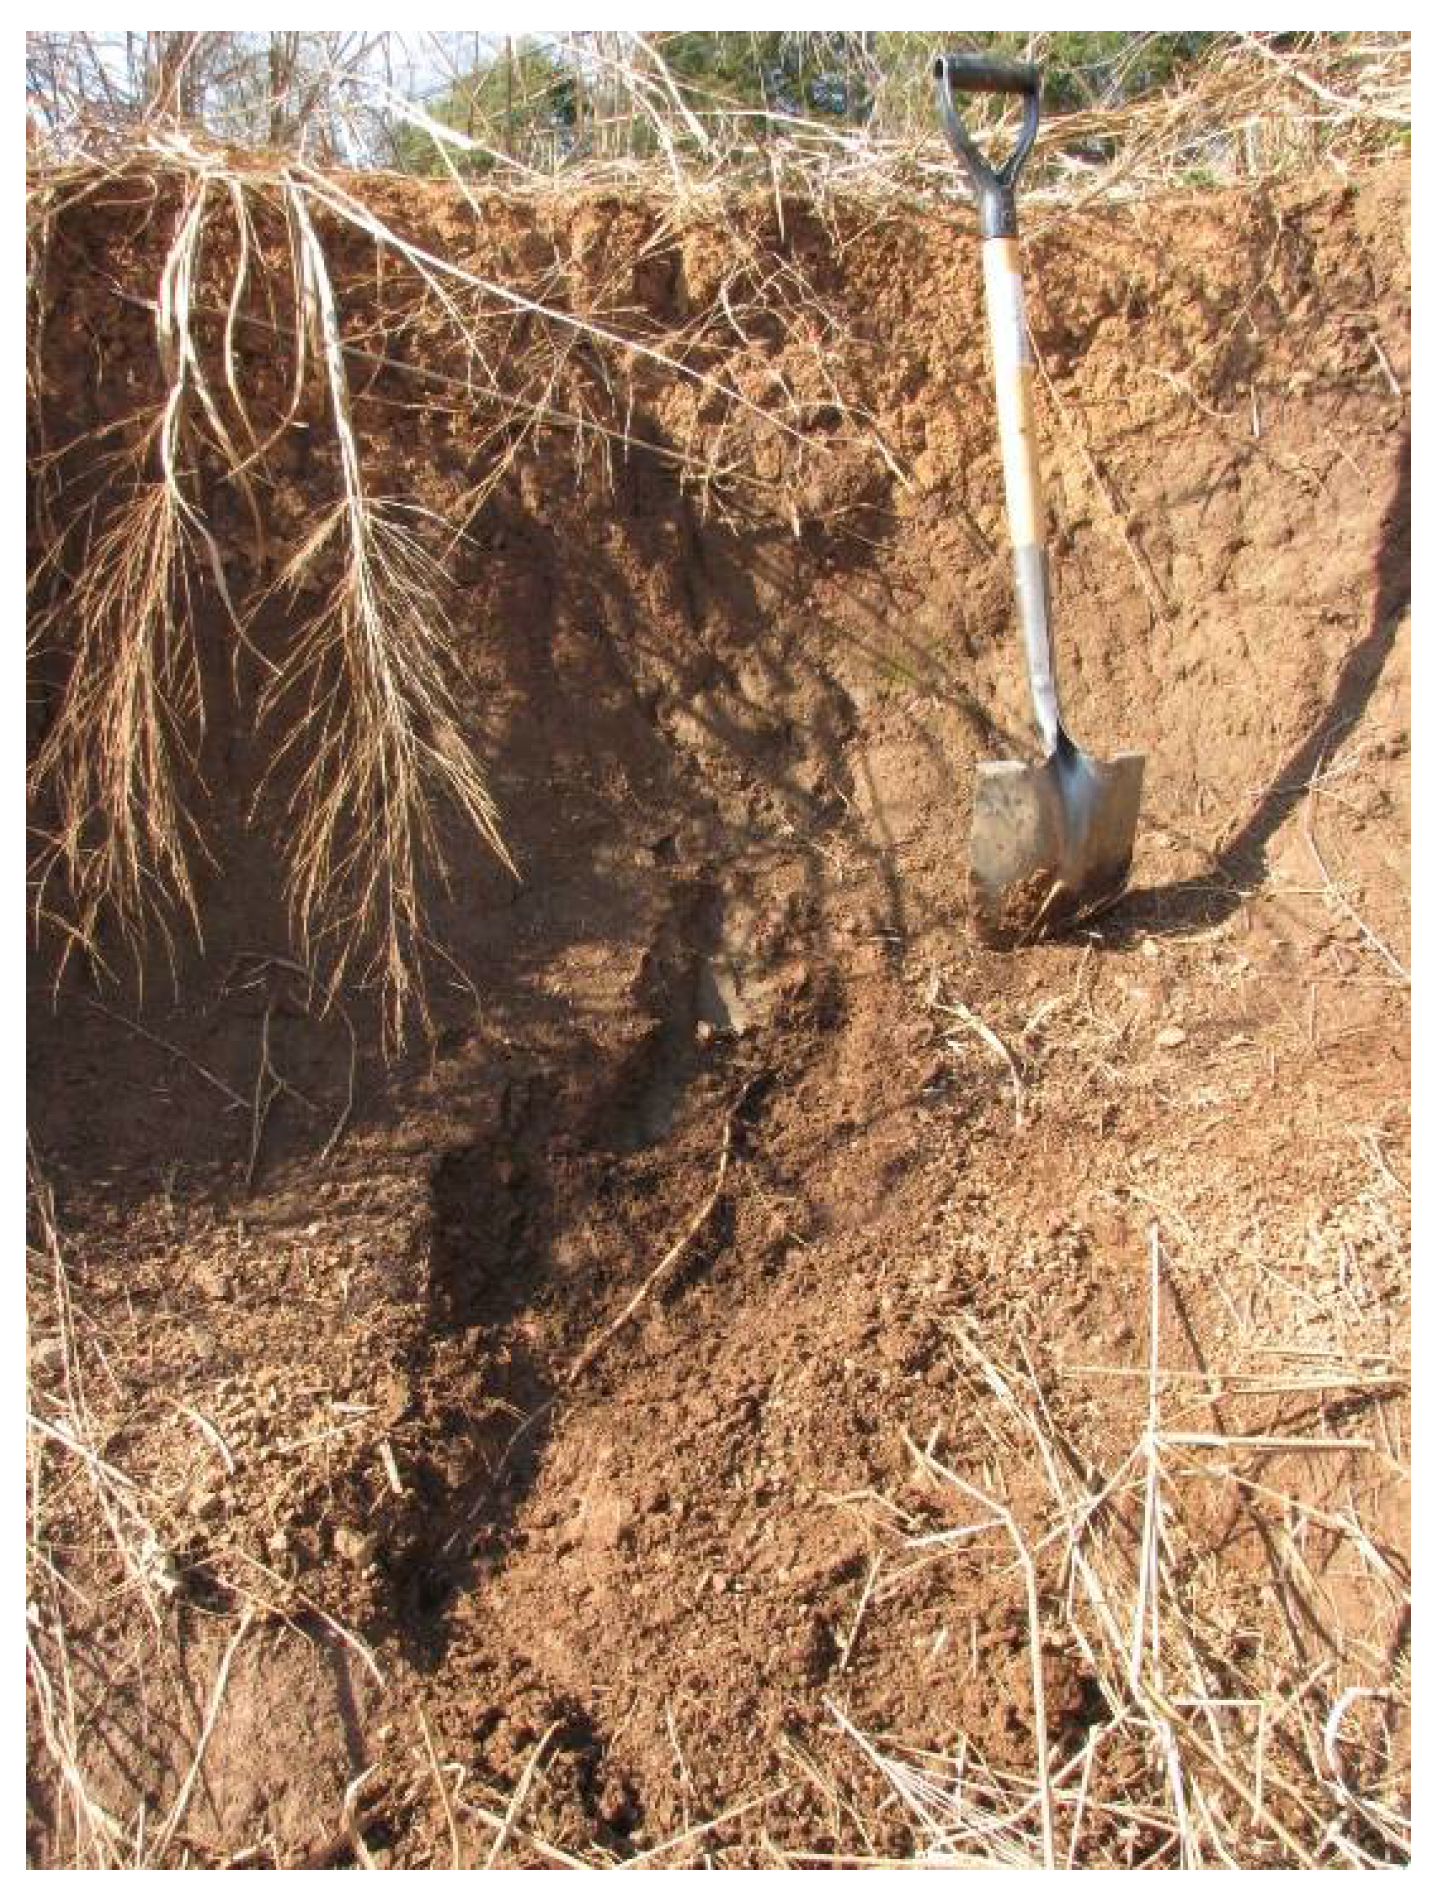
One crop promoted as a dedicated energy feedstock crop is switchgrass. Switchgrass (Panicum virgatum L.) is a high yielding, deep rooted, herbaceous perennial grass native to the United States (Figure 1) [3]. As a native species, switchgrass is resistant to many diseases and pests [4]. In 1991, after years of research by the Bioenergy Feedstock Development Program at Oak Ridge National Laboratory (ORNL), the U.S. Department of Energy selected switchgrass as the model herbaceous bio-energy crop for the Southeast. Reasons for selecting switchgrass included high yields, low fertilizer input, excellent conservation attributes, and because the production and harvest methods were compatible with conventional farming practices [5,6]. There are two general ecotypes of switchgrass. One is a lowland ecotype that is tall, thick-stemmed, and can adapt to wet conditions. The other is an upland variety that is shorter and thinly stemmed. The lowland variety generally produces more biomass than its counterpart [7].
Shahandeh et al. found that the slow decomposition of switchgrass could be a potential advantage in sequestering soil carbon [8]. The root biomass of switchgrass can exceed its aboveground biomass, with roots capable of extending more than three meters in depth [5,9]. Increased amounts of soil organic carbon (SOC) can also improve a soil’s productivity by increasing soil nutrients and water holding capacity and reducing soil bulk density [10].
Previous studies have looked at switchgrass’s potential to sequester SOC and have found promising results [11,12,13]. The amount of SOC sequestered by switchgrass has been found to vary by factors of depth, previous land use, soil type, and age of the switchgrass stand [10,14]. Studies have shown that growing switchgrass leads to gains in SOC when planted on land that was previously cultivated to row crops or that is fallow or in the Conservation Reserve Program [14]. Zan et al. suggested that perennial energy crops grown on relatively fertile soils have the potential to substantially increase soil C levels when compared to conventional agricultural or unmanaged systems [15].
Different soil types can affect the amount of carbon sequestered in the soil because different soil types have varying levels of productivity [16]. Higher productivity levels result in increased biomass, which in turn will increase soil carbon. Soil type also affects the rate at which organic matter is decomposed [17,18]. The age of the switchgrass stand can have a significant impact on the amount of SOC sequestered. Ma et al. found that switchgrass did not sequester a significant amount of carbon after three years in their study conducted in Alabama [13]. However, after ten years the switchgrass stand had sequestered 44.8% and 28.2% more carbon than an adjacent fallow soil at depths of 0–15 and 15–30 cm, respectively. An experiment performed in Quebec compared amounts of SOC between switchgrass and corn after four years of production [15]. They found that switchgrass sequestered SOC at a rate of 3 t/ha/year more compared to corn [15]. A study by Jung and Lal sampled down to 30 cm and found no significant differences in SOC levels between soils under switchgrass and the reference soils [19]. Liebig et al. conducted a study comparing 42 paired switchgrass and cropland sites in Minnesota, North Dakota, and South Dakota [20]. The soil under switchgrass had significantly more SOC than cropland at depths of 0–5, 30–60, and 60–90 cm. SOC differences were highly pronounced at the deeper sampled depths, differences were 7.7 and 4.34 Mg ha−1 for the 30–60 and 60–90 cm depths, respectively [20]. In a study conducted in Tennessee by Garten et al., they found carbon content declined sharply with depth [9].
The main objective of this study was to determine the amount of SOC sequestered by Alamo switchgrass, a lowland ecotype, in East Tennessee and how the amount sequestered is affected by depth, tillage, age of switchgrass stand, yield, soil type, and previous crop. While similar studies have been conducted on switchgrass’s ability to sequester carbon, they often have not incorporated a multi-factor analysis to the interpretation of results.
2. Materials and Methods
2.1. Site
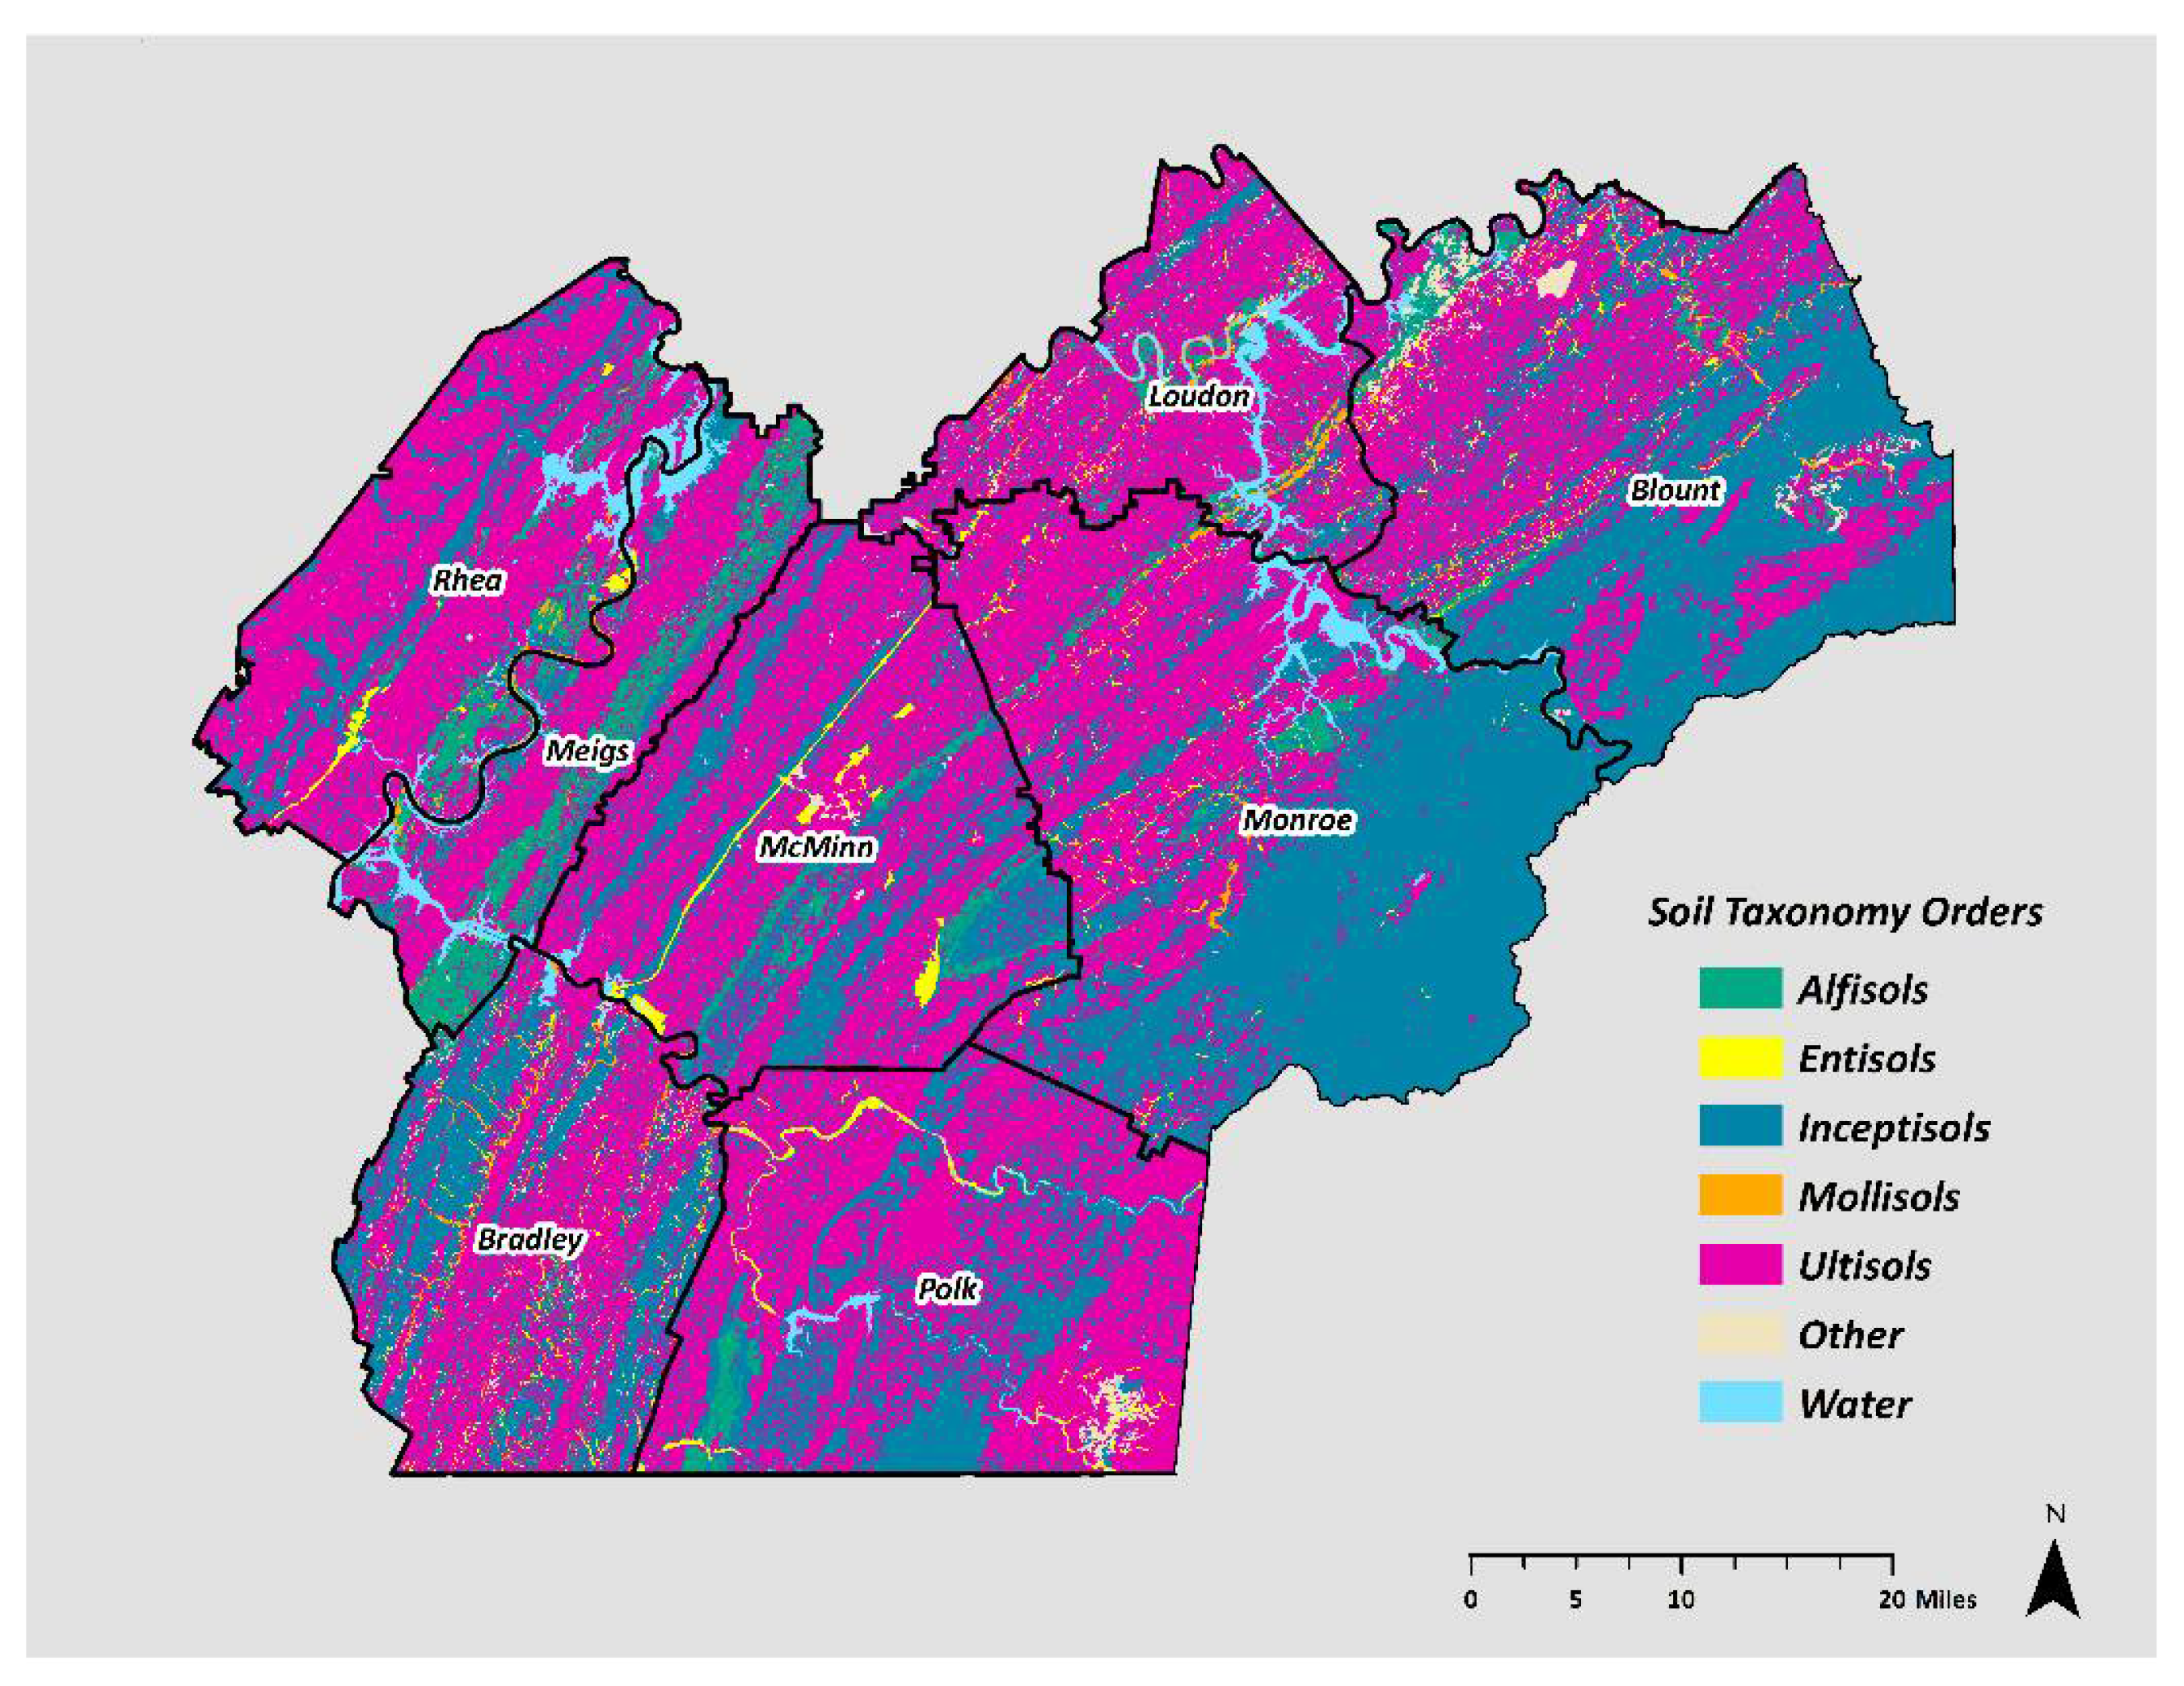
The study took place at seven switchgrass farms in East Tennessee, all within an 81-km (50-mile) radius of the 250,000-gallon bio-refinery located at Vonore, TN. Soil samples were collected for both shallow (0–5, 5–15, and 15–30 cm) and deep (30–60, 60–90, and 90–120 cm) depths. A map of the East Tennessee counties used in this analysis along with the soil taxonomic categories present in each county can be seen in Figure 2. A brief description of each farm is presented in Table 1.
The owners of these farms were contracted in 2008 by the University of Tennessee and Genera Energy to grow switchgrass for the purpose of generating biomass to be converted into cellulosic ethanol at the DuPont Danisco Cellulosic Ethanol (D.D.C.E.) bio-refinery in Vonore, TN. Information from the farmer included location, field size, and previously grown crop. Prior to signing a contract with the farmer, Extension personnel measured the field using global positioning system (GPS) technology. After the farmer was enrolled in the program, switchgrass establishment began. Maps of the fields were generated and soil maps were used to identify soils within the field boundaries [21]. The sampled farms range in size, shape, slope, drainage, soil type, previous crop grown, tillage method, and overall soil productivity. The switchgrass was originally planted during the months of April–July 2008 at a rate of 6 pounds live seed per acre and drilled to a depth of 1 to 2 cm using farmer-owned equipment. Mowing and baling occurred once a year during November through March. Table 2 displays the average switchgrass yields for each farm for the years 2008–2011.
2.2. Soil Sampling and Analysis
Four years of samplings were completed in June and July 2008 (prior to land use change), February, March, and April 2009, and March and April 2010. The latest sampling occurred in February and March 2011. Within each field sampled, sampling points were selected randomly using a geo-referenced statistical-based model developed in Visual Basic and ArcGIS Engine [22,23]. Empirical evidence suggest that geo-referenced soil sampling is superior with respect to the information they provide compared to other soil sampling strategies [24]. The model was designed as follows:
- Each soil type was assigned a number of sampling points based on its size within the farm.
- ○
- If the area was less than 0.81 hectares then no points were assigned,
- ○
- if the area was between 0.81 and 4.05 hectares the algorithm assigned 4 points, and
- ○
- if the area was greater than 4.05 hectares the number of points assigned was one point per hectare.
- Each point was placed randomly but was guaranteed not to fall within 7.62 m from the soil boundaries and guaranteed to be at least 30.5 m from every other point.
The points, once selected, were loaded into a handheld GPS model TDS Nomad. The handheld GPS unit was used in the field to locate and flag each respective sampling point. The same sets of points were sampled each year.
After each sampling point was located, a handheld soil probe (JMC Backsaver push probe with a JMC 38.1 cm dry sampling tube) was used to collect the shallow samples. The samples were broken down in 0–5, 5–10, 10–15, and 15–30 cm increments. Five cores were taken within a five-foot radius of the sampling point to give a representative sample of the area. A set of deep samples up to a depth of 120 cm was also collected. These samples were then broken down into 30-cm increments (30–60, 60–90, and 90–120 cm). The criterion for collecting these samples was one core sample per soil type. During the first year of sampling, the deep samples were collected with a bucket auger with a three-inch diameter to the appropriate depths. Each year thereafter, deep samples were collected with a Giddings hydraulic soil probe. After each sample was collected, they were placed into a plastic sample bag. These bags were left open and placed in a greenhouse for air-drying. After the samples dried, they were ground, sieved through a 2-mm sieve, then shipped to the University of Tennessee Soil, Plant, and Pest Center (Nashville, TN) for additional oven drying and soil analysis.
Bulk density soil samples were collected along with soil carbon samples in 2008. Soil bulk density for the shallow samples (0–30 cm) was determined using the core method [25]. Five-centimeter cores were taken at 0 to 5 cm, 5 to 10 cm, 10 to 15 cm, and 15 to 30 cm depths for the shallow measurements. The deep samples of 30–60 cm, 60–90 cm, and 90–120 cm depths were taken using a soil probe truck. The cores were transferred to the lab to determine bulk density. The length and diameter of each core were recorded to calculate the core volume. The cores were then oven-dried for 24 h at 105 °C and the dry weight was determined [25]. For each core, bulk density was determined and recorded as mass (g)/volume (cm3). Bulk densities were used to convert percent SOC into a concentration per area of t/ha.
For SOC, a sample of 5–10 mg was placed in a tin sample cup. The soil sample was heated to 105 °C in a furnace in a stream of helium (He) [26]. Flash combustion was induced by a pulse of O2 injected into the quartz reactor causing the tin to heat to 1700–1800 °C, combusting the soil sample and releasing CO2 [26]. The thermal conductivity of the gases was measured and the relative concentration of the thermal conductivity indicated the content of organic carbon. The analyzer used was a Thermo Fisher EA 1112 Combustion C/N Analyzer (Thermo Fisher Scientific, Waltham, MA, USA).
All data were analyzed using the SAS package [27]. Data were summarized using means to provide soil organic carbon levels (t/ha) for each depth and year. Data were analyzed for significant differences in SOC using a letter grouping ANOVA in PROC MIXED [28]. The probability level for significance was set at p ≤ 0.10. A linear regression was also used to determine what factors were having significant effects on changes in SOC between 2008 and 2011. This was accomplished by taking the differences in SOC as the dependent variable. Factors considered in this analysis were tillage method, previously produced crop, switchgrass yield, and soil taxonomy. Significance was set at the p ≤ 0.10 level.
3. Results and Discussion
3.1. ANOVA Analysis
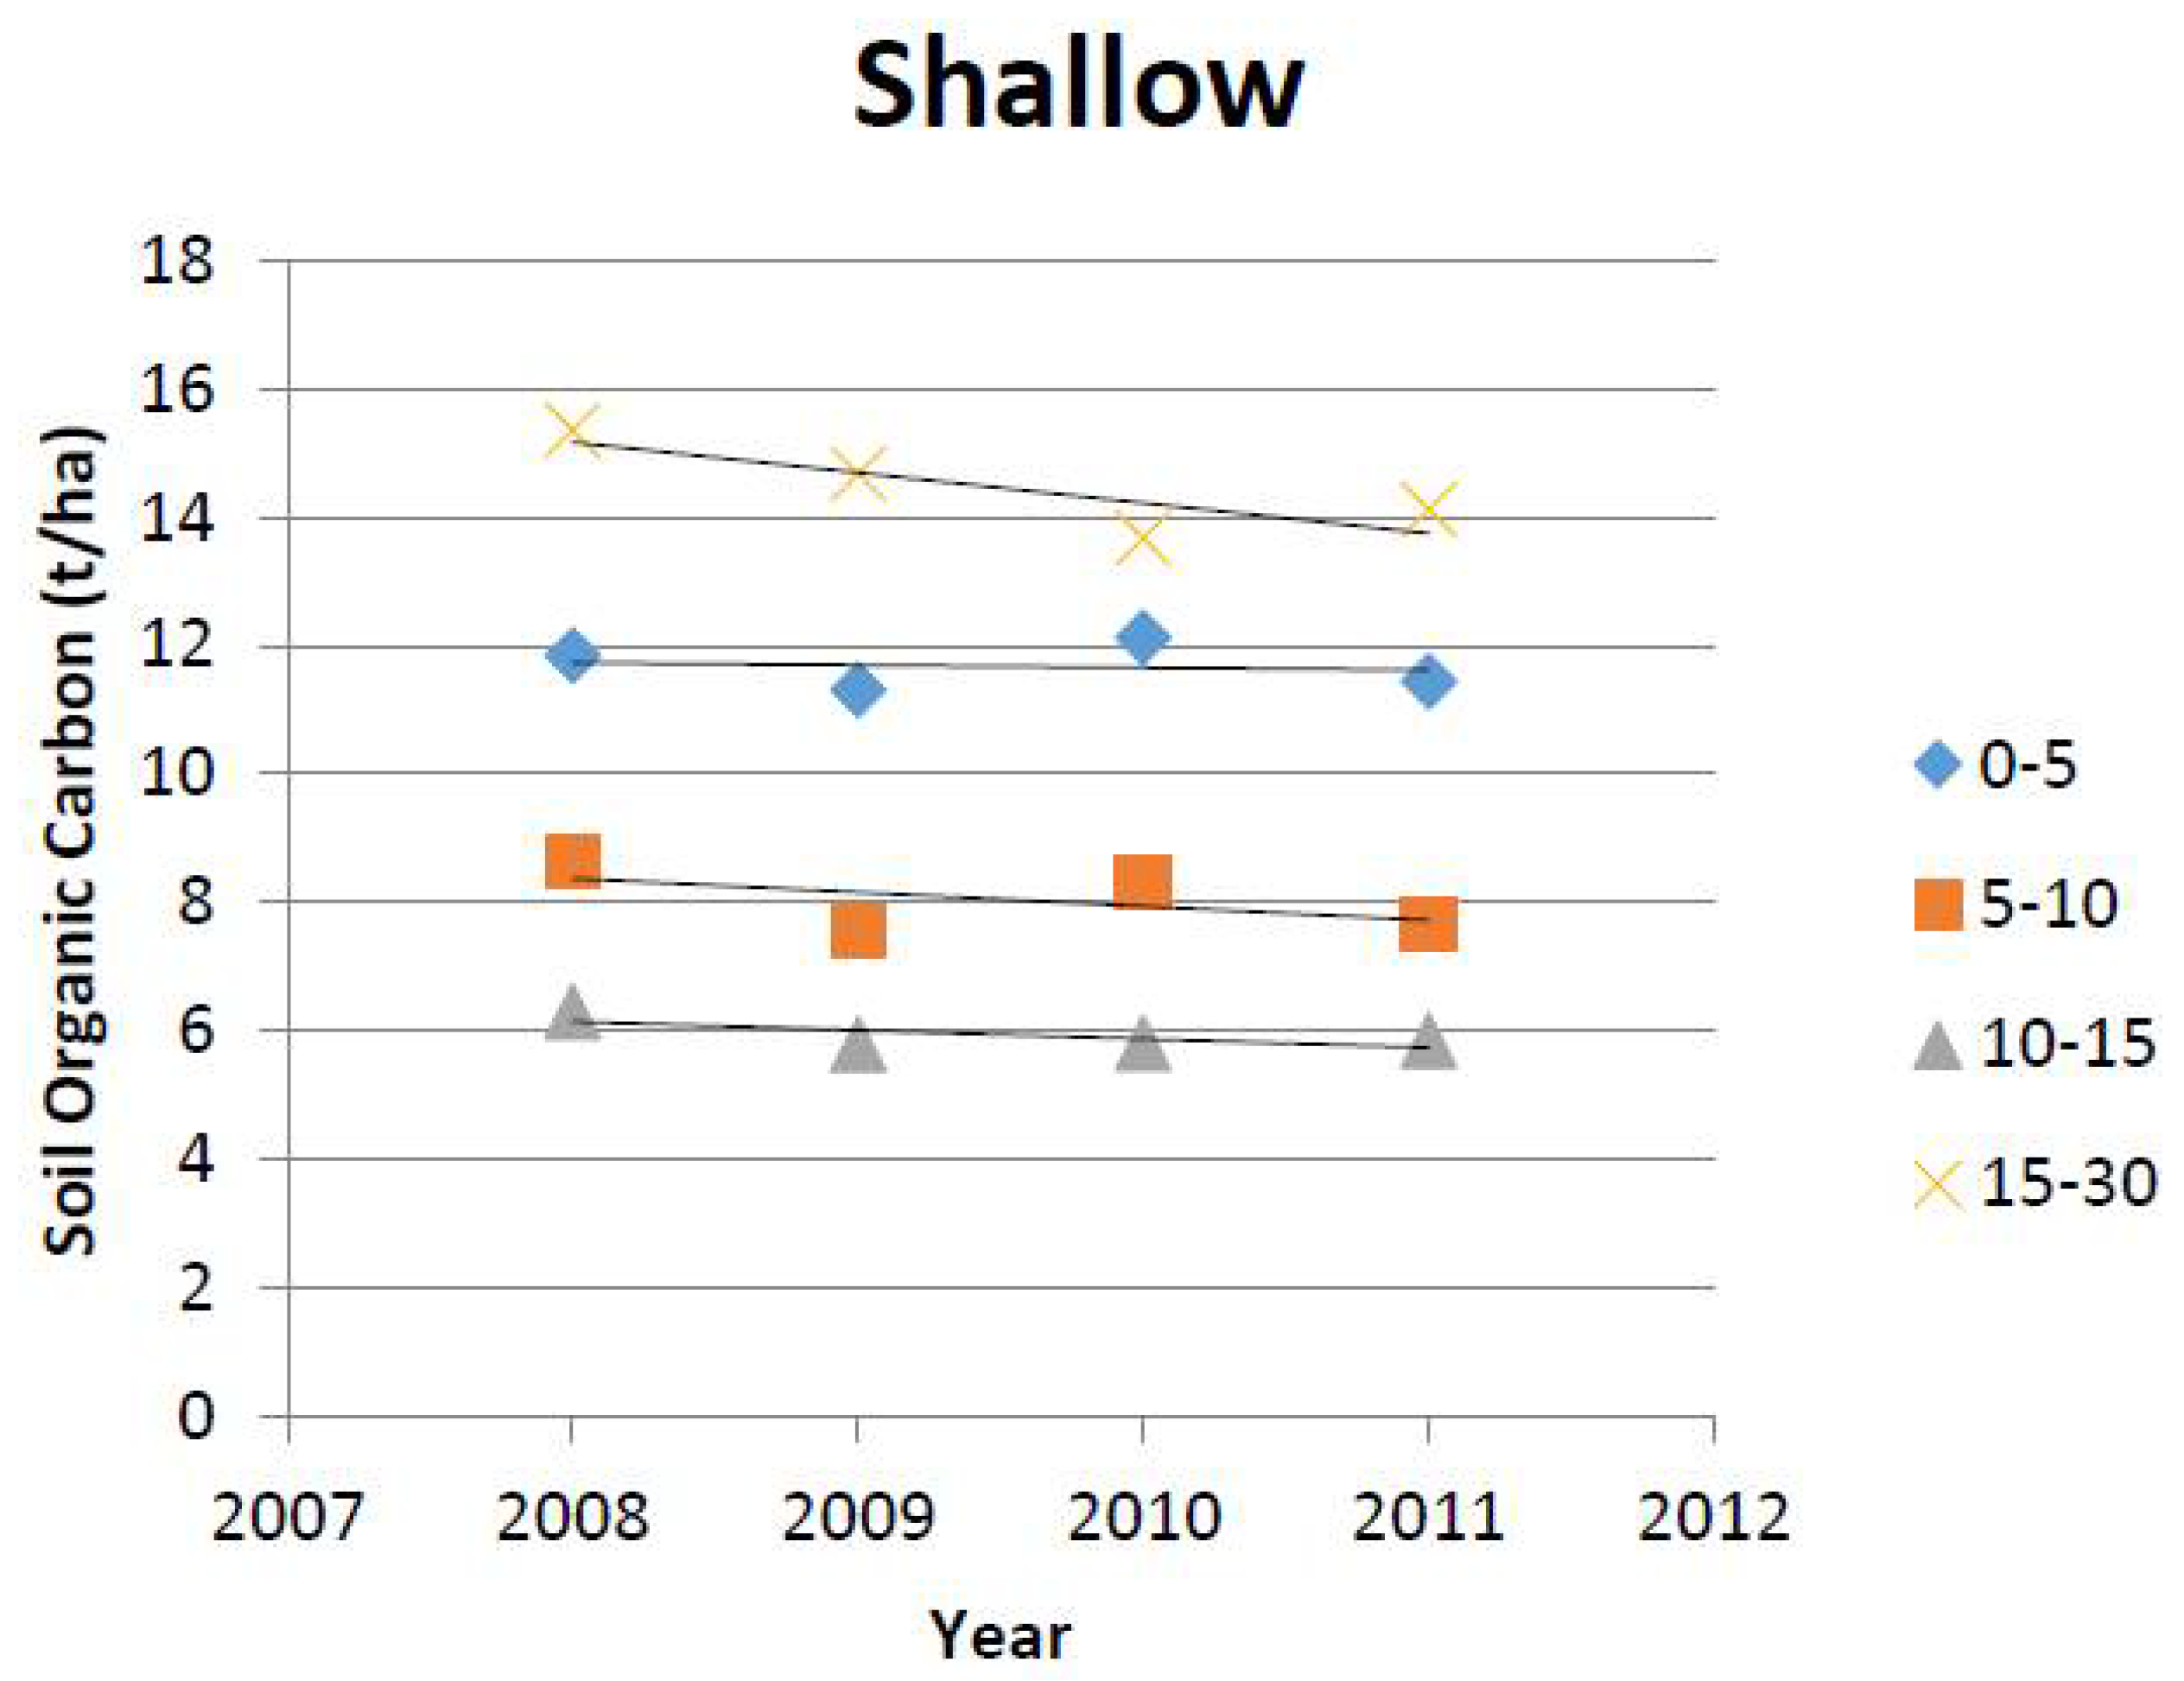
The amount of SOC (t/ha) present in the surface 0–30 cm is shown in Figure 3. For each increment in the top 30 cm of the soil, the amount of carbon in the soil drops after the initial year and the amount of SOC present in 2011 for each case is lower than the initial 2008 levels. While the levels have dropped, the amount reduced in the 0–5, 10–15, and 15–30 cm depths was not statistically significant (Table 3). In the top 10 centimeters of the soil, the amount of carbon sequestered or released seems erratic, which could be for various reasons. Being so close to the surface, slight soil disturbances through harvest and the increased decomposition for being exposed to the elements compared to deeper depths could potentially affect SOC sequestration rates, seemingly making the top 10 cm of the soil a very sensitive area to carbon sequestration [29]. Anderson-Teixeira et al. found that harvesting biomass reduces and/or slows SOC accumulation, especially at shallow depths [14]. For switchgrass, in particular, they found that harvesting caused SOC to build less rapidly [14]. Another explanation could be root turnover.
Average root turnover for native grasses is four years [30]. Since the switchgrass stands in this study have only gone through three full growing seasons, the true contribution of SOC from root turnover may not yet have been accounted for.
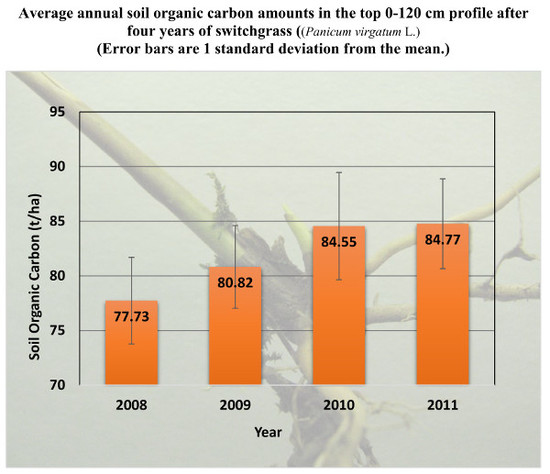
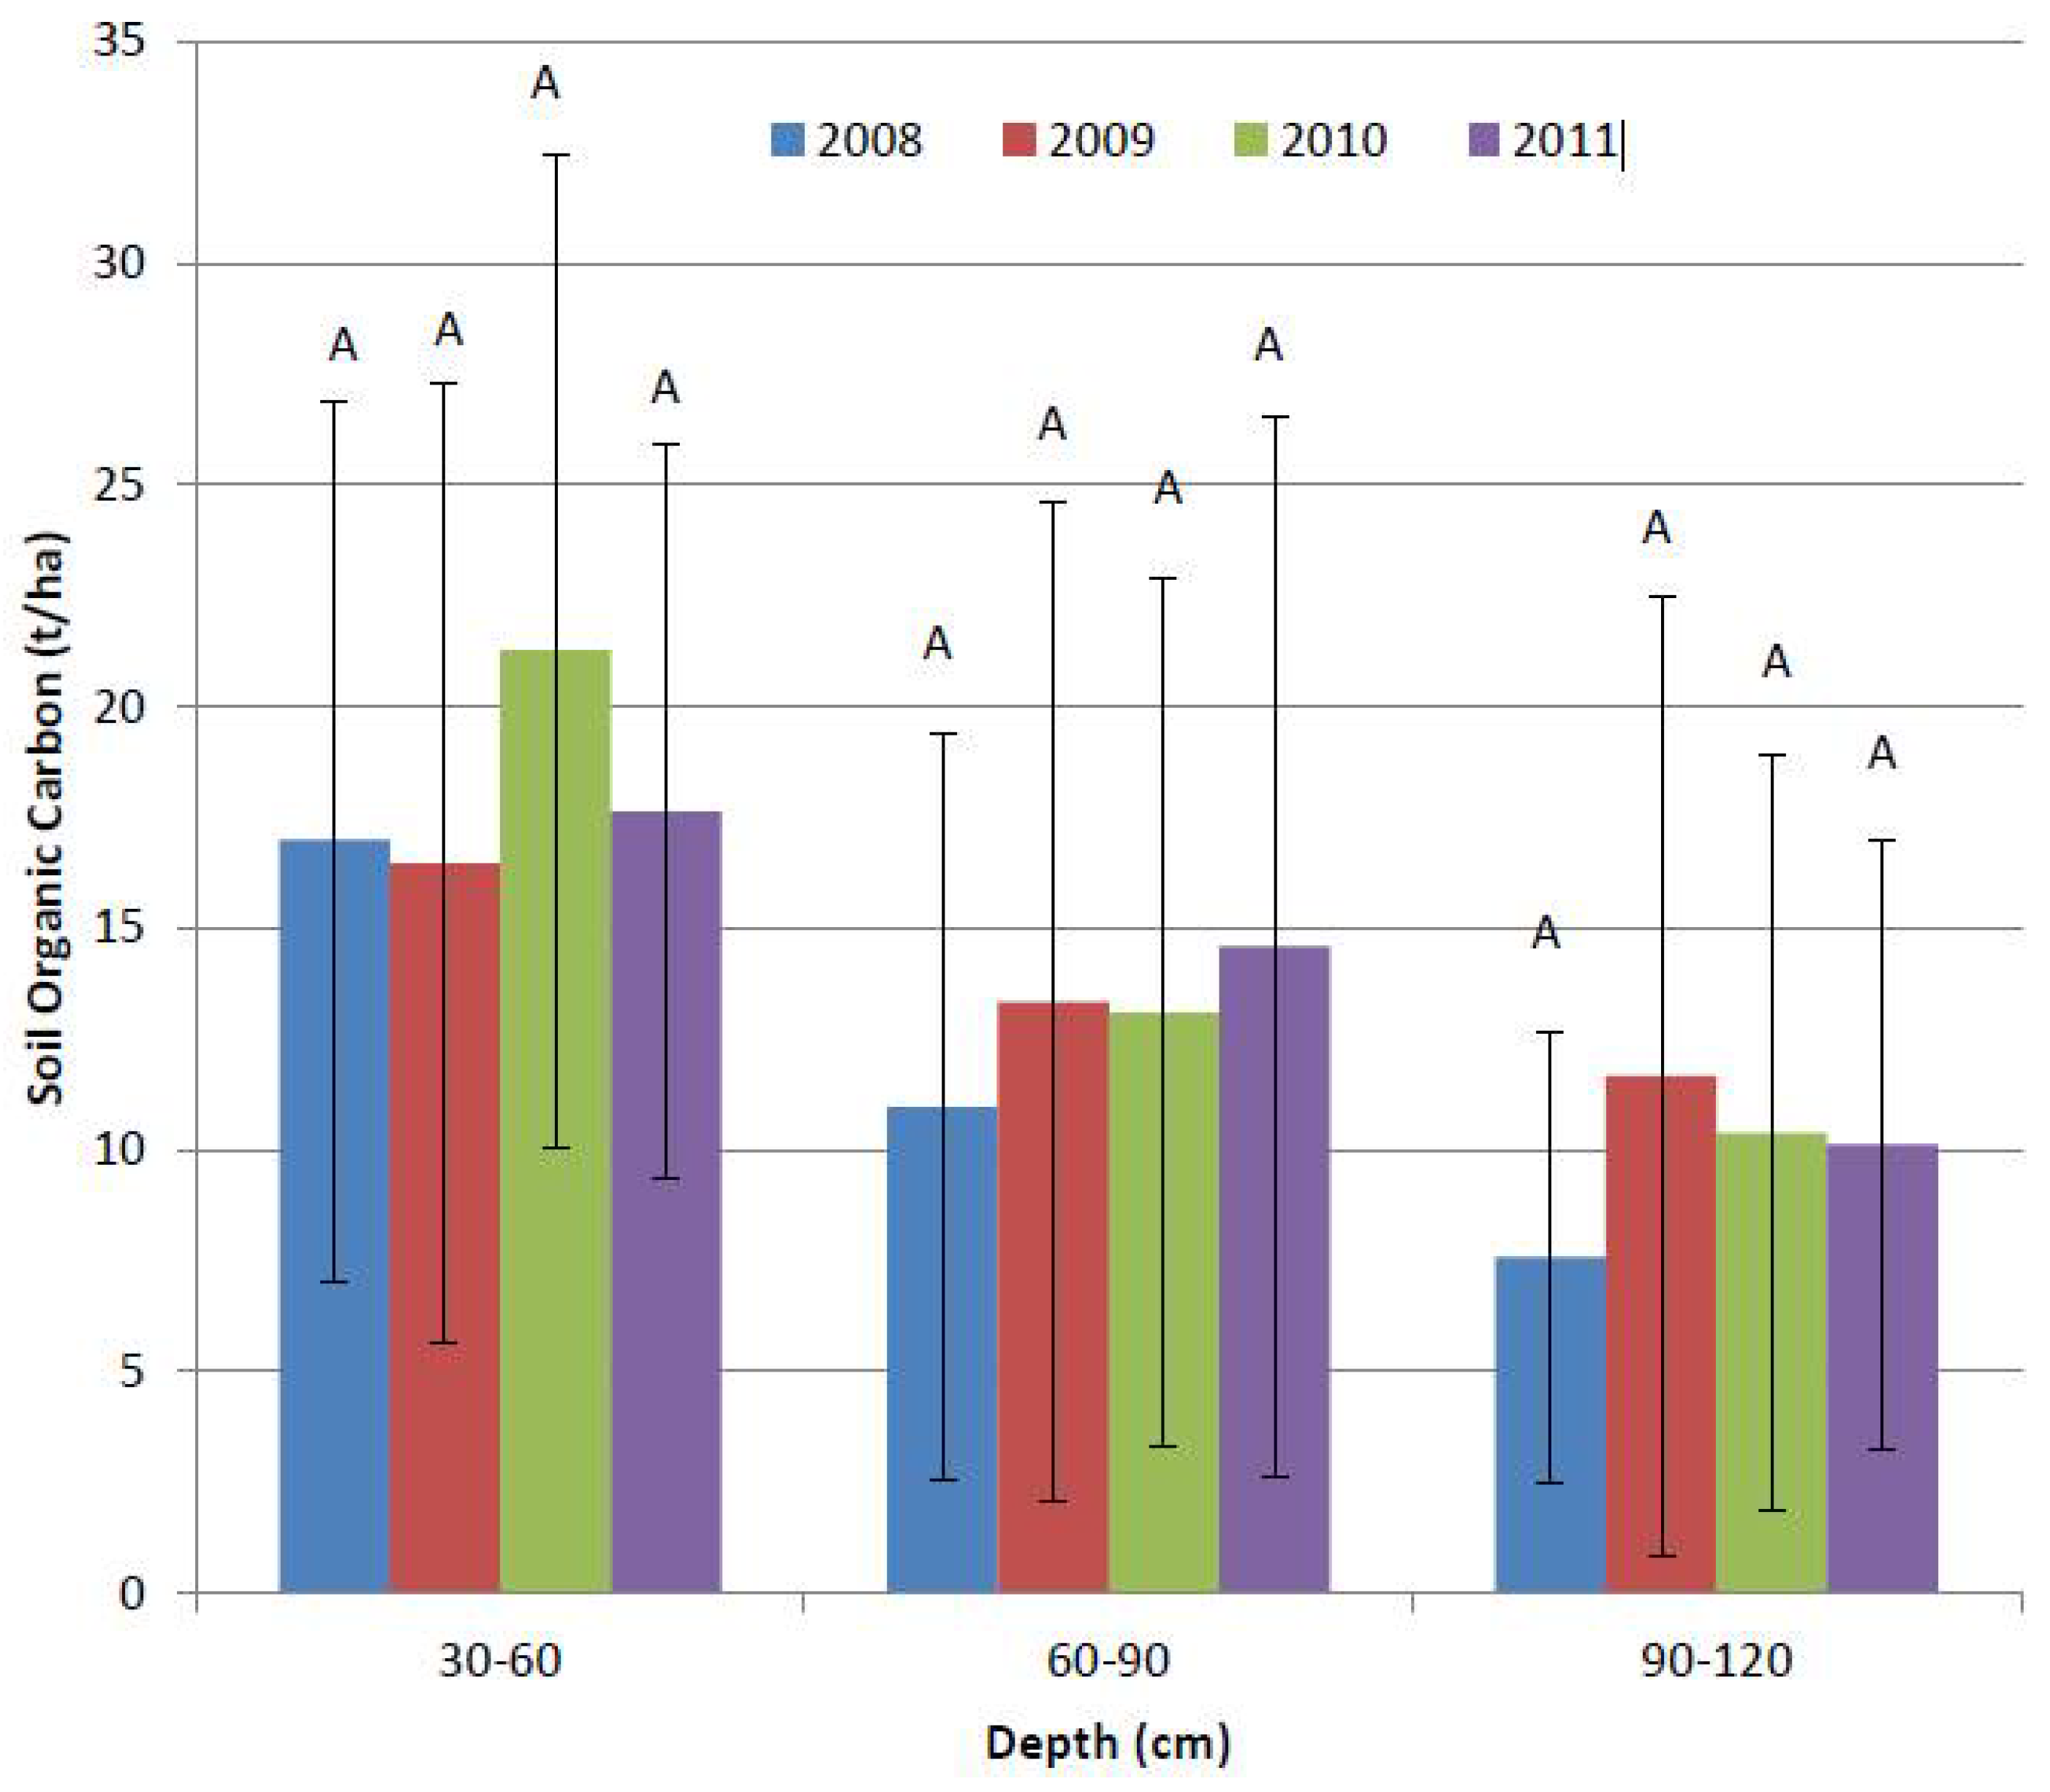
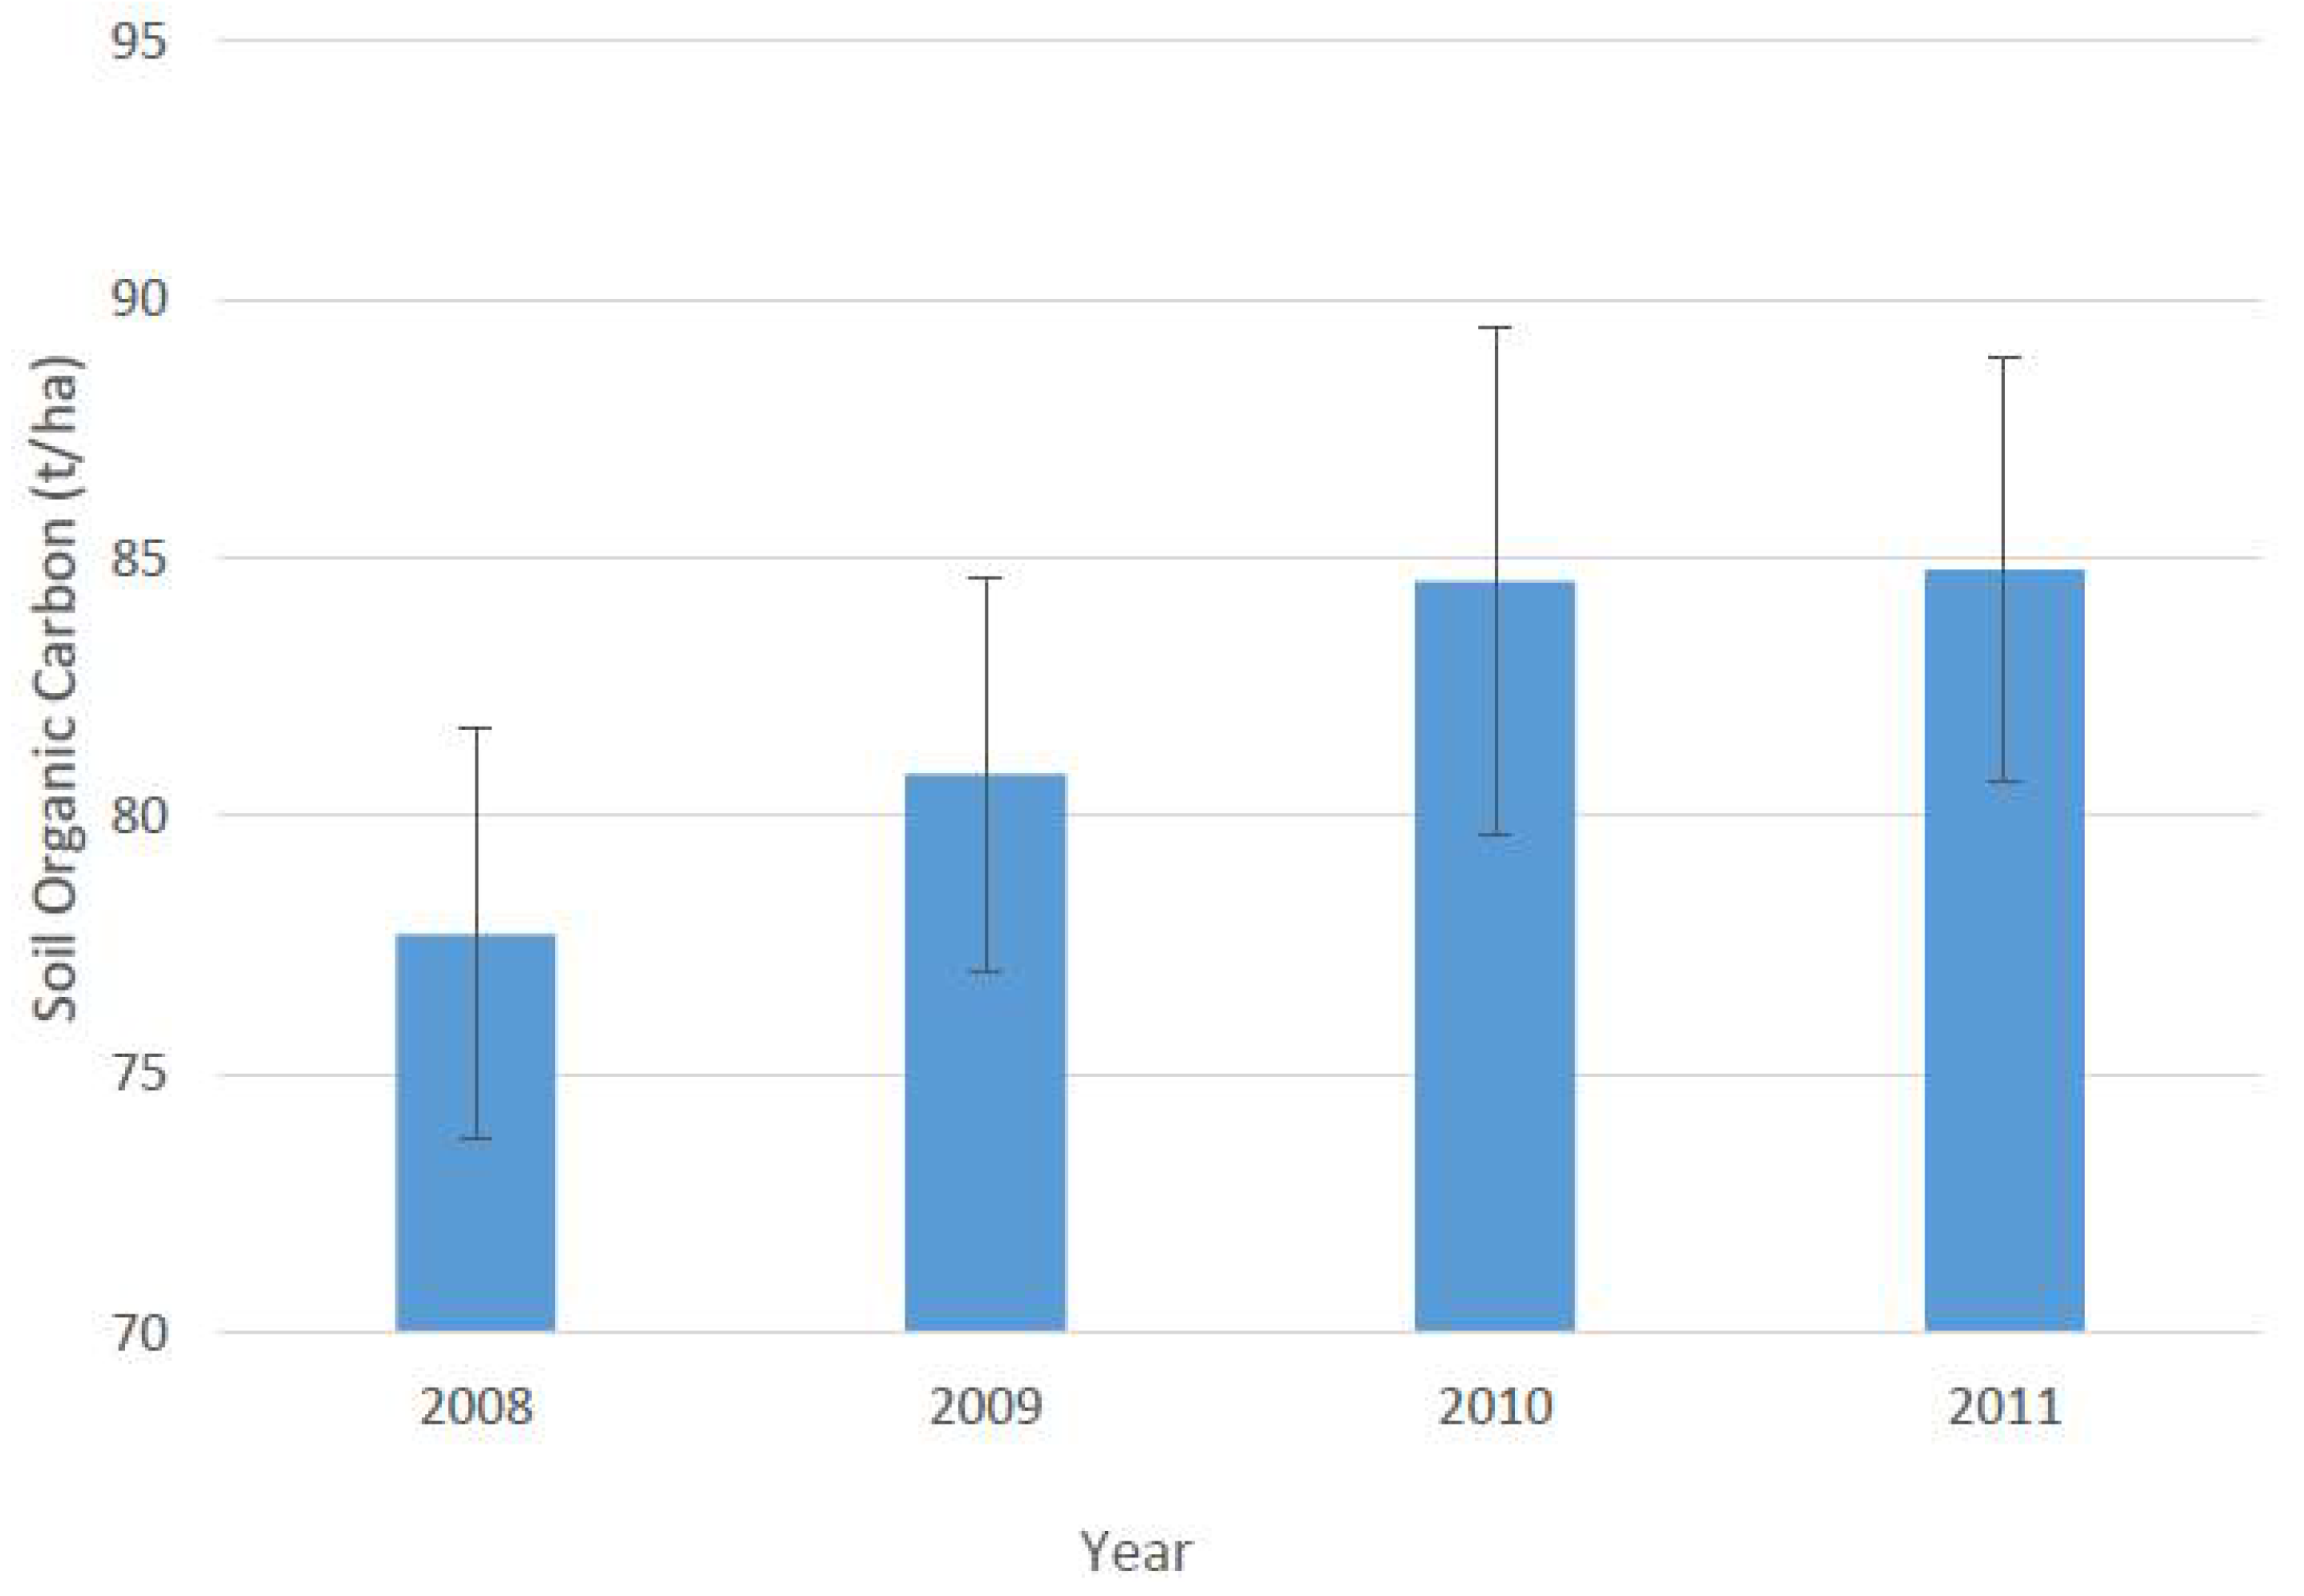
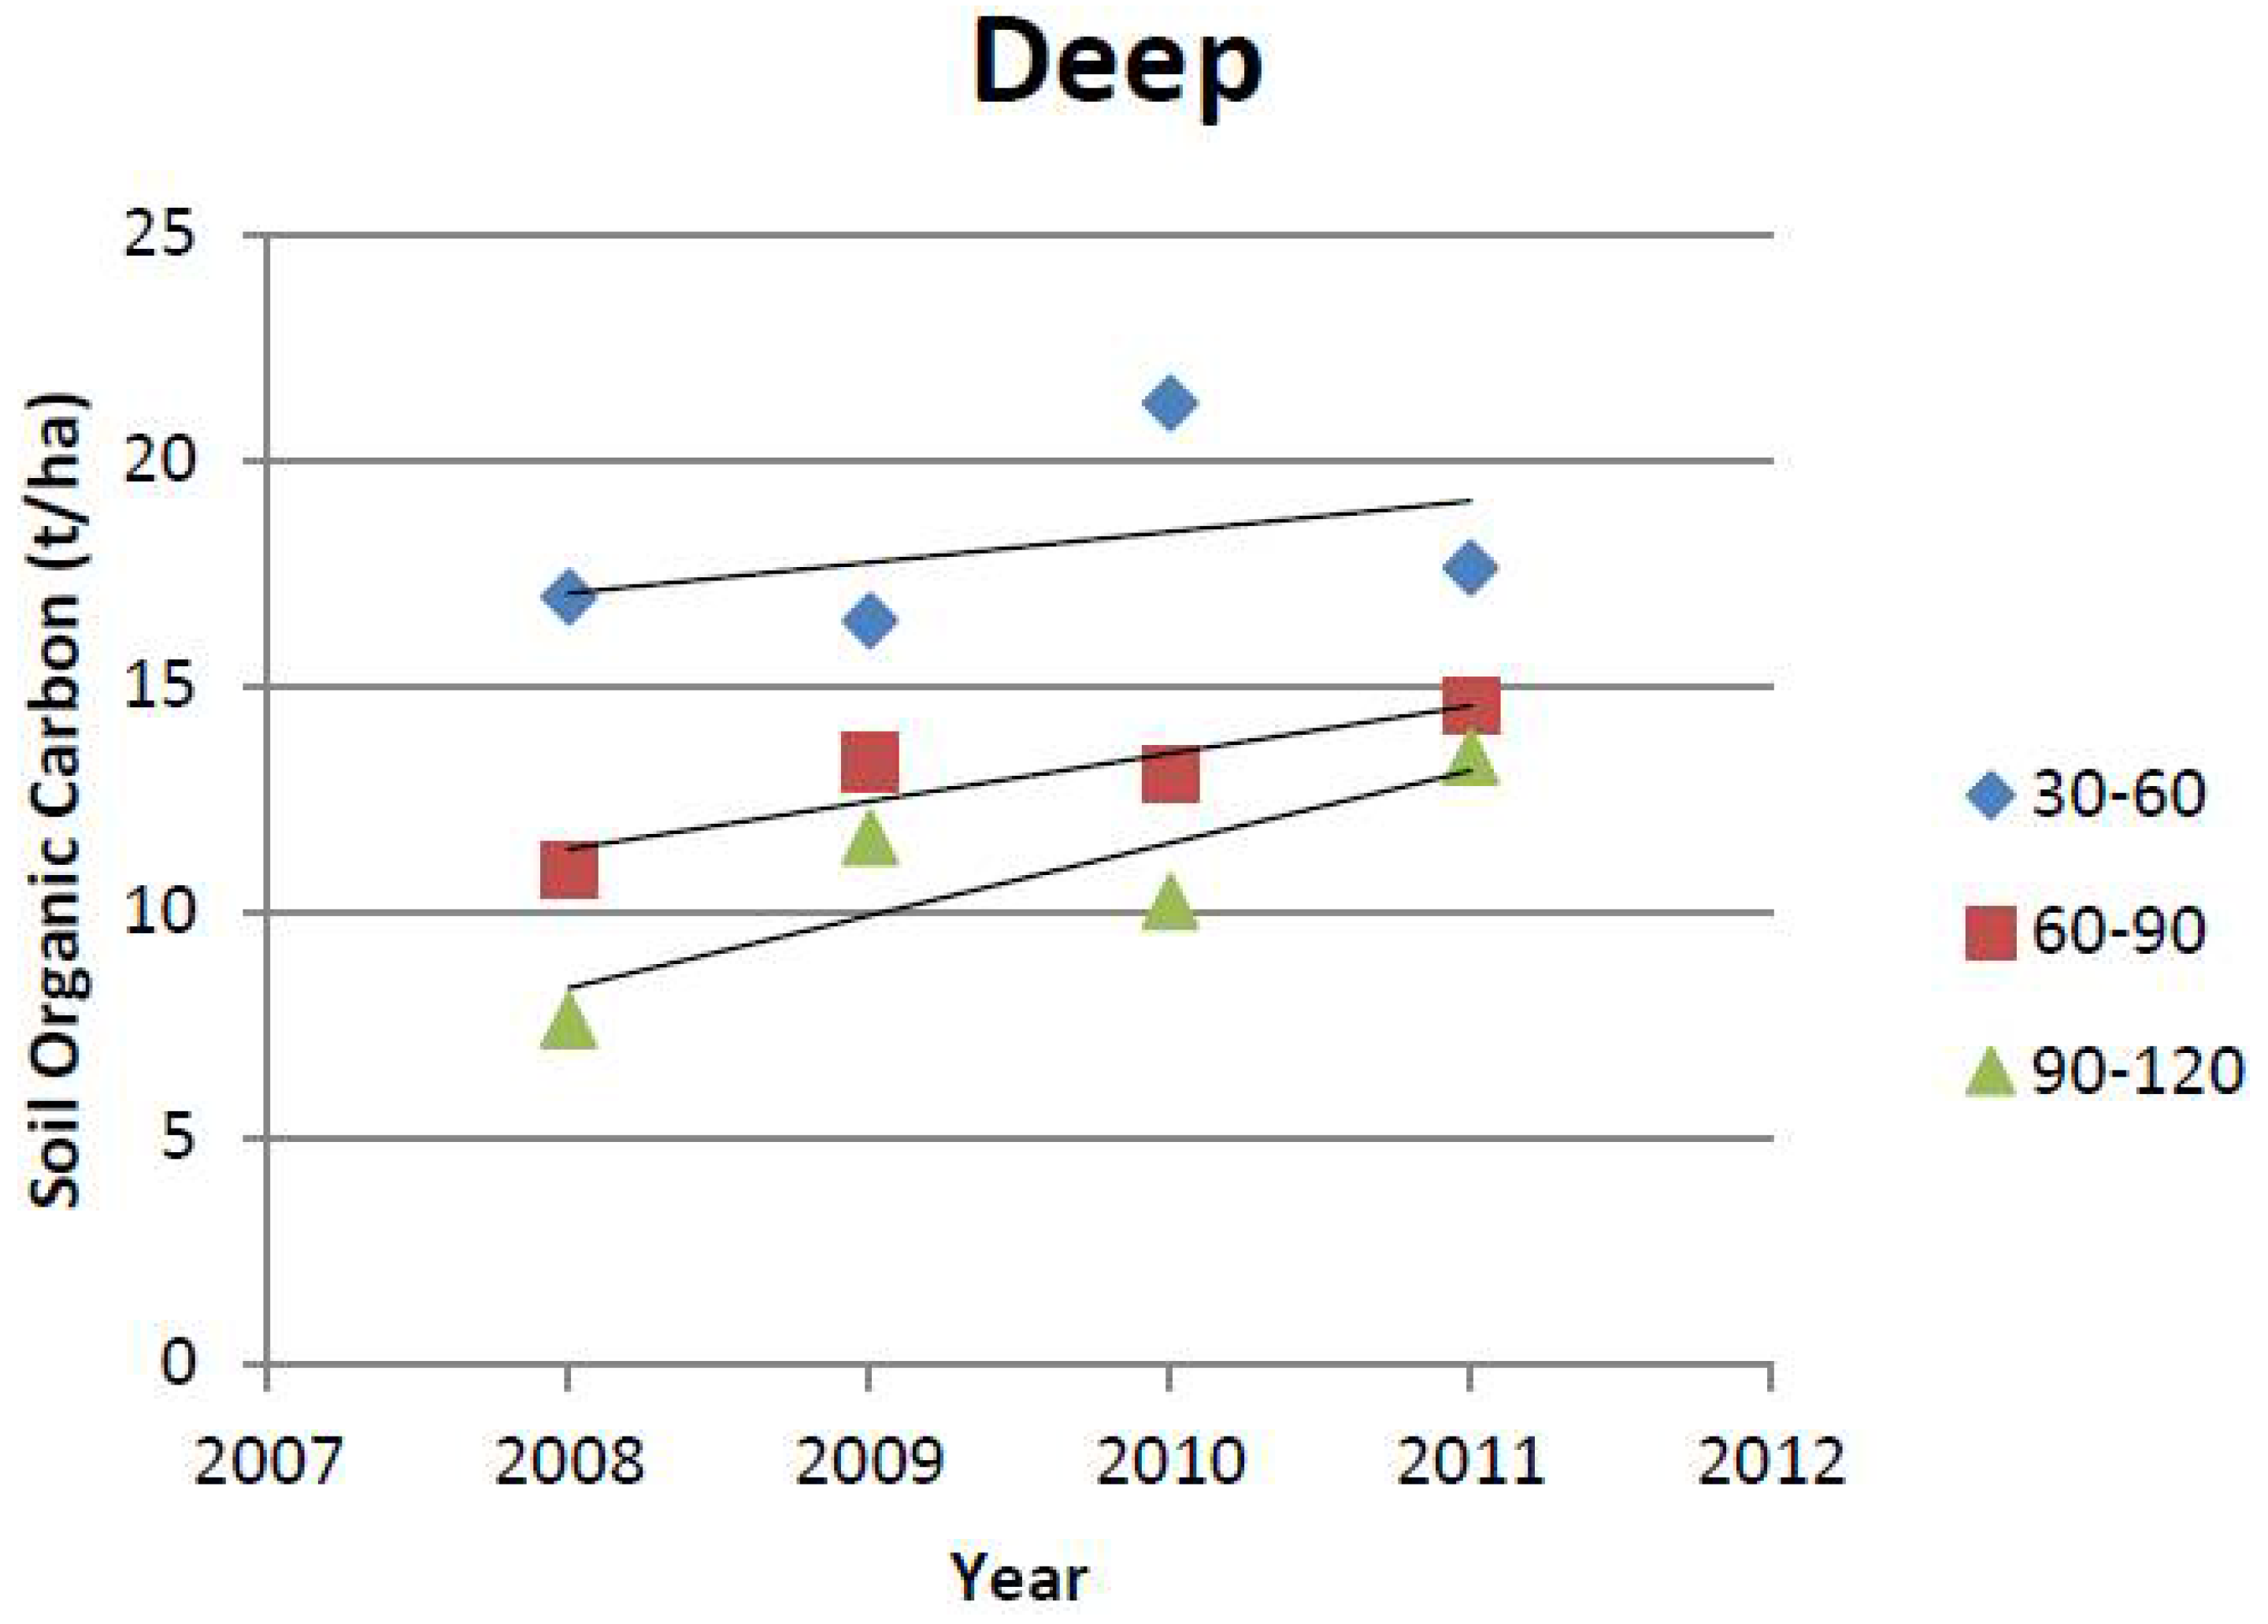
An interesting finding from the deep soil samples (Figure 4) shows that SOC levels at depths below 30 cm (30–60 cm, 60–90 cm, and 90–120 cm) all had higher carbon stocks present by 2011 than were present in the base year of 2008. The amounts sequestered in the 30–60, 60–90 cm and 90–120 cm depths were not significant at the 5% level. Analysis at the 10% level showed that 90-120 cm were different from the other two depths 30 to 60 and 60 to 90 cm. The carbon increases at these depths were not expected since several studies show that the highest carbon sequestration rates occur in the top 15 cm [11,13] or top 50 cm of the soil profile [31]. However, most of the experiments available in the literature do not sample to as deep a depth as performed in this analysis and never has an experiment of this size and scope been conducted to include so many farm types, sizes, landscapes, soil types, or previously grown crops. One study that did sample to a depth of 120 cm found a similar result [20]. Liebig et al. found increases in organic carbon compared to cropland in deeper depths; significant increases were found in the 30–60 cm and 60–90 cm depths [20]. The increase in soil carbon at deeper depths is reasonable since not much carbon was initially present in depths of that magnitude, but with switchgrass’s extensive root system more carbon is being placed into the deeper soil. It is not uncommon for switchgrass roots to reach a depth of 3 m and for the root biomass to exceed the aboveground biomass [5,9]. Carbon stored in deep soil is more permanent and is less likely to be released into the atmosphere through soil disturbances. This could be an important factor in helping to solve the problem of how to administer carbon credits to agricultural lands. Some of the problems faced are contract length and how to put monetary value on the carbon, because after the carbon sequestration contract has ended the land may be tilled or disturbed, thus gradually releasing the stored carbon in the top profile of the soil. With a crop such as switchgrass this may not be as big of an issue because a good portion of carbon is sequestered deep enough not be released through normal soil disturbances, such as tillage. It is important to note that total carbon levels have increased throughout the whole 120 cm soil profile (Figure 5) over the sampling period; however, not yet by a significant amount.
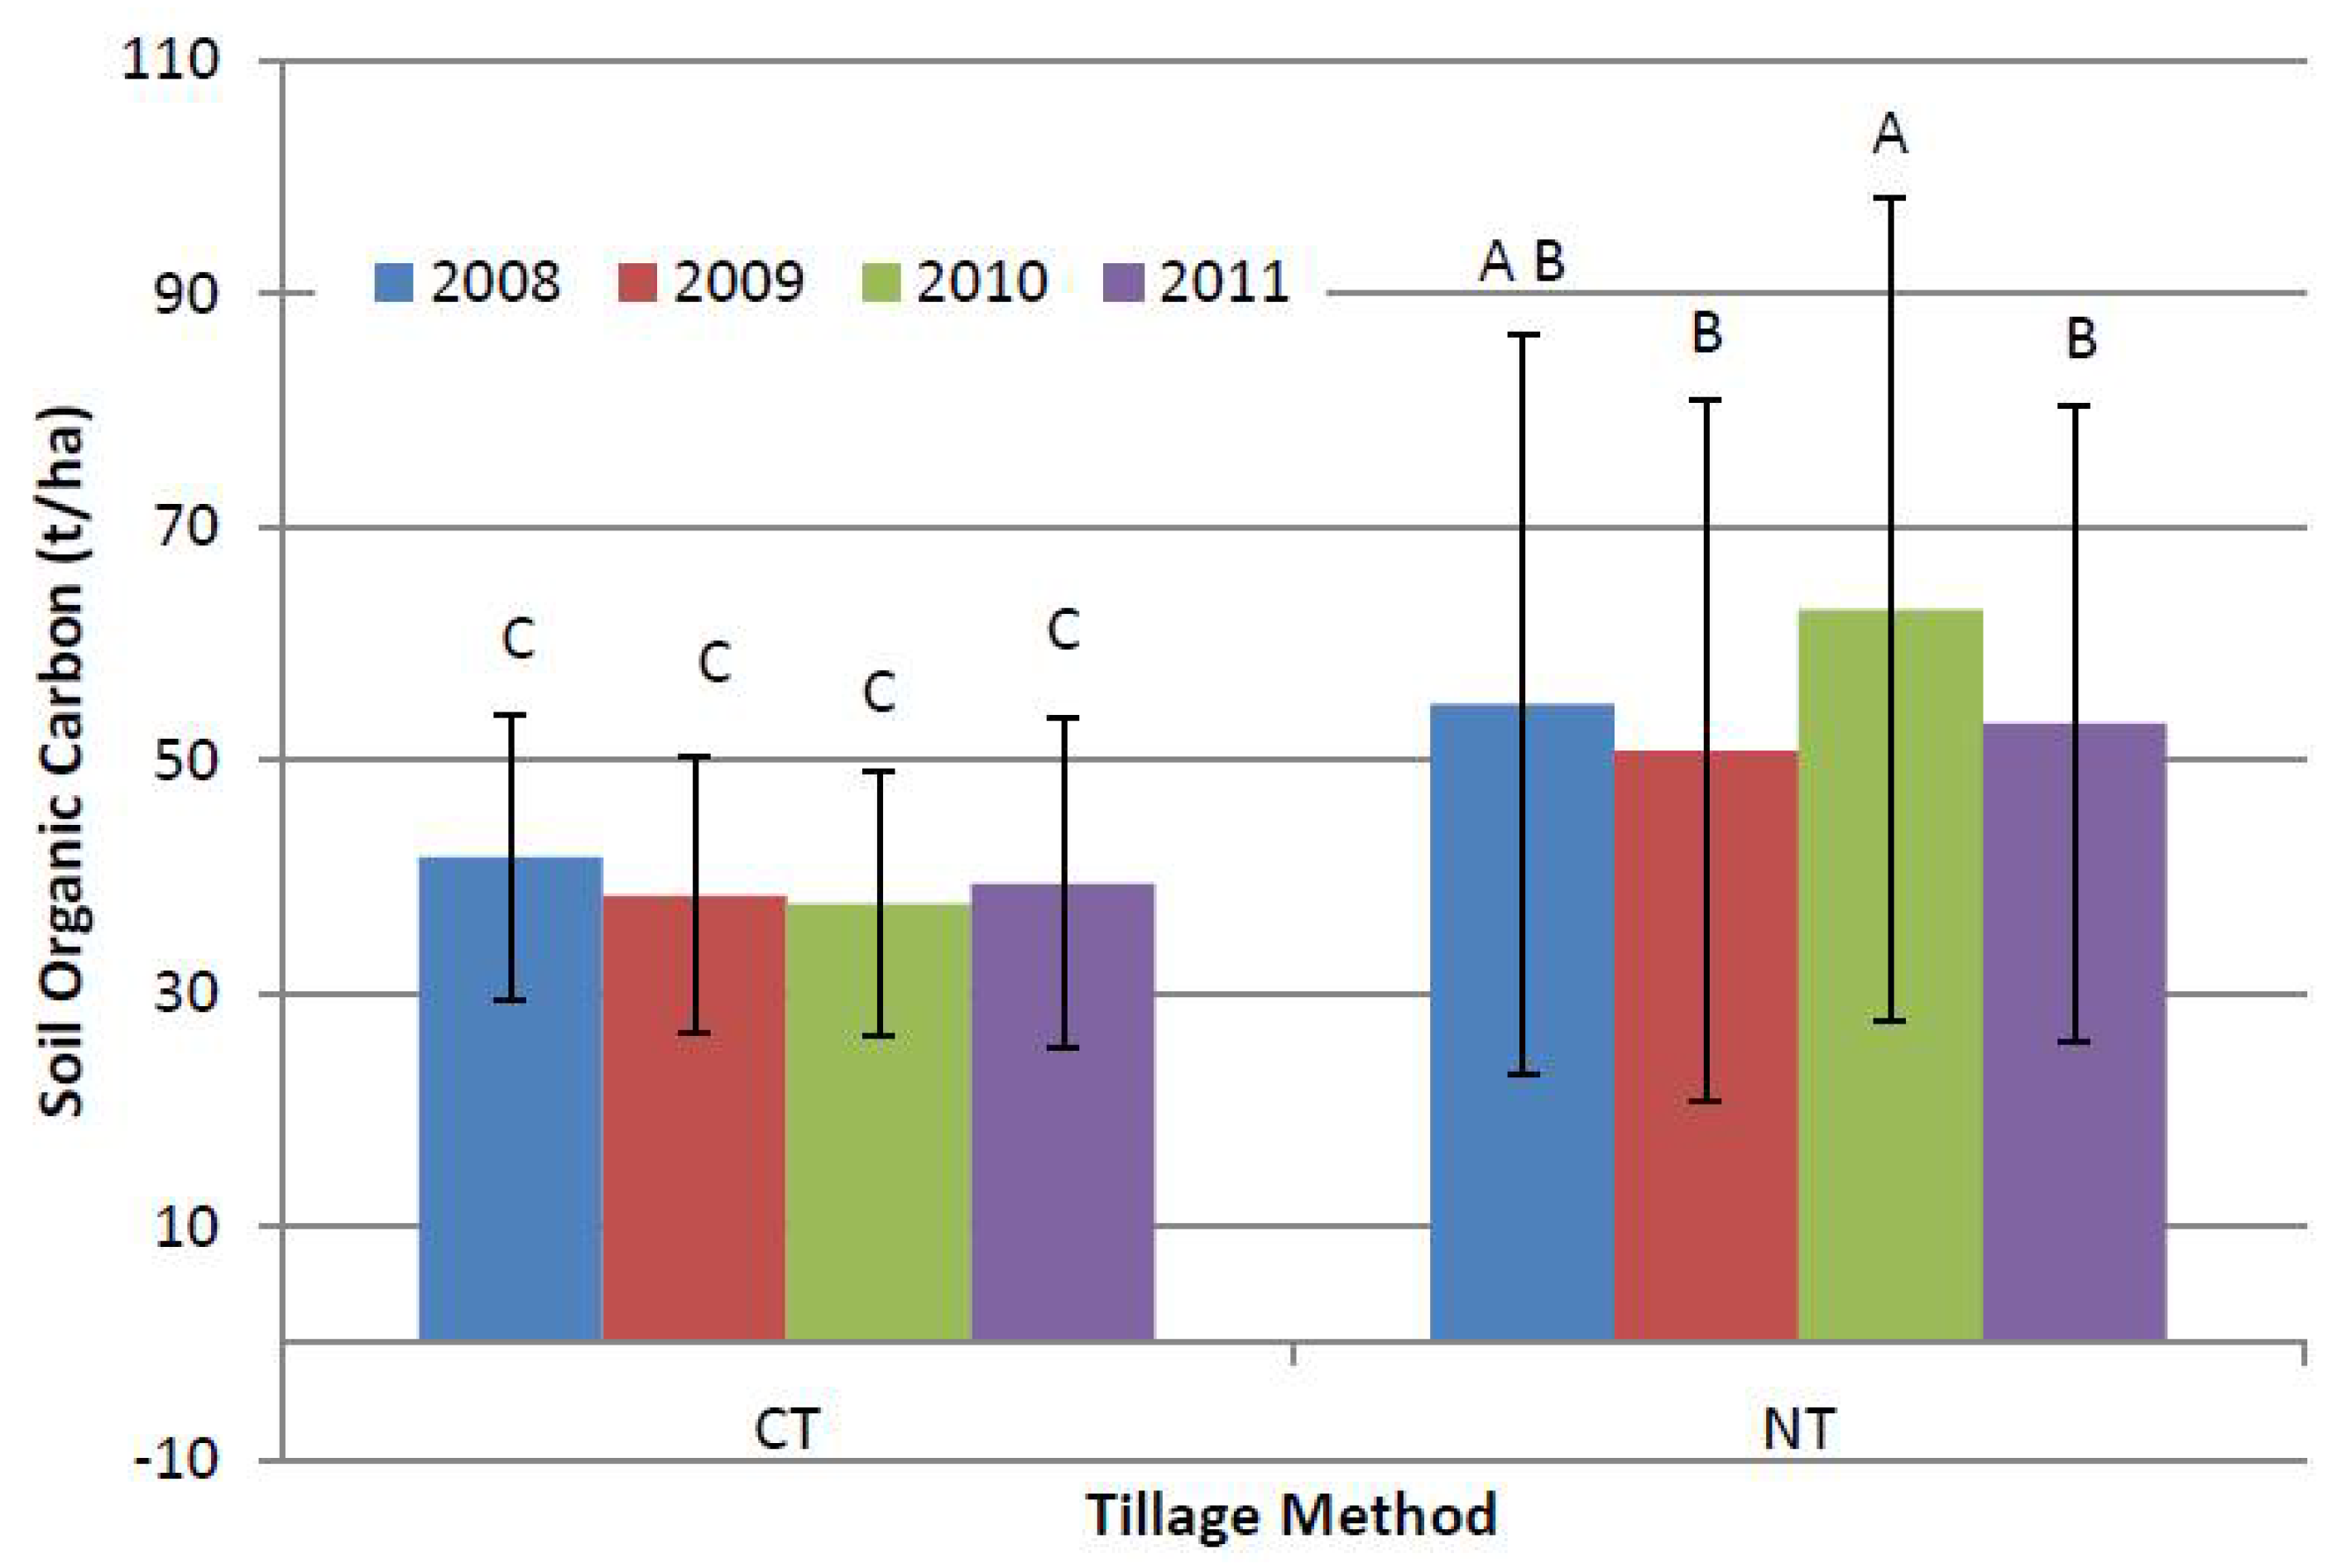
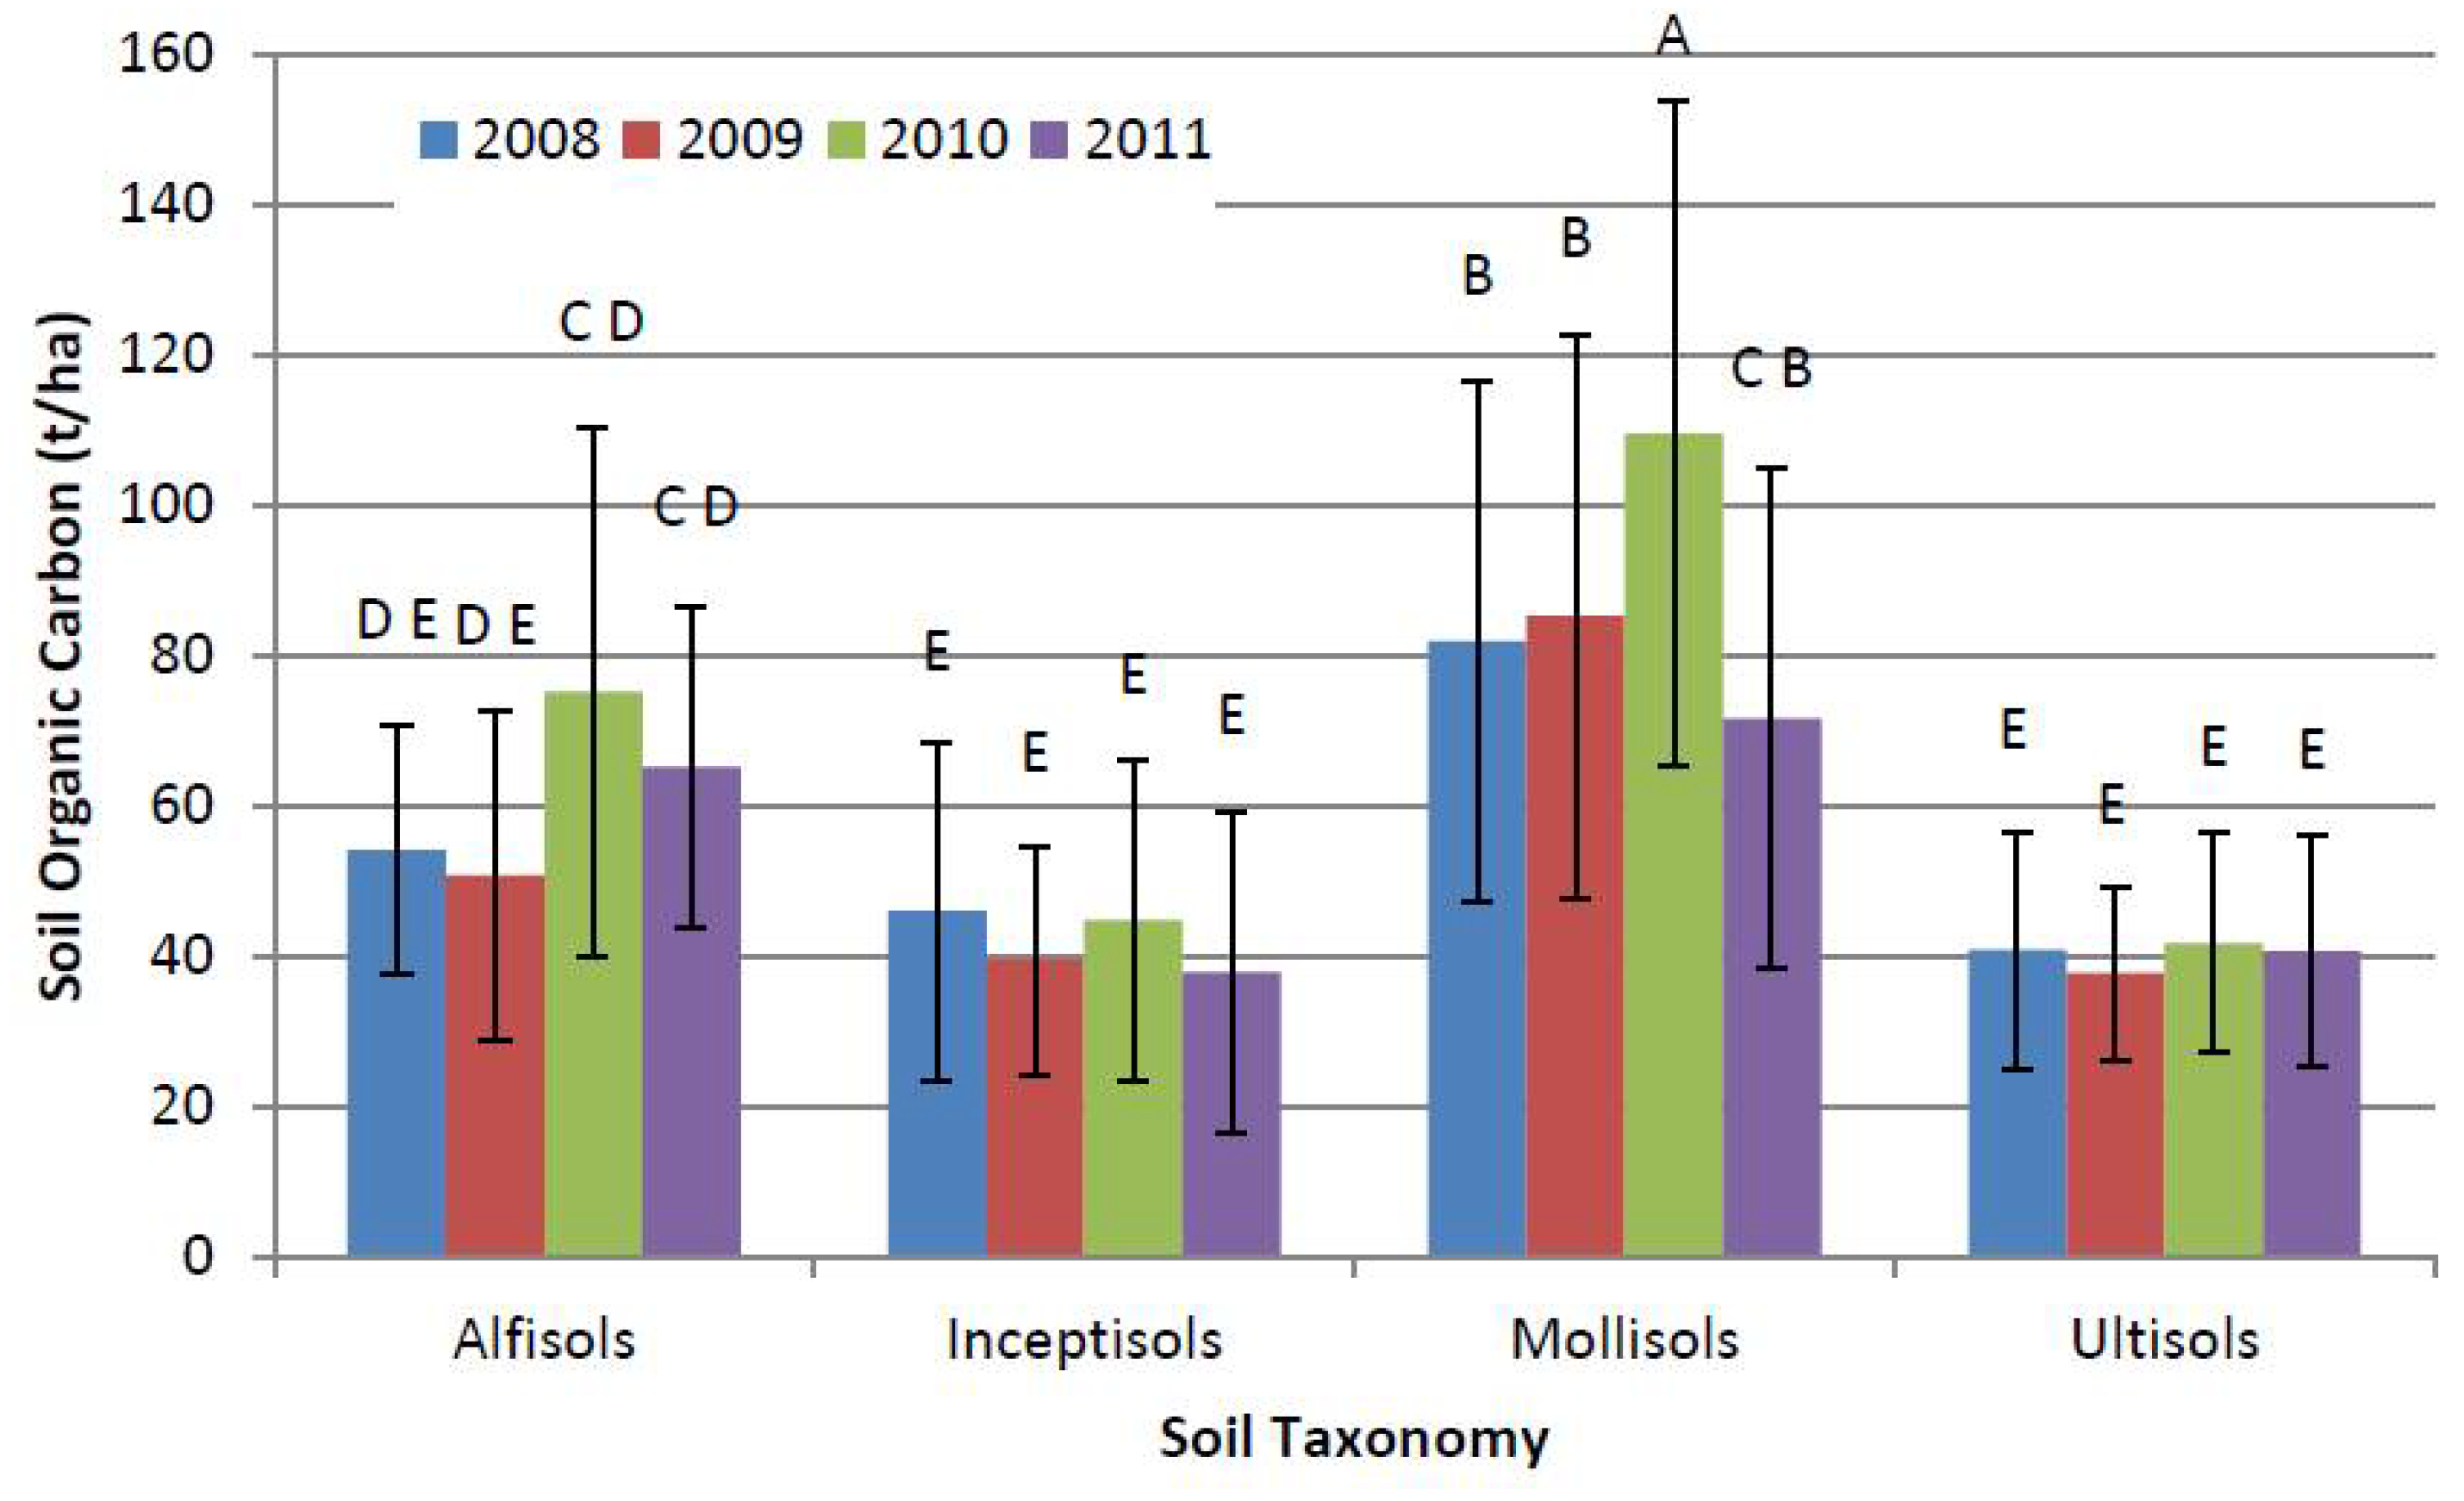
Figure 6, Figure 7 and Figure 8 show the annual levels of SOC from the perspectives of the tillage method used (no-tillage or conventional), previous crop (soybeans, green beans, or pasture) produced on the soil before the switchgrass was planted, and the soil taxonomic category (Mollisols, Alfisols, Inceptisols, or Utlisols). More carbon was present in the soils that had been planted with no-tillage when compared to conventional tillage, but as shown in Figure 6 neither had a significant increase in carbon. For both no-tillage and conventional tillage, the initial carbon levels were not statistically different from the final year of sampling. No-tillage did sequester a significant amount of SOC in 2010, but carbon levels decreased again in 2011. The reasons are unknown. Figure 7 shows the SOC levels present in the soil when separated by taxonomic categories. At the 0.05% level, beginning and ending SOC levels were not statistically different from each other for any of the taxonomic categories. The only exception being in 2010 under Mollisols, but carbon levels dropped back down in 2011. The location where this occurred was a field characterized as “poor 20 bushel soybean ground” [32]. This 2010 change in carbon for Mollisols may be an anomaly of the data.
At the 10% probability of error level, Alfisols was shown to have significantly sequester SOC by the fourth year when compared to the initial levels. This suggests that Alfisols may have an advantage in sequestering carbon during the initial growth stage of switchgrass compared to the other taxonomic categories used in this analysis. Overall, more carbon was present in Mollisols than any other taxonomic category.
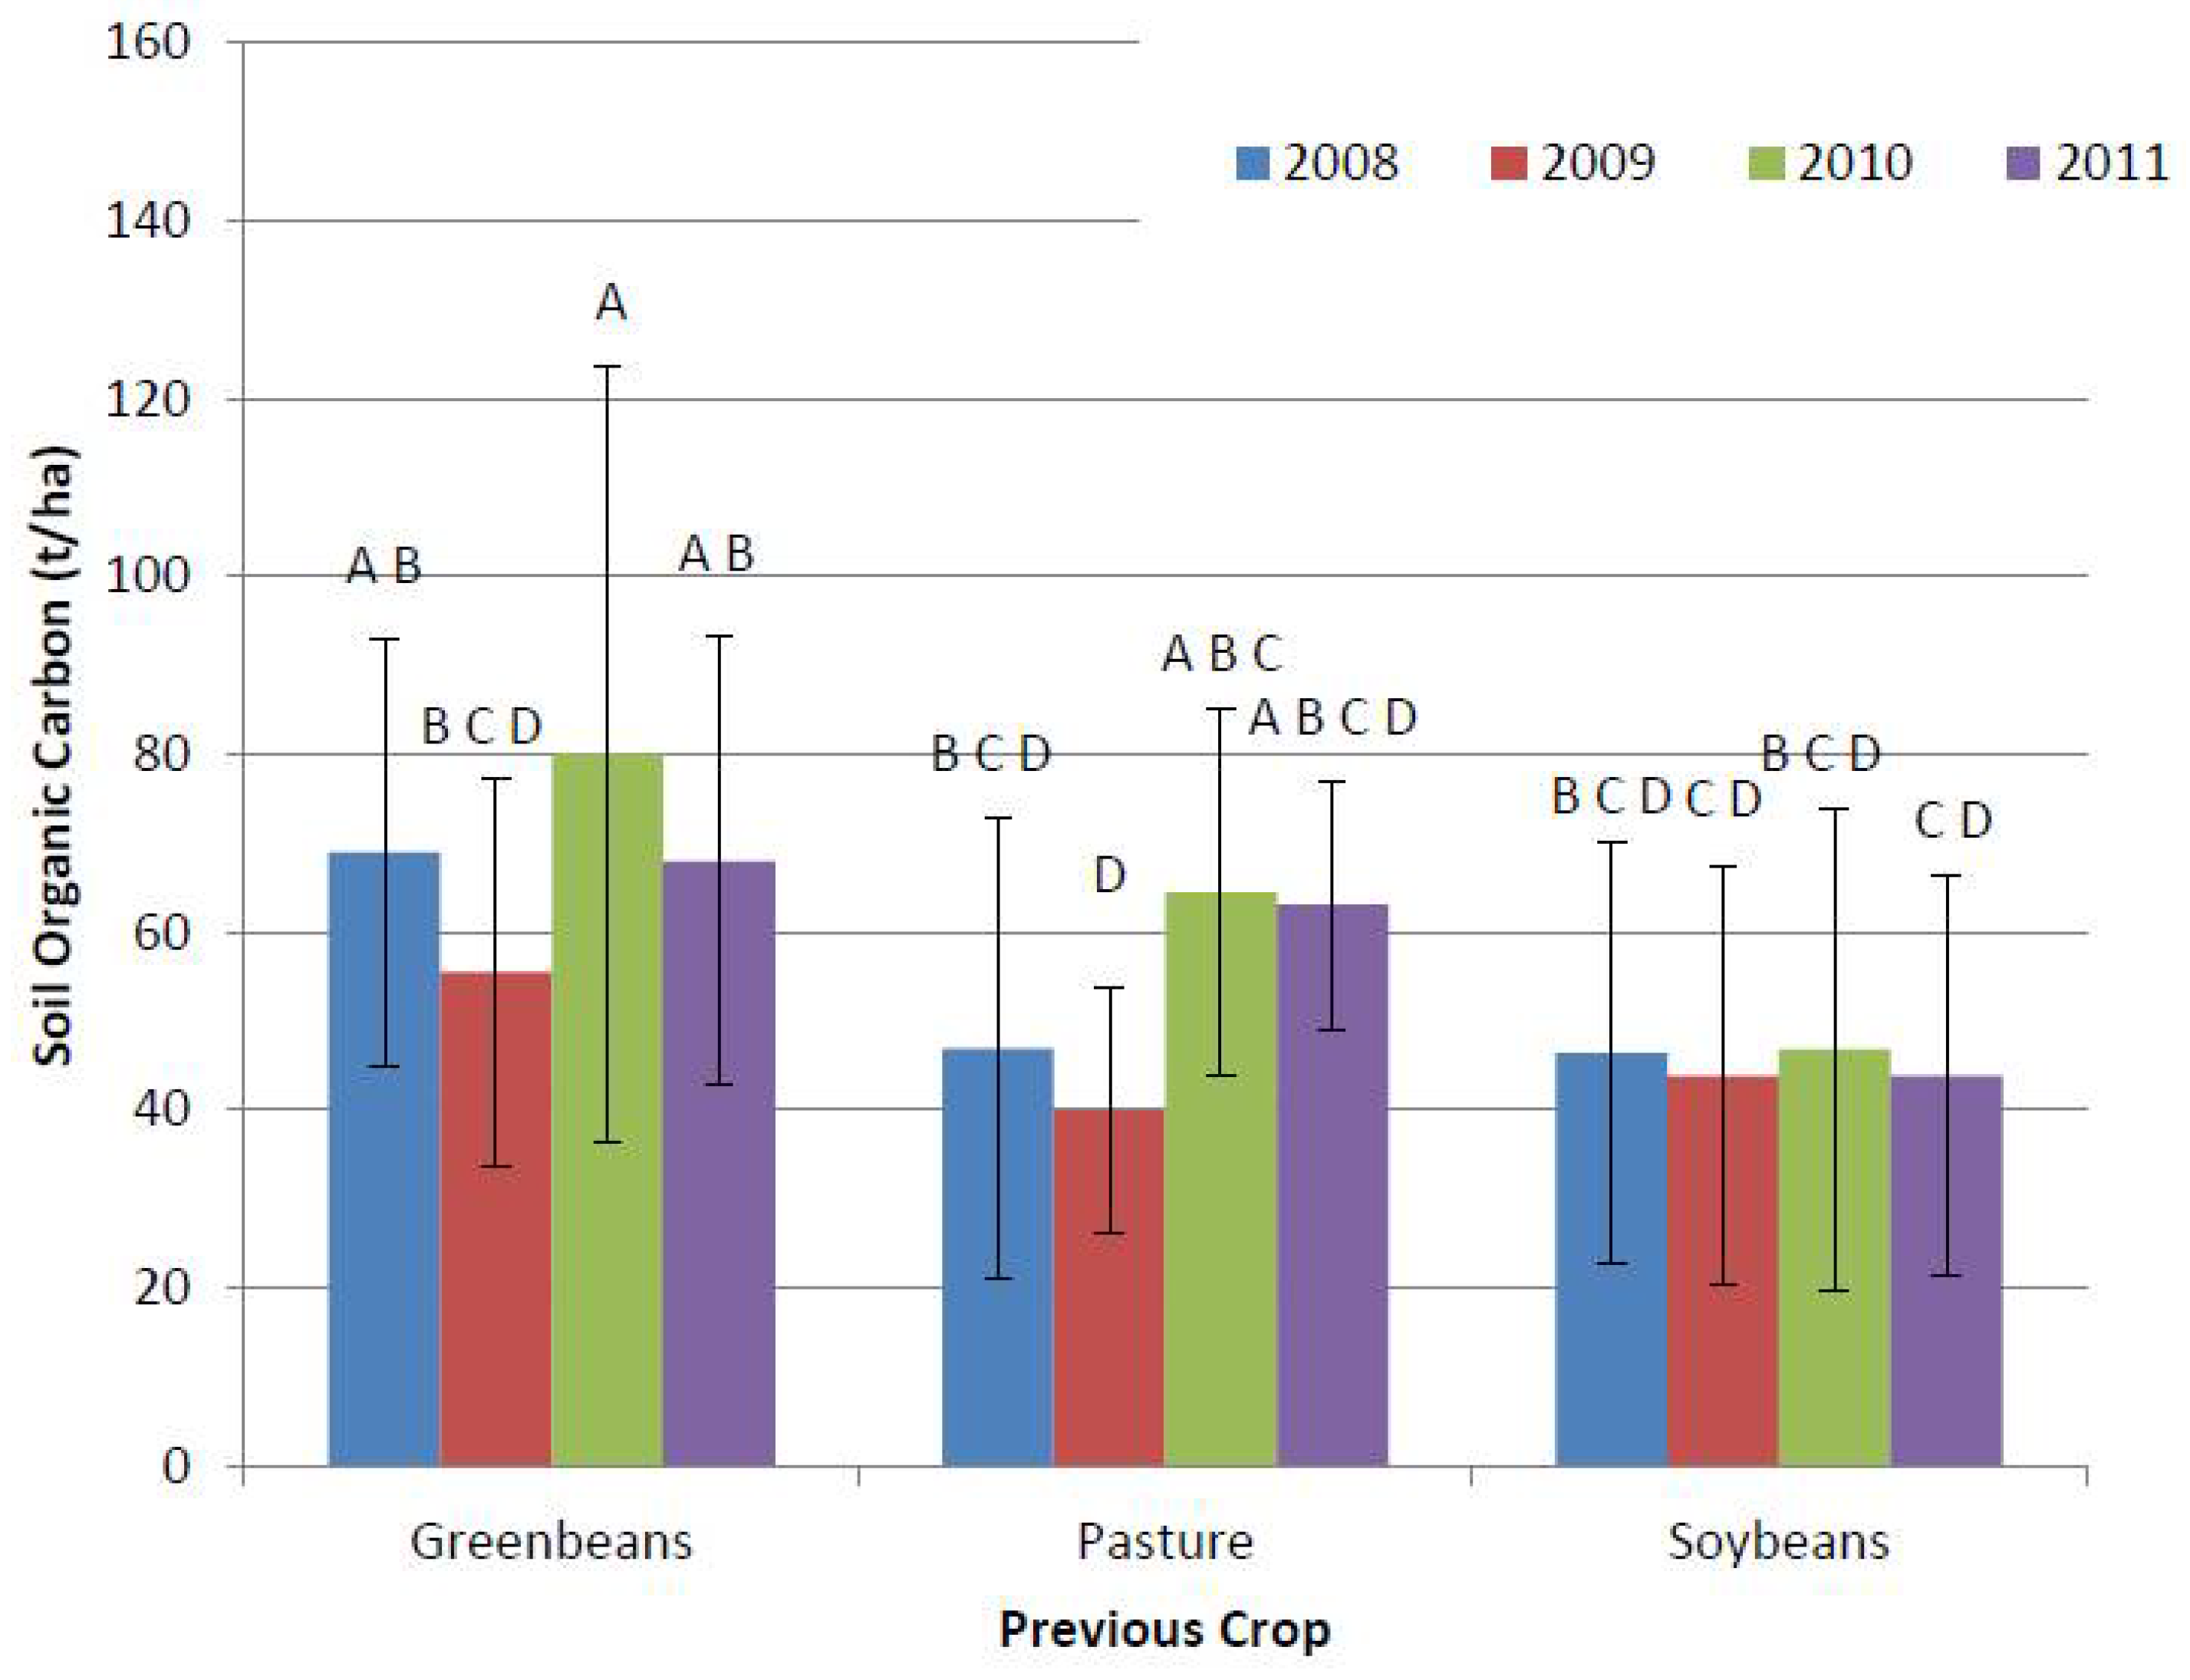
Previous crop history did not significantly impact the change in SOC when comparing the 2008, initial year, to 2011. Previous crops on fields included in the experiment were soybeans, green beans, and land previously in pasture. While the data indicates that the previous crop has no significant impact (see Figure 8), the number of observations for both green beans (8) and pasture (10) are small.
3.2. Regression Analysis
Changes in SOC stocks from the base 2008 levels to 2011 are evaluated using linear regression techniques to determine which factors were significant in affecting soil organic carbon levels. A positive (negative) coefficient for a variable indicates that the change in SOC levels were larger (smaller) than the change of SOC levels for the reference category. When using categorical dummy variables in regression analysis, one dummy variable from each category must be dropped. The reference for tillage method was no-tillage, the reference for previous crop was soybeans, and the reference for soil taxonomy was Alfisols. These references were chosen because they were the group in each category that had the most observations. Results from the regression will vary from the ANOVA analysis because of the reference chosen. In a regression, all comparisons are drawn from the references. In the discussion, one or more of the reference categories for the dummy variables (no-tillage, soybeans, Alfisols) may be implied for ease of exposition.
No significant changes in carbon were seen when comparing conventional tillage to no-tillage. The change in SOC levels from 2008 to 2011 for pasture were greater than the changes in SOC levels for soybeans. All things being equal, land previously in green beans also had a greater change in SOC amounts over the same 4-year period than did soybeans. As can be seen in Figure 8, pasture and green beans both had higher amounts of SOC present by 2011 than were present in 2008. Soybean was the only previous crop that had lower carbon levels by 2011 than in the base year of 2008. These results suggest that land previously used for soybean production may be less effective at sequestering carbon compared to land previously used for producing green beans or in pasture. In addition, all three taxonomic categories (Inceptisols, Mollisols, Utlisols) had significant changes between 2008 and 2011 compared to the reference category Alfisols. Inceptisols, Mollisols, and Utlisols all had significantly smaller changes in SOC from 2008 to 2011 than did Alfisols. Alfisols were the only taxonomic category to have significant increases in carbon by 2011. These results show that Alfisols may be more proficient at sequestering carbon than the other taxonomic categories used in this analysis. Inceptisols had an increase in carbon, but the increase was not significantly different from zero and Mollisols and Ultisols had diminished carbon levels by 2011 compared to 2008. Switchgrass yield was also significant in affecting changes in SOC. As biomass yields of switchgrass increased, SOC increased.
In examining change in carbon as a function of time, soils sampled in the 0–30 cm profile showed a slightly declining amount of SOC (Figure 9) throughout the years sampled. The decrease in SOC ranges from losing 0.04 t/ha of carbon per year for the 0–5 cm depths up to losing on average 0.47 t/ha of carbon per year for the 15–30 cm depths. However, as can be seen in Figure 10, there is a gradual increase in SOC for the 30–120 cm depths, with the highest accumulation rate coming at the 90–120 cm depth. The deeper the depth the more carbon that is being sequestered, with close to 2.5 times the rate of accumulation at the 90–120 cm depth than at 30–60 cm.
4. Conclusions
The goal of this study was to examine the soil carbon sequestration capabilities of switchgrass. This goal was accomplished by collecting soil samples annually from 2008 to 2011 from seven switchgrass farms located in East Tennessee. The main findings of the analysis show that after three growing seasons, switchgrass does sequester carbon though not a significant amount overall, with most of the carbon accumulation occurring in the deeper soil depths. Carbon levels are likely to increase significantly over time as root turnover occurs and the land stays untilled. This report also found that initial carbon sequestration rates are affected by depth, soil taxonomic category, previous grown crop, and biomass yield.
Switchgrass production is a promising biomass/biofuel crop that can help rid the United States of dependence on foreign oil and has the additional benefit of sequestering carbon. Farmers producing switchgrass will likely benefit financially from emerging carbon markets while at the same time reduce greenhouse gas (GHG) present in the atmosphere. Further research and soil sampling should be done to help track the accumulation of soil carbon stocks under switchgrass production and to further evaluate how it is affected by different factors, such as tillage method, yield, previous crop, and soil type. The soil samples used in this analysis have been archived and can be used in future studies. If the fields sampled remain in switchgrass production, periodic sampling of those same fields could provide valuable additional information.
Author Contributions
Burton C. English and Donald D. Tyler designed the research. Dustin K. Toliver, Jon C. Walton, R. Jamey Menard, and Jaehoon Lee collected and the data and sent samples out for chemical analysis. Burton C. English, Dustin K. Toliver, and R. Jamey Menard prepared the manuscript with contributions from all co-authors.
Acknowledgments
This research was supported by funding from the Southeastern Regional Sun Grant Center through a grant provided by the U.S. Department of Transportation, Office of the Secretary, Award No. DTO559-07-G-00050, Oak Ridge National Laboratory, and through the U.S. Department of Agriculture (USDA) under the Project titled Bioenergy Production and Carbon Sequestration, TN No. 2010-38419-20903. The research could not have been completed without the assistance of Dan Mooney, Mladen Grbovic, Chad Covert, Grant McCarty, Andrew Sherfy, and Leah Soro along with numerous other graduate students for collecting the soil samples. The manuscript is dedicated to the memory of Don Tyler, an agriculturalist, soil scientist, and University of Tennessee professor.
Data Availability
The data that support the findings of this study are available upon request from the corresponding author, Burton C. English. The data are not yet publicly available because they are being utilized in other current studies.
Conflicts of Interest
The authors declare no conflict of interest.
References
- Clark, C.M.; Lin, Y.; Bierwagen, B.G.; Eaton, L.M.; Langholtz, M.H.; Morefield, P.E.; Ridley, C.E.; Vimmerstedt, L.; Peterson, S.; Bush, B.W. Growing a Sustainable Biofuels Industry: Economics, Environmental Consideration, and the Role of the Conservation Reserve Program. Environ. Res. Lett. 2013, 8, 1–19. [Google Scholar] [CrossRef]
- United States Environmental Protection Agency, Renewable Fuel Standard (RFS). Available online: http://www.epa.gov/otaq/fuels/renewablefuels/index.htm (accessed on 28 April 2014).
- Jensen, K.; Clark, C.D.; Ellis, P.; English, B.C.; Menard, R.J.; Walsh, M.; de la Torre Ugarte, D. Farmer’s Willingness to Grow Switchgrass for Energy Production. Biomass Bioenergy 2007, 31, 773–781. [Google Scholar] [CrossRef]
- Bransby, D. Switchgrass Profile. Available online: http://bioenergy.ornl.gov/papers/misc/switchgrass-profile.html (accessed on 10 September 2010).
- McLaughlin, S.; Bouton, J.; Bransby, D.; Conger, B.; Ocumpaugh, W.; Parrish, D.; Taliaferro, C.; Vogel, K.; Wullschleger, S. Developing Switchgrass as a Bioenergy Crop. In Perspective on New Crops and New Uses; Janick, J., Ed.; ASHS Press: Alexandria, VA, USA, 1999. [Google Scholar]
- Mooney, D.F.; Roberts, R.K.; English, B.C.; Tyler, D.D.; Larson, J.A. Yield and Breakeven Price of ‘Alamo’ Switchgrass for Biofuels in Tennessee. Agron. J. 2009, 101, 1234–1242. [Google Scholar] [CrossRef]
- Lemus, R.; Brummer, E.C.; Moore, K.J.; Molstad, N.E.; Burras, C.L.; Barker, M.F. Biomass Yield and Quality of 20 Switchgrass Populations in Southern Iowa, USA. Biomass Bioenergy 2002, 23, 433–442. [Google Scholar] [CrossRef]
- Shahandeh, H.; Chou, C.Y.; Hons, F.M.; Hussey, M.A. Nutrient Partitioning, Carbon and Nitrogen Mineralization of Switchgrass Plant Parts. Commun. Soil Sci. Plant Anal. 2011, 42, 599–615. [Google Scholar] [CrossRef]
- Garten, C.T., Jr.; Smith, J.L.; Tyler, D.D.; Amonette, J.E.; Bailey, V.L.; Brice, D.J.; Castro, H.F.; Graham, R.L.; Gunderson, C.A.; Izaurraide, R.C.; et al. Intra-Annual Changes in Biomass, Carbon, and Nitrogen Dynamics at 4-Year Old Switchgrass Field Trials in West Tennessee, USA. Agric. Ecosyst. Environ. 2010, 136, 177–184. [Google Scholar] [CrossRef]
- Bransby, D.I.; McLaughlin, S.B.; Parrish, D.J. A Review of Carbon and Nitrogen Balances in Switchgrass Grown for Energy. Biomass Bioenergy 1998, 14, 379–384. [Google Scholar] [CrossRef]
- Al-Kaisi, M.M.; Yin, X.; Licht, M. Soil Carbon and Nitrogen Changes as Influenced by Tillage and Cropping Systems in some Iowa Soils. Agric. Ecosyst. Environ. 2005, 105, 635–647. [Google Scholar] [CrossRef]
- Lee, D.K.; Owens, V.N.; Doolittle, J.J. Switchgrass and Soil Carbon Sequestration Response to Ammonium Nitrate, Manure, and Harvest Frequency on Conservation Reserve Program Land. Agron. J. 2007, 99, 462–468. [Google Scholar] [CrossRef]
- Ma, Z.; Wood, C.W.; Bransby, D.I. Soil Management Impacts on Soil Carbon Sequestration by Switchgrass. Biomass Bioenergy 2000, 18, 469–477. [Google Scholar] [CrossRef]
- Anderson-Teixeira, K.J.; Davis, S.C.; Masters, M.M.; Delucia, E.H. Changes in Soil Organic Carbon under Biofuel Crops. GCB Bioenergy 2009, 1, 75–96. [Google Scholar] [CrossRef]
- Zan, C.S.; Fyles, J.W.; Girouard, P.; Samson, R.A. Carbon Sequestration in Perennial Bioenergy, Annual Corn and Uncultivated Systems in Southern Quebec. Agric. Ecosyst. Environ. 2001, 86, 135–144. [Google Scholar] [CrossRef]
- Epstein, H.E.; Laurenroth, W.K.; Burke, I.C. Effects of Temperature and Soil Texture on ANPP in the US Great Plains. Ecology 1997, 78, 2628–2631. [Google Scholar] [CrossRef]
- Jobbagy, E.G.; Jackson, R.B. Global Controls of Forest Line Elevation in the Northern and Southern Hemispheres. Glob. Ecol. Biogeol. 2000, 9, 253–268. [Google Scholar] [CrossRef]
- Sorenson, L.H. Carbon-Nitrogen Relationships during the Humification of Cellulose in Soils Containing Different Amounts of Clay. Soil Biol. Biochem. 1981, 13, 313–321. [Google Scholar] [CrossRef]
- Jung, J.Y.; Lal, R. Impacts of Nitrogen Fertilization on Biomass Production of Switchgrass and Changes in Soil Organic Carbon in Ohio. Geoderma 2011, 166, 145–152. [Google Scholar] [CrossRef]
- Liebig, M.A.; Johnson, H.A.; Hanson, J.D.; Frank, A.B. Soil Carbon under Switchgrass Stands and Cultivated Cropland. Biomass Bioenergy 2005, 28, 347–354. [Google Scholar] [CrossRef]
- United States Department of Agriculture, Natural Resource Conservation Service. Soil Survey Geographic Database (SSURGO). Available online: http://www.nrcs.usda.gov/wps/portal/nrcs/detail/soils/survey/?cid=nrcs142p2_053627 (accessed on 10 February 2012).
- Microsoft Visual Basic. Available online: http://msdn.microsoft.com/en-us/vbasic/default.aspx (accessed on 4 September 2010).
- ESRI, ArcGIS. Available online: http://www.esri.com (accessed on 4 September 2010).
- Mallarino, A.P.; Wittry, D.J. Efficacy of Grid and Zone Soil Sampling Approaches for Site-Specific Assessment of Phosphorus, Potassium, pH, and Organic Matter. Precis. Agric. 2004, 5, 131–144. [Google Scholar] [CrossRef]
- Dane, J.H.; Topp, G.C.; Campbell, G.S. Methods of Soil Analysis: Part 4—Physical Methods; Soil Science Society of America, Inc.: Madison, WI, USA, 2002. [Google Scholar]
- Sparks, D.L. Methods of Soil Analysis, Part 3—Chemical Methods; American Society of Agronomy, Soil Science Society of America: Madison, WI, USA, 1996. [Google Scholar]
- SAS Institute Inc. SAS 9.1.3 Help and Documentation; SAS Institute: Cary, NC, USA, 2004. [Google Scholar]
- Littell, R.C.; Miliken, G.A.; Stroup, W.W.; Wolfinger, R.D.; Schabenberger, O. SAS for Mixed Models, 2nd ed.; SAS Institute: Cary, NC, USA, 2006. [Google Scholar]
- Searchinger, T.; Heimlich, R.H.; Houghton, R.A.; Dong, F.X.; Elobeid, A.; Fabiosa, J.; Tokgoz, S.; Hayes, D.; Yu, T.H. Use of U.S. Croplands for Biofuels Increases Greenhouse Gases through Emissions from Land-Use Change. Science 2008, 319, 1238–1240. [Google Scholar] [CrossRef] [PubMed]
- Dahlman, R.C.; Kucera, C.L. Root Productivity and Turnover in Native Prairie. Ecology 1965, 46, 84–89. [Google Scholar] [CrossRef]
- Conant, R.T.; Paustian, K.; Elliott, E.T. Grassland Management and Conversion into Grassland: Effects on Soil Carbon. Ecol. Soc. Am. J. 2013, 1, 343–355. [Google Scholar]
- Hamilton, K.; Stokley Farms, Tellico Plains, TN, USA. Personal communication, 2011.
Figure 1.
Following the development of a sinkhole in a switchgrass field, the shovel, which is four feet long and has its handle placed at ground level, indicates an additional five feet of switchgrass root exposed. The root is the diameter of your little finger and is growing deeper into the soil (photo courtesy of Ken Goddard, Retired University of Tennessee Extension Specialist).

Figure 2.
Map of East Tennessee counties where the switchgrass farms were located that were used in this analysis and their county-specific soil taxonomic category makeup [22].
Figure 2.
Map of East Tennessee counties where the switchgrass farms were located that were used in this analysis and their county-specific soil taxonomic category makeup [22].

Figure 3.
Annual soil organic carbon amounts for the 0–5, 5–10, 10–15, and 15–30 cm depths between the East Tennessee farms used in this study. Different letters within a depth range are significantly (p = 0.05) different from each other. Error bars are 1 standard deviation from the mean.
Figure 3.
Annual soil organic carbon amounts for the 0–5, 5–10, 10–15, and 15–30 cm depths between the East Tennessee farms used in this study. Different letters within a depth range are significantly (p = 0.05) different from each other. Error bars are 1 standard deviation from the mean.
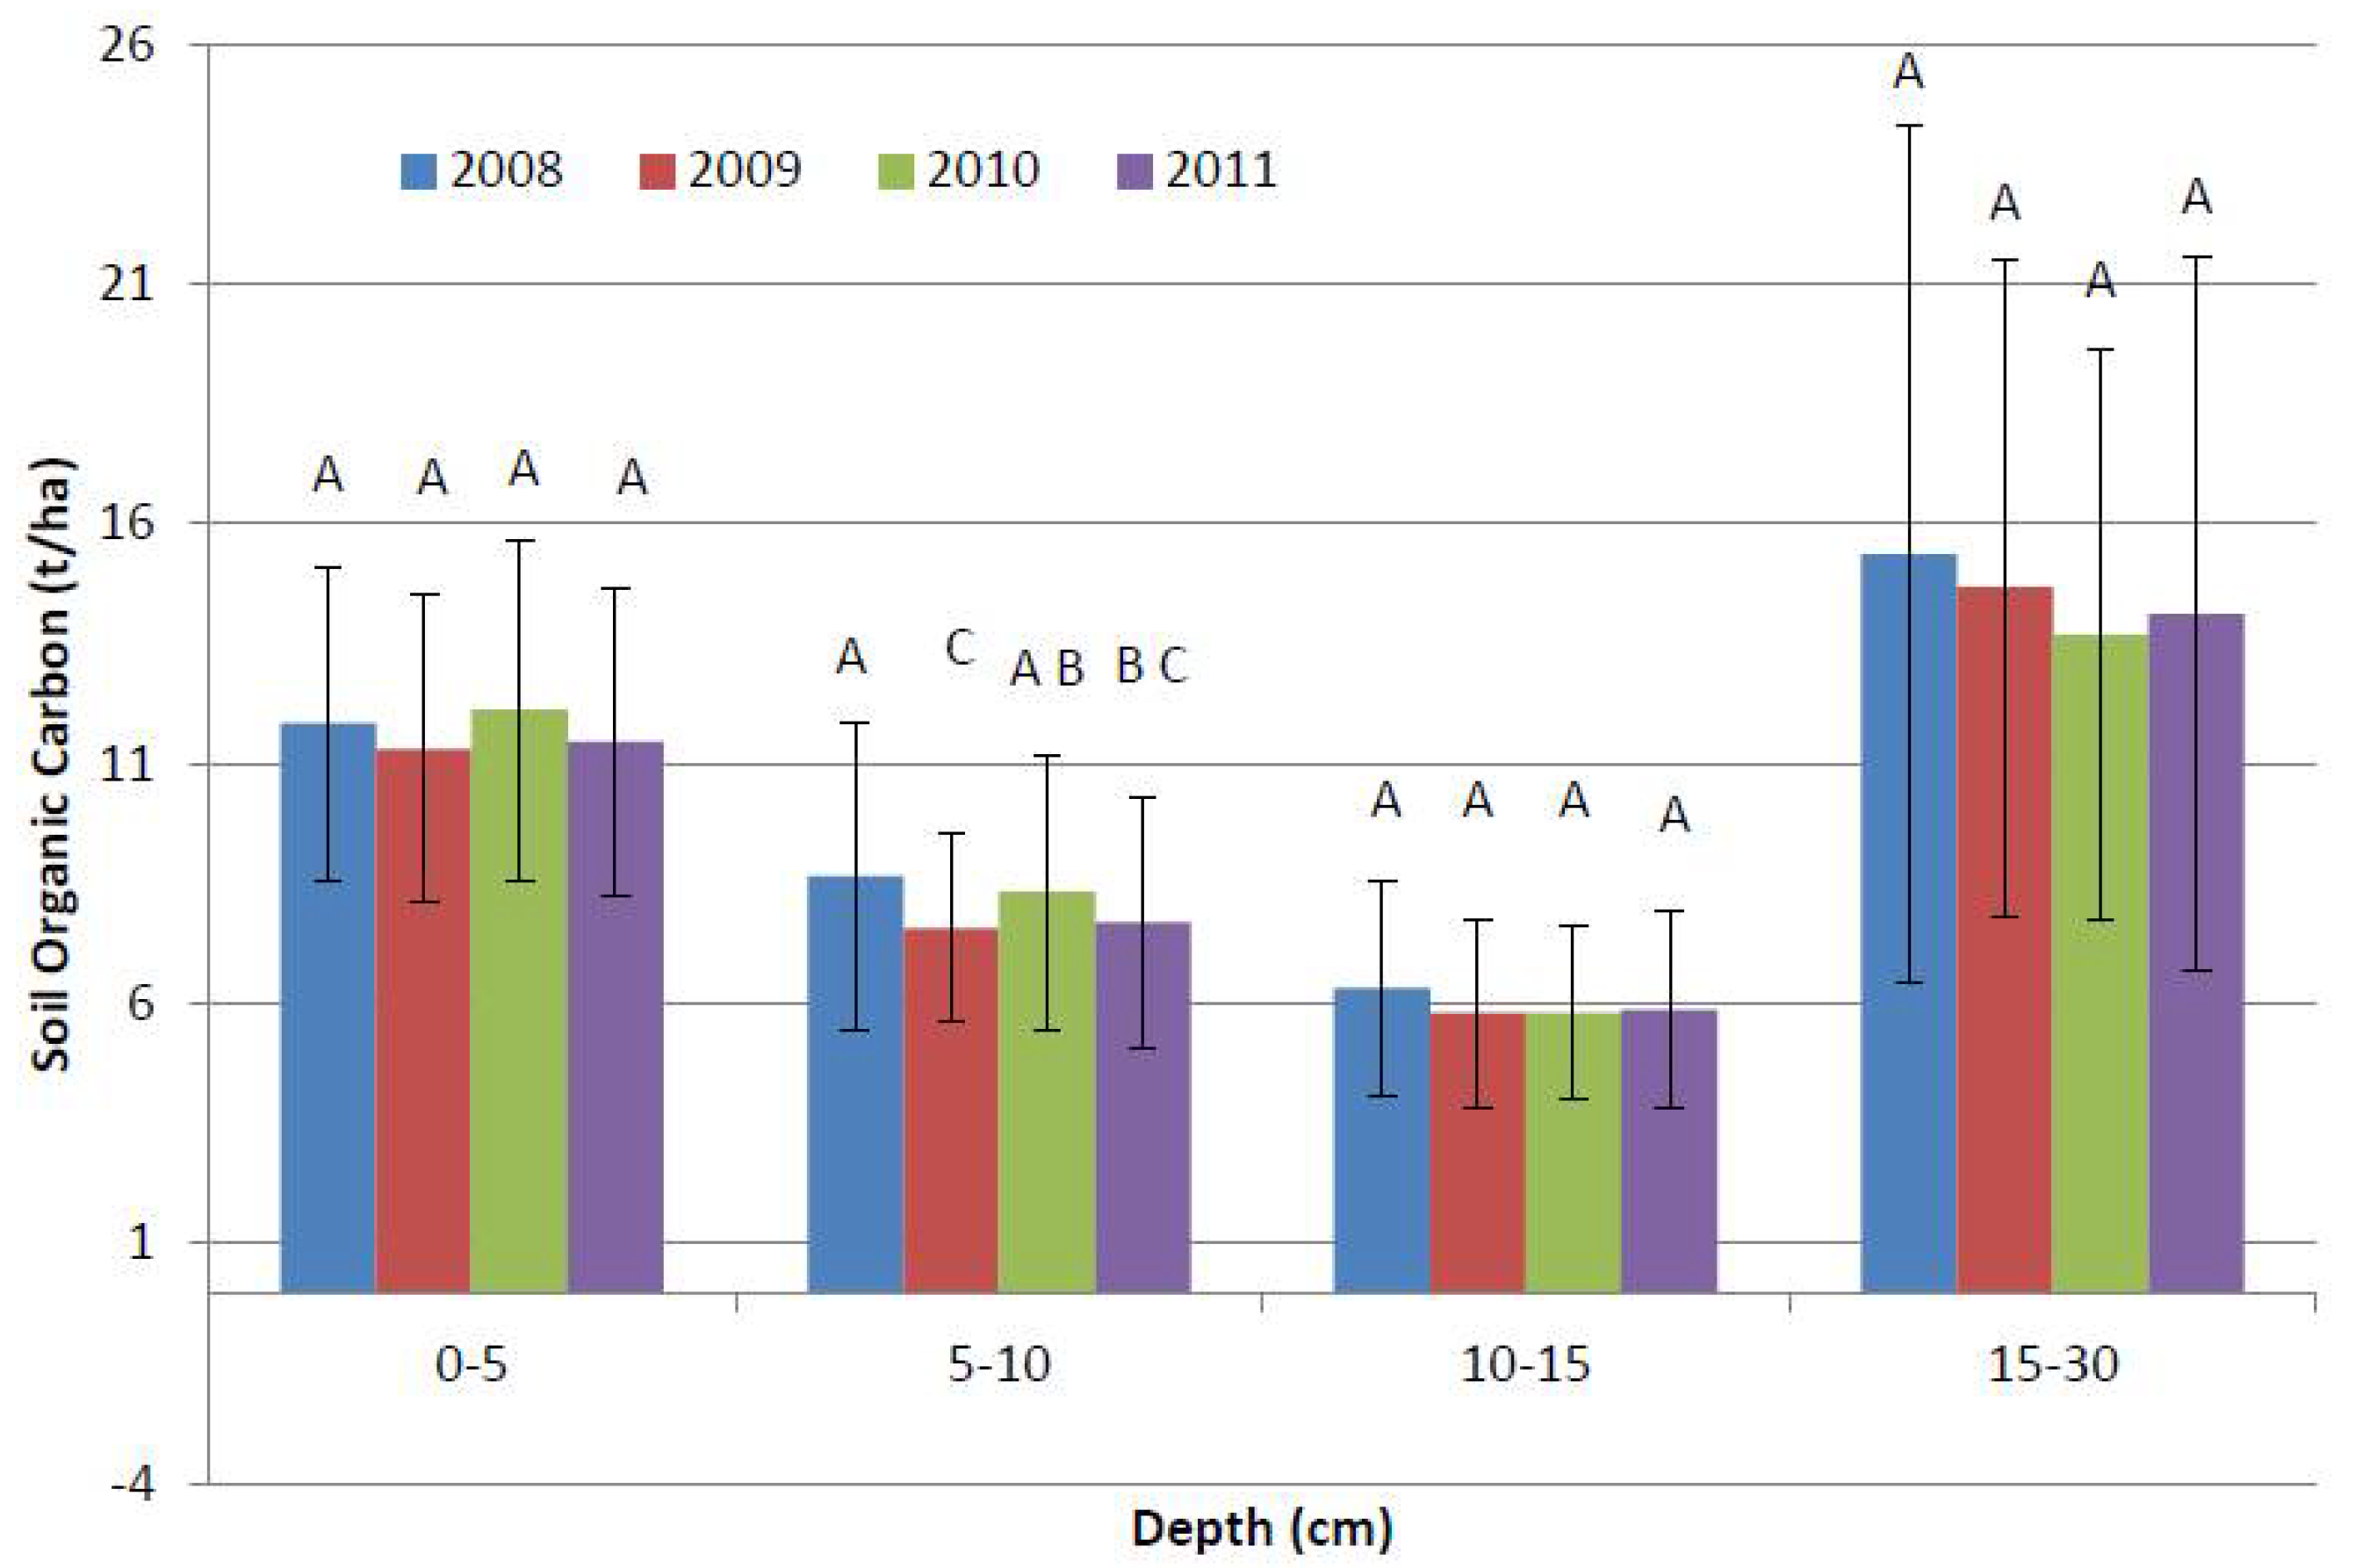
Figure 4.
Annual soil organic carbon amounts for the 30–60, 60–90, and 90–120 cm depths beneath the East Tennessee farms used in this study. Different letters within a depth range are significantly (p = 0.05) different from each other. Error bars are 1 standard deviation from the mean.
Figure 4.
Annual soil organic carbon amounts for the 30–60, 60–90, and 90–120 cm depths beneath the East Tennessee farms used in this study. Different letters within a depth range are significantly (p = 0.05) different from each other. Error bars are 1 standard deviation from the mean.

Figure 5.
Average annual soil organic carbon amounts in the top 0–120 cm profile beneath the East Tennessee farms used in this study. Error bars are 1 standard deviation from the mean.
Figure 5.
Average annual soil organic carbon amounts in the top 0–120 cm profile beneath the East Tennessee farms used in this study. Error bars are 1 standard deviation from the mean.

Figure 6.
Average annual soil organic carbon amounts in the top 120 cm by tillage method used across all East Tennessee farms used in this study. Letter differences are across all categories. Different letters are significantly (p = 0.05) different from each other. Error bars are 1 standard deviation from the mean.

Figure 7.
Average annual soil organic carbon amounts in the top 120 cm by soil taxonomic category across all East Tennessee farms used in this study. Letter differences are across all categories. Different letters are significantly (p = 0.05) different from each other. Error bars are 1 standard deviation from the mean.

Figure 8.
Average annual soil organic carbon contents in the top 120 cm due to previous cropping history across all East Tennessee farms used in this study. Letter differences are across all categories. Different letters are significantly (p = 0. 05) different from each other. Error bars are 1 standard deviation from the mean.

Figure 9.
Regression lines for soil organic carbon by year for the 0–5, 5–10, 10–15, and 15–30 cm depths across all farms used in this analysis.
Figure 9.
Regression lines for soil organic carbon by year for the 0–5, 5–10, 10–15, and 15–30 cm depths across all farms used in this analysis.

Figure 10.
Regression lines for soil organic carbon by year for the 30–60, 60–90, and 90–120 cm depths across all farms used in this analysis.
Figure 10.
Regression lines for soil organic carbon by year for the 30–60, 60–90, and 90–120 cm depths across all farms used in this analysis.


Table 1.
Farm location, size, previous crop, soil taxonomy, and tillage used in analysis.
| Farm | County | Hectares | Previous Crop | Soil Taxonomy | Tillage a |
|---|---|---|---|---|---|
| A | Monroe | 54.7 | Soybeans | Mollisols | NT |
| B | Monroe | 27.9 | Soybeans | Ultisols | NT |
| C | Polk/McMinn/Bradley | 22.2 | Pasture | Ultisols | CT |
| D | McMinn | 31.4 | Soybeans | Inceptisols | CT |
| E | Blount/Loudon | 6.8 | Soybeans | Alfisols | NT |
| F | Rhea | 30.4 | Green beans | Alfisols/Inceptisols | NT |
| G | Loudon | 15.9 | Pasture | Ultisols | NT |
a NT indicates No Tillage practice was used and CT indicates a conventional tillage practice was used to plant switchgrass.
Table 2.
Average annual switchgrass yields.
| Farm | Farm ID Number | 2008 Yield | 2009 Yield | 2010 Yield | 2011 Yield |
|---|---|---|---|---|---|
| t/ha | |||||
| A | 4 | 2.4 | 13.0 | 20.9 | 13.5 |
| B | 5 | 3.8 | 15.9 | 15.4 | 14.7 |
| C | 8 | 5.6 | 13.2 | 9.2 | 11.8 |
| D | 9 | 4.4 | 7.1 | 13.7 | 19.0 |
| E | 12 | 2.1 | 6.7 | 13.5 | 10.9 |
| F | 13 | 1.2 | 10.2 | 15.2 | 16.0 |
| G | 15 | 9.7 | 15.1 | 17.5 | 16.7 |
Table 3.
Change in soil organic carbon (SOC) from 2008 to 2011 by tillage method, previous crop, taxonomic category, and switchgrass yield across all farms used in this study.
Table 3.
Change in soil organic carbon (SOC) from 2008 to 2011 by tillage method, previous crop, taxonomic category, and switchgrass yield across all farms used in this study.
| Variable | Coefficient | t-Value |
|---|---|---|
| INTERCEPT | −2.29 | −0.20 |
| CT | 5.33 | 1.29 |
| Pasture | 26.34 *** | 4.41 |
| Green beans | 24.87 *** | 3.14 |
| Ultisols | −24.85 *** | −3.31 |
| Inceptisols | −42.95 *** | −5.29 |
| Mollisols | −36.78 *** | −3.97 |
| Yield | 2.83 * | 1.94 |
*** Denotes significance at the 99% confidence level. ** Denotes significance at the 95% confidence level. * Denotes significance at the 90% confidence level. (Reference Category: NT, Soybeans, Alfisols).
© 2018 by the authors. Licensee MDPI, Basel, Switzerland. This article is an open access article distributed under the terms and conditions of the Creative Commons Attribution (CC BY) license (http://creativecommons.org/licenses/by/4.0/).
Share and Cite
MDPI and ACS Style
Toliver, D.K.; English, B.C.; Tyler, D.D.; Lee, J.; Menard, R.J.; Walton, J.C. Soil Organic Carbon Changes for Switchgrass Farms in East Tennessee, USA. Soil Syst. 2018, 2, 25. https://doi.org/10.3390/soilsystems2020025
AMA Style
Toliver DK, English BC, Tyler DD, Lee J, Menard RJ, Walton JC. Soil Organic Carbon Changes for Switchgrass Farms in East Tennessee, USA. Soil Systems. 2018; 2(2):25. https://doi.org/10.3390/soilsystems2020025
Chicago/Turabian StyleToliver, Dustin K., Burton C. English, Donald D. Tyler, Jaehoon Lee, R. Jamey Menard, and Jon C. Walton. 2018. "Soil Organic Carbon Changes for Switchgrass Farms in East Tennessee, USA" Soil Systems 2, no. 2: 25. https://doi.org/10.3390/soilsystems2020025